Category: Suburbs

  • A Different Approach to Redevelopment

    As part of a thought experiment I examined one specific neighborhood in a typical small city in Georgia. I’m using this town not because it’s unique, but because it’s absolutely normative. I could do the same analysis on the town where my mom, sisters, and brother live in southern New Jersey and it would be nearly identical. This is Everytown, USA.


    Screen Shot 2016-07-11 at 1.25.14 AMGoogle

    This particular neighborhood is halfway between the historic town center and the newer suburbs. It’s been completely skipped over and neglected in recent decades. What might be possible given the prevailing political and economic reality? The goal here is to improve the quality of life for existing residents, attract new residents, increase employment and economic activity, raise property values, and expand the tax base. The trick is to do all these things while keeping public spending and infrastructure to an absolute minimum and not use subsidies or tax abatements. I’ve rejected all the usual suspects that take too long, cost too much, and often make things worse.

    Screen Shot 2016-07-06 at 2.33.05 AMGoogle

    Screen Shot 2016-07-11 at 1.34.55 AMGoogle

    This neighborhood can’t compete with newer suburbs for folks looking for the usual quiet leafy environment. It shouldn’t even try. Instead it could offer the one thing the new suburbs don’t – a walkable human scaled place with some modicum of vitality and street life. There’s pent up market demand for such places and almost no supply. My first suggestion is for this business district to turn its back on the main road. Call it what it is – a sewer for cars. It serves its purpose and keeps things flowing, but no one wants to sit and watch the material drift by. Ignore it.

    Instead, the parallel secondary street should become the focus of attention. That’s the more appropriate Main Street location. Next, sort out local businesses that are “in” or “out.” The national chains won’t be interested. Let them continue doing what they do. Many of the independent merchants and landlords may not be so inclined either. That’s fine. Work with the folks who are. Baby steps.

    Screen Shot 2016-06-24 at 9.06.53 AMGoogle

    Screen Shot 2016-06-24 at 8.17.07 AM

    Screen Shot 2016-07-11 at 11.29.13 AM

    Here’s an interstitial space formed by the back of a generic aging strip mall and an adjacent one story professional building. It’s a parking lot that doesn’t appear to get much use, but it’s an excellent outdoor room with good proportions that faces a quiet side street. If the city regulators and fire marshal could see their way to make it legal this is an ideal spot for a great gathering space.

    Screen Shot 2016-07-06 at 10.11.40 AM

    Screen Shot 2016-07-06 at 10.14.03 AM

    Screen Shot 2016-07-12 at 1.02.23 AM

    Screen Shot 2016-07-06 at 10.14.15 AM

    Plants, inexpensive outdoor furniture, and simple food and drink (most likely served by existing merchants from the rear of their shops) would be a fast cheap method of making the area worth frequenting. Only the locals know exactly what would provide the best draw. Coffee? Beer? Ice cream? Barbecue? Or maybe this is the perfect spot for outdoor movies served with popcorn and lemonade on weekend nights. Total cost to the city? Some paperwork. Total cost to the property owners? Lawn furniture, plants, and Christmas lights. The “product” on offer is spontaneous conviviality. Effective management is more powerful than pouring concrete and laying asphalt.

    Screen Shot 2016-07-11 at 11.29.25 AM

    Screen Shot 2016-06-24 at 8.38.04 AM

    Screen Shot 2016-06-24 at 8.51.49 AM

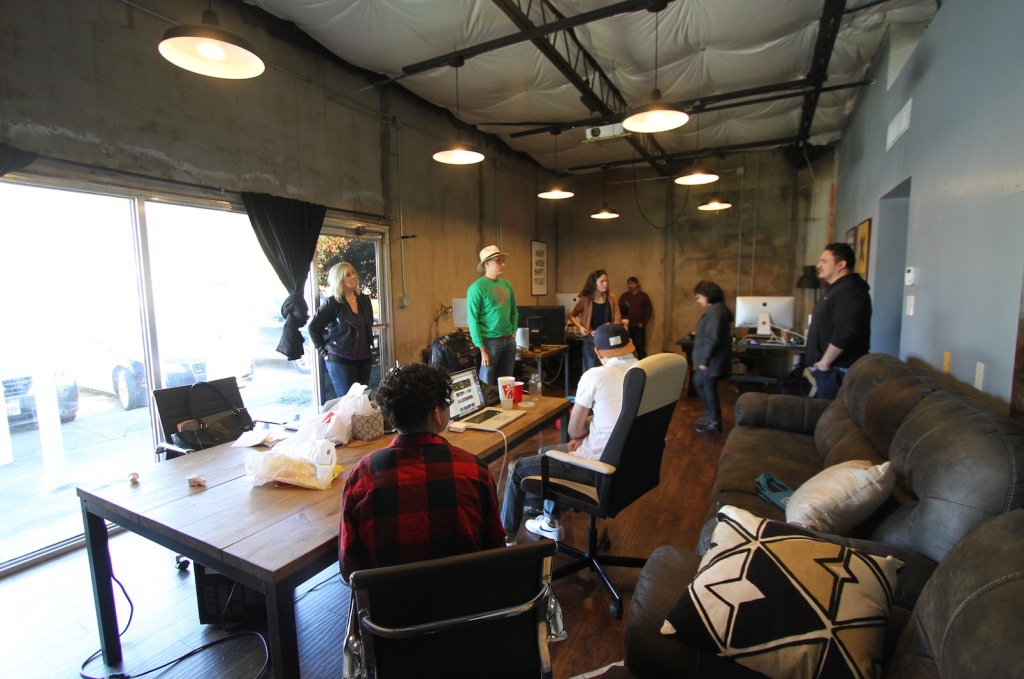
    The professional building appears to be vacant or less productive than it could be. The property owner may be happy with the current arrangement, but if not this could be a fantastic live/work space. There are a lot of people who find this sort of place appealing since it’s a blank slate and extremely flexible. It’s no doubt illegal to live in a commercial space due to zoning regulations. But those rules could be changed or quietly ignored by the authorities. Who’s to say what happens behind those brick walls? Live/work is the perfect in-between use for a building that sits halfway between a busy road and a calm residential street.

    Screen Shot 2016-07-06 at 2.49.45 AMGoogle

    Screen Shot 2016-07-11 at 11.30.17 AM

    Screen Shot 2016-06-25 at 8.19.44 AM

    Screen Shot 2016-06-25 at 8.20.30 AM

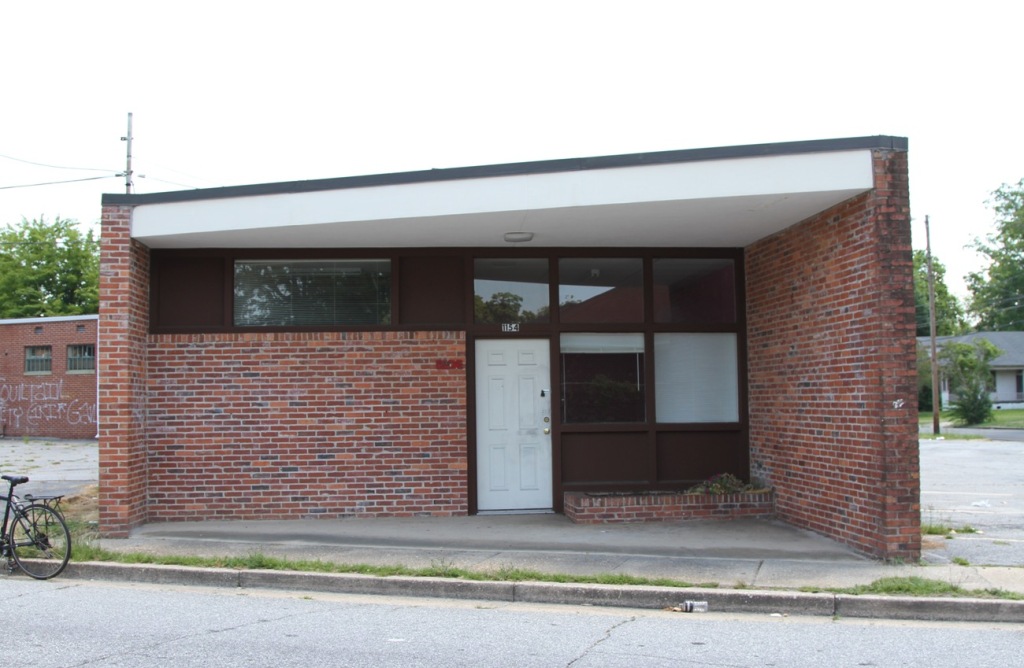
    All the ice cream parlors, outdoor cafes, and beer gardens in the world won’t help if there aren’t enough people nearby to fill the seats. This building appears to be some kind of Class C office building. I walked around in the middle of the afternoon on a weekday and didn’t see a soul. I didn’t even hear the hum of an air conditioner. It may be a thriving hub of business activity for all I know, but it looks like a storage facility for old paperwork. I could see someone from a local neighborhood improvement organization brokering a deal between the landlord and the local orchestra, film and video school, or art museum to convert this place into studio space.

    Screen Shot 2016-03-07 at 5.05.26 PM

    Screen Shot 2016-03-07 at 5.03.25 PM

    Screen Shot 2016-03-03 at 3.40.33 PM

    Actually, I’d love to see it as residential space for such people. It’s probably hard to practice the French horn in a garden apartment complex without people complaining. If the building were populated with a self selecting group of folks with an established affinity it might be a value added proposition.

    If you’re horrified by the idea of living in a place like this… Great! You’ve self selected out. Perfect. Now move over and make room for the people who love it. The Mad Men era architecture could be celebrated just as it is. Howard Johnson’s meets Denny’s with a hint of 1960’s car wash. A little turquoise and orange paint and some Malibu lighting would work wonders.

    Screen Shot 2016-07-11 at 1.16.49 AM

    Screen Shot 2016-07-11 at 1.17.18 AM

    Screen Shot 2016-07-11 at 1.13.23 AM

    Screen Shot 2016-06-25 at 8.06.20 AM

    Screen Shot 2016-06-25 at 8.07.23 AM

    Screen Shot 2016-07-11 at 1.18.56 AM

    There’s an abundance of commercial buildings that are simply not performing as intended. There’s no market demand for this kind of space in this location – and it’s been this way for a very long time.

    Screen Shot 2016-01-31 at 2.34.04 AM

    Screen Shot 2016-01-31 at 2.34.57 AM

    Screen Shot 2016-01-31 at 2.34.36 AM

    Why not make these living spaces? Again, I need to belabor the point. This isn’t about attracting suburban families. Instead, these places are perfect for a subset of the population that actually likes cheap ugly spaces. Cheap and ugly are the primary amenities for some people. They value other things and enjoy the freedom that comes with such accommodations.

    Screen Shot 2016-07-08 at 4.27.16 PM

    Screen Shot 2016-07-08 at 5.20.08 PM

    Screen Shot 2016-07-08 at 1.27.57 PM

    This is the secondary street that’s more suited to humans than the primary road full of vehicular traffic. It’s lifeless at the moment, but it could be transformed on the cheap with weekly pop up events organized around food trucks and a farmers market.

    Screen Shot 2016-07-12 at 12.24.08 AM

    Screen Shot 2016-07-12 at 12.24.33 AM

    Screen Shot 2016-07-12 at 12.23.53 AM

    Screen Shot 2016-07-12 at 12.22.40 AM

    Screen Shot 2016-07-12 at 12.27.16 AM

    Screen Shot 2016-07-12 at 12.26.45 AM

    Over time the empty parking lots and food trucks could mature with brick and mortar infill development that make the arrangement permanent. The food trucks are incubators for small scale entrepreneurs on a tight budget. You need a million dollars to open a franchise doughnut shop. A food truck comes at a much lower price point.

    Screen Shot 2016-07-03 at 2.57.15 PMGoogle

    Screen Shot 2016-07-11 at 5.42.57 PMGoogle

    Screen Shot 2016-07-02 at 4.31.19 AM

    Screen Shot 2016-06-25 at 8.14.03 AM

    Screen Shot 2016-07-03 at 5.50.29 PM

    Screen Shot 2016-07-03 at 5.51.16 PM

    Screen Shot 2016-07-03 at 5.51.35 PM

    Here’s a dead strip mall on the other side of the neighborhood that’s facing another busy commuter road. Again, the sweet spot is in the back that faces the residential side streets. Both the shops and the homes have seen better days. What can be done with this space?

    Screen Shot 2016-03-02 at 1.02.53 PM

    Screen Shot 2016-06-28 at 12.41.51 AM

    Screen Shot 2016-06-28 at 12.41.30 AM

    Screen Shot 2016-07-11 at 2.12.00 PM

    Screen Shot 2016-07-11 at 2.11.46 PM

    Screen Shot 2016-03-02 at 1.06.22 PM

    Screen Shot 2016-03-02 at 1.05.07 PM

    Screen Shot 2016-03-02 at 1.04.08 PM

    Screen Shot 2016-03-02 at 1.06.48 PM

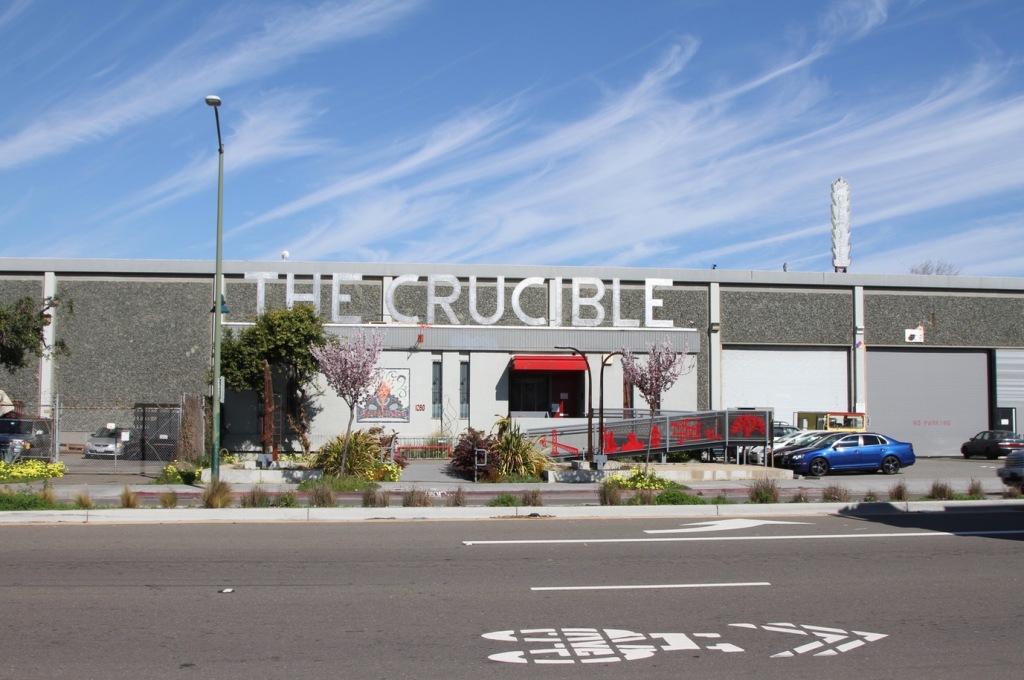
    This is an example of a non profit organization that specializes in the often neglected industrial arts. Welding, glass blowing, carpentry, neon arts, enameling, stone cutting, fashion, ceramics, and so on. Thousands of people – particularly young people – are trained in useful skills each year. People rent space and pay a modest tuition for instruction. This isn’t a government facility. It was established and continues to be maintained by locals who are passionate about the place. This is the kind of thing that could draw in precisely the variety of people who might look favorably on living in one of the fantastically affordable nearby homes. And they’d actually have the skills to fix them up.

    Screen Shot 2016-06-25 at 8.13.39 AM

    I’m well aware of the arguments against this sort of thing. It will attract the wrong element. People will cook meth in spaces like that. People will have wild parties all night long and disturb the peace. This is just a bunch of Hipster nonsense.We can’t have people drinking beer outdoors near a church or school. I totally understand. From my perspective there are ways of managing those concerns, but I personally won’t invest ten minutes of my time attempting to change anyone’s opinion. Instead I’ll wait another ten or fifteen years for the current decline to continue. This place may not be ripe for reinvention yet. The local culture may not be receptive. Honestly, the neighborhood may not be miserable enough just yet. Let’s wait until these places start to burn down one by one. Or let them be bulldozed to make room for more parking or a heavily subsidized garden apartment complex next to the newly widened commuter road. That’s absolutely an option.

    John Sanphillippo lives in San Francisco and blogs about urbanism, adaptation, and resilience at granolashotgun.com. He’s a member of the Congress for New Urbanism, films videos for faircompanies.com, and is a regular contributor to Strongtowns.org. He earns his living by buying, renovating, and renting undervalued properties in places that have good long term prospects. He is a graduate of Rutgers University.

  • The Shorter Commutes in American Suburbs and Exurbs

    An examination of American Community Survey (ACS) data in the major metropolitan areas of the United States shows that suburbs and exurbs have the shortest one-way work trip travel times for the largest number of people. The analysis covers metropolitan areas with more than 1,000,000 population in 2012, from the 2010-2014 ACS (2012 average data) using the City Sector Model.

    The City Sector Model

    The City Sector Model classifies small areas (zip codes) of major metropolitan areas by their urban function (lifestyle). The City Sector Model includes five sectors (Figure 1). The first two are labeled as “urban core,” (Urban Core: CBD and Urban Core: Ring) replicating the urban densities and travel patterns of pre-World War II US cities, although these likely fall short of densities and travel behavior changes sought by contemporary urban planning (such as Plan Bay Area). There are two suburban sectors, the Earlier Suburbs and Later Suburbs. The fifth sector is the Exurbs, which is outside the built-up urban area. The principle purpose of the City Sector Model is to categorize metropolitan neighborhoods based on their intensity of urbanization, regardless of whether they are located within or outside the boundaries of the historical core municipality (Note 1).

    One Way Commute Times by Urban Sector

    The commuting data excludes employees who work at home, whose commute times would be zero.

    The shortest one-way commute times are experienced by residents of the Earlier Suburbs, with a 26.6 minute travel time. This is nearly equalled for residents of the central business districts (Urban Core: CBD), with an average commute of 26.7 minutes. Commuters living in the Later Suburbs had a somewhat longer commute, at 28.0 minutes, while commuters living in the Exurbs had an average one-way commute of 29.5 minutes. The longest commute times were experienced by residents of the Urban Core: Ring (32.5 minutes), which is the part of the urban core that excludes the central business district, (Figure 2) and is characterized by high densities and lower levels of automobile use than in the suburbs and exurbs.

    The functional city sectors with the shortest commutes had more jobs than resident workers. The Earlier Suburbs possess 1.08 jobs for every resident worker (Note 2). The ratio was much higher in the Urban Core: CBD, where there were nearly 5.99 jobs for every resident worker. Such an imbalance could not be replicated throughout a metropolitan area, because by definition, a labor market has a ratio of jobs to resident workers of approximately 1.00. To replicate the national CBD ratio throughout the metropolitan area would require, for example, that the New York metropolitan area have  54 million jobs for its 9 million workers.   

    Not surprisingly, with such a surplus jobs relative to workers, the Urban Core: CBD, the chances of finding suitable employment nearby is far greater. However, this advantage can, by definition, be available only to a very few, as is indicated by the fact that the Urban Core: CBD’s are home to only 1.5 percent of the resident workers in the major metropolitan areas. In the broader context of the urban core (including both the CBD and the Ring), this advantage is offset and average travel times are greater (below).

    In the Later Suburbs, there were 0.90 jobs per resident worker, which matches that sector’s ranking in work trip travel time (third). The  ring around the urban core (Urban Core: Ring) , had the longest average work trip travel time. The Exurbs had the lowest ratio of jobs to resident workers, at 0.71, yet had an average travel time that was shorter than that of the Urban Core: Ring (Figure 3).

    Pre-World War II and Post-War Urban Form

    The two combined urban core sectors are defined in the City Sector Model to replicate what remains of the pre-World War II city that was characterized by far higher densities and less reliance on automobile transportation, as opposed to the suburban and exurban sectors that have dominated urban growth for seven decades. If the two urban core sectors are combined (Urban Core: CBD and Urban Core: Ring), the number of jobs per resident worker is 1.28. This healthy ratio, however, is not sufficient to preserve any travel time advantage for residents of the combined urban core. In the combined urban core sectors, the average one-way travel time of 31.9 minutes, well above each of the other three functional sectors (Figures 4 and 5). The Urban Core: Ring has nearly nine times as many resident workers as the Urban Core: CBD.

    The Pre-War urban form has considerably higher population densities than those of the post-war urban form. For example, the Urban Core: CBD has a population density exceeding 23,000 per square mile (9,000 per square kilometer), more than 80 percent of the New York City population density level. The Urban Core: Ring has a population density exceeding 11,000 per square mile. The combined area population density of the two Urban Core sectors is 11,500 per square mile, or 4,400 per square kilometer (Figure 6).

    The two Urban Core sectors largely rely on commuting modes currently favored by urban planning policy, transit, cycling and walking. In contrast, the suburban and exurban sectors rely on commuting modes discouraged by urban planning policy, automobiles and car and van pools (Figure 7).

    The combined urban core sectors have more than four times the density of the Earlier Suburbs and nearly nine times the density of the Later Suburbs. With these much higher densities and their reliance on the favored transport strategies, it might be expected that they would enjoy the best commute times. However, as noted above, when the two urban core sectors are combined, their average travel time is longer than the suburban and exurban sectors. This is despite the far lower densities of the two suburban sectors and the often world densities of the exurban sector.

    The Key: Lower Densities & Job Dispersion

    These results are likely to be surprising to many in the press as well as planners who often equate residential distance from central business districts as resulting in longer commutes. The reality, however, is that central business districts account for only 8 percent of employment in major US metropolitan areas, and reach the highest at 22 percent in New York, 50 percent above second place San Francisco (14.4 percent) and nearly 10 times that of Los Angeles (2.4 percent).

    Generally speaking, employment is dispersed throughout the metropolitan area. When combined with the generally lower density urbanization within metropolitan areas, the result is shorter commutes for residents  in the suburbs and exurbs. As it turns out the data shows that higher employment densities in the urban core are associated with longer, not shorter commutes, as is commonly assumed.

    Note 1: In some cases the functional urban core extends beyond the boundaries of the historical core municipality (such as in New York and Boston). In other cases, there is virtually no functional urban core (such as in San Jose or Phoenix). Functional urban cores accounted for 14.7 percent of the major metropolitan area population in 2012. By comparison, the jurisdictional urban cores (historical core municipalities) had 26.6 percent of the major metropolitan population, many of which have large tracts of functional suburban development.

    Note 2: Estimated by dividing the percentage of jobs in each sector by the percentage of resident workers. Working at home is excluded.

    Wendell Cox is principal of Demographia, an international pubilc policy and demographics firm. He is a Senior Fellow of the Center for Opportunity Urbanism (US), Senior Fellow for Housing Affordability and Municipal Policy for the Frontier Centre for Public Policy (Canada), and a member of the Board of Advisors of the Center for Demographics and Policy at Chapman University (California). He is co-author of the "Demographia International Housing Affordability Survey" and author of "Demographia World Urban Areas" and "War on the Dream: How Anti-Sprawl Policy Threatens the Quality of Life." He was appointed to three terms on the Los Angeles County Transportation Commission, where he served with the leading city and county leadership as the only non-elected member. He served as a visiting professor at the Conservatoire National des Arts et Metiers, a national university in Paris.

  • Adding Space to Suburbia

    Space has value. Even the mere perception of space has value. As land becomes more scarce, space becomes more valuable, and has a direct impact on housing costs and a developer’s profit (or loss). Both developers and the New Urbanists who preach that dense cities are good places know this, even as they pressure town councils and planning commissions to authorize reduced lot sizes. Where they have succeeded, the resulting compressed lots sacrifice quality organic space — green space — to the point of oblivion.

    Less than a half century ago, Phoenix was a sleepy retirement town with vast openness and desert character. A few years ago, my wife Adrienne and I visited the city. Today’s Phoenix, like Las Vegas, Albuquerque, etc., is a blanket of rooftop and pavement with a few strip malls spattered about. We met with developers to demonstrate a new way to design that increases lot size (value), while reducing infrastructure (costs). Without exception, developers responded: “People move to Phoenix to have a smaller lot. They do not want space.” So we visited the new, compressed developments, and asked residents about their new homes. Without exception, all the residents we interviewed loved their new places, but wished they had more space, especially between themselves and their neighbors.

    Simply put, a larger lot with more space is likely to be more valuable to residents, but builders are interested more in selling ‘product’ — homes. The more, the better.

    A buyer will pay more for a large home than a small one; for a large lot than a small one. They will pay a premium for a home with a view of space over that what they would pay for a view into a neighbor’s adjacent yard.

    Space has value, and value translates to an increased tax base.

    The social engineer will argue that it’s OK to sacrifice space because there will be a small park a five or ten minute ‘walk’ away. Reality check: A very small percentage of residents will actually walk to that park, but the homes that can view that space will be priced at a premium, costing well above the homes in a sardine-like placement far from the park. In denser suburbs or new urban communities, the haves will enjoy space; the have-nots, not so much.

    If space does not have value, as the proponents of dense neighborhoods claim, then why is it so heavily featured in home builders’ sales and marketing materials? When a home builder uses a marketing photograph, it is taken at a wide angle to make the lot appear larger than it actually is. When a builder uses a rendering on their web site or sales materials, it’s never shown with adjacent homes compressing the visual space.

    How can we feed the hunger for space? The conventional design methods that have been used since the dawn of civilization can’t work. To achieve increased space while preserving a higher density standard, the housing industry needs to take an approach that incorporates innovation and attractive value.

    That begins with the recognition that space is something that you feel, even though it is limited by non-transparent objects that form a physical barrier in our three dimensional world. When we are inside a structure, it’s the walls around us in reference to the flat floor; when we are outside, it’s the distance we perceive between homes. We might estimate a distance as longer or shorter, depending on whether the terrain was hilly or flat.

    Does five acres within a neighborhood park constitute open space? It sounds like it will, but if it’s along steep slopes or thickly wooded land with natural underbrush it won’t feel open. If it’s a park that residents must stroll to from their homes, the space has less value than if it can be viewed through their windows.

    As for conventional interior space, the perimeter of a home is often determined by the lot size, depending on local zoning. In the case of a Phoenix lot that is 50 feet wide by 100 feet deep, with a 5 foot side yard setback and a 20 foot front and rear yard setback, the home would be allowed to be 40 feet wide and 60 feet deep. Assuming a 20 foot by 20 foot garage and 6 inch exterior wall, that leaves 1,880 square feet of living space within the home.

    But— that only would result if the home were expanded to the largest possible perimeter. Included in that perimeter would be 145 feet of side yard, the entry door, and two car spaces in the garage, leaving only 55 feet for possible window locations that would overlook the front and rear yards. Within that footprint, the architect must lay out the bedrooms, closets, bathrooms, kitchen, living and family rooms, and any other living space.

    A great architect will make the resident ‘feel’ the most of the available space. A bad designer will make the home feel smaller than it actually is. Neither the good nor the bad architect (especially when the project is created by production builders) will consider the views from within the home, because, simply put, with New Urban and suburban cookie cutter subdividing, there are none. In most southern cities the rear view overlooks a wall or fence 20 feet away, and the next house structure is at a 40 foot distance. The front view (if any windows exist at all from front-placed living space) will be the garage door across the street, 90 feet away, along with driveways, the street, and parked cars. This is why modern home living spaces are rear, not front, oriented. Not much to look at. That is, unless you pay more – much more – to be in a neighborhood with larger lots.

    Conventional exterior space is also dictated by city regulations. Local zoning ordinances determine the allowed width and depth, to limit density with the promise of more space and a larger home footprint. In conventionally subdivided developments, side yard space is not a quality area, since the sides of homes typically are void of windows, and even if there were views, those windows would look directly into the neighboring wall just 10 to 20 feet in the distance.

    The image below shows two streets:


    The left one has a 90 foot wide lot; the right one has a 60’ foot wide lot. Both use the same 25 foot front yard setback. From a ‘human’ perspective, looking down the street, both have the same 100 foot wide swath of open space, yet the smaller lot achieves 33 percent more homes with the exact same infrastructure (street) expense. Because the street covers the same land area in both cases, the actual density gain on the smaller lot would be about 25 percent, while providing the very same ‘feel’ of space as the larger lot. Assuming that the intention of suburban zoning is to set both space and value, the typical ordinance does a terrible job on providing extra actual perceived space.

    Considering that space has real value, educators at colleges, and at design conferences, and all teachers of architecture and of urban and/or suburban design, should be concentrating more on how interior and exterior spaces can merge in more meaningful ways than on the trim of a front porch. Craftsman trim on a porch railing may add a wee bit of value, but living spaces coordinated with views of open space add a huge increase in value. A park may add overall neighborhood value, but living on a street that has park-like space adds tremendous value.

    Cookie-cutter Computer Aided Drafting (CAD) plans generated specifically to build to the regulatory minimums will never satisfy the hunger for space. These two videos demonstrate my solutions. Along with other innovative approaches that merge planning and architecture, they show the paths we need to follow if we are to achieve sustainable housing, and sustainable zoning.

    Rick Harrison is President of Rick Harrison Site Design Studio and Neighborhood Innovations, LLC. He is author of Prefurbia: Reinventing The Suburbs From Disdainable To Sustainable and creator of LandMentor. His websites are rhsdplanning.com and LandMentor.com.

    Flickr photo by Joan of cat in a suburban yard

  • Urban Future: The Revolt Against Central Planning

    In Milton Keynes, perhaps the most radical of Britain’s post-Second World War “New Towns,” the battle over Brexit and the culture war that it represents is raging hard. There, the consequences of EU immigration policy, of planning instituted by national authority, and of the grassroots yearning to preserve local character have clashed together to shape a platform that may set a precedent for whether central planners or local residents will determine the urban future.

    Milton Keynes is unusual for planned cities. Founded in 1967 and having matured in the last few decades, it defies virtually every tenet of contemporary planning orthodoxy. In its day it was a product of Britain’s national planners; despite that, today Milton Keynes drives the country’s national planners crazy. Instead of a mixed-use, dense, transit-oriented bastion of urbanism – the predictable and commonly reiterated goals of many British town planning leaders today – Milton Keynes is exactly the opposite, intentionally.

    A modernist experiment, Milton Keynes was planned to be low-density. It was also planned to be auto-oriented, and suburban. Its houses are large, its buildings do not front streets, and its transportation modes are separated by grade: that is, they are at different heights, with different means of transport often moving at different speeds. This is the antithesis of the now-favored idea of “complete” streets. The town’s downtown shopping enclave is an inward-facing mall – the largest in Britain – with downtown as a whole designed as a business and commercial center rather than a mixed-use playground. Mixed-use development is clustered in the city’s low-density neighborhoods and villages, all on a grid, rather than scattered with the UK’s more favored randomness.

    Milton Keynes was designed to be livable and functional, family-friendly, job-friendly and conducive to convenient mobility. The daily grind, by design, was to bear a closer resemblance to a rural experience than to an urban one. Original advertisements promoted a healthy, carefree lifestyle sheathed in nature, away from the nuisances of the big city. Even the logic of its location, equidistant from Britain’s other large cities, sought convenience over traditional planning rationales.

    To those with a one-track view of what a city should be, Milton Keynes is unrecognizable. To these people, the city is bland, sterile, and without the day-to-day vibrancy that defines cities. In many planning texts it has been written off as a failure, and to many residents of Britain, Milton Keynes is not a preferred destination.

    But in many of the most important metrics that define urban success, Milton Keynes shines. It has virtually no traffic, it attracts lots of families, and it has the highest job growth in the country. Its population has swelled over 20 percent since 2001, over twice the national average, to 255,000 , and its residents ardently defend it. It has built out nearly identically to the original vision, with its millions of trees and lush, anti-urban character earning it the affectionate moniker “Urban Eden”.

    Today, however, Milton Keynes faces ever-mounting threats to the integrity of its original character. Thanks to the consequences of EU immigration policy, which spurred population growth in the UK to a level that exceeded housing construction to the tune of 70,000 units a year, or roughly 50 percent, cities like Milton Keynes are under fire to take up their “fair share” of the difference. Although Milton Keynes was originally developed independently through a long-range loan to the Milton Keynes Development Corporation, the nation’s housing issue led Britain’s deputy prime minister to effectively lift the city’s self-rule in 2004 in a sweeping authoritarian central takeover.

    That move transferred planning authority from local government to a national regeneration authority. The authority promptly set a housing quota for the city based on national targets, and began the task of systematically increasing density, narrowing roads, reducing unit sizes, instilling a transit-oriented ethos, discontinuing the grid, and concocting plans to build new development that directly fronted the street, all at odds with the city’s original masterplan.

    The new ideas reflect tenets frequently promoted by the Royal Town Planning Institute, Britain’s central planning body. The moves reflect what has become a familiar narrative of planner as a high-minded savior and opposition as selfish NIMBY (“not in my backyard”) residents, who lack regard for the broader picture. That Milton Keynes’ defenders are arguing on behalf of a thoughtful vision – one shaped decades ago and misaligned with contemporary planners’ aspirations – is a complicating wrinkle. In contrast to the narrative that the suburbs were an unfortunate accident that have destroyed communities, Milton Keynes’ defenders are trying to save a city that was planned to be suburban and that is successful today, and are defending it by citing affection for its character and sense of community.

    Because of Milton Keynes’ unusual design, traditional NIMBY dynamics have been inverted. In a rare twist on the oft-repeated Jane Jacobs narrative of residents against the planners, Milton Keynes’ defenders are fighting for the planned suburban character of their town: a primary complaint is that the central planners promoting density and mixed-use development lack creativity or an understanding of the bigger picture vision that shapes their sense of place, even though the tactics the planners are employing are often advocated using the same argument in reverse. Far from being ad-hoc selfish obstructionists, the Milton Keynes defenders are well-organized and thoughtful: a group called “Urban Eden” offers a well-composed six-point vision as the baseline for alternatives to the central plans.

    Milton Keynes belies the narrative of a lack of intentionality as a disqualifier for suburbia. More importantly, its future will tell us much about whether creativity and self-determination can continue to exist in Britain at the local scale, and whether the forces that induced Brexit can topple an internal bureaucracy, in addition to an external one.

    While local freedoms may ultimately help cities like Milton Keynes preserve their unique character, additional bureaucracy in the UK must be lifted to solve the larger national issue of housing affordability. In particular, Britain should free the private land development market, which has been effectively nationalized since 1947. Britain’s self-imposed shortage of developable land is the primary reason British housing production is well under half what it was when Milton Keyes was originally conceived. In an ironic twist, if it maintains such strict centralized planning strategies, Britain may continue to choke the character of its cities over the issue of housing production, wielding a national-scale bully pulpit to try to solve a crisis that could perhaps best be solved by eliminating the nationalization of property development altogether.

    Brexit offers a lesson to planners world-wide, with Milton Keynes a creative case study of an alternative to the hegemony of contemporary urban planning. While many planners loathe Milton Keynes, many residents like it, and its demonstrable successes suggest it should be a worthy case study. So many planning bodies are dominated by a singular ideology. Instead, a new era of open-mindedness to local creativity should be embraced… lest Britain and the world rise up to circumvent the planners behind a movement with a nickname as catchy as Brexit.

    Roger Weber is a city planner specializing in global urban and industrial strategy, urban design, zoning, and real estate. He holds a Master’s degree from the Harvard Graduate School of Design. Research interests include fiscal policy, demographics, architecture, housing, and land use.

    Flickr photo by Sarah Joy: Double Rainbow, Milton Keynes

  • What Happens When There’s Nobody Left to Move to the City?

    Following up on the Pew study that found many states will face declining work age populations in the future, I want to highlight a recent Atlantic article called “The Graying of Rural America.” It’s a profile of the small Oregon town of Fossil, which is slowly dying as the young people leave and a rump population of older people – median age 56 – begin to pass on.

    Like the Pew study, this one has implications that weren’t fully traced out.

    There’s a lot of urban triumphalism these days, as cities crow about Millennials wanting to live downtown and such.

    But the dirty little secret is that a lot of these places have been growing their youth populations by hoovering up the children of their hinterlands. To the extent that urban population growth is dependent on intrastate migration in these states with declining working age populations, at some point there are just plain going to be a lot fewer youngster to move to the big city. That will start to crimp urban population dynamics.

    Indianapolis is a poster-child for this.  About 95% of the metro area’s net migration has come from elsewhere in the state of Indiana since 2000, according to IRS tax return data.

    Looking at the future, about half of the states counties (49 out of 92) are projected to actually lose population by 2050. Here’s the map from the Indiana Business Research Center.


    Projected population change in Indiana counties, 2010-2050. Source: Indiana Business Research Center

    The entire state is only projected to add 100,000 15-44 year olds by 2050. Even if 100% of them, or even more than 100% of them, are in Indianapolis, this still implies a fairly modest growth rate.

    Given the projected demographics of its migration shed, we should expect Indianapolis to start seeing a falloff in migration. In fact, we are already seeing it. Indy was previously the Midwest champ in net domestic in-migration, but recent Census Bureau estimates show a fall-off.

    Here’s what the IRS migration data says about net migration into Indy metro from the rest of the state.

    Net migration into metro Indianapolis from the rest of the state, 1991-2014. Source: Aaron Renn analysis of IRS county to county migration data

    There was a spike up starting around 1997, the dawn of the dotcom era. This more or less corresponded with the rise of the city talk. (Richard Florida’s Rise of the Creative Class came out in 2002).

    During the 2000s, Indianapolis was the Midwest growth champ, and killed it on net domestic migration. This graph helps explain why.

    But starting around 2010, inbound migration from the rest of the state has fallen off. I don’t want to claim this is entirely demographic related. Migration declined nationally during the Great Recession. And there were some methodology tweaks in this data during that time. But we can see already in the numbers what happens to metro growth if migration from the rest of the state slows down.

    At some point, the decline of rural and small manufacturing counties is going to have to show up in the migration numbers to cities like Indy. Other cities that draw primarily from a national base – like Nashville or Dallas – will be less affected.

    But cities that are dependent on a regional migration shed need to start doing the math on how the decline of their hinterlands will affect them.

    The collapse of rural and small manufacturing economies may have been good for cities in the short term, but those cities might discover down the road that they ended up eating their seed corn.

    Aaron M. Renn is a senior fellow at the Manhattan Institute, a contributing editor of City Journal, and an economic development columnist for Governing magazine. He focuses on ways to help America’s cities thrive in an ever more complex, competitive, globalized, and diverse twenty-first century. During Renn’s 15-year career in management and technology consulting, he was a partner at Accenture and held several technology strategy roles and directed multimillion-dollar global technology implementations. He has contributed to The Guardian, Forbes.com, and numerous other publications. Renn holds a B.S. from Indiana University, where he coauthored an early social-networking platform in 1991.

  • Suburbs (Continue to) Dominate Jobs and Job Growth

    Data released by the federal government last week provided additional evidence that the suburbs continue to dominate metropolitan area population growth and that the biggest cities are capturing less of the growth than they did at the beginning of the decade. The new 2015 municipality population estimates from the Census Bureau indicated that virtually all of the 15 fastest growing municipalities with more than 50,000 residents were suburbs, and five were in Texas (See Census Bureau poster, Figure 1). Further, in the major metropolitan areas (more than 1,000,000 population), nearly 75 percent of the population growth was in outside the historical core municipalities (the suburbs as defined by municipal jurisdiction).

    But that’s only half of the story. The suburbs and exurbs also continue to dominate employment and employment growth, according to the annual County Business Patterns data. County Business Patterns is a particularly effective measure of genuine job location preferences (both employers and employees), since it largely provides data for private employment.

    Analysis of the data using the City Sector Model indicates that both over the longer and shorter term, the outer reaches of US metropolitan have been more than holding their own in employment growth.

    The City Sector Model

    The City Sector Model classifies small areas (zip codes) of major metropolitan areas by their urban function (lifestyle). The City Sector Model includes five sectors (Figure 2). The first two are labelled as “urban core,” replicating the urban densities and travel patterns of pre-World War II US cities, although these likely fall short of densities and travel behavior changes sought by contemporary urban planning (such as Plan Bay Area). There are two suburban sectors, earlier and later. The fifth sector is the exurbs, outside the built-up urban area. The principle purpose of the City Sector Model is to categorize metropolitan neighborhoods based on their intensity of urbanization, regardless of whether they are located within or outside the boundaries of the historical core municipality (Note).

    Most Jobs are Outside the Urban Core

    The 2014 data indicates that more than 80 percent of employment in the nation’s major metropolitan areas is in functionally suburban or exurban areas (Figure 3). The earlier suburbs have the largest share of employment, at 44 percent. The later suburbs and exurbs combined have 37.0 percent, while the urban cores have 18.9 percent, including the 9.1 percent in the downtown areas (central business districts, or CBDs).

    These numbers reveal dispersion since 2000. Then, the earlier suburbs had even more of the jobs, at 49.4 percent, 5.3 percentage points higher than in 2014. Virtually all of the lost share of jobs in the earlier suburbs was transferred to the later suburbs and exurbs, which combined grew from 31.4 percent in 2000 to 37.0 percent in 2014. The urban cores had 19.4 percent of the jobs (8.8 percent in the CBDs), slightly more than the 18.9 percent in 2014 (Figure 4).

    Things have been much more stable since 2010, with a small loss in the earlier suburbs (-1.1 percentage points), a small gain in the urban core (plus 0.1 percentage points), which includes a 0.3 percentage point gain in the CBDs. The later suburbs gained 1.0 percentage points, while the exurbs held the same share as in 2010 (Figure 5).

    Most Jobs Growth Since 2010 has been Outside the Urban Core

    Between 2010 and 2014, more than 80 percent of the employment growth was in the suburbs and exurbs (Figure 6), approximately the same figure as their overall combined share of employment. The later suburbs have added more than their employment share since 2010 (39.7 percent compare to 24.8 percent), while the earlier suburbs and the exurbs have added a smaller percentage compared to their 2010 share of jobs (30.8 percent versus 45.2 percent and 10.6 percent versus 11.2 percent, respectively).

    In the last year (2013 to 2014), the data has remained similar, with smaller changes in the same direction as before (Figure 7). The earlier suburbs experienced a small loss (0.3 percentage points), while the later suburbs gained 0.2 percentage points, the exurbs gained 0.1 percentage points and the urban cores remained constant (including no change in the CBDs).

    Where the Jobs are By Urban Sector

    There is substantial variation in the distribution of jobs within metropolitan areas.

    Not surprisingly, the largest urban core job concentrations are in the metropolitan areas with older and larger core municipalities. Nearly 52 percent of the employment in the New York metropolitan area is in the urban core, which includes the nation’s largest central business district. Chicago, Washington, Boston and San Francisco, with the next four largest CBDs (though all small compared to New York) also rank among the 10 metropolitan areas with the greatest employment share in their urban cores (Figure 8). Only 16 of the 52 major metropolitan areas had more than 20 percent of their employment in urban cores (36 had 80 percent or more of their employment in the suburbs or exurbs).

    The metropolitan areas with greater job concentration in the earlier suburbs typically experienced more of their growth in the decades immediately following World War II. Hartford has the largest share of employment in the earlier suburbs, at 81.7 percent (Figure 9). Los Angeles, perhaps the original polycentric city, ranks second, at 72.3 percent. This list also includes Rust Belt metropolitan areas that have either grown little or lost population (Detroit, Cleveland, Pittsburgh and Buffalo).

    The metropolitan areas that have had the greatest recent population growth dominate in later suburban and exurban employment (Figure 10). More than 82 percent of Raleigh’s employment is in the later suburbs and exurbs. All but one of the 10 metropolitan areas with the largest job share in the later suburbs and exurbs were among the 15 fastest growing in terms of overall population between 1980 and 2010. The one exception is Grand Rapids, which ranked 27th in growth from 1980 to 2010.

    Balanced Metropolitan Areas

    The meme that people were moving back to the city (urban core) has been with us for decades. For just as long, there have been virtually no reality to the narrative. . The overwhelming share of the population lives and works the suburbs and exurbs. This is where both population growth continues and job growth is concentrated. One fortunate result is metropolitan areas with remarkable balances between home and employment locations, and among the shortest work trip travel times in the world.

    ——

    Note: In some cases the functional urban core extends beyond the boundaries of the historical core municipality (such as in New York and Boston). In other cases, there is virtually no functional urban core (such as in San Jose or Phoenix). Functional urban cores accounted for 14.7 percent of the major metropolitan area population in 2012. By comparison, the jurisdictional urban cores (historical core municipalities) had 26.6 percent of the major metropolitan population, many consisting of large tracts of functional suburban development.

    Wendell Cox is principal of Demographia, an international pubilc policy and demographics firm. He is a Senior Fellow of the Center for Opportunity Urbanism (US), Senior Fellow for Housing Affordability and Municipal Policy for the Frontier Centre for Public Policy (Canada), and a member of the Board of Advisors of the Center for Demographics and Policy at Chapman University (California). He is co-author of the "Demographia International Housing Affordability Survey" and author of "Demographia World Urban Areas" and "War on the Dream: How Anti-Sprawl Policy Threatens the Quality of Life." He was appointed to three terms on the Los Angeles County Transportation Commission, where he served with the leading city and county leadership as the only non-elected member. He served as a visiting professor at the Conservatoire National des Arts et Metiers, a national university in Paris.

    Photograph: Suburban fringe, St. Louis (by author)

  • Are Compact Cities More Affordable?

    Housing affordability has been a tenacious and intractable urban problem for as long as stats have been kept. Several cities recently declared it a crisis. But what kind of problem is it? Opinions vary widely. An economic problem, or a social one? A land resource issue? Or, as traded wisdom would have it, the result of reliance on the wrong urban form? Proposed solutions vary accordingly. Now, new evidence rules out one potential source of unaffordable housing: clearly, it is not an urban form problem. The widely-believed theory that a city’s lack of affordable housing can be fixed with increased compactness — when combined with public transit — is apparently wrong.

    In a recent article we questioned a publicized correlation between a compactness index level (i.e., urban form) and housing affordability. The argument supporting compactness is that it enables the use of public transit and active mobility modes, which reduce transport expenses sufficiently to eclipse the higher cost of housing prevalent in compact districts. We challenged that assumption, and found that data from eighteen US regional metro regions showed no such effect. Even if it were at all present, it would not be sufficiently pronounced to be an effective solution. Those conclusions were based on a regional look at the problem.

    While the aggregate regional data undermined the urban form theory of affordability, what do sub-regional level data show? At this finer level, could the housing-plus-transportation burden work to the advantage of households? To answer this question, we used data from 18 districts of the Metro Vancouver (BC) region. In this case, the official data exclude certain types of households — a critical limitation. But, given that such disaggregated data are rare, an effort at deciphering their meaning is warranted.

    The two subject groups were Working Homeowners and Working Renters. First, we looked at whether or not the working homeowners could find accommodation that suited their income without stretching themselves thin.

    Chart #1 shows the progression of housing costs in each sub-regional district, and the corresponding household median income. The in-step slopes of the two data sets suggest that working home-owning households have housing costs in tune with their earnings. This implication is further confirmed by the strong correlation (R2= 0.8598) between their income and their housing expenses.

    Housing costs that are proportional with income are a positive sign, but can these homeowners actually make their mortgage payments without financial stress? The data says yes, they can. This group’s average ratio of housing payments to income is 26%. It never exceeds 30%, the accepted threshold of financial strain.

    Instructively, from an urban form perspective, the highest ratios occur in the central, compact district; a confirmatory finding. Equally expected are that the lowest cost-to-income ratios occur in districts furthest from the center; these districts are either suburban or exurban.

    But are any of these home-owning households disadvantaged by excessive transportation costs due to their location? The data show a normal, average transportation expense of 14% of income and a range from about 8% to 20%. The ratios do increase with distance, but bear no significant correlation with income (R2= 0.0178).

    When choosing the place of residence, do homeowners consider housing costs, but disregard transportation costs? If so, could this lead to an affordability problem as measured by the combined costs? Apparently not. Chart #3 graphs (blue line) this group’s cost burden for combined housing and transportation (H+T) expenses, which never exceed the recognized affordability threshold: 45% of income.

    Conclusion? Metro Vancouver’s 305,000 households of working homeowners with mortgages aren’t experiencing financial strain due to their housing costs, no matter what their preferred housing form, location or transportation arrangements. The urban and suburban locations of the city structure fully satisfy their housing and transport needs. Neither compactness nor its absence has a negative impact on their finances.

    The data paints an entirely different picture for the 224,000 working households that rent their accommodations. Their average H+T burden (Chart #3; orange line) is 51% of their median income, and it ranges from the 45% threshold of affordability to an extreme of 65%.

    This picture, however, is not the result of high housing costs; rents register in the affordable range in all locations but two. The average working renter’s housing cost is 26%, which mimics that of a homeowner, and the range is below the stress level of 30%, with only two outliers (out of 18 districts) at 35% and 45% of income. For renters, as is the case for homeowners, the highest housing costs occur in the more compact districts. The outliers are found in elite social cluster districts — highly desirable neighborhoods — entirely unrelated to urban form.

    Given that rent costs are within the affordable range in all but two locations, we may infer that the Metro Region provides a sufficient range of housing costs for this group in its current urban/suburban structure.

    These findings are reinforced by the proportionality of incomes and housing expenses for both homeowners and renters. The incomes of renter households range from 45% to 63% of homeowners by location, and their rent costs are from 45% to 65%, an almost identical range.

    It would seem, then, that the excessive H+T burden renters face can be attributed partially to the transportation costs of this group. However, contrary to expectations, of the six districts that have rapid rail service (sky-train; black markers on Chart #3), not one manages to have a total burden below the affordability threshold. That even goes for the two suburban districts that offer the lowest rents.

    Chart #4 clearly shows the division between the earnings of owners and renters, and the affordability threshold that separates them. The belief that a compact urban form provides a path to solving housing affordability problems appears untenable.

    Overall, the data shows that for working homeowners there are no locations in the Metro Vancouver Region, whether urban, suburban or exurban, that push housing costs or the combined costs of housing and transportation above the affordability threshold. Urban form is not affecting budgets in these households.

    For working renters, rents are affordable in 16 of the 18 districts, whether urban, suburban or exurban. However, when transportation costs are added to their housing costs, the new sum puts them in financial stress, even in districts served by rapid rail transit.

    This sub-regional, limited analysis confirms the findings of our earlier regional look: compactness and access to transit do not produce the affordability benefits that have been claimed. The compact urban form does not equal more affordable living, particularly for the less affluent.

    Fanis Grammenos heads Urban Pattern Associates (UPA), a planning consultancy. UPA researches and promotes sustainable planning practices including the implementation of the Fused Grid, a new urban network model. He is a regular columnist for the Canadian Home Builder magazine, and author of Remaking the City Street Grid: A model for urban and suburban development. Reach him at fanis.grammenos at gmail.com.

    Flickr photo by Nick Kenrick: The Neighbourhood of East Van

  • Paris: Are the Banlieues Still Burning?

    Press coverage of the recent European violence often draws a line from the Arab slums around Paris to the violence that has recently engulfed Brussels and Paris. According to this theory, Arab refugees from Morocco and Algeria, and, more recently, Syria, who have settled on the impoverished outskirts of Paris, are to blame for the terrorist attacks because France and Belgium have been reluctant to assimilate Arabs into their European cultures. And youth unemployment rates in the banlieues — suburbs — of Paris and Brussels are, indeed, more than fifty percent in some districts. Is it any wonder, the thinking goes, that disaffected Arabs have taken to fitting themselves with suicide vests, or spraying AK-47 bullets into crowded cafés?

    Living on the Swiss border with France, and spending many days each year in France, I have long heard these urban-decay theories of political violence. I decided to investigate the link between unassimilated Arabs in the banlieues and the violence that has shaken Europe.

    I made the trip in March with my bicycle, so that I could easily get around such notorious suburban ghettos as Clichy-sous-Bois and Le Blanc-Mesnil.

    I couldn’t see every street or every crumbling apartment complex in the banlieues, obviously, but I did cover a wide swath of the Paris exurbs. And I tracked a course that, at least during the 2005 riots, would have followed the smoke of burning tires.

    I include the above qualifier because many friends (most, I would say, have never explored the suburbs on a bike) don’t believe my conclusions, which are that the banlieues are not nearly as desperate on the ground as they are on television reports.

    Especially after a terrorist incident, local media will invariably show pictures of dilapidated high-rise apartment buildings on the edges of Paris, and action shots of the police dragging suspected terrorists from these underworlds. The causes and effects would seem clear. But my observations led to conclusions that question that French connection.

    Setting out from the Chelles train station, I had expected to come across 1970s-era South Bronx-like slums, only with an Arab motif. But as I rode through many Islamic neighborhoods, what surprised me is how different the banlieues are from the violent shadows on the evening news.

    In those dispatches, the suburbs might well be an Arabic Calcutta.

    Instead I found the these areas to be in the midst of urban renewal. Where ten years ago there were overturned cars and burning tires, I came across rows of working class houses (most well kept) and some new strip malls. On many corners there were the outlets of national franchises—as many McDonalds as mosques.

    Clearly, France has spent millions in the banlieues; think of the construction that went on in American cities after the urban riots of the 1960s. The French government has replaced some of the post-war, high-rise towers of despair with smaller scale apartment buildings, what American city planners call “scatter-site housing.” Clearly, the sociologists have come to have more sway than the civil engineers.

    Not every street I went down in places like Sevran or Aulnay-sous-Bois looked like a contemporary planner’s urban-renewal model. But more than I expected did.

    So why has the violence moved from the halal shops in Clichy-sous-Bois to the Boulevard Voltaire in Paris?

    Most articles about terrorist violence in France and Belgium make the point that Arab immigrants have yet to be integrated into local culture. Social isolation remains one of the possible causes of the new urban wars, and it is well documented in many descriptions of Arab culture in Europe.

    Left out of these explanations for the Paris or Brussels violence is the extent to which an existing criminal underclass has committed itself to Islam, and not the other way around.

    According to some candidates in the American presidential election, the European bombers and attackers are the kamikaze of a new religious order, taking their orders from the ISIS central command in Raqqa in the east Syrian desert.

    It is true that many of the attackers have had the support of military planners, such as those from Saddam’s Baathist officer caste, who were ostracized when the US invaded Iraq.

    But the aspect of the attackers that never gets on the evening news is the extent to which many of the bombers embraced Islam only after lives of petty crime, if not debauchery, in the same clubs they are now attacking.

    The killers failed at school, in after-school programs, and at various low-level jobs, only to find the warm embrace of a prison imam speaking of injustices done to co-religionists on the Syrian frontier.

    These rebels finally had a cause, however distant it was from their lives of street crimes. Their route to eternity, however, only passed through Raqqa by chance and convenience, not by providential design.

    While I was in Paris, I made it a point to bicycle over to all of the sites that were attacked on November 13, and to the site of the earlier shootings at the magazine Charlie Hebdo.

    I thought that by riding the stations of such a sad cross I might get some insight into what had motivated the killers.

    The editorial offices of Charlie Hebdo have moved from the location of the attack. But on the side of the old building, a portrait of the slain editor, Stéphane Charbonnier, has been drawn. Of earlier threats he said: “I would rather die standing than live kneeling.”

    The mournful side street near the center of the Paris gives no clue as to how the French rank the importance of press and religion in the hierarchy of its political freedoms. Would France feel the same about Charlie Hebdo if it had attacked Judaism as it did Islam?

    Around the corner is the Bataclan nightclub, where almost 100 young French concertgoers were shot down in cold blood. Some flowers were propped against the closed doors. Otherwise, the pagoda-shaped building had the look of a failed theater, down and out in the latest economic depression.

    Standing in front of the killing zone, I envisioned the Bataclan assassins less as holy warriors—jihadis on their way to martyrdom—and more as street thugs or contract hitmen.

    Looking at the bullet holes in the plate glass windows of the nightclub, plus at some nearby cafés, I saw the gunmen as absent of any ideas or ideals. I thought more about Baby Face Nelson and the Dillinger gang (sometimes called the Terror Gang), with their running boards and machine guns, than I did about what candidate Ted Cruz calls “radical Islamic terrorism.”

    I grant you that the killers were Muslim and that many had roots in the Paris suburbs, but I don’t think the poverty of the banlieues alone explains why anyone would attack a nightclub with automatic weapons, any more than crop failures in Sicily or Catholicism explain the violent rubouts committed by the mafia in the last 100 years.

    Matthew Stevenson, a contributing editor of Harper’s Magazine, is the author, most recently, of Remembering the Twentieth Century Limited, a collection of historical travel essays, and Whistle-Stopping America. His next book is Reading the Rails. He lives in Switzerland.

    Photo of the Bataclan nightclub in Paris by the author.

  • Empire State Building Toward Wins for Trump, Hillary

    New Yorkers like to think of themselves as ahead of the curve but, this year, they seem to be embracing the most regressive politics. The overwhelming favorite in Tuesday’s primary among Republican candidates – with more than 50 percent support, according to RealClearPolitics – is Donald Trump, the brash New Yorker whose campaign vows to “make America great again.” On the Democratic side, New Yorkers appear to prefer Hillary Clinton, their former U.S. senator and quintessential avatar of the gentry liberals, rather than feeling “the Bern.”

    Some of this stems from political causes – for example, Clinton’s close ties with progressives around Mayor Bill De Blasio – or the fact that the New York primary electorate is 30 percent nonwhite compared with 17 percent in Wisconsin. For Republicans, the overall weakness of the state party, a paucity of evangelicals and Ted Cruz’s poorly chosen attack on “New York values” all favor Trump.

    But the real driver of Trump’s success lies in the changing social, economic and demographic forces reshaping the Empire State. The city has enjoyed a considerable surge in employment, much of it – roughly one-third – in low-wage jobs. But the real “losers,” to use one of Trump’s favorite terms, has been the middle class, which is disappearing even faster in New York than in the rest of the country.

    This distress can be seen in migration numbers. While states like Texas and Florida are gaining hundreds of thousands of new residents, the New York metropolitan area has lost 701,000 net domestic migrants the past five years, after losing more than 1.9 million in the first decade of the new millennium. Greater New York loses net migrants to virtually every big U.S. urban region, even Los Angeles, Philadelphia, Washington, D.C., and Boston, as well as to Atlanta, Dallas-Fort Worth and Houston.

    Read the entire piece at The Orange County Register.

    Joel Kotkin is executive editor of NewGeography.com. He is the Roger Hobbs Distinguished Fellow in Urban Studies at Chapman University and executive director of the Houston-based Center for Opportunity Urbanism. His newest book, The Human City: Urbanism for the rest of us, will be published in April by Agate. He is also author of The New Class ConflictThe City: A Global History, and The Next Hundred Million: America in 2050. He lives in Orange County, CA.

    Photo by Gage Skidmore [CC BY-SA 3.0], via Wikimedia Commons

  • Largest Cities in the World: 2016

    Tokyo-Yokohama continues to be the largest city in the world, with nearly 38 million residents, according to the just released Demographia World Urban Areas (12th Annual Edition). Demographia World Urban Areas (Built-Up Urban Areas or Urban Agglomerations) provides annual estimates of the population, urban land area and urban population density of all identified built-up urban areas in the world. This year’s edition includes 1,022 large urban areas (with 500,000 or more residents), with a total population of 2.12 billion, representing 53 percent of the world urban population.

    Demographia World Urban Areas uses base population figures, derived from official census and estimates data, to develop basic year population estimates within the confines of built-up urban areas. These figures are then adjusted to account for population change forecasts, principally from the United Nations or national statistics bureaus for a 2016 estimate.

    Built-up urban areas are continuously built-up development that excludes rural lands. Built-Up urban areas are the city in its physical form, as opposed to metropolitan areas, which are the city in its economic or functional form. Metropolitan areas include rural areas and secondary built-up urban areas that are outside the primary built-up urban area. These concepts are illustrated in Figure 1, which uses the Paris built-up urban area (unité urbaine) and metropolitan area ("aire urbaine") as an example.

    The Largest Cities

    The world’s eight largest cities are located in Asia. Tokyo-Yokohama became the largest urban area, according to the United Nations, in 1955, more than 60 years ago. However, Japan’s capital may not old onto the top position for long. With Japan now losing population, it seems likely that Tokyo-Yokohama — which has been about the only place in Japan gaining population — will begin shrinking in the next decade, while facing a strong challenge from Jakarta.

    Jakarta has closed the gap to about 6.4 million. This may seem like a lot, but this is the closest a number two urban area has been since 1965, when New York trailed Tokyo-Yokohama by 5.1 million. The gap between number one and number two New York amounted to 16.5 million in 1995.

    Jakarta has grown very quickly, and now stands at a population of 31.3 million. Between 2000 and 2010, Jakarta added more than 7,000,000 residents, one of the largest population gains of any city in history. Should this growth continue, and the population of Tokyo-Yokohama begin to decline, the largest city in the world could be Jakarta by 2030. Jakarta is also the largest city in size in the southern hemisphere, stretching beyond its city limits, into the regencies of Tangerang, Bogor, Bekasi and Karawang to  the large independent cities of Tangerang, South Tangerang, Depok, Bekasi and Bogor.

    Delhi, India’s capital, is not only the third largest city in the world, but is also the largest in India (25.7 million). That may be surprising, since Mumbai (Bombay) was the largest in India for decades and had been widely touted to become the world’s largest city. Delhi spreads from the National Capital Territory of Delhi into the states of Haryana and Uttar Pradesh. These areas include the modern edge city technology hubs of Gargaon and Noida (Figure 2).

    Seoul-Incheon is the fourth largest city in the world, with 23.6 million residents, Seoul-Incheon spreads from the core municipality of Seoul into suburban Gyeonggi and the independent municipality of Incheon. The core city of Seoul has stopped growing, and approximately 60 percent of the population is in the suburbs.

    Manila is the fifth largest city, with 22.9 million residents. Manila slipped from the fourth position according to recently obtained Philippine national statistics authority population projections. However, Manila continues to be one of the world’s fastest growing megacities and can be expected to pass Seoul-Incheon in the next few years. Manila spreads from the National Capital Territory into the adjoining provinces of Cavite, Laguna, Rizal and Bulacan.

    Sixth ranked Mumbai is a new entry to the top 10, with 22.9 million residents. The Mumbai urban area has been redefined to incorporate adjacent urban areas, which explains its larger population relative to last year. Mumbai extends from the municipality of Mumbai into the districts of Thane and Raighar.

    The sixth largest city is Karachi in Pakistan’s with 22.8 million residents. This population estimate is the least reliable among the largest cities. Pakistan’s last population census was nearly 20 years ago, and had been scheduled for March 2016. As of publication, the census has been postponed and no new date set.

    Shanghai dropped to the number eight position from sixth place last year. Shanghai’s population is estimated at 22.7 million residents. Like many cities across China, population growth has dropped substantially during this decade. Recently, the Shanghai city government announced that the population had fallen slightly over the last year, ending three decades of dramatic population growth in the last three decades. The Shanghai urban area is almost completely confined to the municipality of Shanghai, but has minor extensions into the provinces of Jiangsu and Zhenjiang.

    New York is the ninth largest city, with a population of 20.7 million. New York is the largest built-up urban area outside Asia and covers the largest land area of any urban area. New York extends into Long Island and the Hudson Valley in the state of New York, Connecticut and New Jersey. New York had been the world’s largest city before Tokyo, a distinction that it had held since 1925, when it surpassed London (now 33rd largest).

    The 10th largest city of Sao Paulo, with a population of 20.6 million. Sao Paulo is a new addition to the top 10, Latin America’s largest city and the core municipality. Sao Paulo stretches from its large core city in all directions, with approximately half of the population in the suburbs.

    Two cities fell out of the top 10, Beijing and Guangzhou-Foshan. Like Shanghai and some other cities of China, newer population estimates indicated a substantial decline in growth rates. Beijing is now the 11th largest city in the world, while Guangzhou-Foshan is 13th largest.

    Mexico City is ranked 12th largest in the world. Mexico’s capital has experienced a roller coaster ride in urban area rankings since the middle of the last century. In 1950, Mexico City ranked 17th in the world, according to United Nations estimates. By 2000, Mexico City was second in the world to only Tokyo Yokohama. During the period of its greatest growth, in the late 20th century, it was common to hear that Mexico City would eventually be the largest in the world (as was the case with Mumbai, above) but its once frenetic growth has cooled considerably.

    Los Angeles has also had its ups and downs. It is substantial growth in the first half of the 20th century brought Los Angeles from virtually nowhere to 12th largest in the world by 1950. As in Mumbai and Mexico City, there were those who expected Los Angeles to become the largest city in the world. By 1965, Los Angeles was the sixth largest city, trailing only Tokyo Yokohama, New York, Paris, London and Osaka Kobe Kyoto. Now, Los Angeles has fallen to 19th position and not only is unlikely to ever be the largest city in the world or even in the United States.` The 5 million population gap compared to New York in 2016 is little different from 1990.

    Distribution of Population

    Much has been made of the fact that the world now has more than one half of its population living in urban areas. More than one analyst has misunderstood this as meaning that the norm for world residents looks like Fifth Avenue in New York, central London or Paris or the huge shantytowns of Mumbai or Dhaka. In fact, however, most urban residents live in nothing like such environments (See: What is a Half Urban World?).

    Only 8.2 percent of the world population lives in megacities (built-up urban areas with more than 10 million population. In contrast nearly a quarter lives in cities of more than 1 million population, including the megacities. A larger 30 percent of the world population lives in urban areas under 1 million population, which includes the smallest towns. Rural areas still have nearly 46 percent of the world population (Figure 3).

    Most of the large built-up urban area population lives at densities between 4,000 and 10,000 per square kilometer, or approximately 10,000 to 25,000 per square mile. These population densities are typical in parts of Asia, Africa and South America. Another one quarter of the population lives at densities of below 4,000 per square kilometer or approximately 10,000 per square mile. These densities are principally found in Europe, North America and Oceania (principally Australia and New Zealand). Slightly less than one quarter of the population lives at higher densities, above 10,000 per square kilometer or 25,000 per square mile. These densities are largely limited to certain Asian and African nations, such as Bangladesh, the Democratic Republic of the Congo and Pakistan (Figure 4).

    The Future

    As has been noted before, much of the population growth in the world will be in Africa over the next century. However, in the next few decades the greatest urban population growth seems likely to be in Asia, where 57 percent of the large urban area population lives. Even with declining growth rates, such as in China, many millions more  rural residents are expected to continue moving into China’s  cities .

    Note on Availability

    The full Demographia World Urban Areas and its components can be downloaded as follows:

    Full Report:

    Demographia World Urban Areas

    By Component:

    Demographia World Urban Areas- Index

    Photograph: Cover of Demographia World Urban Areas: 12th Annual Edition

    Wendell Cox is principal of Demographia, an international pubilc policy and demographics firm. He is a Senior Fellow of the Center for Opportunity Urbanism (US), Senior Fellow for Housing Affordability and Municipal Policy for the Frontier Centre for Public Policy (Canada), and a member of the Board of Advisors of the Center for Demographics and Policy at Chapman University (California). He is co-author of the “Demographia International Housing Affordability Survey” and author of “Demographia World Urban Areas” and “War on the Dream: How Anti-Sprawl Policy Threatens the Quality of Life.” He was appointed to three terms on the Los Angeles County Transportation Commission, where he served with the leading city and county leadership as the only non-elected member. He served as a visiting professor at the Conservatoire National des Arts et Metiers, a national university in Paris.