Category: Urban Issues

  • The Midwest, Redefined

    What if the region we broadly understand as the Midwest, stretching from the foothills of the Alleghenies to the high plains, and from the chilly northern Great Lakes to the Ohio, Mississippi and Missouri river valleys, had been allowed to develop as organically as its eastern and southern — and even western — neighbors?  

    If it had, it would be far better understood, have a much stronger cultural clarity, and more recognized for its contributions to American society and economy.

    Here’s what I mean.  The north central region of the U.S. has been an American paradox since its founding.  Unlike other regions of the country, where a critical mass of settlers established a colony or territory and then pursued legitimacy, the core of the region had its territorial boundaries established long before settlers had a chance to make a major imprint on the land.  That set off a race for control of the region by two already established regions, New England and Appalachia, with vastly different motivations — and cultural mores.  Because they came from different places, they took different paths to the Midwest.  New Englanders came via the Erie Canal and Great Lakes, while Appalachians traveled northward across the Ohio River.  Rather than intermingle and create a new and blended society, the New Englanders and Appalachians tended to maintain their local strongholds, with New Englanders in larger Great Lakes cities, and Appalachians in the upper regions of the Ohio Valley.  And this happened without any reconsideration or adjustment of political boundaries in the Midwest’s early days. 

    This has hampered our understanding of the Midwest ever since.

    Here’s a thought experiment.  Let’s say that instead of New York expanding to the shores of Lake Ontario and Lake Erie because it wanted to control development of the Erie Canal, western New Yorkers fought to establish their own state.  Similarly, let’s say that early settlers of western Pennsylvania recognized their remoteness from Harrisburg and Philadelphia, and decided local control suited them, too.  And let’s further suggest that, instead of becoming part of Ohio, the Connecticut Western Reserve was also allowed to develop as a separate state as well. 

    Ultimately, it’s conceivable that a new map of the Midwest, one that matches more closely to actual American settlement patterns, might look something like this:

    In my mind, as many as six new states could have emerged.  Western New York could’ve become Niagara, with Buffalo and Rochester as its key metropolises.  Western Pennsylvania could’ve become Allegheny, centered on Pittsburgh and Erie.  The Connecticut Western Reserve could’ve become Erie (or Cuyahoga?), greater Chicago could’ve been recognized as its own state, and the upper parts of Michigan, Wisconsin and Minnesota could’ve become Superior.  The southern part of Missouri could’ve become Ozark.

    The benefit of this is that the political environment aligns with the settlement patterns and modern-day networks of the region.  I’ve made similar points before about the cultural geography of the Midwest.  I think that because two different cultural groups inhabited the same space without ever effectively coming together, they’ve never maximized the development potential within either.  Yes, the Midwest was the nation’s manufacturing center for much of the 20th century, but it could be argued that it often did so in spite of rural and agricultural interests that were strong in state capitals like Columbus, Indianapolis and Springfield.  When manufacturing faded, those same interests often promoted the development of cities within their regions that were less tainted by a manufacturing legacy.

    Two years ago, I noted that, irrespective of state boundaries, the Midwest was somewhat aligned like this:

    And yet, the tension that was evident two centuries ago continues today.  For my “Five Midwests’ series, I quoted a passage from James McPherson’s book about the Civil War entitled Battle Cry of Freedom, in which he noted the economic, social and cultural differences between the Hoosiers, Buckeyes and Butternuts of the Ohio Valley, and the Yankees of the Great Lakes.  Today, geographers can track and map broad travel and commuting patterns that illustrate how we’re connected as a nation, and find those patterns still exist:

    “Danville, in central Illinois, is more closely connected to Des Moines, which is hundreds of miles away in Iowa, than it is to Chicago, which is much closer and in the same state.

    That’s not necessarily because there are tons of Danville commuters trekking to Des Moines. Rather, Nelson and Rae’s methodology shows they are both more tightly linked to the necklace of cities in between them—Urbana, Bloomington, Peoria, etc.—than they are to the cities that fall outside the entire zone.”

    Welcome to the characteristic that keeps the Midwest from being well understood as a region.

    Pete Saunders is a Detroit native who has worked as a public and private sector urban planner in the Chicago area for more than twenty years.  He is also the author of “The Corner Side Yard,” an urban planning blog that focuses on the redevelopment and revitalization of Rust Belt cities.

  • Vancouverizing Seattle?

    A recent Wall Street Journal article (“For Chinese buyers, Seattle is the new Vancouver”) reported that Seattle was replacing Vancouver as the most popular destination for Chinese buyers in North America. For years, there has been considerable concern about foreign investment in the Vancouver housing market, especially Chinese investment. This   demand is widely believed to have driven Vancouver house prices “through the roof.” In response, the British Columbia government recently imposed a 15 percent foreign buyers tax that has had the impact of significantly reducing new foreign investment in Vancouver’s housing market.

    Yet the impact of the tax has still been muted. Houses remain just about as unaffordable as before. The Real Estate Board of Greater Vancouver benchmark price has dropped less than four percent from six months ago, before the foreign buyers tax was imposed. This compares to an 80 percent increase over the last 10 years and 47 percent increase over just the last three years (Figure).

    Clearly there is something other than Chinese investment driving up Vancouver house prices. Since 2004, Vancouver’s median multiple (median house price divided by median household income) has risen from 5.3 to 11.8. This means that that the median house has increased in price more than six times the annual median household income.

    The primary cause of Vancouver’s difficulties is a rigged housing market. For decades, Vancouver has had some of the strongest urban containment policy in the world. Regional land-use authorities have prohibited  housing development from being built on a large agricultural reserve. This land is hardly needed for such use in a nation that has increased its gross agricultural output more than 150 percent since 1961, while reducing its land in farms by three times as many acres as is occupied by all urban settlements combined, according to the 2016 Canadian census. Of course, urban containment restrictions on new housing have driven up house prices, just as Middle East oil supply reductions used to drive up gasoline prices, before the recent supply increases from Canadian and US oil production.

    Vancouver has literally become the third most unaffordable city (metropolitan area) in the nine nations covered by the Demographia International Housing Affordability Survey. This makes a mockery of the Vancouver’s frequent citation as one of the most livable cities in the world. The first principle of livability is affordability — you cannot live where you cannot afford. Most young families of normal economic means cannot hope to ever buy a modest detached house with a yard as their parents or grandparents did decades ago in the Vancouver area. Only Hong Kong and Sydney are less affordable.

    In a recent column (“Not much can or will be done to make Vancouver housing more affordable”) by Gordon Clark in The Province (Vancouver newspaper) describes how things have changed, in a story similar to what you will hear in Sydney, San Francisco and others of the world’s most unaffordable cities. In 1941, his postal supervisor grandfather purchased a house on Oak Street (a main central arterial leading toward downtown) for 1.5 years of income. In 1979 his teacher mother purchased a house in the city of Vancouver for 2.5 times her income. Now with houses costing nearly 12 times incomes, Clark regretfully concludes that nothing can be done: “because the solutions are unacceptable to most people.”

    This illustrates what is perhaps the most powerful characteristic of urban containment regulation — that it creates a strong lobby of support among those who have seen their house values irrationally escalate as a result of unwise government policy. In this environment, public officials simply wring their hands, decry the problem and implement nothing of substance to change the essentially flawed policies. 

    With this rigged market, it should not be surprising that people with money from outside Vancouver, and abroad, would seek to buy houses in Vancouver. After all, the policies all but guaranteed strong returns to anyone with enough capital to enter the market.   It is as if a “Speculators Welcome” banner has been hung from Lion’s Gate Bridge. Not so welcome are those middle-income households being driven out of the market

    Lessons for Seattle

    All of this is a cautionary tale for the Seattle metropolitan area, which also has urban containment policy, but of more recent vintage. Just 140 miles or 225 kilometers south of Vancouver, Seattle’s has housing affordability that already as bad as Vancouver’s  only 12 years ago.

    Seattle has a severely unaffordable median multiple of 5.5, slightly worse than Vancouver’s 5.3 in 2004. In the late 1980s, before Seattle imposed its metropolitan- urban containment policy, the median multiple was as low as 2.4 (Table). Today, a Seattle household with the median income must pay three additional years of income for the median priced house.

    Rising housing demand with severely constricted supply is associated with higher house prices compared to incomes. In this regard, Seattle has multiple risks, from households escaping California to escape from the even higher prices, Seattle is a bargain compared to the “dogs breakfast” of unaffordable housing associated with California where median multiples now exceed 8.0 in all of the major coastal metropolitan areas (Los Angeles, San Francisco, San Diego and San Jose). Prices are so high in California that a seller can buy a comparable house in Seattle for hundreds of thousands less. There may not be as much sun in Seattle, but there’s plenty of money left over for umbrellas and other goods and services.

    Now the pressure is likely to increase as foreign investors who shop the world for rigged housing markets promise quick profits now turn their attention to the Puget Sound. In this environment, it would not be surprising for additional serious house price escalation to be in the offing, and Seattle to indeed become the new Vancouver in the next decade or two.

    Given these forces, we can expect Seattle housing prices   will continue to increase disproportionately to incomes unless there is land use policy reform. Sufficient supply must be allowed on greenfield land to keep house prices from rising farther. And “building to the sky”— which is very expensive and not very family friendly —  is not likely to restore housing affordability in Seattle any more than it has anywhere else. For example, the Manhattanization of central Toronto, with its many new residential towers, has not prevented its median multiple from doubling from 3.9 to 7.7 in the last 12 years. Nor has it prevented a far less obvious (at least to the press) 80 percent share of population growth to be in the suburbs between 2011 and 2016.

    Lost in all of this are ordinary middle and working class people, who routinely take a back seat in public policy to planning obsessions over urban form, and a “sense of place.” Middle-income households are far more in need of a “decent place” to live at a reasonable price. Architectural marvels or sleek streetscapes are no substitute. The issue is not ideological, it is rather practical and human. Nor is it about property rights, or free markets. The issue is that people are being denied the housing they desire by urban containment policy and its distorted priorities. As Paul Cheshire, Max Nathan and Henry G. Overman of the London School of Economics have pointed out, “people rather than places” should be the focus of urban policy.

    It is ironic that progressive metropolitan areas, like Vancouver, where inclusionary zoning drip feeds housing to lower income households, have become, large exclusionary zones where average income households cannot afford houses. Seattle is headed down the same path.  Soon it may be time to hang a “Speculators Welcome” banner from the Space Needle.

    Photograph: Downtown Seattle (by author)            

    Wendell Cox is principal of Demographia, an international public policy and demographics firm. He is a Senior Fellow of the Center for Opportunity Urbanism (US), Senior Fellow for Housing Affordability and Municipal Policy for the Frontier Centre for Public Policy (Canada), and a member of the Board of Advisors of the Center for Demographics and Policy at Chapman University (California). He is co-author of the "Demographia International Housing Affordability Survey" and author of "Demographia World Urban Areas" and "War on the Dream: How Anti-Sprawl Policy Threatens the Quality of Life." He was appointed to three terms on the Los Angeles County Transportation Commission, where he served with the leading city and county leadership as the only non-elected member. He served as a visiting professor at the Conservatoire National des Arts et Metiers, a national university in Paris.

  • Trump Country: Where the Immigrants Aren’t

    Trump did best in the states with the lowest percentages of foreign-born residents.

    “I love the poorly-educated”, gushed Donald Trump after winning the Nevada primary in February. But in the end, what happened in the primary, stayed in the primary. Come November, Trump lost the state to Hillary Clinton, a turn that is explained by the fact that there is a higher percentage of foreign-born residents in Nevada than in any state won by Trump, save Florida.

    In fact, Trump won the general election because he carried almost all of the states where there are few foreign-born residents. His anti-immigration message resonated most in the parts of the country that have the fewest immigrants. Of course, he also won immigrant-heavy Arizona, Florida and Texas, but mainly by prevailing in rural counties. He lost in the counties that include the major urban centers of Miami, Orlando, Tampa, Dallas, Houston, Austin and San Antonio. He did win in Maricopa county where Phoenix is located but perhaps not in Phoenix itself. (Maricopa county encompasses a lot more than Phoenix as it is larger by itself than the entire state of New Jersey, and larger than Connecticut and Delaware put together.)

    If the size of the Trump vote can be used as a proxy for a state’s sentiment towards immigration and concern about terrorism, and it probably can, then it seems that the people who are most worried about immigration and terrorism are those who are the least exposed to it and the least at risk from it. This is counter-intuitive from the point of view of probability: why worry about a low probability event? But it could make sense from the point of view of fear: many people can be prone to fear and to misunderstand what they do not know well. Their opinions of others are formed mainly by what they see or read in the media, rather than by their own first-hand experiences.

    Where Trump Won

    In the United States overall, there were in 2015 as many as 42 million people who were born in another country, or 13.2% of the US population. But as shown in the chart, every state won by Trump last November, except for Arizona, Texas and Florida, has a smaller percentage of foreign-born than the national average. In fact, the lower the percentage of foreign-born in a given state, the better Trump has done in that state.

    In Wyoming and West Virginia (3.6% and 1.5% foreign-born), he carried approximately 70% of the popular vote. But in Georgia (9.8% foreign-born), he carried about 50%. This difference in the vote cannot be totally attributed to the fact that a majority of the foreign-born probably went for Clinton, given that the difference between 70% and 50% is far higher than the difference between 9.8% and 3.6% and that the latter variable includes non-voters such as children and undocumented immigrants.

    Meanwhile California, New York, New Jersey, Nevada, Hawaii and Massachusetts all have a higher percentage of foreign-born than the national average and they all voted for Hillary Clinton by wide margins. With Illinois, the District of Columbia, Washington state and a few others, these are the states with the big urban centers that saw the largest protests against the recent executive order banning entry from seven Muslim countries.

    In the above chart, the percent of foreign-born (provided by the US Census) includes unauthorized migrants. Pew Hispanic Research estimated their numbers in every state as of 2014. If we strip the unauthorized figure from the foreign-born figure, we end up with an even better correlation. The resulting chart below reinforces the notion that Trump did well in inverse proportion to the foreign-born presence in any state.

    Texas and Florida are moderate outliers in the sense that Trump did better than one would have expected from the regression. But conversely, he did far worse in the New England states, in particular Vermont, New Hampshire and Maine all of which have fewer than 5% foreign-born in their populations. Vermont is a big outlier, ostensibly because of the number of former New Yorkers living in the state, or the Bernie Sanders factor. Its total population is also very small at around 630,000.

    (click and zoom in to enlarge the table)

    screen-shot-2017-02-03-at-10-37-43-am-2

    With his current policies, the President is not courting any immigrant-heavy states and his solid base elsewhere allows him to ignore the protests. People who live in the rural South or Midwest may feel just as strongly in favor of the visa ban or of other Trump initiatives but their low-density living makes it harder for them to make their numbers visible through outdoor protests. The same is true of the lower density regions of Arizona, Florida and Texas where support for Trump was rock solid.

    Terror Calculus

    It is also worth noting that the Trump states (red in the chart) have not been the targets of terrorist activities or threats to the same extent as New York or Washington DC. So here again, the people more often targeted by terrorism seem less worried about newcomers and Muslims than people who live in a small town or rural setting where the odds of terror attacks are close to nil. Terrorists want to inflict as much damage and as many casualties as possible, a more attainable goal in dense urban centers. Even if they targeted smaller localities, the odds that it would be one’s own small town out of thousands of others are probably no greater than the odds of a mass shooting by a citizen born and raised in the United States.

    Meanwhile, there is only one New York City and only a few cities of the size of Chicago or Washington DC. Even in these cities, the odds of being a victim of terrorism are very small. An attack may well occur but the likelihood that it will be at the exact time T and place P where a resident R may find himself, out of hundreds of millions of other possible daily T-P-R combinations, is indeed minimal. Of course, a scenario involving a WMD attack throws off this tragic and otherwise reassuring calculus. But then this speaks more to the need for detection and prevention of WMDs, rather than to the extreme vetting of individuals originating from certain countries.

    So to sum up, people who have few if any foreign neighbors appear to be more worried about foreigners and terrorism than people who have many foreign neighbors. And from their sparsely populated townships, they could now effect restrictive policies not only for their own localities, but even for the large cities that they rarely visit. This is not so unusual. Historically, decisions made at the center have not always complied with local preferences. However, it should be added that historically, it was more often the preferences of the big cities that were imposed on the great plains.

    President Trump says he loves the poorly-educated but he also relies on the support of voters who are less exposed to immigrants. Which then begs the following question: how deep is these voters’ sentiment towards the foreign-born in places where they are scarce, and for how long can the President tap it to maintain his popularity? A lot hinges on the answer.

    Sami Karam is the founder and editor of populyst.net and the creator of the populyst index™. populyst is about innovation, demography and society. Before populyst, he was the founder and manager of the Seven Global funds and a fund manager at leading asset managers in Boston and New York. In addition to a finance MBA from the Wharton School, he holds a Master’s in Civil Engineering from Cornell and a Bachelor of Architecture from UT Austin.

    Photo: Gage Skidmore, CC License

  • Focusing on Mobility Not Travel Mode for Better Economic Growth

    The last article outlined research on job access by cars, transit and walking by the University of Minnesota Accessibility Observatory that assesses mobility by car, transit and walking in 49 of the nation’s largest metropolitan areas. Of course, it is to be expected that the metropolitan areas will have the largest number of jobs accessible to the average employee simply by virtue of their larger labor markets.

    Indeed, smaller, but important major labor markets, from Grand Rapids and Buffalo to Philadelphia and Washington seem unlikely to ever rival the job numbers in metropolitan areas like New York and Los Angeles.

    Researchers such as Remy Prud’homme and Chang-Woon Lee of the University of Paris, David Hartgen and M. Gregory Fields of the University of North Carolina, Charlotte have shown that a city (metropolitan area( is likely to experience better economic results if its transportation system provides better mobility. This includes greater job creation, greater economic growth and poverty reduction.

    Virtually any metropolitan area will do well to focus on maximizing mobility. This article describes the percentage of jobs in each of the 49 metropolitan areas that can be reached by the average employee in 30 minutes, a time slightly longer than the US one-way work trip average travel time of 26.4 minutes.

    Accessibility by Auto

    The leading metropolitan area in auto accessibility include is San Jose . Despite its reputation as an ultra-green area, 90 percent of San Jose commuters who do not work at home use cars to get to work. San Jose does warrant accolades for its 4.7 percent work at home share, the most environmentally friendly mode of work access. Transit has a 4.1 percent share. More than 100 percent of the metropolitan area’s jobs can be reached in 30 minutes, largely because the San Francisco metropolitan area is virtually across the street, providing additional employment opportunities.

    The balance of the top 10 is smaller, metropolitan areas, Salt Lake City, Kansas City, Raleigh and Hartford, where the average employee can reach jobs equaling more than 100 percent of the metropolitan total in 30 minutes. The second five include Las Vegas, Milwaukee, Buffalo, Denver and Oklahoma City. All but three of the 10 cities with best access has urban densities that are lower than the major metropolitan average.

    The least automobile accessibility is in larger metropolitan areas, where there is generally much greater traffic congestion. New York and Chicago have the lowest levels of 30 minute accessibility, followed by Atlanta, higher than would be expected, in large measure because of its sub-standard arterial street system, which in other cities provides effective alternatives to freeways (Figure 1).

    Transit

    Employees can reach the greatest share of metropolitan area jobs by transit in San Francisco (3.54 percent), Salt Lake City (2.60 percent), New York (2.48 percent), Milwaukee (2.30 percent) and San Jose (1.99 percent). The second five includes three cities with strong legacies of transit such as Boston, Portland and Washington, along with New Orleans and Hartford.

    The least transit access is in Orlando, Houston, Detroit, Dallas-Fort Worth, Atlanta and Riverside-San Bernardino, all below 0.50 percent (Figure 2).

    Walking

    Walking can get the average employee to the greatest share of metropolitan jobs in 30 minutes in San Francisco (1.23 percent), Salt Lake City (1.23 percent), New Orleans (1.16 percent), San Jose (1.07 percent) and Milwaukee (1.00 percent).

    Among the 10 cities with the least walking access, none reaches one-third of one-percent. These include one Northeastern city, Boston, St. Louis and Detroit in the Midwest and an expected array of western and southern cities, such as Los Angeles, Houston, Dallas-Fort Worth, Phoenix, Riverside-San Bernardino, Miami and ,in last place, Atlanta (Figure 3).

    The Automobile Access Advantage

    The data indicates that automobiles have far superior access to employment in every major metropolitan area. The cities that have the smallest automobile advantage are generally credited with having the best transit systems. But there is relatively little practical opportunity for commuting by transit to metropolitan jobs.   In the worst case, the average New York auto commuter can reach 13 times as many jobs as by transit in 30 minutes, 16 times in San Francisco, 21 times in Boston, 25 times in Chicago and Washington. In Seattle, Philadelphia, Pittsburgh, New Orleans and Portland the average employee can reach from 28 to 37 times as many jobs by car as by transit.

    The auto advantage is much greater in other cities. In Detroit the average commuter can reach 164 times as many jobs by car is by transit, 149 times as many in Orlando, 138 times and Riverside San Bernardino, 137 times in Dallas-Fort Worth and 125 times in Raleigh. Atlanta, Birmingham, Phoenix, Las Vegas and Cincinnati commuters can reach more than 100 times as many jobs by car in 30 minutes as by transit (Figure 4).

    Not surprisingly, the disparities are even greater between autos and walking. Walking does best compared to cars in San Francisco, where auto commuters can reach 46 times as many jobs by car as by walking. The least advantaged pedestrians are in Kansas City, where the average automobile commuter can reach 285 times as many jobs by car as by walking (Figure 5).

    New York in Context

    A colleague pointed out that the domination of transit statistics by New York would justify looking at how the nation’s largest metropolitan area compares to others. New York commuter access in 30 minutes of 2.48 percent of jobs by transit is about 1/5 higher than the 1.93 percent in the other five metropolitan areas with transit legacy core cities. New York’s commuters can reach nearly 2.5 times the percentage of metropolitan jobs accessible within 30 minutes as in the other 43 metropolitan areas (Figure 6). Transit is a lot more comprehensive in the New York metropolitan area, but cannot compete with automobile access by a long shot.

    Improving Mobility and the Economy

    For decades there has been an assumption that transit is an alternative to the automobile throughout the metropolitan area. The University of Minnesota Accessibility Observatory shows any such conception to be at best an exaggeration. Indeed, transit and walking provide only a small fraction of the access available by automobile. This is not likely to change at any practical level of public funding. As Professor Jean-Claude Ziv and I estimated that it could take all of an urban area’s gross domestic product each year just to provide the point to point access available by cars.

    There are places that transit is competitive with the automobile, notably the nation’s largest downtown areas (central business districts or CBDs), which are in the six transit legacy cities. However, travel times are far slower than the national average, due to higher levels of traffic congestion and greater reliance on transit, which tends to be slower than cars overall. For example, commuters to Manhattan—by far the nation’s largest CBD — have transit travel times of 52 minutes, while the travel time by car is 51 minutes, according to the American Community Survey. Either way, the average one-way travel time is about twice the national average. However, even in New York, there are far more jobs outside the CBD, traffic congestion is far less and the speedier access by car makes transit generally uncompetitive to these dispersed locations.

    In the past, it was not unreasonable to believe that transit could materially improve mobility in metropolitan areas. The new research undermines any such conception. Maximizing metropolitan mobility — minimizing work trip travel times — is an important strategy for jump-starting the economy, creating jobs and restoring economic growth to historic levels. Urban transportations strategies need to be selected based upon the outcome of superior access, without regard to mode.

    Photograph: Interstate 10, Houston by Socrate76 (Own work) [CC BY-SA 3.0 or GFDL], via Wikimedia Commons

    Wendell Cox is principal of Demographia, an international public policy and demographics firm. He is a Senior Fellow of the Center for Opportunity Urbanism (US), Senior Fellow for Housing Affordability and Municipal Policy for the Frontier Centre for Public Policy (Canada), and a member of the Board of Advisors of the Center for Demographics and Policy at Chapman University (California). He is co-author of the “Demographia International Housing Affordability Survey” and author of “Demographia World Urban Areas” and “War on the Dream: How Anti-Sprawl Policy Threatens the Quality of Life.” He was appointed to three terms on the Los Angeles County Transportation Commission, where he served with the leading city and county leadership as the only non-elected member. He served as a visiting professor at the Conservatoire National des Arts et Metiers, a national university in Paris.

  • The High Cost of a Home Is Turning American Millennials Into the New Serfs

    American greatness was long premised on the common assumption that each generation would do better than the previous one. That is being undermined for the emerging millennial generation.

    The problems facing millennials include an economy where job growth has been largely in service and part-time employment, producing lower incomes; the Census bureau estimates they earn, even with a full-time job, $2,000 less in real dollars than the same age group made in 1980. More millennials, notes a recent White House report, face far longer periods of unemployment and suffer low rates of labor participation. More than 20 percent of people 18 to 34 live in poverty, up from 14 percent in 1980.

    They are also saddled with ever more college debt, with around half of students borrowing for their education during the 2013-14 school year, up from around 30 percent in the mid-1990s. All this at a time when the returns on education seem to be dropping: A millennial with both a college degree and college debt, according to a recent analysis of Federal Reserve data, earns about the same as a boomer without a degree did at the same age.

    Downward mobility, for now at least, is increasingly rife. Stanford economist Raj Chatty finds that someone born in 1940 had a 92 percent chance of earning more than their parents; a boomer born in 1950 had a 79 percent chance of earning more than their parents. Those born in 1980, in contrast, have just a 46 percent chance.

    Since 2004, homeownership rates for people under 35 have dropped by 21 percent, easily outpacing the 15 percent fall among those 35 to 44; the boomers’ rate remained largely unchanged.

    In some markets, high rents and weak millennial incomes make it all but impossible to raise a down payment (PDF). According to Zillow, for workers between 22 and 34, rent costs now claim upward of 45 percent of income in Los Angeles, San Francisco, New York, and Miami, compared to less than 30 percent of income in metropolitan areas like Dallas-Fort Worth and Houston. The costs of purchasing a house are even more lopsided: In Los Angeles and the Bay Area, a monthly mortgage takes, on average, close to 40 percent of income, compared to 15 percent nationally.

    Like medieval serfs in pre-industrial Europe, America’s new generation, particularly in its alpha cities, seems increasingly destined to spend their lives paying off their overlords, and having little to show for it.

    Rather than strike out on their own, many millennials are simply failing to launch, with record numbers hunkering down in their parents’ homes. Since 2000, the numbers of people aged 18 to 34 living at home has shot up by over 5 million.

    One common meme, particularly in the mainstream media, has been that millennials don’t want to buy homes. The new generation, as Fast Company breathlessly reported, is part of “an evolution of consciousness.” Other suggest the young have embraced “the sharing economy,” so that owning a home is simply not to their taste. The well-named site Elite Daily asserts that the vast majority of millennials are headed to “frenetic metropolis” rather than becalmed suburbs.

    And it’s not just ideologues claiming millennials have evolved out of home ownership. Wall Street speculators like Blackstone are betting that the young are committed to some new “rentership society,” with that firm investing $10 billion to scoop up existing small homes to rent, and even building tracks of homes exclusively for rent.

    It’s not a lifestyle choice, but economics—high prices and low incomesthat are keeping millennials from buying homes. In survey after survey the clear majority of millennials—roughly 80 percent, including the vast majority of renters—express interest in acquiring a home of their own. Nor are they allergic, as many suggest, to the idea of raising a family, albeit often at a later age, long a major motivation for home ownership. Roughly 80 percent of millennials say they plan to get married, and most of them are planning to have children.

    Overall, more than 80 percent of millennials already live in suburbs and exurbs, and they are, if anything, moving away from the dense, expensive cities. Since 2010 millennial population trends rank New York, Chicago, Washington, and Portland in the bottom half of major metropolitan areas while the young head out to less expensive, highly suburbanized areas such as Orlando, Austin, and San Antonio.

    Age will accelerate this process. Economist Jed Kolko notes as people enter their thirties they tend to head out of core cities to suburban locations; roughly one in four people in their mid to late twenties lives in an urban location but by the time those people are in their early thirties, that number drops precipitously and continues dropping into their eighties. In fact, younger millennials, notes the website FiveThirtyEight, are moving to the ’burbs at at a faster clip than previous generations. What’s slowing that trend is economics. Many can’t afford to move or transition to a traditional adulthood.

    The millennial housing crisis is reshaping the geography of opportunity. Although millennial rates of homeownership have dropped nationwide, the most precipitous declines have been in such metropolitan areas as New York, Miami, San Francisco, Portland, Seattle, and Los Angeles. In all these areas, public policy has regulatory barriers in the way of suburban and exurban affordability. It is in these markets where such things as “tiny houses” and “micro-apartments”—not exactly a boon to people looking to start families—are being touted as solutions to housing shortages.

    Nowhere is this dynamic more evident than in California, where the state government has all but declared war on single-family homes by banning new peripheral development, driving up house prices throughout metropolitan areas. Regulatory fees typically add upward of $50,000, two-and-a-half times the national average; new demands for “zero emissions” homes promise to boost this by an additional $25,000.

    Due largely to such regulatory restraints, overall California housing construction over the past 10 years has been less than half of that it averaged from 195 to 1989, forcing prices up, particularly on single-family houses. The state ranks second to the last in middle-income housing affordability, trailing only Hawaii. It also accounts for 14 of the nation’s 25 least affordable metropolitan areas.

    Home ownership rates in California are among the nation’s lowest, with Los Angeles-Orange having the lowest rate of the nation’s 75 large metropolitan areas. For every two homebuyers who come to the state, five families leave, notes the research firm Core Logic.

    The irony is that the state’s progressive policies are contributing to a less mobile society and a potential demographic crisis. For one thing, fewer young people can form families—Los Angeles-Orange had one of the biggest drops in the child population of any of the 53 largest metros from 2010 to 2015.

    This also has a racial component, as homeownership rates African American and Latino households—which often lack access to family wealth—have dropped far more precipitously than those of non-Hispanic Whites or Asians. Hispanics, accounting for 42 percent of all California millennials, endure homeownership roughly half that seen in other parts of the country.

    This is not the planners’ happy future of density dwelling, transit-riding millennials but a present of overcrowding, the nation’s highest level of poverty and, inevitably, a continued drop in fertility in comparison to less regulated, and less costly, states such as Utah, Texas, and Tennessee that have been among those with the biggest surges in millennial migration.

    Once identified with youth, California’s urban areas are now experiencing a significant decline in both their millennial and Xer populations. By the 2030s, large swaths of the state—particularly along the coast—could become geriatric belts, with an affluent older boomer population served by a largely minority servant class. How feudal!

    Ownership of land has always  been a critical component of middle-class wealth and power. Those celebrating the retreat from homeownership among millennials are embracing the long-term decline of that middle class, two thirds of whose wealth is in their homes.

    The potential decline in ownership also represents a direct assault on future American prosperity. Jason Furman, who served as chairman of President Obama’s Council of Economic Advisors, calculated that a single-family home contributes 2.5 times as much to the national GDP as an apartment unit. Investment in residential properties has dropped to its lowest share of overall spending since World War II; by some estimates reviving that would be enough to return America to 4 percent growth.

    With so many millenials unable to afford homes, or even to see a path to future ownership, household formation has been far slower than in the recent past. Rather than a surge of middle-class buyers, we are seeing the rise of a largely property-less generation whose members will remain economically marginal into their thirties or forties. Indeed by 2030, according to a recent Deloitte study, millennials will account for barely 16 percent of the nation’s wealth while home-owning boomers, then entering their eighties and nineties, will still control a remarkable 45 percent of the nation’s wealth.

    If this continues, we may have to all but abandon the notion of the United States as a middle-class nation. Instead of having a new generation that strikes out on their own, we may be incubating a culture that focuses on such things as the latest iPhone, binge watching on Netflix, something they do far more than even their Xer counterparts.

    Progressives who embrace these developments are abandoning one of the central tenets of mainstream liberalism. In the past, many traditional liberals embraced the old American ideal of dispersed land ownership. “A nation of homeowners,” President Franklin D. Roosevelt believed, “of people who own a real share in their land, is unconquerable.” Homeownership is not only critical to the economy but provides a critical element of our already fraying civic society; homeowners not only tend to vote more than renters, but they also volunteer more and, as Habitat for Humanity suggests, provide a better environment for raising children.

    On the flip side, high housing prices tend to suppress birthrates. Many of the places with the highest house costs—from Hong Kong to New York, Los Angeles, Boston, and San Francisco—also have very low birthrates. The four U.S. areas ranked among the bottom 10 in birthrates among the 53 major metropolitan areas in 2015. Over time these can have a dampening impact on economic growth, as is clearly seen today in places like Japan and much of Europe, and increasingly here in the U.S.

    It’s time for millennials to demand politicians abandon the policies that have enriched the wealthy and stolen their future. That means removing barriers to lots of new housing in cities and, crucially, embracing Frank Lloyd Wright’s notion of Broadacre Cities, with expansive development along the periphery.

    These new suburbs, like the Levittowns of the past, could improve people’s lives, while using new technology and home-based work  to make them more environmentally sustainable. They could, as some suggest, develop the kind of urban amenities, notably town centers, that may be more important to millennials than earlier generations. One thing that hasn’t changed is the demand for affordable single-family homes and townhomes. But the supply is diminishing—those under $200,000 make up barely one out of five new homes.

    There are some reasons for hope. The soon-to-develop tsunami of redundant retail space will open up millions of square feet for new homes. A move to prefabricated homes, already common in Europe and Japan, could help reduce costs. Certainly there’s potential demand at the right price—ones that young people can reasonably aspire to and then build lives in.

    The alternative is to travel back to serfdom and a society sharply divided between a small owner class and many more permanent rent payers. By then, the American dream will be reduced to a nostalgic throwback in an increasingly feudalized country.

    This piece first appeared in The Daily Beast.

    Joel Kotkin is executive editor of NewGeography.com. He is the Roger Hobbs Distinguished Fellow in Urban Studies at Chapman University and executive director of the Houston-based Center for Opportunity Urbanism. His newest book, The Human City: Urbanism for the rest of us, was published in April by Agate. He is also author of The New Class ConflictThe City: A Global History, and The Next Hundred Million: America in 2050. He lives in Orange County, CA.

  • All Houston Does (Economically) is Win

    Like most big cities that get the nod, Houston has spruced itself up for the Super Bowl, planting flowers and concentrating in particular on the rough stretches between Hobby Airport and NRG Stadium. Yet it’s unlikely the city’s reputation will be much enhanced by the traveling media circus that accompanies these games.

    The last time the city hosted the Super Bowl, in 2004, the Washington Post called it “super ugly.” The website Thrillist recently named Houston “the worst designed city” in America, with the usual kind comments about porn shops near offices, lack of walking districts, fat people and awful traffic. For good measure, 24/7 Wall Street named it among the 25 worst cities in America.

    Casting shade on Houston is nothing new. In his best-selling 1946 travelogue Inside U.S.A., the journalist John Gunther described Houston as having “a residential section mostly ugly and barren, without a single good restaurant and hotels with cockroaches.” The only reasons to live in Houston, he claimed, were economic ones; it was a city “where few people think about anything but money.”

    Gunther clearly did not see a great future for the place, predicting that it would have only a million people by now. In fact, the Houston metropolitan area’s population now stands at 6.6 million with the city itself a shade under 2.3 million. At its current rate of growth, Houston could replace Chicago as the nation’s third-largest city by 2030.

    Why would anyone move to Houston? Start with the economic record.

    Since 2000, no major metro region in America except for archrival Dallas-Fort Worth has created more jobs and attracted more people. Houston’s job base has expanded 36.5%; in comparison, New York employment is up 16.6%, the Bay Area 11.8%, and Chicago a measly 5.1%. Since 2010 alone, a half million jobs have been added.

    Some like Paul Krugman have dismissed Texas’ economic expansion, much of it concentrated in its largest cities, as primarily involving low-wage jobs, but employment in the Houston area’s professional and service sector, the largest source of high-wage jobs, has grown 48% since 2000, a rate almost twice that of the San Francisco region, two and half times that of New York or Chicago, and more than four times Los Angeles. In terms of STEM jobs the Bay Area has done slightly better, but Houston, with 22% job growth in STEM fields since 2001, has easily surpassed New York (2%), Los Angeles (flat) and Chicago (-3%).

    More important still, Houston, like other Texas cities, has done well in creating middle-class jobs, those paying between 80% and 200% of the median wage. Since 2001 Houston has boosted its middle-class employment by 26% compared to a 6% expansion nationally, according to the forecasting firm EMSI. This easily surpasses the record for all the cities preferred by our media and financial hegemons, including Washington (11%) and San Francisco (6%), and it’s far ahead of Los Angeles (4%), New York (3%) and Chicago, which lost 3% of its middle-class employment.

    Voting With Their Feet

    Urbanistas may revile Houston but the metro area’s population has grown more than any other U.S. metropolis in the new millennium, up by 1.2 million between 2000 and 2010. The most recent figures show Houston’s population expanded 159,000 between 2014 and 2015, the most of any U.S. metro area.

    Much of this is a result of people moving from elsewhere, roughly 500,000 net since 2000. In comparison, New York, Los Angeles, Chicago and even the Bay Area have suffered considerable migration losses.

    It may be popular to suppose the new Texans are just a bunch of losers looking for cheap rent and low taxes. But the recent rate of increase in the population of educated 25- to 34-year-old educated people in Houston tops that of the San Jose area, and easily exceeds that of competitors like New York, Los Angeles and Boston. Houston has been getting not only bigger but also smarter.

    Like domestic migrants, foreigners like the idea of jobs, particularly decent paying ones. Since 2000 Houston’s foreign-born population has grown 60%, roughly three times the expansion in New York, San Jose and San Francisco, and more than five times that of Los Angeles or Chicago. In the last decennial Census, Houston ranked second, just behind New York, in total numbers of new foreign-born residents.

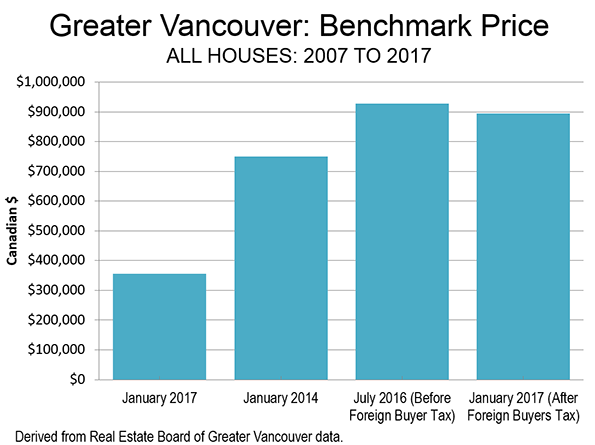
    So, what’s the appeal? Even the most civically minded Houstonians will admit it’s not the weather — particularly the humid, brutal summers — or the topography, which makes a plate seem mountainous. More critical is housing prices. Per demographer Wendell Cox, housing prices in Houston, adjusted for income, are roughly one-third those of coastal California and half those in places like metropolitan New York, Boston and Seattle.

    Houston simply offers a more congenial setting for upward mobility than its more celebrated rivals. The National Association of Home Builders/Wells Fargo Bank Housing Affordability Index finds more than 60% of homes in the Houston metro area are affordable for median-income families, compared with only 15% in Los Angeles, once ground zero for the dream of aspirational homeownership. Overall, when incomes and costs are weighed, Houston ranks at or near the top of places where paychecks stretch the farthest.

    Life After Oil

    Some have predicted that with the fall in oil prices, Houston would experience a sharp decline, repeating the disastrous experience of the early 1980s. The energy sector has lost some 67,000 jobs but the economy has not collapsed. Patrick Jankowski, chief economist for the Greater Houston Partnership, notes that, unlike the early 1980s, overall employment has not declined. To be sure last year’s gains — some 15,000 net jobs — are meager compared to the remarkable 120,000 increase experienced in 2014. This year Jankowski predicts better, but hardly robust growth of nearly 30,000 jobs.

    Though some sectors of the real estate market are clearly overbuilt, notably luxury housing and high end office space, construction remains buoyant, particularly in the lower end of the single family market. David Wolff, one of the area’s largest land developers and former head of the transit agency, Metro, lived through the 1980s crash and frankly expected a harder landing this time. “It’s like being in the middle of a gun battle, and picking yourself up from the floor and being amazed you don’t have a bullet hole,” Wolff says.

    The change in administrations has also boosted confidence. “It is nice to have a president who doesn’t hate your major industry, “Wolff quips. He and others also point to the port, which is booming, the massive and expanding Texas Medical Center and anti-business practices in blue states, such as New York and California, as contributing to the region’s increasing economic diversity.

    Andrew Segal, head of Boxer Properties, one of the city’s leading owners of Class B real estate, sees little decline in either rents or demand for his buildings. Energy may never regain the prominence it once had, he argues, but other sectors have emerged, and the city itself has greatly enhanced its urban amenities, parks, and educational offerings. “It’s getting more diversified like Dallas and cooler like Austin. The ’80s simply did not come back.”

    The Secret Sauce

    My Center for Opportunity Urbanism colleague Anne Snyder suggests Houston’s resiliency stems largely from its culture of openness. One of the most diverse metro areas in the country, Houston long has been accessible for newcomers of all kinds. In contrast to more hierarchical, the planning-oriented regimes elsewhere, she writes, “ creative friction – unchaperoned and prescribed – is Houston’s secret sauce.”

    Low prices and vast landscapes, she notes, allow space for minorities to set up businesses, buy houses, open a dizzying array of shops and restaurants. Houston’s much-maligned strip malls, notes architect Tim Cisneros, are the “immigrant’s friend,” allowing for small businesses to start with lower rents and easy parking.
    Not all Houstonians like the way the place works. Local intellectuals and some in the media have been pushing for the Bayou City to renounce its no-zoning policies and embrace the top-down “smart growth” approach that dominate places like California, Oregon and many areas of the Northeast.

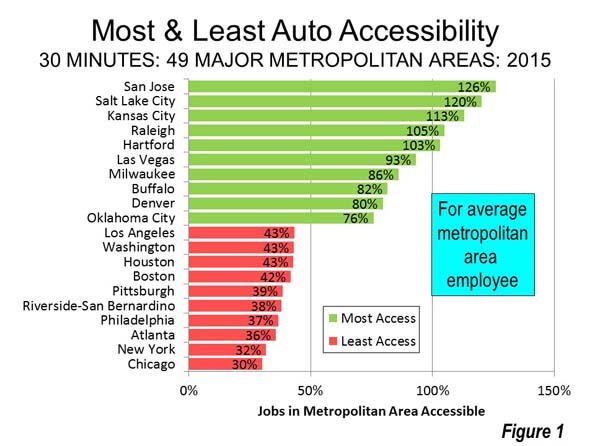
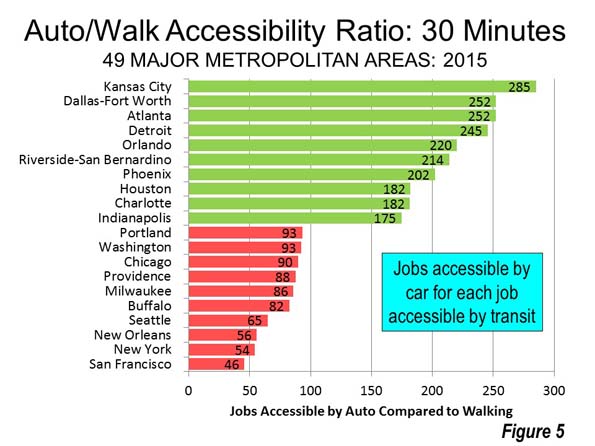
    And to be certain, there are trade-offs. Although there are some promising walkable districts — both in the city and in some of the planned developments on the periphery — most Houstonians rely on their cars to get around, shop and eat at strip malls. And to be sure, entrenched poverty, inequality and inadequate schools remain all too common, but minorities, at least, are far more likely to own a house there than in more regulated places like New York, Los Angeles or Boston.

    Houstonians also show their optimism by making the ultimate bet on the future: children. Per the American Community Survey’s Houston ranks in the top five cities for elementary-age school children per family among the 53 major metropolitan areas, well ahead of places like Chicago, Los Angeles, New York, and San Francisco, which placed 45th.

    Jobs, housing, diversity, and the movement of families have driven Houston’s success. An upbeat attitude, and openness to outsiders, has made Houston a super city, Super Bowl or not.

    Joel Kotkin is executive editor of NewGeography.com. He is the Roger Hobbs Distinguished Fellow in Urban Studies at Chapman University and executive director of the Houston-based Center for Opportunity Urbanism. His newest book, The Human City: Urbanism for the rest of us, was published in April by Agate. He is also author of The New Class ConflictThe City: A Global History, and The Next Hundred Million: America in 2050. He lives in Orange County, CA.

    Photo: Hequals2henry [CC BY-SA 3.0], via Wikimedia Commons

  • The Real State of America’s Inner Cities

    The New York Times ran a piece in today’s paper about the state of America’s inner cities – and of course Donald Trump. Their conclusion is that the landscape of America’s cities, and of American blacks – the “inner city” is clearly a racially loaded term – is complex.

    I agree with that. I’ve classified America’s cities into three major buckets: elite/vertical success cities like New York, workday/horizontal success cities like Dallas-Ft. Worth, and struggling cities like Youngstown or Flint.

    There’s no one size fits all model of cities. Some cities like New York indeed have become amazingly successful. But it’s also true that many post-industrial cities remain in terrible shape.

    Even within the successful cities, there are immense divisions. Chicago is booming in its downtown and North Side. But the South and West Sides are seriously struggling.

    Black America also has a complex landscape. Highly educated blacks are doing very well. It’s an under-reported story that upscale suburbs like Carmel, Indiana and Overland Park, Kansas are seeing strong black population growth and population share growth, although the totals in both cases remain modest. Cities like Houston, Atlanta, and Charlotte are becoming magnets of black middle class. The black population is also strongly suburbanizing, part of the general trend of the diversification of the suburbs. The South retains a significant rural black population.

    But undoubtedly black poverty remains a big issue, both in cities and in suburbs. Black America as a whole remains far behind white America in economic success. Last I checked, black median household income was around $35,000, compared with $57,000 for whites. The wealth gap was even more stark, with the black household median at only $7,000 compared with $111,000 for whites.

    So the idea that America’s cities are uniformly decayed or that black America is uniformly failing isn’t accurate, but it certainly is true that significant portions are dealing with bigtime problems.

    Where did Trump get his ideas about America’s cities? The media have seemed to suggest he’s simply holding on to outdated 1970s stereotypes. But that seems unlikely. He lives in Manhattan and started building there in the 70s. He knows the difference.

    It’s pretty obvious where Trump got the idea that inner cities and black America are in bad shape. He got it from urban progressives themselves.

    In the last two years the urbanist discourse has been increasingly dominated by racial issues: Black Lives Matter, housing discrimination and segregation, income inequality, and a general arguing that American society is saturated with racism that is the cause of many and pervasive ills in the black community.

    It’s only now, after Trump said basically, “I agree”, that all of a sudden people start talking about this complex, nuanced landscape. Urban progressives need to take an accounting of how they have been talking about things too.

    The idea that Trump is intending to denigrate the inner city is obviously false. He uses the same type of rhetoric about “disasters” and such when talking about white working class industrial and mining towns. His whole point is  that the people in these places are victims of a venal and incompetent elite. He surely means the same thing in describing inner cities.

    The difference is that he found a rhetoric that resonated with working class whites. That same rhetoric is not resonating with working class blacks. What poor whites interpreted as a validation of their worth, many blacks have interpreted as a denigration of their accomplishments in the face of adversity.  Trump will never win the leadership class in cities. But if he’s serious about wanting to help these communities, clearly on his to do list is finding new rhetoric that speaks to the rank and file urban black community in a way that resonates.

    As for the word “carnage,” I don’t know how else to describe what’s happening in Chicago. The global media have been full of front page type stories over the last two years about the horrific violence there, and justifiably so. I agree completely with critics that Chicago’s police department is in dire need of reform. The lack of internal reforms there may explain a lot of the difference in the crime trajectory of Chicago vs. NYC and LA. But the attempts to explain away what’s going on in Chicago – nowhere near historic highs! St. Louis has a higher murder rate! – is unbecoming. It is a legitimate disaster.

    There also does remain an immense amount of work to do on integrating blacks into mainstream American success. One mind-boggling factoid that I saw recently came from Mitch Daniels’ open letter to the Purdue University community.  It says that only about 100 black high school grads a year in the entire state of Indiana have GPAs and test scores at the average level of Purdue freshmen. Last year Purdue only admitted 26 total students of all races from Indianapolis Public Schools.

    Mitch is making it his business to do something about it. Purdue is planning to open its own high school in Indianapolis to try to better prepare black students for college.

    America as a whole needs to do the same. Regardless of who or what is to blame, black Americans, and others left behind in our highly unequal cities, are our fellow citizens whom we should care about as neighbors. Integrating them fully into mainstream success is an imperative.

    Trump isn’t wrong that there are big problems that need to be faced. The challenge I’d put to him is to engage seriously on the many complex structural challenges involved. Some problems – rebuilding water and sewer infrastructure, which is a dire need – really are “simple” problems of engineering and money. Many others like policing are not.

    In the near term, he needs to put his branding, A/B testing, etc. skills to work, and rebuild the way he talks about cities and the black community. That will be one test of how serious he is about rebuilding America’s inner cities.

    Aaron M. Renn is a senior fellow at the Manhattan Institute, a contributing editor of City Journal, and an economic development columnist for Governing magazine. He focuses on ways to help America’s cities thrive in an ever more complex, competitive, globalized, and diverse twenty-first century. During Renn’s 15-year career in management and technology consulting, he was a partner at Accenture and held several technology strategy roles and directed multimillion-dollar global technology implementations. He has contributed to The Guardian, Forbes.com, and numerous other publications. Renn holds a B.S. from Indiana University, where he coauthored an early social-networking platform in 1991.

    Photo: Flint River in Flint Michigan

  • King Tide

    10,000 years ago San Francisco Bay was a dry grassy valley populated by elephants, zebras, and camels. The planet was significantly cooler and dryer back then. Sea level was lower since glaciers in the north pulled water out of the oceans. The bay isn’t that deep so a relatively small change in sea level pushed the coastline out by twelve miles from its present location. Further back in pre-history when the earth was warmer than today sea level was higher. The hills of San Francisco were small islands off the coast of ancient California.

    screen-shot-2017-01-15-at-5-10-06-am

    screen-shot-2017-01-15-at-5-10-51-am

    These cycles play out on a scale we humans can’t perceive in our daily lives. You can think of this process as a larger version of the tides that play out over thousands of years instead of twice a day. There’s absolutely no need to debate human induced climate change. The climate changes all the time with or without us. The real question is how we will adapt over time.

    screen-shot-2017-01-15-at-9-19-21-pm

    screen-shot-2017-01-15-at-9-20-26-pm

    screen-shot-2017-01-15-at-9-21-47-pm

    screen-shot-2017-01-15-at-9-22-13-pm

    In the last century the majority of what was once low lying wetlands around the bay were filled and built upon. Airports, shipping terminals, oil refineries, housing developments, and industrial parks are sitting on landfill just slightly above water.

    screen-shot-2017-01-15-at-2-27-45-am

    screen-shot-2017-01-15-at-2-26-35-am

    screen-shot-2017-01-15-at-2-26-48-am

    We just experienced a king tide. This is a naturally occurring cyclical event that happens whenever the earth, moon, and sun line up in a particular way to create a tide that’s about seven feet higher than usual. In this part of the world king tides tend to arrive a few times a year alongside heavy winter rains. The result is a submerged landscape that at a normal high tide in summer is actually dry land.

    screen-shot-2017-01-15-at-3-33-51-am

    screen-shot-2017-01-15-at-3-45-44-am

    A significant amount of territory would be underwater in a king tide if it weren’t for extensive levees, drainage ditches, canals, and pumping stations that actively manage the hydrology of the built environment.

    screen-shot-2017-01-15-at-4-11-10-am

    screen-shot-2017-01-15-at-4-00-17-am

    screen-shot-2017-01-15-at-4-38-15-am

    screen-shot-2017-01-15-at-4-38-33-am

    So far the engineered solutions are working to plan. But this stuff is expensive to build and maintain. If we skimp or take our eyes off the ball there’s a risk of a breach that would do serious damage to the affected areas. This is California’s version of New Orleans with the added feature of seismic activity to complicate matters.

    screen-shot-2017-01-14-at-7-31-19-pm

    screen-shot-2017-01-15-at-1-27-24-am

    screen-shot-2017-01-15-at-1-28-46-am

    screen-shot-2017-01-15-at-1-28-18-am

    screen-shot-2017-01-15-at-1-29-36-am

    Last summer I was exploring the semi industrial neighborhoods around the airport just south of the city and found myself having a conversation with a hotel manager.

    screen-shot-2017-01-14-at-5-56-28-pm

    screen-shot-2017-01-14-at-5-53-58-pm

    screen-shot-2017-01-14-at-5-48-19-pm

    screen-shot-2017-01-14-at-5-55-40-pm

    Even during ordinary high tides the water level of the canal is about the same as the parking lot. So whenever it rains the drainage system that normally pulls water away from the land works in reverse and canal water is pushed up onto the surface.

    screen-shot-2017-01-14-at-6-40-56-pm

    screen-shot-2017-01-14-at-5-53-32-pm

    screen-shot-2017-01-14-at-5-52-55-pm

    screen-shot-2017-01-14-at-5-53-10-pm

    What’s the difference between a hotel room that remains completely dry vs. a hotel room that has just one inch of standing water on the floor? That’s the difference between $100 a night and $0 per night.

    screen-shot-2017-01-15-at-1-06-27-pm

    screen-shot-2017-01-15-at-1-07-45-pm

    screen-shot-2017-01-15-at-1-07-01-pm

    The management has long responded to the situation by not renting ground floor rooms during the rainy season. That constitutes a seasonal operating loss since any hotel that falls below a 60% occupancy rate loses money. But there isn’t much that can be done. The rooms on the lower level are being renovated so that once the weather clears up the hard surfaces can be thoroughly cleaned and aired out and put back on the market without incident.

    screen-shot-2017-01-15-at-1-36-48-am

    screen-shot-2017-01-15-at-10-37-11-pm

    screen-shot-2017-01-15-at-10-37-39-pm

    Warehouses and industrial sheds in the area have a similar set of challenges. Who exactly wants to store or manufacture things in a facility that gets wet whenever it rains at high tide?

    screen-shot-2017-01-15-at-1-05-37-pm

    screen-shot-2017-01-14-at-7-29-52-pm

    screen-shot-2017-01-14-at-7-29-36-pm

    I was curious why such valuable waterfront land wasn’t redeveloped with new construction that was built with rising tides and earthquakes in mind. Wasn’t the canal a natural feature that could be capitalized upon as a major amenity? Wouldn’t people pay extra to stay at a fancy hotel or live along a landscaped promenade with cafes and shops? It could be really nice, and the real estate market would certainly be able to absorb the required price point. I was told the hotel owner had asked for permission to redevelop the site as a retirement village. Local regulators denied the applications. The city insists that the property remain as it is.

    Over the years I’ve had more than one mayor or city official in different parts of the country explain that each new resident costs the city money in services and infrastructure. What cities desperately need is tax revenue. That’s why we see a proliferation of casinos, premium outlet malls, entertainment complexes, and technology parks. A half assed soggy hotel is better for the city’s bottom line than anything that will burden the municipality with needy residents.

    screen-shot-2017-01-15-at-4-13-00-am

    screen-shot-2017-01-15-at-4-12-28-am

    screen-shot-2017-01-15-at-4-11-57-am

    screen-shot-2017-01-15-at-4-15-58-am

    screen-shot-2017-01-15-at-4-15-23-am

    In the short term there are all manner of temporary quick fixes that can keep this system going. But over the long haul there are only two possible trajectories for these places. One is for huge sums of public money to be spent defending private property. The other is that the structures that currently occupy vulnerable positions will lose value, be abandoned, and gradually slip under the tide. Downtown San Francisco is likely to find the funds to keep back the waves. Will taxpayers really be willing to fortify the old Taco Bell and aging suburban big box store? Toss in an earthquake or two and things could get really interesting very fast. Happenstance is the polite politically neutral term for this kind of triage.

    John Sanphillippo lives in San Francisco and blogs about urbanism, adaptation, and resilience at granolashotgun.com. He’s a member of the Congress for New Urbanism, films videos for faircompanies.com, and is a regular contributor to Strongtowns.org. He earns his living by buying, renovating, and renting undervalued properties in places that have good long term prospects. He is a graduate of Rutgers University.

    All photos by Johnny Sanphillippo

  • Access in the City

    Access for residents to employment is critical to boosting city productivity. This has been demonstrated by researchers such as Remy Prud’homme and Chang-Woon Lee of the University of Paris, David Hartgen and M. Gregory Fields of the University of North Carolina, Charlotte. Generally, city productivity (economic growth and job creation) can be expected to improve more where employment access is better . Access is measured in the number of jobs that can be reached by the average employee in a certain period of time, like 30 minutes.

    Generally, US cities have seen strong productivity gains as they have become more accessible. In 1900, before the broad adoption of the automobile, US gross domestic product (GDP) per capita was $6,900 (2015 dollars). By 1930, when there were 90 percent as many motor vehicles as households in the nation, GDP per capita rose to $10,600. Now, even factoring in the economic reverses of the last decade, GDP per capita is more than five times that amount (Figure 1).

    Further, American metropolitan areas tend to have shorter work trip travel times and less traffic congestion than their counterparts elsewhere. Much of this is due to their more decentralized employment bases than elsewhere in the world, where decentralization has increased at a slower rate.

    Public officials and planners now have been given an important new tool for assessing access and improving metropolitan transportation. Researchers at the University of Minnesota Accessibility Laboratory have been studying accessibility in US employment markets (metropolitan areas) in the most detailed terms yet. The first report, in 2013, was authored by Professor David Levinson (on autos) and since that time Andrew Owen and Brendan Murphy have collaborated with Levinson in reports on autos, transit and walking. These modal reports measures access by the number of jobs that can be reached in a metropolitan area by the average employee in 10 minute intervals (from 10 to 60 minutes).

    This article summarizes access in the 30 and 60 minute travel times in 49 metropolitan areas (Note 1). The 30 minute trip is used because it is close to the average one-way work trip travel time in the United States (26.4 minutes in 2015). The 60 minute trip is used is the longest commute considered.  This “one hour economic circle” has also been adopted in Chinese cities, such as Chongqing for urban area planning, as recommended by former World Bank principal planner Alain Bertaud.

    Access by Automobile

    As one would expect, more jobs can be accessed in the larger metropolitan areas. New York leads, with 2.6 million jobs accessible to the average employee within 30 minutes by auto. New York is closely followed by Los Angeles, only 12 percent lower at 2.3 million. With a population 35 percent below that of New York, and with the worst traffic congestion in the United States, this is a surprising result. The greater dispersion of jobs in Los Angeles certainly helps. In third position, Dallas-Fort Worth surprisingly edges out much larger Chicago, in fourth position. This undoubtedly is the result of DFW’s superior freeway system, which along with its arterial system has resulted in the best traffic congestion in the world for any metropolitan area over 5 million population. Washington (Note 2) and Houston rank fifth and sixth.

    Employment access by autos in 60 minutes is the highest in New York, and Los Angeles, with Chicago third (ahead of Dallas-Fort Worth), probably due to its larger overall labor market (42 percent more jobs than Dallas-Fort Worth). Washington, San Francisco and Dallas-Fort Worth have around 3,000,000 auto accessible jobs (Figure 2).

    Access by Transit

    Transit access is dominated by New York’s 200,000 jobs within 30 minutes access by transit. This is nearly three times that of second place San Francisco. The top five include three of the other metropolitan areas with the largest central business district (CBD or downtown) areas, Chicago, Washington and Boston, while Philadelphia, with the sixth largest CBD ranks seventh. Los Angeles ranks sixth. Seattle, Portland and Denver round out the top ten, well above their 15th, 24th and 21st population ranks. These high rankings may be a measure of their transit system quality, though access by transit is a mere fraction of their auto access.

    New York leads in 60 minute transit access, at more than 1.2 million, followed by Los Angeles, San Francisco, Washington and Chicago (Figure 3).

    Access by Walking

    New York also leads in 30 minute walk access, more than doubling that of second place San Francisco, at 47,300, followed by Los Angeles, Chicago and Washington. New York also leads in 60 minute walking access, at 157,100, followed, again, by San Francisco, Los Angeles, Chicago and Washington (Figure 4).

    Modal Comparisons

    The job accessibility differences between autos and transit are significant. On average among the 49 metropolitan areas, 30 minute access by car is 783,000 jobs, compared to only 18,000 for transit and 7,000 by walking. At 60 minutes, autos reach nearly 1.7 million jobs, compared to fewer than 130,000 for transit and 28,000 by walking. Thus, at 30 minutes, the accessible auto market is 43 times that of transit and 115 times that of walking (Figure 5).

    The ultimate transit city in the United States is New York. There, the average employee can reach 2.6 million jobs by auto in 30 minutes, compared to 205,000 for transit and 157,000 by walking. Auto access in 30 minutes is 13 times that of transit and 56 times that of walking (Figure 6).

    Portland is a metropolitan area often cited for its urban transport policies, especially its extensive light rail system. Further Portland has a comparatively strong, traditional central business district (downtown) and has implemented policies intended to reduce car use and encourage transit and walking as well as increase urban densities. The average Portlander can reach 687,000 jobs in 30 minutes by car, 19,000 by transit and only 7,000 by walking. That’s only slightly better than the national average, with autos providing 37 times the access of transit and 97 times that of walking (Figure 7).

    Raleigh (Note 2) is certainly not a new city, but its explosive growth has given the metropolitan area a post-World War II urban form, with comparatively low density (one-half that of Portland) and very low transit ridership. The average employee in Raleigh can reach 567,000 jobs by car in 30 minutes, compared to 4,500 by transit and 4,300 by walking. Raleigh’s auto access is 125 times that of transit and 132 times that of walking, both higher than the national average (Figure 8).

    Extending Auto Mobility to All

    It is clear from the data that access to an auto provides unique advantages in comparison to transit or walking. Professor Robert Gordon, in his seminal The Rise and Fall of American Growth says that" "Much of the enthusiastic transition away from urban mass transit to automobiles reflected the inherent flexibility of the internal combustion engine—it could take you directly from your origin point to your destination with no need to walk to a streetcar stop, board a streetcar, often change to another streetcar line (which required more waiting), and then walk to your final destination."

    It might be asked, “how can it be that this is so in view of the many billions spent on new urban rail lines?” The answer is that transit cannot be competitive with the automobile in the modern urban area. Professor Jean-Claude Ziv and I concluded that it could take all of an urban area’s gross domestic product each year to build and operate such a system.

    At the same time, transit moves a large share commuters to the largest central business districts in the transit legacy cities. This is an important niche market, but not a large percentage overall.

    With the practical impossibility of replicating auto mobility for people who cannot afford cars, new thinking is needed. One approach could be auto ownership programs, according to Evelyn Bloomenberg and Margy Waller in a 2003 Brookings Institution paper. This could require shifting transit funding priorities toward employment access and the longer term economic growth that would produce.

    Note 1: The latest reports cover 50 metropolitan areas. This article deals with 49, because no transit data was provided for Memphis.

    Note 2: Some metropolitan areas are virtually adjacent to others. This can increase the jobs accessible because there is significant employment outside the metropolitan area, in an adjacent metropolitan area. Examples are San Francisco and San Jose, Washington and Baltimore, and Raleigh and Durham.

    Photo: Suburban Employment Center: Chicago (by author)

    Wendell Cox is principal of Demographia, an international public policy and demographics firm. He is a Senior Fellow of the Center for Opportunity Urbanism (US), Senior Fellow for Housing Affordability and Municipal Policy for the Frontier Centre for Public Policy (Canada), and a member of the Board of Advisors of the Center for Demographics and Policy at Chapman University (California). He is co-author of the "Demographia International Housing Affordability Survey" and author of "Demographia World Urban Areas" and "War on the Dream: How Anti-Sprawl Policy Threatens the Quality of Life." He was appointed to three terms on the Los Angeles County Transportation Commission, where he served with the leading city and county leadership as the only non-elected member. He served as a visiting professor at the Conservatoire National des Arts et Metiers, a national university in Paris.

  • The Brooklynization of Brooklyn

    The New Brooklyn: What It Takes to Bring a City Back
    by Kay Hymowitz

    My City Journal colleague Kay Hymowitz has written a number of great articles on Brooklyn, the borough that is her home. This inspired her to write a great book on the topic of the transformation of Brooklyn called The New Brooklyn.

    It starts with a two-chapter history of the borough from its earliest settlement to the present day, followed by a series of chapters looking at Brooklyn today. This includes the transformation of Park Slope (where she and her husband moved in the early 1980s), Williamsburg, Bed-Stuy, and the Navy Yard.

    But she recognizes that Brooklyn is not all hipster gentrifiers. It is still a borough of immigrants and still too often poverty. A quarter of Brooklyn’s residents are below the poverty line. So she also presents case studies of this other face of the new Brooklyn, including the looking at the Chinese of Sunset Park, the West Indians of Canarsie and the African-Americans of Brownsville.

    There’s a lot of great details in here. For example, that there were once slaves in Brooklyn:

    It’s worth lingering over this jarring fact: when you walk past the fine townhomes and churches of Brooklyn Heights, eat at a pizza joint in Bensonhurst, or wander through the art galleries of Bushwick, you are traversing land once tilled by African slaves – and a substantial number of them, given the small size of the white population.

    Also how NYCHA income limit rules helped segregate public housing that had formerly been at least partially integrated.

    NYCHA residents were required to move out once their income surpassed a certain ceiling. That made sense; public housing was supposed to be for those who couldn’t afford to live in private developments. The problem was that most of those who reached the income ceiling were white. Antipoverty advocates argued that it was only fair to give preference to the most disadvantaged on waiting lists. Perhaps; but as a result, upwardly mobile whites were replaced by poor black refugees both from the South and the cleared slums of other parts of New York.

    There are also some passages that would give Richard Florida the tingles:

    The postindustrial crowd settling in Park Slop had a somewhat different profile from their educated suburban cousins, a profile that continues to dominate gentrified neighborhoods everywhere. They were an artsy-literary bunch; today, we would call them the “creative class”…Whatever the reasons, the original gentrifiers were in conscious retreat from suburban conformity. Though gentrifier tastes have veered back towards mid-century modern, the Tiffany lamps, stained glass and Victorian antiques that the pioneers collected were a far cry from the harvest-gold kitchen appliances and plastic chairs and dishes favored by suburbanites.

    A few of the essays were previously published in City Journal, but the majority of the book is new. The writing is very accessible and not academic. The New Brooklyn provides not just a highly readable look at the current conditions in Brooklyn, but a sense of how we got to where we are. As someone who lacks in-depth knowledge of Brooklyn, I found it very informative.

    You can also listen to Kay talk about her book in a recent episode of the City Journal podcast.

    Aaron M. Renn is a senior fellow at the Manhattan Institute, a contributing editor of City Journal, and an economic development columnist for Governing magazine. He focuses on ways to help America’s cities thrive in an ever more complex, competitive, globalized, and diverse twenty-first century. During Renn’s 15-year career in management and technology consulting, he was a partner at Accenture and held several technology strategy roles and directed multimillion-dollar global technology implementations. He has contributed to The Guardian, Forbes.com, and numerous other publications. Renn holds a B.S. from Indiana University, where he coauthored an early social-networking platform in 1991.