Category: Urban Issues

  • Honolulu’s Money Train

    Honolulu is set to construct an ambitious urban rail project. It’s a $5.125 billion behemoth that this metropolitan area with less than a million residents may not be able to afford.

    Honolulu’s Beleaguered Residents

    Critically, there is plenty of competition for the scarce dollars that Honolulu residents have to spare. The city’s basic infrastructure is in bad shape.

    (Sewer) Water, Water Everywhere: A consent decree signed between local officials and the Environmental Protection Agency requires major upgrades to the sewer system. Sewer overflows are not unusual. Just a few days ago, 51,000 gallon raw sewage spilled into a local stream. The state issued a brown water alert for the entire island of Oahu (which is also the combined city and county of Honolulu), including Waikiki Beach and all other beaches. As of this writing, the brown water advisory has not been cancelled. Just in the last year, the state has reported 17 sewage spills and four brown water alerts. For this to happen in a highly tourist dependent economy is nothing short of astounding.

    More than Leaky Pipes: The city’s water system is in need of major upgrades. From 2004 to 2009, water main breaks were virtually a daily occurrence. In an effort to solve the problem, the city has raised water rates 60 percent in the last five years and plans another 70 percent increase over the next five years. How much more will be required after that is anyone’s guess. "How are people going to make it? I just don’t know" reacted City council Budget Chair Ann Kobayashi.

    Unfunded Government Employee Liabilities: In just three years, unfunded city and county employee pension and retiree benefits have risen from $15,000 to $21,000 per Honolulu household. The state’s actuarial consultant says things are going to get worse. The demographics are skewed against financial control, since people are living longer, and the number of retirees is rising relative to the workers who must pay (most of whom cannot even dream of such rich benefits).   All of this means higher tax bills for Honolulu households.

    High Cost of Housing, High Cost of Living: Honolulu residents already endure the most unaffordable housing  in the nation, with median house prices 8.7 times median household incomes. That is three times Dallas-Fort Worth.  Honolulu’s overall cost of living is also the highest in the nation, outside six metropolitan areas in the greater New York and San Francisco Bay Areas. Honolulu residents pay $1.41 to buy what $1.00 buys in St. Louis, 1.24 for each $1.00 in Austin and $1.21 for each $1.00 in Phoenix.

    Choices: This is not about easy choices. The sewer remediation, water system maintenance, government employee pension and government employee retiree health care benefits are mandatory. The rail expenditures are not.

    The Rickety Rail Project

    Yet the city of Honolulu would tax its residents even more to pay for a 20 mile rail line to empty farmland well beyond the urban fringe. This is a project not unlike the early 1900s land speculation schemes of Henry Huntington in Los Angeles and the Sweringens of Shaker Heights (Cleveland). There is, however, one important difference. The Huntington and the Swearingens bet their own money. Honolulu is betting the money of its taxpayers.


    End of the Honolulu Rail Line

    The city hopes to receive $1.55 billion from the federal government, with local residents left to pay a hefty 70 percent of the cost. This $3.575 billion local share would create the highest tax burden for any urban rail line ever built in the nation, at more than $10,000 per household. But residents should "thank their lucky stars" if that’s all they have to pay, given the history of cost overruns on such projects around the world.

    Stacking the Deck: The Federal Court Challenge: The planning process is being challenged in federal court. The plaintiffs argue that the rail selection process eliminated more cost effective options with biased analysis. This would not be the first time.

    Annie Weinstock, Walter Hook, Michael Replogle, and Ramon Cruz of the Institute for Transportation Development and Policy (with a foreword by Oregon Congressman Earl Blumenaur),  cited circuitous routing of a busway that biased ridership forecasts in favor of light rail for the suburban Washington Purple Line. Weinstock, Hook, Repogle and Cruz refer to a similar "deck stacking technique" that favored an expensive rail project over a busway in the suburban Washington Dulles corridor. They fault local officials more than federal:

    While there is no outright pro-rail bias at the FTA, there is indeed FTA complicity in the rail bias of city and state level mass transit project sponsors. The FTA, when evaluating New Starts and Small Starts project applications, tends to bow to political pressure to favor locally preferred alternatives and ignore certain forms of rail bias by the project sponsors

    Pulling the Plug on Rail? Former Governor Ben Cayatano has filed to run against Mayor Carlisle in the August 2012 election. In announcing his entry, Governor Cayatano said "I will pull the plug on rail." Polls show Mr. Cayetano ahead of both Mayor Carlisle and a third candidate.

    Capital Cost Escalation: A state report indicated that construction costs could rise well above forecast. Every penny above the $5.125 billion capital cost will be the responsibility of local taxpayers. Based upon the international experience, this could easily raise the per household cost from $15,000 to $20,000.

    Ridership Optimism Bias: Echoing general concerns raised by Weinstock, Hook, Repogle and Cruz (above), the state report indicated concern over an optimism bias in the ridership projections. For example, the city expects 60 percent of rail riders to use the bus to get to the train.  This is four times the rate of the largest new rail system built in the nation (Washington’s Metro).  Using the bus to connect to the train makes travel much slower and this factor has often been over-estimated by rail planners. This unrealistic assumption alone could qualify the Honolulu ridership forecast as among the most inaccurate in history.  Fewer riders. more money out of residents pockets.

    A Billion Here, A Billion There: As if all of this were not enough, a report for the Federal Transit Administration, obtained by the Star Advertiser through a freedom of information request, indicates that the operating costs of the transit system may be understated by as much as $1 billion over the next 20 years. That’s $3,000 per Honolulu household (Note 1).

    Federal Doubts: Federal Transit Administration Regional Administrator Leslie Rogers expressed concern about Honolulu’s ability to afford the project in a letter to local officials, noting that the funding program is insufficient. Local taxpayers likely will need to pony up more.

    Debt Limit Suspended: After having claimed it could afford the rail debt, the city suspended its debt limit — a fact discovered four months after the fact by the Star Advertiser.  Usually, breaches of trust like this become evident only much later in the rail construction process. A suspended debt limit means more money out of taxpayer pockets, or worse. Jefferson County, Alabama filed bankruptcy after not being able to afford payments on its sewer debt.

    How Would Rail Change Honolulu

    With rail, Honolulu there are two ways that Honolulu will be changed:

    What Will Change: Walling Off the Waterfront. The elevated design of the rail system is so intrusive that the local chapter of the American Association of Architects opposes the proposal. The elevated line would run directly in front of the waterfront. Its oppressive design would separate the rest of the historic Aloha Tower area from the rest of the city and could preclude future attractive "placemaking" development (see lead photo, courtesy of the Honolulu Chapter of the American Institute of Architects).

    No Traffic Relief: Despite being only the 52nd largest metropolitan area in the nation, Honolulu has the second worst traffic congestion in the nation (see figure), according to INRIX, the leading international reporting source. Honolulu and Los Angeles are the only US metropolitan areas ranked in the worst 25 out of 200 in Western Europe and the United States. Even with the rail system, local plans call for traffic congestion to get worse.

    Getting the Choices Right

    Incumbent Mayor Peter Carlisle recently returned from a Potemkin Village tour of Manila, raving about that city’s rail system. Governor Cayateno, whose familiarity with Manila extends well beyond a scripted tour, called Mayor Carlisle’s comparison with Manila "comedic," noting that most residents cannot afford a car or that Manila has more than 10 times as many people.  


    Manila Rail System: Part the Mayor Did not See

    The mayor may not have been aware that more than 4,000,000 – more than one-third – of Manila’s (National Capital Region) residents live in slums, shantytowns and informal settlements, where sewers are rare if not non-existent. Government projections indicate that the slum population will rise to 9,000,000 by 2050. More than one-half of Manila’s population will be in slums.


    Manila Slum

    In his recent "state of the city’" address, Mayor Carlisle mused "Manila without rail transit would be unthinkable." That may be the view of an itinerate visitor, but not of the majority who never ride it. For millions, a Manila with sewers is unimaginable. First world urban areas all have sewers. But many do not have rail systems. Honolulu could use some genuine prioritization and less contempt for the hard earned income of its residents.

    Wendell Cox is a Visiting Professor, Conservatoire National des Arts et Metiers, Paris and the author of “War on the Dream: How Anti-Sprawl Policy Threatens the Quality of Life

    —–

    Note 1: Illinois Senator Everett McKinley Dirksen, who was minority leader of the United States Senate in the 1960s is reported to have said: "A million here, a million there, pretty soon, you’re talking real money." The line has been often repeated, though the rise in government spending is indicated by the inflation from "millions" to "billions."

    Note 2: Manila’s rail system serves a very small market and represents a small share of transit ridership. The latest available data suggested that barely five percent of transit ridership was on rail.

    Top Photo: Visual of rail system in downtown Honolulu (courtesy of American Institute of Architects, Honolulu Chapter) 

    Photo credits: All others by author

  • The Ultimate Houston Strategy

    Last week was the 7th anniversary of my blog, Houston Strategies. After 947 posts (cream of the crop here), almost half a million visitors, and thousands of comments in an epic dialogue about Houston, I thought this would be a good time stand back, look at the big picture, and ask "What should be next for Houston?" while linking back to some of the gems from that archive.


    First, let’s look at where we are currently. Our foundation is in great shape. Houston has started the 21st-century with a set of rankings and amenities 99% of the planet’s cities would kill for: a vibrant core with several hundred thousand jobs; a profitable and growing set of major industry clusters (Energy, the Texas Medical Center, the Port); the second-most Fortune 500 headquarters in the country; top-notch museums, festivals, theater, arts and cultural organizations; major league sports and stadiums; a revitalized downtown; astonishing affordability (especially housing); a culture of openness, friendliness, opportunity, and charity (reinforced by Katrina); the most diverse major city in America; a young and growing population (fastest in the country); progressiveness; entrepreneurial energy and optimism; efficient and business-friendly local government; regional unity; a smorgasbord of tasty and inexpensive international restaurants; and tremendous mobility infrastructure (including the freeway and transit networks, railroads, the port, and a set of truly world-class hub airports). 

    To those I’d add:

    With all that, it’s really easy to get complacent. In fact, in some ways I think we might be coasting a bit now. But coasting is definitely not how we got here. Big initiatives are a proud tradition here: dredging the original port, founding the Texas Medical Center, establishing the Johnson Space Center, and being the first in the world to build a gigantic, futuristic, multi-purpose domed stadium – just to name a few examples. But what should be next? Where should the world’s Energy Capital put its energy, so to speak?

    I was recently inspired by the Urbanophile’s post on Indianapolis’ 40-year economic development and tourism strategy built around sports. Starting with nothing but the Indy 500 they’ve built a string of wins all the way up to hosting one of the most successful Super Bowls ever last month. We need that same sort of sustained, long-term strategy that goes beyond specific projects to a theme we can weave into everything we do over the decades ahead. We need to take the energy boom we’re currently enjoying and invest it to secure our long-term prosperity no matter how technology shifts in the future (most especially energy technology).

    In an unpredictable world, the only safe bet is a talent base that can adapt. With the Texas Medical Center, we concentrated health care talent in a district that has grown and adapted into the largest medical concentration in the world with an array of world class facilities. We’ve done the same on an even larger scale with energy and engineering talent. The next step is to take that strategy and generalize it to focus on being the global capital of applied STEM (Science/Technology/Engineering/Math) talent. We need to mobilize the city around a common purpose of building this human infrastructure. We need to embed it into our education, tourism, cultural and economic development strategies. It’s just a perfect fit for Houston on so many levels:

    In particular, I think we should focus on applied STEM – systems-based problem solving (engineering) over pure knowledge (where we are at a competitive disadvantage with many university clusters around the country). Facilitating man’s progress through innovative problem solving.

    Part of this strategy includes tourism, articulated in more detail here. We need the big tourism experience of other world class cities, and STEM is a unique niche we can build around, with a primary focus on families, schools, and STEM-related conferences. We already have some of the assets in place – JSC and Space Center Houston, the Natural Science Museum, the Health Museum, the Children’s Museum, Moody Gardens – and others with more potential, like the Texas Medical Center. But we need that signature attraction: the world’s largest institute/museum of technology. Not just a history-focused museum, but an institute actively involved in the community with a strong focus on the future. Local kids should spend frequent school days and summer camps there on fun and inspiring STEM activities. It could provide educational STEM experiences both online and on-site, helping to attract talented global youth to Houston for amazing experiences that draw them back later for college or after graduation. It should have the world’s largest hackerspace. It should be an inspiring space that attracts global academic and professional STEM-related conferences (building on the OTC) – groups trying to solve big problems and contribute to humanity’s progress (imagine a Davos or G8 of STEM…). Each conference could leave behind a new exhibit on its subject area, building the collections over time. And since it has the event space, we might as well open it up to festivals to expose more of our community to that same inspiration.

    The natural place for such an institute is clearly the Astrodome, our historic icon looking for a second life. We should embrace the Astrodome as Houston’s architectural icon like Paris does the Eiffel Tower, New York does the Statue of Liberty or Empire State Building, Rome does the Vatican or Coliseum, and San Francisco does the Golden Gate bridge. It can find a second life as our inspiring cathedral to man’s technological progress (along with some fun mixed in – Robot Rodeo anyone?). Most importantly, it has around a million square feet of space. Here’s how it compares to other top museums:

    But unlike every other museum in the world where exhibits are carved up into a series of halls, almost all of them could be visible in a giant 360-degree panorama while standing on the floor of the Astrodome.  How amazing would that space be?

    The cost, you ask?  Easily in the hundreds of millions.  But if LA can come up with $1.2 billion to build the Getty Museum, I have no doubt that Houston can muster the needed resources.  It’s a tiny fraction of the wealth of Houston’s 14 philanthropic billionaires, much less the broader base of wealth in this booming city.  We can come together to make this happen before the Astrodome’s 50th birthday in 2015, and it can put us on a path to greatness for our bicentennial in 2036 that Houston’s and Texas’ founding fathers could never have imagined.

    We, the citizens of Houston, aren’t the types to get complacent and rest on our laurels.  That’s not the legacy previous generations left us.  It’s time to step forward and tackle our next great challenge.  Are you in?

    Tory Gattis is a Social Systems Architect, consultant and entrepreneur with a genuine love of his hometown Houston and its people. He covers a wide range of Houston topics at Houston Strategies – including transportation, transit, quality-of-life, city identity, and development and land-use regulations – and have published numerous Houston Chronicle op-eds on these topics.

    Photo by telwink

  • Time for Real Solutions to Vancouver’s Housing Affordability Crisis

    Vancouver is in desperate need of new solutions to ease its worsening housing affordability crisis. The 8th annual Demographia housing affordability survey released by the Frontier Centre found that Vancouver has the second least affordable housing market next to Hong Kong. On average, and assuming zero interest, a house in Vancouver would cost the median family more than ten years income. Three years is the threshold after which a market is considered unaffordable.

    Mayor Robertson recently announced the launch of a new task force to tackle the housing affordability crisis. The only way to tackle this problem is to focus on getting more housing units on to the market.

    Much of the debate around housing affordability descends into discussions about manipulating housing prices by freezing out market mechanisms. Rent control used to be a popular remedy, until cities realized that the side effects of the cure were worse than the disease. Two common methods of attempting to tackle housing today are social housing and inclusionary zoning. Social housing has been responsible for creating some of the most crime ridden neighbourhoods in the Western world. There is a reason "the projects" have such a bad name. Yet politicians of all stripes tend to promise more "affordable housing" as they call it, knowing that it will at best benefit a narrow group of people who qualify. Inclusionary zoning—requiring developers to build a specific number of below market rate units in new developments—has been one of the methods that municipal governments have attempted to compensate for this shortcoming. It also misses the point. It fails to bring broad price levels down, since it increases prices substantially for market rate units in the same development. One study from San Jose State University economists found that inclusionary zoning increases the price of market of new homes by $22,000-$44,000 in the median city. That is simply how developers pass off the cost of losing money on affordable units.

    The policies mentioned above ignore the fundamental issue: houses are priced by supply and demand. In a desirable city like Vancouver, prices are bound to be higher than in Omaha, Nebraska, or Saskatoon. But the dramatic price escalation that started in the 90s isn’t beyond the city’s control. There are many ways to get more supply on the market. One of the commendable policies undertaken by the city has been the introduction of laneway houses. These are small units that are hived off from existing houses. They are essentially small secondary suites that back in to laneways. But it won’t be anywhere near enough on its own. Vancouver needs to develop more land. The land is there, but it is off limits to development because of the agricultural land reserve (ALR). That needs to change.

    The ALR serves two purposes. The first is to preserve agricultural land. The benefit from it is contingent on whether the benefits from local agriculture outweigh the costs of taking land off of the market. From a nutritional and an economic perspective that simply isn’t the case. Flash frozen foods are often more nutritious than "fresh" local food, and intensive farming is more economical and sustainable than small scale farming. We would not be able to accommodate anywhere near our current population without industrial agriculture. This justification simply fails.

    The second justification for the ALR is to prevent urban sprawl. In a sense this works, since there is no sprawl development in the ALR. On the other hand, this approach is conducive to "leap frog" development which takes place beyond the growth boundary. It happens anywhere that a growth boundary exists. People commute further for cheaper housing. This is as true in the smart growth Mecca of Portland as it is in Toronto or Ottawa. From an economic perspective, there are reasons to worry about sprawl. People who move out into cheaper housing on the urban fringe typically pay less property taxes, and often cost municipalities more per capita. But the ALR hasn’t solved this problem. Metro Vancouver outside of the city proper accounted for 87% of the metropolitan area’s growth between 2006-2001. Simply put, the ALR simply hasn’t prevented sprawl.

    In order to balance the concerns of housing affordability and urban sprawl, the city of Vancouver should strike a compromise: open portions of the ALR, but only to high density development. This may not be the optimum solution for families that would prefer to purchase single dwelling homes, but a significant influx of new units would be a countervailing force against runaway home prices. This would also put downwards pressure on housing in the rest of Greater Vancouver. Though opening up broad swaths of the ALR may be the ideal, this seems like a reasonable compromise.

    This type of solution would rile people on both sides of the political spectrum, but it would be a dramatic improvement over the status quo. High home prices can only be solved from the supply side. The choice between maintaining the ALR as constituted or opening up portions should be obvious. Infill development can only go so far towards solving Vancouver’s housing crisis.

    Steve Lafleur is a Policy Analyst with the Frontier Centre for Public Policy.

    Downtown Vancouver photo by runningclouds

  • The Evolving Urban Form: Hong Kong

    Hong Kong has experienced its slowest decadal growth in at least 70 years, according to the results of the recently released 2011 census. Between 2001 and 2011, Hong Kong added only 5.4 percent to its population, a decline of more than two-thirds from its 1991-2001 rate. Hong Kong’s slowest growth rate since 1921-1931 was between 1981 and 1991, when 13.8 percent was added to its population. In previous decades growth had been much greater (Figure 1).

    Further, despite Hong Kong’s much larger population base today, the numeric growth from 2001 to 2011 was also the smallest since the 1921-1931 decade. Hong Kong added 363,000 residents for a total of 7,072,000 in 2011. The increase is barely one-third of the 1,034,000 residents added between 1991 and 2001. Much of Hong Kong’s population growth in the last 60 years had been driven by its better standard of living relative to mainland China. It seems likely that the growing prosperity of the past decade on the mainland has made Hong Kong less attractive for migrants.

    High Income World’s Most Dense Urban Area: Hong Kong continues to be the densest major urban area in the high-income world. The present density is estimated at 67,000 per square mile (26,000 per square kilometer). At least one small area of Hong Kong has a population density exceeding 1 million per square mile (400,000 per square kilometer), though the much more dense Kowloon Walled City (estimated at up to 5,000,000 per square mile or 2,000,000 per square kilometer) was demolished in the 1990s. Even so, there are now detached housing developments, as Hong Kongers who can afford it choose these much more expensive accommodations, as Witold Rybczynski relates in a recent commentary (detached housing photo).

    Detached Housing

    Subdivisions of Hong Kong: The Hong Kong Special Administrative Region (HKSAR) is a unified government, with no local jurisdictions (such as cities or towns).  However, there are four broad regions and within each there are districts, are designated for statistical purposes.

    Hong Kong’s growth — like that of most major metropolitan areas — has been shifting to the periphery for decades (Table 1). Between 1981 and 2011, all of the population growth was in the New Territories, the new (greenfield and high density) suburban areas beyond the Hong Kong Island-Kowloon core. While all of Hong Kong was adding 2.1 million residents in total between 1981 and 2011, the New Territories added 2.4 million (Table 2). This suburban dominance continued in the last census period, with 96 percent of growth in the New Territories. Before that, the bulk of the growth was in the outer areas of Kowloon, which were then the suburbs (Figure 2).

    Table 1
    Hong Kong Population by District: 1911-2011
    Year Total Hong Kong Kowloon New Territories Marine
    1911 456,700 244,300 69,400 81,200 61,800
    1921 625,200 347,400 123,400 83,200 71,200
    1931 840,500 409,200 263,000 98,200 70,100
    1941 1,600,000 Estimate: No complete census
    1951 2,013,000 Estimate: Census cancelled
    1961 3,129,600 1,004,900 1,578,000 409,900 136,800
    1971 3,936,600 996,200 2,194,800 665,700 79,900
    1981 4,986,600 1,183,600 2,449,100 1,304,100 49,700
    1991 5,674,100 1,251,000 2,030,700 2,374,800 17,600
    2001 6,708,400 1,335,500 2,024,000 3,343,000 5,900
    2011 7,071,600 1,270,900 2,108,400 3,691,100 1,200
    Sources:
    Government of Hong Kong
    www.cicred.org/Eng/Publications/pdf/c-c21.pdf
    Table 2
    Hong Kong Population by District: 1991-2011
    Region & District Population: 1991 Population: 2001 Population: 2011 % 2001-2011 Land Area KM2 Land Area MI2 Density KM2 Density MI2
    HONG KONG 5,674,114 6,708,389 7,071,576 5.4% 1,098 424 6,440 16,680
    HONG KONG ISLAND 1,250,993 1,335,469 1,270,876 -4.8% 80 31 15,827 40,991
      Central and Western 253,383 261,884 251,519 -4.0% 13 5 20,089 52,031
      Wan Chai 180,309 167,146 152,608 -8.7% 10 4 15,230 39,447
      Eastern 560,200 616,199 588,094 -4.6% 19 7 31,265 80,976
      Southern 257,101 290,240 278,655 -4.0% 39 15 7,154 18,529
    KOWLOON 2,030,683 2,023,979 2,108,419 4.2% 47 18 45,138 116,909
      Yau Tsim Mong 282,060 282,020 307,878 9.2% 7 3 44,946 116,409
      Sham Shui Po 380,615 353,550 380,855 7.7% 9 4 40,175 104,052
      Kowloon City 402,934 381,352 377,351 -1.0% 10 4 37,849 98,028
      Wong Tai Sin 386,572 444,630 420,183 -5.5% 9 4 44,891 116,268
      Kwun Tong 578,502 562,427 622,152 10.6% 11 4 56,303 145,826
    NEW TERRITORIES 2,374,818 3,343,046 3,691,093 10.4% 971 375 3,801 9,845
      Kwai Tsing 440,807 477,092 511,167 7.1% 22 8 23,427 60,675
      Tsuen Wan 271,576 275,527 304,637 10.6% 61 23 5,019 12,999
      Tuen Mun 380,683 488,831 487,546 -0.3% 84 33 5,773 14,953
      Yuen Long 229,724 449,070 578,529 28.8% 138 53 4,179 10,824
      North 165,666 298,657 304,134 1.8% 137 53 2,215 5,737
      Tai Po 202,117 310,879 296,853 -4.5% 147 57 2,014 5,215
      Sha Tin 506,368 628,634 630,273 0.3% 69 27 9,074 23,501
      Sai Kung 130,418 327,689 436,627 33.2% 136 53 3,201 8,291
      Islands 47,459 86,667 141,327 63.1% 175 68 807 2,091
    MARINE 17,620 5,895 1,188 -79.8% 0 0 0 0
    Data from Government of Hong Kong Special Administrative Region


    The Core: Hong Kong Island: Hong Kong Island, home to one of the world’s most dense central business districts (Central, Western and Wan Chai districts) lost 4.8 percent of its population. All five of the districts on Hong Kong Island lost population, with Wan Chi (of "The World of Suzy Wong" movie fame) suffering the greatest loss, at 8.7 percent).

    The Core: Kowloon: Across Hong Kong harbor (see Star Ferry photograph, top), Kowloon, also a part of the core, gained 4.2 percent, adding nearly 75,000 residents (photo). Even so, Kowloon’s population remains more than 10 percent below its 1981 population. Three of Kowloon’s  five districts gained population, including Yau Sim Mong and Sham Shui Po, which along with the north shore districts of Hong Kong Island are the most intensely developed in the HKSAR.

    Suburban: The New Territories: The New Territories added 10.4 percent to their population (348,000), with seven of the nine districts gaining. The largest gain (63 percent) was in the Islands district, which includes Hong Kong International Airport. Sia Kung, also grew strongly, at 33 percent (see photo). Sia Kung, like nearly built-out Sha-Tin, is conveniently located just over a narrow mountain range from Kowloon and contains considerable amounts of greenfield land for development.

    Kowloon

    Sia Kung

    Yuen Long, home of the new Shenzhen Bridge had the third highest growth rate, at 29 percent. The Islands, Sia Kung and Yuen Long all have all experienced much improved access from extensions to the Mass Transit Railway (MTR) and the former Kowloon-Canton Railway (KCR), which have now merged into the MTR.

    Transportation in Hong Kong: Hong Kong is the most transit dependent major metropolitan area in the high-income world. Mass transit carries 72 percent of motorized trips. Even with the high residential and employment density, the average work trip is approximately five miles each way. Moreover, despite having one of the most effective mass transit systems in the world and extraordinarily high densities, the average one-way work trip travel time is 46 minutes, 18 minutes longer than Los Angeles or Houston. With the highest transit market share in the world and an automobile market share only 1/70th that of Houston, Hong Kong’s density still  produces among the highest levels of traffic congestion in the world — 1.5 times the traffic density of Los Angeles and three times that of Houston (photo).

    Hong Kong Traffic Congestion

    Economic Growth: Hong Kong has experienced strong economic growth for  the last three decades. In 1981, Hong Kong’s gross domestic product (GDP) per capita was one-third below that of the United Kingdom, its then colonial master. Even by this time, Chinese leader Deng Xiao Ping had been so impressed by Hong Kong’s market based economic advance, that he had designated adjacent Shenzhen as a special economic zone. That area has since grown from a fishing village to a population exceeding 10 million, according to the 2010 census. In the intervening years, the Pearl River Delta has emerged as the most populous extent of urbanization in the world, stretching from Hong Kong, through Shenzhen, Dongguan, Guangzhou, Jiangmen, Zhongshan and Zhuhai to Macao. However, because of border controls and the low level of commuting, these remain separate metropolitan areas and  urban areas.

    Hong Kong’s economic growth continued strongly in the middle 1990s, when its GDP per capita exceeded that of the United Kingdom. Hong Kong fell behind in the late 1990s Asian economic crisis, but soon recovered. By 2010, Hong Kong’s GDP per capita had risen to 27 percent above that of the United Kingdom.

    Hong Kong’s economic performance relative to the United States may be even more impressive. In 1980, Hong Kong’s GDP per capital trailed that of the United States by 45 percent. As of 2010, Hong Kong trailed the US by only three percent and according to International Monetary Fund data should pass the United States early in the present decade. Between 2000 and 2010, Hong Kong’s per capita GDP (PPP-2010$) rose more than one-third — only South Korea and Singapore did better among high-income areas, according to International Monetary Fund data. China’s percentage growth rate was  nearly five times Hong Kong’s but in actual dollars Hong Kong’s GDP per capita rose at triple China’s rate. However, should China’s economy slow down, as some analysts suggest, it could be difficult for Hong Kong to sustain this strong growth rate (Figure 3).

    The People’s Republic of China has maintained Hong Kong’s free market economic system, helping assure strong growth. It seems unlikely that either Deng Xiao Ping or Margaret Thatcher imagined that such economic progress would be made when they signed the historic agreement to restore Hong Kong to China in 1984. Nor is it likely they imagined China’s meteoric rise.

    Unique Hong Kong: Hong Kong is the living model of compact development and transit dependence toward which urban planning wisdom strives. However, Hong Kong itself is the outlier of outliers. Hong Kong’s population density — double that of any other high-income world urban area of similar size or larger — would never have approached this level if it had not been separated from China itself by colonization and then the historical complexities of the post-World War II period. Even in its prosperity, the growing urban areas of mainland China are being built at densities averaging no more than one-quarter that of Hong Kong. Hong Kong may be more an accident of history than an exemplar.

    Wendell Cox is a Visiting Professor, Conservatoire National des Arts et Metiers, Paris and the author of “War on the Dream: How Anti-Sprawl Policy Threatens the Quality of Life

    —-

    Photo: Star Ferry, operating between Hong Kong Island (Central) and Kowloon (Yau Tsim Mong). All photos by author.

    Hong Kong district map by Wikipedia user Moddlyg.

  • Don’t Bet Against The (Single-Family) House

    Nothing more characterizes the current conventional wisdom than the demise of the single-family house. From pundits like Richard Florida to Wall Street investors, the thinking is that the future of America will be characterized increasingly by renters huddling together in small apartments, living the lifestyle of the hip and cool — just like they do in New York, San Francisco and other enlightened places.

    Many advising the housing industry now envisage a “radically different and high-rise” future, even though the volume of new multi-unit construction permits remains less than half the level of 2006. Yet with new permits at historically low levels as well for single-family houses, real estate investors, like the lemmings they so often resemble, are traipsing into the multi-family market with sometimes reckless abandon.

    Today the argument about the future of housing reminds me of the immortal line from Groucho Marx:Who are you going to believe, me or your lyin’ eyes? Start with the strong preference of the vast majority of Americans to live in detached houses rather than crowd into apartments. “Many things — government policies, tax structures, financing methods, home-ownership patterns, and availability of land — account for how people choose to live, but the most important factor is culture,” notes urban historian Witold Rybczynski.

    Homeownership and the single-family house, Rybczynski notes, rests on many fairly mundane things — desire for privacy, need to accommodate children and increasingly the needs of aging parents and underemployed adult children. Such considerations rarely enter the consciousness of urban planning professors, “smart growth” advocates and architectural aesthetes swooning over a high-density rental future.

    Just look at the numbers. Over the last decade— even as urban density has been embraced breathlessly by a largely uncritical media — close to 80% of all new households, according to the American Community Survey, chose to settle in single-family houses.

    Now, of course, we are told, it’s different. Yet over the past decade, vacancy rates rose the most in multi-unit housing, with an increase of 61%, rising from 10.7% in 2000 to 17.1% in 2010. The vacancy rate in detached housing also rose but at a slower rate, from 7.3% in 2000 to 10.7% in 2010, an increase of 48%. Attached housing  – such as townhouses –  posted the slightest increase in vacancies, from 8.4% in 2000 to 11.0% in 2010, an increase of 32%.

    The attractiveness of rental apartments may soon be peaking just in time for late investors to take a nice haircut. Rising rents, a byproduct of speculative buying of apartments, already are making mortgage payments a more affordable option in such key markets as Atlanta, Chicago, Miami, Phoenix and Las Vegas.

    Urbanist pundits often insist the rush to rental apartments will be sustained by demographic trends. One tired cliché suggest that empty nesters are chafing to leave their suburban homes to move into urban apartments. Yet, notes longtime senior housing consultant Joe Verdoon, both market analysis and the Census tells us the opposite: most older folks are either staying put, or, if they relocate, are moving further out from the urban core.

    The two other major drivers of demographic change — the millennial generation and immigrants — also seem to prefer suburban, single-family houses. Immigrants have been heading to the suburbs for a generation, so much so that the most diverse neighborhoods in the country now tend to be not in the urban core but the periphery. This is particularly true in Sunbelt cities, where immigrant enclaves tend to be in suburban areas away from the core.

    Millennials, the generation born between 1983 and 2003, are often described by urban boosters as unwilling to live in their parent’s suburban “McMansions.” Yet according to a survey by Frank Magid and Associates, a large plurality define their “ideal place to live” when they get older to be in the suburbs, even more than their boomer parents.

    Ninety-five million millennials will be entering the housing market in the next decade, and they will do much to shape the contours of the future housing market. Right now many millennials lack the wherewithal to either buy a house or pay the rent. But that doesn’t mean they will be anxious to stay tenants in small places as they gain some income, marry, start a family and simply begin to yearn for a somewhat more private, less harried life.

    In the meantime, many across the demographic spectrum are moving not away from but back to the house. One driver here is the shifting nature of households, which, for the first time in a century are actually getting larger. This is reflected in part by the growth of multi-generational households.

    This is widely believed to be a temporary blip caused by the recession, which clearly is contributing to the trend. But the move toward multigenerational housing has been going on for almost three decades. After having fallen from 24 percent in 1940 to barely 12 percent in 1980, the percentage topped over 16 percent before the 2008 recession took hold. In 2009, according to Pew Research Center, a record 51.4 million Americans live in this kind of household.

    Instead of fading into irrelevance, the single-family house seems to be accommodating more people than before. It is becoming, if you will, the modern equivalent of the farm homestead for the extended family, particularly in expensive markets such as California. This may be one of the reasons why suburbs — where more than half of owner-occupied homes are locatedactually increased their share of growth in almost all American metropolitan areas through the last decade.

    Some companies, such as Pulte Homes and Lennar, are betting that the multi-generational home — not the rental apartment — may well be the next big thing in housing. These firms report that demand for this kind of product is particularly strong among immigrants and their children.

    Lennar  has already developed models — complete with separate entrances and kitchens for kids or grandparents — in Phoenix, Bakersfield, the Inland Empire area east of Los Angeles and San Diego, and is planning to extend the concept to other markets. “This kind of housing solves a lot of problems,” suggests Jeff Roos, Lennar’s regional president for the western U.S. “People are looking at ways to pool their resources, provide independent living for seniors and keeping the family together.”

    But much of the growth for multigenerational homes will come from an already aging base of over 130 million existing homes. An increasing number of these appear to being expanded to accommodate additional family members as well as home offices. Home improvement companies like Lowe’s and Home Depot already report a surge of sales servicing this market.

    A top Home Depot manager in California traced the rising sales in part to the decision of people to invest their money in an asset that at least they and their family members can live in. “We are having a great year ,” said the executive, who didn’t have permission to speak for attribution. “ I think people have decided that they cannot move so let’s fix up what we have.”

    These trends suggest that the widely predicted demise of the American single family home may be widely overstated. Instead, particularly as the economy improves, we may be witnessing its resurgence, albeit in a somewhat different form. Rather than listen to the pundits, perhaps it would be better to follow what’s before your eyes. Don’t give up the house.

    This piece originally appeared in Forbes.com.

    Joel Kotkin is executive editor of NewGeography.com and is a distinguished presidential fellow in urban futures at Chapman University, and contributing editor to the City Journal in New York. He is author of The City: A Global History. His newest book is The Next Hundred Million: America in 2050, released in February, 2010.

    Photo by Bigstockphoto.com.

  • Housing Affordability: St. Louis’ Competitive Advantage

    Things are looking better in St. Louis. For decades, St. Louis has been one of the slowest-growing metropolitan areas of the United States. Its historical core city has lost more than 60 percent of its population since 1950, a greater loss than any other major core municipality in the modern era.  Nonetheless, the metropolitan area, including the city, added nearly 50 percent to its population from 1950. The fate of St. Louis has been similar to that of Rust Belt metropolitan areas in the Midwest and East, as the nation has moved steadily West and South since World War II (Note).

    Expensive Housing and Driving People Away: During the past decade, high house prices have driven residents away from areas with better amenities, especially California’s coastal metropolitan areas and metropolitan New York. Between 2000 and 2009, Los Angeles exported 1.4 million domestic migrants, the San Francisco Bay Area 600,000 (San Francisco and San Jose) and San Diego 125,000. New York lost nearly 2,000,000. St. Louis did much better, losing less than 45,000 domestic migrants. On a per capita basis, St. Louis also performed better, losing 1.6 domestic residents per capita to migration, compared to 4.5 in San Diego, 10 in the San Francisco Bay Area and 11 in New York.   This may not sound like an accomplishment, but the St. Louis area has probably not outperformed California in terms of migration since it entered the Union in 1850.

    The big change between the 2000s and previous decades lies in housing price. It is in this period that America became effectively two nations in housing affordability. The major metropolitan areas that experienced that largest housing bubble lost 3.2 million domestic migrants, while those with lesser or no bubble gained 1.5 million. Demonstrating the preference of people for more dispersed surroundings, even more (1.7 million) moved to smaller metropolitan areas. Housing affordability has emerged as a principal competitive factor among metropolitan areas.

    Superior Housing Affordability: This is where St. Louis excels. As of the third quarter of 2011, the median house price was 2.6 times the median household income in St. Louis, according to the 8th Annual Demographia International Housing Affordability Survey, which covered seven nations (the United States, United Kingdom, Canada, Australia, Ireland, New Zealand and Hong Kong, in China). Dividing the median house price by the median household income gives St. Louis an affordability rating (Median Multiple) of 2.6. By comparison the Median Multiple was 4.2 in Portland (60 percent more expensive ), 4.5 in Seattle (75 percent more),  6.1 in San Diego (135 percent more) and 6.9 in San Jose (175 percent more. While other metropolitan areas were reeling from house price increases that still have not returned to normal, St. Louis (and other metropolitan areas, like Dallas-Fort Worth, Houston and Indianapolis) have continued to experience affordable and far more steady house prices (Figure 1).

    Lowest Cost of Living: Affordable house prices are associated with a lower cost of living. St. Louis does very well here. According to the latest data from the US Bureau of Economic Analysis regional price parity program, the cost of living in St. Louis is the lowest among major metropolitan areas (those with more than 1,000,000 population). In St. Louis, the cost of living is:

    • 29 percent less than in New York.
    • 31 percent less than in San Jose.
    • 23 percent less than in San Diego.
    • 19 percent less than in Seattle.
    • 12 percent less than in Portland.

    Things Could Get Better for St. Louis: Moreover, the gap could become larger, especially as governments in California try to outlaw new detached housing, under Senate Bill 375. None of this is good for young households or less affluent households who will have to leave to find housing that meets their desires. Many will need to leave to fulfill their dreams.

    Inevitably, the higher housing costs associated with these policies (called by various names, such as "livability," "smart growth" and "growth management") fall hardest on lower income households (often minorities), who have less to spend, are forced to move away or cannot afford to move in. The consequences were articulated by California’s Hispanic oriented Tomas Rivera Policy Institute (Figure 2):

    While there is little agreement on the magnitude of the effect of growth controls on home prices, an increase is always the result.

    The Secret: Just what did the St. Louis leadership do to improve its competitiveness so much? Nothing. They just stayed out of the way. Unlike their counterparts where house prices exploded, St. Louis officials did not prohibit people from living where they wanted on the urban fringe and they did not force new houses to be built on postage stamp lots. Nor did they adopt land use regulations that drive up the price of land (Figure 3) and, in consequence housing), just as an OPEC embargo would raise the price of gasoline. When the easy money came and lenders were begging households with insufficient resources to take mortgages, the planning embargoes drove up house prices and invited undue participation by speculators who know the difference between a competitive and a rigged market.

    There are positive signs as a result of this affordability advantage. St. Louis has been attracting more young residents. Recent data indicates that St. Louis ranked 15th in high tech job growth out of the 51 metropolitan areas with more than 1,000,000 over the past decade. It would be expected that St. Louis would trail fast growing Seattle, Raleigh and Charlotte and perennial tax consumer Washington. However, St. Louis can be placed better than perennial leaders San Jose, Boston, Portland, Austin and New York. Budding local efforts are aimed at encouraging entrepreneurship, even as California and New York search for new ways to say "no."

    Succeeding by Being St. Louis: The improving prospects of St. Louis are not the result of a taxpayer financed marketing campaign or a payoff from the usual "let’s copy Portland" strategies (or even Cleveland, as one analyst put it a couple of decades ago). St. Louis cannot compete with the weather in the Bay Area, does not have San Diego’s beaches, the mountains near Denver nor the natural beauty surrounding Seattle. But it does have an affordable life style.

    St. Louis can succeed only by being St. Louis. It is a metropolitan area with a great past, and many fine civic institutions, including great parks, sports teams and a world class orchestra. This long laggard Midwestern metropolitan area may face its best competitive prospects since Chicago passed it in population in 1870. Local and state leaders need to stay away from the policies that would dilute St. Louis’ principal competitive advantage, a low cost of living, due to a housing market left to operate without destructive distortion.

    Wendell Cox is a Visiting Professor, Conservatoire National des Arts et Metiers, Paris and the author of “War on the Dream: How Anti-Sprawl Policy Threatens the Quality of Life

    —-

    Photo: Cathedral Basilica of St. Louis (by author)

    Note: This is adapted from a policy study by the author for the Show Me Institute: Housing Affordability The St. Louis Competitive Advantage

  • Commuting in New York City, 2000-2010

    New York City is infamous for congestion and long commutes. At 34.6 minutes, it has the longest average commute time in the United State. The region is also America’s top user of public transportation, with 30.7% of all metro area commutes made by transit. Nearly 40% of all transit commuters in the United States are in the metro New York. As transit commutes generally take longer than driving, one might be tempted to link these facts. But commute times also seem to correlate with city size, and bedevil big cities with limited public transit too.

    New York’s commutes improved a bit over the 2000s, however. The average commute time declined in every borough, in the city as a whole, and in the region. Overall US commute times fell as well, but less than New York’s:


    Source: Census 2000, American Community Survey 2010 1-yr

    In addition to showing the decline, this chart also highlights disparity in commute times between the subareas of New York. Manhattanites have far shorter commutes than those who live in the outer boroughs. In fact, the outer boroughs actually have longer commutes than far-flung outer suburban areas. The areas just outside the urban core of New York are some of the most disadvantaged for regional commuting

    The commute time decline is particularly noticeable when looking at ultra-long commutes, those that are 90 minutes are longer:


    Source: Census 2000, American Community Survey 2010 1-yr

    Here again we see both a decline in long commutes and a higher concentration in the outer boroughs.

    New York also managed to finish out the decade with no increase in traffic congestion. According to the Texas Transportation Institute, the region ended the decade with the same Travel Time Index it had when it started, 1.28:


    Source: Texas Transportation Institute, Urban Mobility Report 2011

    What has caused this?  Firstly, given that the data is collected in surveys with a margin of error, one shouldn’t read too much into any given year’s value. However, the decline was fairly consistently reflected in the later decade surveys and doesn’t appear to be an anomaly of just 2010.

    Assuming some legitimate improvement, one obvious potential explanation is the economy. Metro New York did lose 99,000 jobs in the 2000s. This was only a decline of 1.2% however, which actually bettered the US as a whole. But given the extreme congestion in the region, it clearly could have played a role. Also not to be dismissed are toll increases in the regions, and even potentially changes resulting from 9/11.

    Given the focus of the Bloomberg administration on non-auto forms of transportation, it is also worth looking at changes there.  Public transit usage grew strongly in New York over the decade, with regional trips increasing by 23%.


    Source: Texas Transportation Institute Urban Mobility Report 2011

    This increase is also reflected  an increase in public transportation commuting mode share over the past decade.


    Source: Census 2000, American Community Survey 2010 1-yr

    So should increased public transit ridership get the credit for commute time reductions? To some extent perhaps. But remember that New York has both the nation’s longest commutes and highest public transit ridership. Also keep in mind that public transit commutes are longer than driving commutes. The average commute time in metro New York for those driving alone is 30 minutes. For those riding public transportation it is 51.2 minutes. But transit riders affect drivers too. Public transit saves drivers in the New York area nearly $8 billion per year in congestion costs.  So while public transit can’t be necessarily given the credit for commute time improvements, it’s certainly possible it contributed to them .

    The same is not true, however, for other alternative transport modes. Here is the change in bicycle commuting over the decade:


    Source: Census 2000, American Community Survey 2010 1-yr

    Bicycling gets a lot of press in New York, and while the increases look impressive on a chart like the one above, the reality is that this is a trend that enjoys only a bit more than half a percentage point gain in mode share. Bicycling may be on an upswing, and may be of great help recreationally and for non-commute trips, but it is not yet a major force in commuting.

    Walking is actually far more prevalent than bicycling for commuting in New York. But the mode share for walking actually declined over the decade:


    Source: Census 2000, American Community Survey 2010 1-yr

    While walking is generally seen as a good thing in urbanist circles, some people can end up walking to work simply because they have no other alternatives. People who obtain access to a car, or who are able to use transit to get a job outside of their neighborhood, may in fact be improving their economic prospects. Some people who previously walked may be riding transit or biking to work today. Also, some walkers may have switched to driving. Interestingly, the number of households without a vehicle declined in metro New York, though some boroughs saw increases. The changes are very small, however.


    Source: Census 2000, American Community Survey 2010 1-yr

    Lastly, as you might expect with transit going up, the percentage of commuters driving alone declined nearly across the board in New York, though it increased nationally:


    Source: Census 2000, American Community Survey 2010 1-yr

    In short, New York retains America’s longest commutes and highest public transport usage. But in the last decade there have been increases in public transport commuting and declines in people driving alone, while overall commute times have improved, fewer people with ultra-long commutes, and road congestion has stayed flat. The 2000s were perhaps an unusual decade in America and New York. And the changes are fairly small so far.  The future will tell whether this is the start of a long term trend or merely a short term reversal.

    Aaron M. Renn is an independent writer on urban affairs based in the Midwest. His writings appear at The Urbanophile. Telestrian was used to analyze data and to create maps for this piece.

  • Clues from the Past: The Midwest as an Aspirational Region

    This piece is an except from a new report on the Great Lakes Region for the Sagamore Institue. Download the pdf version for the full report including charts and maps on the region.

    The American Great Lakes region has long been a region defined by the forces of production, both agricultural and industrial. From the 1840s on, the region forged a legacy of productive power, easily surpassing the old northeast as the primary center of American industrial and agricultural might.

    The Rise of the Great Lakes

    Natural forces shaped the region, from its waterways and mineral resources, which made it ideal for industrial development. The lakes themselves are the largest sources of freshwater on the planet; the five lakes together are twice the size of England. This “fresh water Mediterranean” provided an essential pathway for transport between the various regions of the Great Lakes, as well as a connection to the northeast and, through the Saint Lawrence and the Erie Canal, to New York and the Atlantic.

    But more than anything, it has been the people of the Great Lakes that proved its greatest resource. In the early 19th Century, the region’s development was paced by migrants from New England, who brought with them their values of thrift, hard work and a passion for education and self-improvement. Later others, notably Germans and Scandinavians, injected a similar culture of self-improvement to the area.

    Like New England, the Great Lakes, noted author John Gunther, was possessed with a “gadget mind” that sparked the innovations that gave America command of the industrial revolution. Much of the brawn for this came from the poorer parts of Europe — Russia, Italy, and most particularly Poland, which led one observer to call Chicago “a mushroom and a suburb of Warsaw.” By 1920 one third of third of the population of Chicago, Cleveland and Detroit was foreign born.

    Initially based largely on agricultural exports, by 1860 the region had blossomed into an urbanized industrial powerhouse. “All over the Middle West,” wrote historians Charles and Mary Beard, “crossroads hamlets grew into trading towns, villages spread into cities, cities became railway and industrial centers.” The area’s rapid growth sparked great optimism; in 1841 journalist and land speculator predicted that by 1940 Cincinnati would be the largest city in North America and by 2000 “the greatest city in the world.” Cleveland, Cincinnati, Toledo, Milwaukee and most of all Chicago stood at the center of a “web of steel” that marked the region as the world’s preeminent industrial center. It also sparked other innovations, from the auto assembly line and the high-rise building to the mail order catalog.

    This growth cascaded in the early years of the last century. It became the nation’s primary growth engine. Between 1900 and 1920 Chicago added a million people while Cleveland doubled its population and Detroit, epicenter of the emerging “automobile revolution”, grew three fold. In everything from architecture and city planning to literature, the Great Lakes stood at the national, even global, cutting edge.

    A Half Century of Decline

    By the 1970s, the Great Lakes region, including Ontario, accounted for two-thirds of the North America’s automobile production, 70 percent of pig iron and three quarters of its steel. Yet by that time, this close tie to industry was seen not as an advantage but as a curse, driving the region towards precipitous decline.

    By then America was widely seen as entering a “post-industrial era,” and the Great Lakes, the former bastion of the manufacturing economy, seemed the odd region out. Defined as the “foundry” in Joel Garreau’s Nine Nations of North America, it was the only one he identified as in decline. He described the region’s inner cities as “North America’s Gulag Archipelago.”

    Once a magnet for newcomers, the region now took a back seat as a place that attracted domestic or foreign migrants.10 With the exception of Chicago, the Lakes region have continues to lag both in domestic migration and foreign immigrants. Newcomers were reinventing places like Los Angeles, Houston, Miami and New York, but relatively few were coming to Cleveland, Detroit or Cincinnati.

    The Great Lakes cities, also with the sometimes exception of Chicago, also found themselves increasingly regarded as cultural backwaters. Occasional stories of restoration and renaissance made the rounds in the media, but the trend was to greater obsolescence, to becoming permanently “a cultural colony” of the coasts. “To a Californian or a New Yorker,” noted Indiana-based historian Jon Teaford, “Cleveland, Detroit, Indianapolis and Saint Louis were down-at-the-heel, doughty matrons, sporting last year’s cultural fashions.”

    Until recently there has been ample reason to believe this decline would continue. Only nine of the Midwest’s 40 largest metropolitan areas have a higher per capita GDP than the national average. This reflected a deep seated loss of jobs paced by industrial decline but not made up for by gains in other fields.

    During this period the region not only lost many of its industrial jobs but, more pointedly, failed to replace them with the technology and service jobs that grew rapidly elsewhere. As a result, the region’s percentage of the national workforce dropped steadily over the past half century. In 1966, the Great Lakes region possessed one in four jobs in the country; by 2010 that percentage had fallen to less than one in five.

    As a response to the perception of industry-led decline, some Great Lakes leaders sought out other sources of employment and growth. In Detroit, for example, much emphasis was placed on casino development. Michigan’s former Governor Jennifer Granholm, sought to reverse decline by targeting the so-called “creative class” by turning its hard-hit towns into “cool cities.” Across the region, others focused on convention centers, arts attractions such as museums and other entertainment venues as the way to improve their sagging fortunes.

    Seeds of Resurgence
    None of these efforts – although much heralded throughout the 1980s and 1990s – did much to reverse the region’s decline. Notes Jim Russell, author of the widely read Burgh Diaspora website:

    Should Akron start putting more money in skateparks or global warming?

    There are huge problems in spending money in order to attract the geographically fickle. Fads fade and the mobile – largely people under 30 – will move again…Tying up the urban budget with projects aimed at retaining the creative class has its own perils. There is little, if any, evidence indicating that this policy will decrease the geographic mobility of the well-educated. Many cities stuffed with cultural amenities also sport high rates of out-migration. Furthermore, tastes change. “Best places to live” lists change quite a bit from one year to the next.

    Instead, the region’s current rebound is occurring in surprising fashion. The real lure of the Great Lakes lies in its own fundamental advantages: lower housing prices, business climate and perhaps, more importantly, a nascent industrial rebound.

    This can be seen, most importantly, in employment numbers. Starting in the last few years, the area’s share of jobs has remained steady. The highest unemployment rates in the country are no longer concentrated in the Great Lakes region, but in states such as California and Nevada. In many Great Lakes states, unemployment rates have been dropping more rapidly than the national average.

    Critically this resurgence has not resulted in a shift away from industrial growth. Instead, we are witnessing the early stages of what could be a profound increase in both the economic heft and job creation tied to the industrial sector. But the Great Lakes rebound is not merely a cyclical, one dimensional rise; it also includes growth in a host of other sectors, including in the information area and, perhaps even more remarkably, in energy, particularly shale gas.

    At the same time the rise in non-industrial jobs also should testify to the growing attractiveness of the region, particularly for young families. After decades of mass outmigration, the region has begun to achieve a more favorable balance with the rest of country. Outmigration rates for states in the region are at or below national levels.

    Migration in the Midwest, as Russell and others have pointed out, should be regarded more from the vantage point of recruitment, not retention. By promoting its affordability and improving economy, the region could improve its trailing inmigration rates. As people vote with their feet for the region, they are laying down the foundation for the area’s resurgence in the coming decades.

    The Rise of New Growth Nodes

    The Great Lakes demographic and economic turnaround does not mean that growth has occurred in the pattern of the early 20th Century. Instead we see the emergence of a new set of leadership cities. If Akron, Detroit, Cleveland and Chicago paced the region’s early 20th century ascendency, the new “winners” appear to include affordable, attractive cities, many of whom are home to major universities, state capitals and key research institutions.

    These areas have done well in attracting many people from the less successful metropolitan areas of the region. Columbus, for example, evidenced strong growth from the rest of Ohio and other parts of the Midwest, notably Michigan and Illinois. But perhaps more importantly, the area enjoys strong in-migration from those parts of country — notably the Northeast and California — that have traditionally dominated knowledge-intensive industries.

    A similar pattern can be seen in Indianapolis. In recent years, as urban analyst Aaron Renn notes, the Indiana capital has enjoyed “a profile closer to the Sun Belt than the Rust Belt.” It grew its population at a rate 50 percent greater than the national average, and also had strong net inmigration, with almost 65,000 net people deciding to pack up and move to the Indiana capital.

    Already a center of regional culture and services, the area has succeeded as well in attracting new migrants not only from big Midwestern cities such as Chicago, but also from the two coasts.

    By way of contrast, Chicago’s migration patterns look much different than those in Columbus and Indianapolis. Many other regions around the country benefited from people leaving the Windy City than Chicago gained from them. Chicago’s biggest gains have come from other, more troubled Great Lakes regions, while Indianapolis, for instance, has taken advantage of Chicagoans looking for more opportunity elsewhere.

    Behind this shift in migration from the coasts lie many factors, such as taxes and regulations.
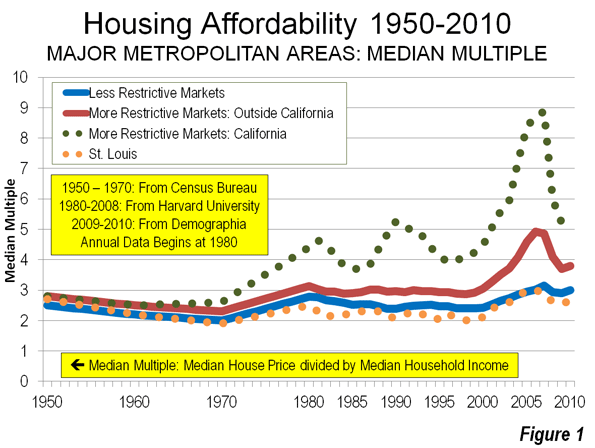
    But perhaps most important may be the region’s greater affordability. Even after the bubble, for example, many key eastern and west coast regions suffer a ratio housing prices to annual incomes of five, six or even seven to one. For the most part, virtually all parts of the Great Lakes have ratios of three or less.

    Over time, this could prove a critical advantage to the Great Lakes. As the current millennial generation – the largest generation in American history – enters their 30s, it is likely that they will seek out places where they can afford to buy a home and enjoy a middle class quality of life. The Great Lakes will be one place that can offer that opportunity.

    Key to recovery: Both Brain and Brawn

    The future of the Great Lakes region lies neither in simply the “information” economy nor in the brute force of manufacturing. Instead it is as a result of a combination both of the industrial sector and the high-value service sectors that feed into it.

    Critically, the region boasts many areas where the information and service economies are particularly strong. Of the nine Midwestern metropolitan areas with per capita GDP growth above the national average, four are capital cities and six are home to major universities. Given governmental involvement in two of the fastest-growing sectors of the economy, health care and education, it is no surprise that seats of government and large state-funded research universities – which also double as the hotbeds of medical services – are growing ahead of other regions with a more traditional, and perhaps outdated, economic base.

    Indeed, some Midwestern areas are outperforming the coastal economies even in the realm of high-tech. In a recent ranking by Forbes magazine of best areas for tech growth among the nation’s 51 largest metropolitan areas, the region boasted three of the top fifteen areas, led by #3 Columbus, followed by Indianapolis and St. Louis.

    However, it would be inaccurate to portray the Midwest as depending purely on a service or information economy. Producing things for sale and export is still alive and well, and the Midwestern regions that have blended their traditional capacity for manufacturing with newer fast-growing sectors of the economy.

    Cedar Rapids, Iowa enjoyed the highest rate of GDP growth from 2001-2010 of any metropolitan area in the Midwest. Between Cedar Rapids and Iowa City, home to the University of Iowa, a new high-tech corridor has grown up that takes advantage of the area’s historical manufacturing capacity and the new technology driven through the university.

    Terre Haute, Indiana, fifth on the list of GDP leaders, reflects even more completely the blending of the “old” Midwest with the emerging one. Manufacturing has held steady as a share of the local economy at about 15.5 percent since 1991, but health and education have jumped from 14 to 17 percent, while wholesale services and agriculture have dropped. Terre Haute is home to Indiana State University and Rose-Hulman Institute of Technology, a regional leader in engineering, science, and mathematics education.

    Peoria, Illinois is second behind Cedar Rapids in GDP growth the past ten years. It is home to more than 200 manufacturing firms, two of the world’s largest earth-moving equipment makers, and coal fields. Peoria is also a leader in college degree attainment in the Great Lakes. While its absolute attainment levels are still low, its college educated population is growing faster than nearly every community in the Midwest. Peoria is one example of how brains + brawn, and not just brains, is the key to Midwestern growth going forward.

    Consider what we might call the dynamic of the Badgers and the Wolverines. In Wisconsin, home of the Badgers, there exists an east-west corridor between Madison, home to the state university and state capital, and Milwaukee, the state’s historical center of industry and commerce. In Michigan, home of the Wolverines, an east-west corridor stretches between Ann Arbor, home to the University of Michigan, and Detroit, the state’s historical center of industry and commerce.

    In Figure 14 we see that both Ann Arbor and Madison have high levels of bachelor degrees compared to the national average. But Madison is leading the Midwest in bachelor degree growth while Ann Arbor rate remains fairly static. Meanwhile, even though Detroit surprises with a fairly high rate of bachelor degree growth, Milwaukee stays in front of the national average in both growth and absolute numbers of college-educated workers.

    Some might say that the Badgers are beating the Wolverines in the knowledge-intensive sectors of the economy, but that the lead manufacturing is up for grabs. But the truth is that the Wisconsin corridor also enjoys positive marks in manufacturing.

    Milwaukee, for example, leads Detroit in the growth of manufacturing jobs. And Madison is emerging as a manufacturing center while Ann Arbor lags far behind. The knowledge economy and the old-time manufacturing economy can work happily together, in the case of Madison Milwaukee, or so far less so in the case of Ann Arbor-Detroit.

    The New Industrial Paradigm

    Despite the attempts to write it off as a spent force, manufacturing will remain a key driver of Midwestern and national growth. Despite the many job losses that impacted this sector over the past generation, American manufacturing remains remarkably resilient, with a global market share similar to that of the 1970s.

    More recently, however, American industrial base has begun to expand and begin to gain on its competitors. This places the Great Lakes in an advantageous position. American manufacturing after a decade of decline has outpaced the overall recovery over the two years, in part due to soaring exports. In 2011 American manufacturing continued to expand even as Germany, Japan and Brazil all weakened in this vital sector.

    Many factors are driving this change. One is a tie to the growing domestic energy industry, which has already sparked growth in the shale areas of eastern Ohio and other parts of the Great Lakes region. The United States together now boast the largest natural gas reserves in the world. In Ohio alone, new finds in the Utica shale could be worth as much as $500 billion; one energy executive called it “the biggest thing to hit Ohio since the plow.”

    The boom in natural gas has already sparked a considerable industrial rebound including the building of a new $650 million steel plant for gas pipes in the Youngstown area.18 Karen Wright, whose Ariel Corporation sells compressors used in gas plants, has added more than 300 positions over the past two years. “There’s a huge amount of drilling throughout the Midwest,” Wright says. “This is a game changer.”

    It also leads to the prospect that as coal-fired plants become more expensive to operate due to concerns over greenhouse gas emissions, the region will have a new, cleaner and potentially less expensive power source.

    Another critical factor has been the rise of wage rates in both Europe and East Asia. Increasingly, American-based manufacturing is in a favored position as a lower cost producer. Concerns over “knock offs” and lack of patent protection in China may also be sparking a “back to USA” trend, something particularly favorable to the Great Lakes region.

    Yet the new industrial base will not resemble old one. We are seeing both an industrial renaissance in the country and one that is heavily concentrated in the Great Lakes region. But it is a resurgence that is as much brain as brawn; an industry increasingly dependent not just on hard work, but skilled labor.

    This pattern cuts across industry lines. Indeed even as the share of the workforce employed in manufacturing has dropped from 20 percent to roughly half that, high skilled jobs in industry have soared 37 percent. Even after years of declining employment, manufacturers in heavy industry, such as automobiles, are running short on skilled workers. Industry expert David Cole predicts there could be demand for 100,000 new workers by 2013. Overall, 83 percent of all manufacturers, according to Deloitte Touche, suffer a moderate or severe shortage of skilled production workers.

    This remains a fundamental strength of the region. Much of the skilled labor base in the nation remains in the Midwest. The region is also home to four of the highest ranked, according to US News, industrial engineering schools in the nation: the University of Michigan at Ann Arbor, Northwestern, the University of Wisconsin at Madison and Purdue.

    Equally important for the region will be replacing the large cadre of skilled workers, many of whom are entering the late 50s and early 60s. “We have a very skilled workforce, but they are getting older,” says Ariel Wright, who employs 1,200 people at three Ohio factories. “I don’t know where we are going to find replacements.”

    For now the very culture of production – often seen as a liability in the past – could prove a key to the Great Lakes’ future resurgence. These advantages are already redounding to the region. Indeed a recent Forbes survey of “heavy metal” industries – that is those involved heavy industry, metals, vehicles and complex machinery – found the region in surprisingly good shape.

    The Milwaukee area, for example, ranked number 2 among the 50 metropolitan areas on the list, while Detroit clocked in with a respectable 6 placed finish. Cincinnati, Kansas City and Cleveland all ranked well within the top 20. In all, the 40 Great Lakes metropolitan areas added 50,000 heavy metal industry jobs since 2009.

    Looking Forward

    For the first time in a generation, the Great Lakes are experiencing demographic and economic trends in their favor. Yet in everything from migration to industrial growth, the region can expect to face strong competition from other areas, most notably Texas, the Southeast, the Great Plains and the Intermountain West for new jobs and production.

    To meet this challenge, and truly take advantage of improved conditions, the region must develop a strategy that is suited to its particular advantages. There is no need to try to compete with Manhattan on urban chic, with Silicon Valley in high-tech startups or with Hollywood in entertainment – as some growth theorists would likely recommend.

    The Great Lakes needs to focus primarily on those very values of production and community that sparked its original ascendance. Once these are identified and strengthened, the region can once again not only rebound, but define its own space in the national and global economy.

    Perhaps the first priority has to do with education. The Great Lakes has an enormous edge in terms of first-class engineering schools, and needs to become more focused on these programs and those associated with them, including the information sciences. It needs to supplement this focus on the top echelon with a greater effort — as we can now see in Ohio — in training more of the skilled workforce desperately needed for the region’s resurgent manufacturers.

    By 2018, 63 percent of the nation’s jobs will require some type of post-high school training credential. Increasingly successful education programs have to focus on aligning with jobs available within a state or region. This can only occur with explicit cooperation between education, government, and the business community.

    Likewise, business collaboration with universities can boost the amount and the impact of industry R&D investments that fosters innovation. University-based research and technology development can yield fast-growing, high-technology firms that create higher-paying middle skill and professional, scientific and technical jobs.

    The second priority lies in developing critical infrastructure to keep the region’s economy humming. This includes a greater emphasis on developing energy resources, rebuilding and modernizing the freight rail, waterways and ports, as well as highways that connect the Great Lakes to the rest of the country and the world.

    In the modern economy, creating economic advantage also includes paying attention to specialized infrastructure such as university and lab facilities, technology and training centers, multi-modal shipping and logistics facilities, and research parks. These infrasystems – integrated fusions of facilities, technology and advanced socio-technical capabilities – can drive innovation, particularly for future higher-value industries and higher-paying jobs. The full range of today’s infrastructure assets is shown in the figure below.

    Third, and perhaps most important, the region needs to maintain the housing affordability and other quality of life attributes critical to attracting both immigrants and domestic migrants. As Millennials enter their 30s in large numbers over the next decade, the region needs to improve its public schools, parks and other amenities to attract them.

    Ultimately, this represents a distinctly common-sense means to overcome a legacy of failure and create a new paradigm of success for the region. The Great Lakes, rather than trying to arrest its decline by completely running away from its past, can now recover the great sense of potential so evident in its heroic history.

    Download the full pdf version of the report, including charts and maps about the Great Lakes Region. The report was authored for the Sagamore Institute with support from the Lynde and Harry Bradley Foundation.

    Joel Kotkin is executive editor of NewGeography.com and is a distinguished presidential fellow in urban futures at Chapman University, and contributing editor to the City Journal in New York. He is author of The City: A Global History. His newest book is The Next Hundred Million: America in 2050, released in February, 2010.

    Mark Schill is Vice President of Research at Praxis Strategy Group, an economic development and research firm working with communities and states to improve their economies.

    Ryan Streeter is Distinguished Fellow for Economic and Fiscal Policy at the Sagamore Institute. You can follow his work at RyanStreeter.com and Sagamoreinstitute.org.

    Photo courtesy of BigStockPhoto.com.

  • The Evolving Urban Form: Moscow’s Auto-Oriented Expansion

    Moscow is bursting at the seams. The core city covers more than 420 square miles (1,090 kilometers), and has a population of approximately 11.5 million people. With 27,300 residents per square mile (10,500 per square kilometer), Moscow is one percent more dense than the city of New York, though Moscow covers 30 percent more land. The 23 ward area of Tokyo (see Note) is at least a third more dense, though Moscow’s land area is at least half again as large as Tokyo.

    All three core areas rely significantly on transit. Muscovites use the Metro at about the same rate as New Yorkers use the subway, taking about 200 trips each year. Tokyo citizens use their two Metro systems at nearly 1.5 times the rate used in Moscow.

    But there are important differences. Moscow officials indicate that approximately two-thirds of Moscow’s employment is in the central area. This is a much higher figure than in the world’s two largest central business districts — Tokyo’s Yamanote Loop and Manhattan — each with quarter or less of their metropolitan employment. Both New York City and Tokyo’s 23 wards have extensive freeway lengths in their cores, which help to make their traffic congestion more tolerable.

    Moscow’s arterial street pattern was clearly designed with the assumption that the dominant travel pattern would be into the core. Major streets either radiate from the core, or form circles or partial circles at varying distances from it. In New York City and Tokyo’s  23 wards there are radial arterials, but,the major streets generally form a grid, which is more conducive to the cross-town traffic and the more random trip patterns that have emerged in the automobile age.

    Moscow has become much, more reliant on cars,  following the examples of metropolitan areas across Europe. The old outer circular road, which encloses nearly all of the central municipality, was long ago upgraded to the MKAD, a 10 lane freeway as long as Washington’s I-495 Capital Beltway (65 miles or 110 kilometers). The MKAD has become a primary commercial corridor, with large shopping centers and three nearby IKEAs.

    It is not surprising, therefore, that traffic congestion and air pollution became serious problems in Moscow. The road system that had been adequate when only the rich had cars was no longer sufficient. The "cookie-cutter" apartment blocks, which had served Iron Curtain poverty, had become obsolete. The continued densification of an already very dense core city led to an inevitable intensification of intensification of traffic congestion and air pollution.

    Transit-oriented Moscow was not working, nor could "walkability" make much difference. In such a large urban area, it is inevitable that average travel distances, especially to work, will be long. Geographically large employment markets are the very foundation of major metropolitan areas. If too many jobs are concentrated in one area, then the traffic becomes unbearable, as many become able to afford cars and use them. Traffic congestion was poised to make Moscow dysfunctional.

    Expanding Moscow

    The leadership of both the Russian Federation and the city of Moscow chose an unusual path, in light of currently fashionable urban planning dogma. Rather than making promises they could not keep about how higher densities or more transit could make the unworkable city more livable, they chose the practical, though in urban planning circles, the "politically incorrect" solution:  deconcentrating the city and its traffic.

    Last year, Russian President Dmitry Medvedev proposed that Moscow be expanded to a land area 2.3 times as large. Local officials and parliament were quickly brought on board. The expanded land area is nearly double that of New York’s suburban Nassau County, and is largely rural (Note 2). Virtually all of the expansion will be south of the MKAD.

    The plan is to create a much larger, automobile-oriented municipality, with large portions of the Russian government to be moved to the expanded area. Employment will be decentralized, given the hardening of the transport arterials that makes the monocentric employment pattern unsustainable. Early plans call for commercial construction more than four times that of Chicago’s loop.

    At the same time, the leadership does not intend to abandon the older, transit-oriented part of the municipality. Mayor Sergei Sobyanin has voiced plans to convert central area government buildings into residences and hotels, adding that there will be the opportunity to build underground parking facilities as refurbishments proceed. Moscow appears to be preparing to offer its citizens both an automobile-oriented lifestyle and a transit-oriented one. The reduced commercial traffic should also make central Moscow a more attractive environment for tourists, who spend too much time traveling between their hotels and historic sites, such as the Kremlin and St. Basil’s.

    Expanding the Family?

    As Moscow expands, the national leadership also wants the Russian family to expand. Russia has been losing population for more than 20 years. Since 1989, the population of the Russian Federation has dropped by 4.5 million residents. When the increase of 3.0 million in the Moscow area is considered, the rest of the nation has lost approximately 7.5 million since 1989. Between the 2002 and the 2010 censuses, Russia lost 2.2 million people and dropped into a population of 142.9 million. Russia’s population losses are pervasive. Out of the 83 federal regions, 66 lost population during the last census.

    Continued population losses could significantly impair national economic growth. The projected smaller number of working age residents will produce less income, while a growing elderly population will need more financial support. This is not just a Russian problem, but Russia is the first of the world’s largest nations to face the issue while undergoing a significant population loss.

    The government is planning strong measures to counter the demographic decline, increase the birth rate, and create a home ownership-based "Russian Dream". Families having three or more children will be granted land for building single-family houses across the nation., including plots of up to nearly one-third of an acre (1,500 square meters).  Many of these houses could be built in Moscow’s new automobile- oriented two-thirds, as well as in the extensive suburbs on the other three sides of the core municipality.

    Expanding Outside the Core

    While population decline is the rule across the Russian Federation, the Moscow urban area has experienced strong growth. Between 2002 and 2010, the Moscow urban area grew from 14.6 million to 16.1 million residents (Note 3). This 1.3 percent annual rate of increase  exceeds the recently the recently announced growth in Canada (1.2 percent). This rate of increase exceeds that of all but 8 of the 51 major metropolitan areas (Note 4) in the United States between 2000 and 2010.

    While the core district grew 6 percent  and added 41,000 residents, growth was strongest outside the core, which accommodated 97 percent of the new residents (See Table). Moscow’s outer districts grew by nearly 1.1 million residents, an 11 percent increase, and its suburbs continued to expand, adding 400,000 residents, an increase of 10  percent. These areas have much lower densities than the city, with many single-family houses.

    Table
    Moscow Urban Area Population
    2002 2010 Change % Change Share of Growth
    Inner Moscow 701,000 743,000 41,000 5.9% 2.7%
    Outer Moscow 9,681,000 10,772,000 1,090,000 11.3% 70.3%
    Suburban 4,198,000 4,617,000 420,000 10.0% 27.0%
    Total 14,581,000 16,132,000 1,551,000 10.6% 100.0%
    Note: Suburban population includes the total population of each district and city that is at least partially in the urban area.


    Moscow, like other international urban areas, is decentralizing, despite considerable barriers. The expansion will lead to even more decentralization, which is likely to lead to less time "stuck in traffic" and more comfortable lifestyles. Let’s hope that Russia’s urban development policies, along with its plans to restore population growth, will lead to higher household incomes and much improved economic performance.

    Wendell Cox is a Visiting Professor, Conservatoire National des Arts et Metiers, Paris and the author of “War on the Dream: How Anti-Sprawl Policy Threatens the Quality of Life

    —–

    Note 1: The 23 ward (ku) area of Tokyo is the geography of the former city of Tokyo, which was abolished in the 1940s. There is considerable confusion about the geography of Tokyo. For example, the 23 ward area is a part of the prefecture of Tokyo, which is also called the Tokyo Metropolis, which has led some analysts to think of it as the Tokyo metropolitan area (labor market area). In fact, the Tokyo metropolitan area, variously defined, includes, at a minimum the prefectures of Tokyo, Kanagawa, Chiba and Saitama with some municipalities in Gunma, Ibaraki and Tochigi. The metropolitan area contains nearly three times the population of the "Tokyo Metropolis."

    Note 2: The expansion area (556 square miles or 1,440 square kilometers) has a current population of 250,000.

    Note 3: Includes all residents in suburban districts with at least part of their population in the urban area.

    Note 4: Urban area data not yet available.

    Photo: St. Basil’s Cathedral (all photos by author)

  • Unintended Consequences of the Neo-Traditional City Planning Model

    Since the early 20th century, the almost universal adoption of the automobile by US residents has had a profound impact on how we plan and design communities. The widespread use of the auto not only spurred development outside of traditional urban centers, it minimized the need to blend multiple land uses into compact areas.

    In contrast, traditional neighborhood design, especially in the northern Midwest and Northeast, accommodated a microcosm of commerce including grocery, butcher, hardware, tavern, cafe and dining establishments to serve relatively small markets living and working within walking distance of the neighborhood.

    The advent of the automotive age has spurred the development of suburbs outside the urban core that are characterized by carefully separated land uses, especially between residential and non-residential uses. Most cities developed zoning ordinances which created barriers to ‘protect’ residential sanctity. In contrast to this style of development, a new school of thought began to evolve in the early 90s, which followed the principles used to guide urban development prior to the dominance of the automobile.

    Neo-traditional is the favored label for this new school of planning thought; however, the terms Transit Oriented Design (TOD), New Urbanism, Walkable Communities, Smart Growth and Sustainable Communities are also used to identify subcomponents of this form of urban growth. The basic principles behind the neo-traditional movement include:

    • enhanced walkability
    • mixed land uses
    • ease of access to public transit
    • sustainability
    • high density residential
    • defined town/commerce center
    • mixture of housing types

    Each of these principles has merit and plays a valid role in the development decision making process. However, in the dash to adopt the neo-traditional model for suburban development, planners have attempted to create a formula of inflexible planning techniques that establishes a one-size-fits-all model with the goal of curing all of the ills attributed to suburban growth.

    This tactical criteria of the Neo-traditional model, however, can create unintended negative consequences. The criteria to which I refer includes:

    • grid street patterns
    • connectivity to adjacent neighborhoods
    • mixed, non-residential land uses
    • alley access/rear loaded house

    The inflexible application of these tactical criteria enhances opportunities for criminal activities to occur.

    Predictable Criminal Behavior
    To understand how a space can facilitate criminal activity, it is important to understand the relative opportunities and risks perceived in the criminal mind. 

    There are many factors which contribute to criminal activity; however there are four factors a “thinking” criminal evaluates prior to engaging in crimes against property, especially home burglary. The first factor is anonymity; more specifically the ability to engage in a criminal act without being easily identified by potential witnesses. The second factor is the ability to study and evaluate a potential target prior to initiating the specific act. By integrating themselves and their vehicles into a neighborhood’s daily routine, criminals can identify potential targets by determining the occupancy of residences or operating patterns of commercial establishments. The third factor is the ability for a quick, inconspicuous departure which is enhanced by the ability to easily flee the scene via multiple exit routes. The fourth factor is accessibility by car. Certainly some crimes are committed on foot, however a vehicle is predominately used to facilitate a hasty retreat and remove stolen goods from a burglary site.

    Grid Street Patterns
    As early as the 12th century urban design was used to discourage patterns of criminal activity in London. In the 1970s, studies began to document criminal activities and how they were facilitated by the design decisions that shape our everyday environment. The practice of utilizing design decisions to minimize criminal activity became known as “Crime Prevention through Environmental Design” (CPTED).  The CPTED Guidelines were developed through extensive study of criminal activities. I want to stress that environmental design decisions do not cause the criminal activity, but they can facilitate a more accommodating environment for it to occur. Oscar Newman explains in Design Guidelines for Creating Defensible Space how thoughtful design of the places in which we live, work, play and learn as well as the routes which connects them can significantly reduce the occurrence of crime against property. Google lists over 13 million sites on the topic “street design and crime”. Simply stated, communities with greater street complexity (fewer exit routes) and fewer common destinations (land uses which attract non-residents) have lower rates of crime as noted in a study by Daniel Beaverton for the School of Criminology at Simon Fraser University. The grid street pattern combined with high level of connection to adjacent neighborhoods provides maximum opportunities for non-residents to enter and leave a neighborhood with minimal notice.

    Advocates for highly connected neighborhoods contend that dispersing driving patterns over a greater number of neighborhood streets minimizes traffic congestion. However, it also creates a means for non-residents to traverse neighborhoods without undue notice. These dispersed travel patterns also allow potential criminals easy access and familiarization with neighborhoods in which they have little first hand knowledge.

    In Newman’s study for the U.S. Department of Housing and Urban Development, Defensible Space – Crime Prevention Through Urban Design, he notes that criminals seldom conduct their activity in areas not familiar to them.  Newman’s theory concurs with the study prepared by C. Bevis and J. B. Nutter, Changing Street Layouts to Reduce Residential Burglary that burglars tend to victimize areas with which they are familiar.

    Simply put, increased criminal activity is enhanced in communities where transient traffic is encouraged and increased street connectivity allows for ease of access, observation and escape. The practice of merging homes and businesses into a single community to reduce the reliance on the automobile has validity.  However, it also provides anonymity for criminals as they become cloaked within the community. The neo-traditional design relies on straight streets, rectangular blocks and interlinking grids to connect adjacent neighborhoods and provide numerous access and departure points for residents and non-residents. The grid system also provides criminals a means to anonymously cruise their target without detection.

    The consequences of the neo-traditional community design are underscored by the National Crime Prevention Council’s research that shows a correlation between the increase in accessibility for any street segment and the increase in the crime rate. 

    To better illustrate the point, the Los Angeles Metropolitan Area is generally designed on the grid system. The network of streets allows traffic to leave congested roadways and traverse neighborhoods as an alternate route of movement. In 1996, the Los Angeles Police Department studied the effects of roadways on criminal activity, establishing barricades to stop thru traffic in high crime areas. The study concluded “closing thru streets makes offenders escape more problematic”. For the two years after the barriers were put in place drug activity, residential break-ins, drive-by shootings and homicides were reduced by 65%. Many other inner cities’ designs are based on grid patterns, New York City, Denver, Phoenix, Chicago, et al. This design increases the susceptibility to criminal activities in areas where poor maintenance, vacant buildings and low street traffic compound the pattern of crime.

    Common Destinations Attracting Non-Residents
    The principle of multi-use communities may provide a reduction of vehicular traffic, however multi-family and commercial uses draw non-residents into the neighborhood. Convenience stores, clubs and taverns operating well into the night provide a convenient venue for potential criminals to congregate and hang out.

    Land uses which attract individuals from outside the community provide a neutral location to observe the adjacent neighborhoods as well as a cloak of activity for criminals to remain unnoticed.

    Alley Access
    Many neo-traditional communities require alley access behind all single-family dwellings. Although this creates a more aesthetically pleasing streetscape and enhances walkability, it also increases the street permeability and opportunity to observe all sides of the house as a potential target for burglary. Alleys also provide an additional means of escape as well as a venue for criminal activity as its utilitarian design discourages social interaction providing a welcome area to foster and avoid detection for criminal enterprise.

    The current status of neo-traditional community planning is entering a crucial stage. The imposition of planning techniques to shape our future communities is forcing suburban growth into a dictated one-size-fits-all planning model endorsed and promoted at the federal level and enthusiastically supported by many states, local governments and most of academia. Without the flexibility to incorporate factors such as local values, market preferences and geographic character; future communities may result in higher housing costs, limit the selection of housing types while simultaneously enhancing the opportunity for criminal activity.

    Obviously, the negative consequences identified can be mitigated.  However, the key here lies in planning flexibility. Many communities enamored with neo-traditional concepts seek to impose absolute formulaic solutions which offer little flexibility in compliance with the technical standards rather than focusing on achieving the guiding principles which form the basis of the neo-traditional movement.

    Joe Verdoorn, a Principal at SEC Planning, LLC, has over 40 years land planning and development experience working with clients such as Pulte/Del Webb, Motorola, Apple and Hunt Investments.  He is a pioneer in the field of active adult community design who continues to research the retiree market to understand their evolving wants and needs. 

    Photo courtesy of BigStockPhoto.com.