In a mere forty years Orléans has gone from an overwhelmingly French-speaking village to a suburb of Ottawa where scarcely one-third of the population has French as its mother tongue. Nonetheless, the French presence remains vibrant and local francophones are exceptionally dedicated to preserving their language and culture and building on their achievements. No other place in Ontario boasts cultural programs and facilities like those that serve Orléans’ francophone community. The fight twenty years ago to have the provincial government spell “Orléans” with the accent on the “e” is an eloquent example of the community’s determination to stand up for its rights with regional and provincial authorities.
Orléans Today
Orléans has never been a municipality. Originally a village whose loosely defined limits overlapped Cumberland County and the town of Gloucester, it joined Ottawa in 2001. Today Orléans’ three neighbourhoods together form Ottawa’s largest eastern suburb. While not the only Franco-Ontarian suburb, Orléans is certainly the one where tradition and modernity are the most closely melded. The result is a very rich culture that has opened the doors of opportunity to the francophone minority at a time of profound change to the identities and sense of belonging of Franco-Ontarians.
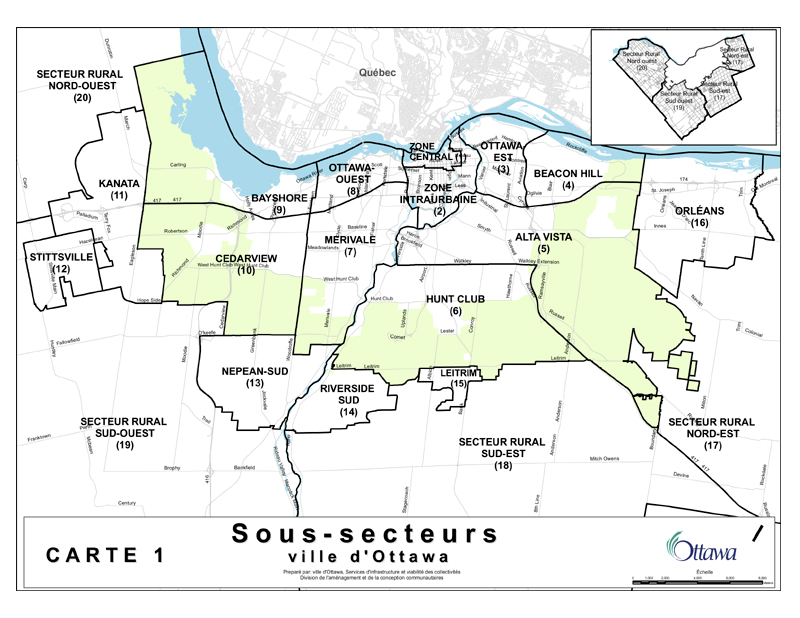
Sub-areas of Ottawa
From Village to Suburb
Since the 1970s, Orléans’ population has exploded: from 6,000 in 1971 it rose to 24,000 ten years later, and by July 1, 2010, the number exceeded 106,000. This dramatic growth transformed land use. Large tracts of farmland were snapped up by developers. They sold new houses to Ottawa residents who dreamed of having a home with a yard offering access to both their city workplaces and to a piece of nature on the outskirts of town. A highway link to downtown Ottawa and the sense of security that came with suburban life added to Orléans’ appeal.
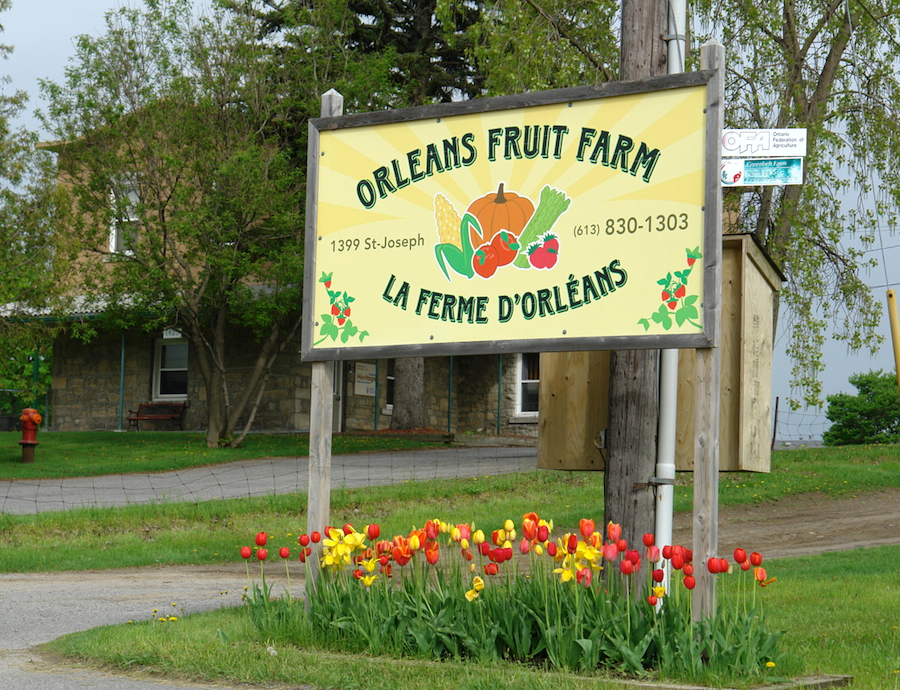
Orleans Fruit Farm, Ottawa, Ontario
The small town of Orléans thus became a bedroom community much like the ones surrounding every major city in the country. The once varied townscape gave way to a suburban sameness: apart from the old village centre and a few taller buildings in the suburb’s outer reaches the same street design, housing style, and landscaping predominate. Despite developers’ best efforts to build “communities,” Orléans’ highly unified landscape reflects the socioeconomic homogeneity of its residents. This suburb is a paradise for middle and upper-middle class families who have found an environment in keeping with their aspirations. In 2005 the average household income in Orléans was $103,792 compared to $85,136 in Ottawa.
Francophones Lose their Majority Status
The recent population explosion altered Orléans’ linguistic makeup. Franco-Ontarians came from both nearby and further afield, drawn by the appeal of a French-speaking suburb. Orléans’ location midway between downtown Ottawa and the French-speaking outskirts of Prescott-Russell only made the area more attractive. Yet Orléans has also drawn anglophones in large numbers. Data from the 2006 census reveal the extent of the anglophone influx, with just 32.4% of the population reporting French as their mother tongue. Francophones and anglophones are spread evenly throughout Orléans: only the area around the former village centre, where institutions catering to francophones are concentrated, is noticeably more francophone than the rest. In a survey by University of Ottawa researchers in the 1990s, francophones stressed that their neighbourhoods were bilingual. In the eyes of its Franco-Ontarian residents, Orléans is a place where francophones and anglophones live side by side. There is no real evidence to suggest that this view has changed.
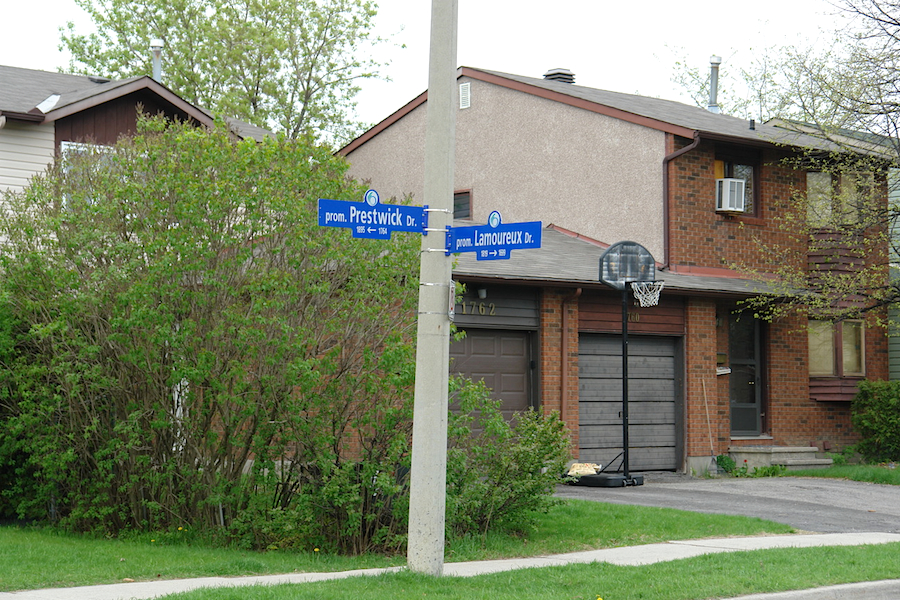
Francophones and anglophones in peaceful coexistence: Prestwick and Lamoureux in the Fallingbrook neighbourhood
New Institutions
In Orléans residents can live in French. The francophone community has established numerous institutions over the years to serve a wide range of community needs. Today Orléans is home to 12 French-language elementary schools, three high schools and a vocational institute that opened in September 2010, as well as many French-language daycare centres. Montfort Hospital will soon open the brand-new Orléans Family Health Hub offering a full range of primary and community healthcare services in both languages. Orléans’ francophones also enjoy access to a wide array of sports, leisure, culture or just plain fun activities en français. For example, around 150 francophone families register their children for soccer with Étoiles d’Orléans, either for the winter season (indoors in the gyms at Étoiles de l’Est and Béatrice Desloges schools) or for the summer (on the field at École les sentiers). This nonprofit organization expressly targets young francophones and offers them a complete team sports experience—including practices, games, tournaments and social gatherings for parents and volunteers—in their own language. Orléans also offers many French-language events at the new Shenkman Arts Centre, programmed by Mouvement d’implication francophone d’Orléans (MIFO).
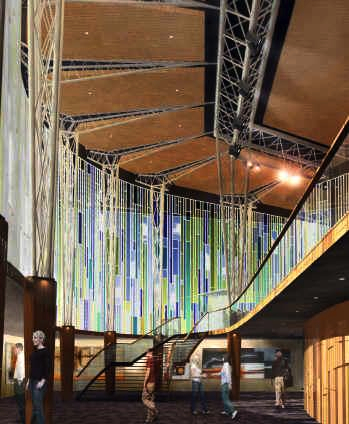
Artist’s rendition of the Lower Lobby Reception Space of the Shenkman Arts Centre
MIFO was created in 1979 by a handful of francophone residents concerned by the influx of anglophones into the suburb. Since then the organization has become the focal point for the francophone community. The cultural centre founded on Carrière Street in 1983 remains MIFO’s nerve centre and home to most activities in addition to a theatre (Théâtre du Village), seniors’ centre (Centre Séraphin-Marion d’Orléans), and bookstore (Librairie du Vermillon). The organization also operates a music school: in 2011 it welcomed over 300 students of all ages and abilities for singing, piano, guitar, bass and recorder lessons. Throughout its existence MIFO has been unflagging in its commitment to promoting French-language culture and its expression in Orléans.
Institutions both old and new—including a new parish of Sainte-Marie d’Orléans which was founded in 1987 and opened a new church in 1998—help shape the francophone social milieu. These institutions are critical to the survival of the francophone community as their surroundings and way of life undergo a fundamental shift.
A Divided Landscape
Saint-Joseph Church, the Chevaliers de Colomb, Caisse populaire Desjardins, and Orléans’ other francophone institutions line Saint-Joseph Boulevard. A good number of francophone professionals (lawyers, accountants, doctors, insurance brokers) also operate in “the village,” as do many francophone-owned businesses, some of which have served customers in French for generations. These businesses help maintain the “village” feel, a living bridge to the rich history of the local francophone community.
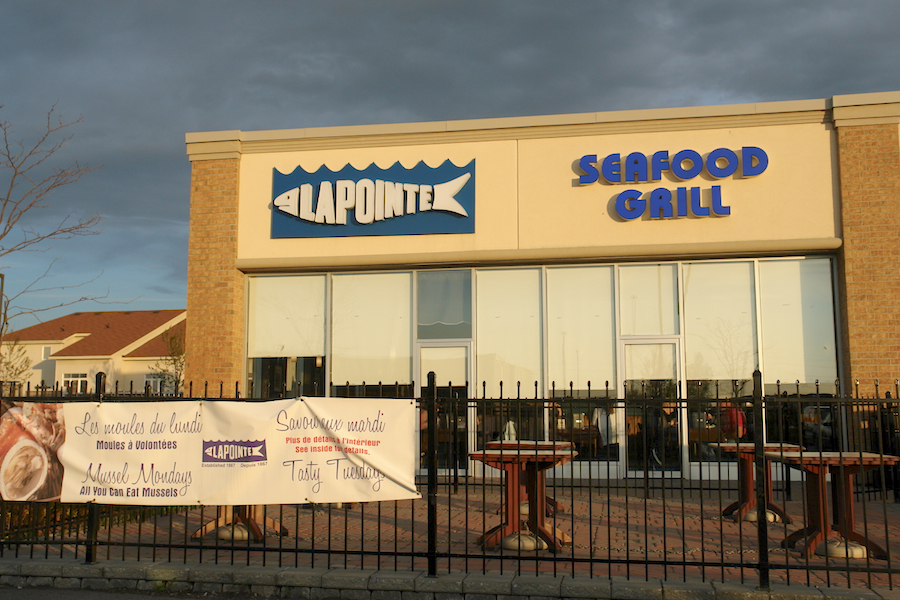
The future for bilingual signs in Orléans looks bright: an example at Lapointe Seafood Grill
Further south, though, a whole other Orléans can be found. Here the traditional and varied face of the older neighbourhoods gives way to the big box stores typical of North-American suburbs. New development is concentrated along Innes Road, a kingdom of mega malls stretching several kilometers from east to west. All the big name stores that have risen to national prominence in the last few years are there, from HomeSense to Rona, Winners to Future Shop. In contrast with the “old village,” the French language is much less visible in this “new Orléans.” Street names, parks and public buildings offer no hint of the French presence, an issue that concerns the newly minted Société franco-ontarienne du patrimoine et de l’histoire d’Orléans. Still, there is life in French on Innes Road, as shown by Caisse populaire Orléans’ decision to open a branch. Lapointe Fish, an Ottawa institution, has also opened a shop in the new Orléans. The Ste Marie Health Centre, home to a number of francophone doctors and pharmacists hailing from other countries, advertises itself as a bilingual facility. Finally, Empire Theatres, a major national chain, hosts the Festival du film francophone d’Orléans, while Objectif cinéma shows two French-language films per month year-round to large audiences.
French Language Signage: An Ongoing Challenge
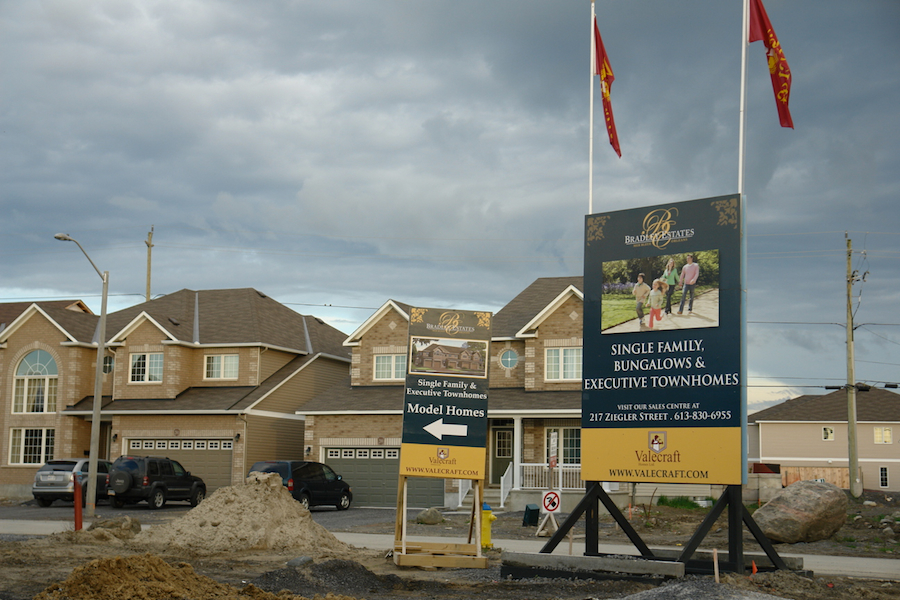
New development
Those who go looking for French-language signs in Orléans face disappointment. The studies are unanimous: French is largely absent from the face of this bedroom community. With the exception of the bilingual signs at federal, provincial and municipal institutions (in the last case, the result of the City of Ottawa’s bilingualism policy), and at various businesses in the old village, unilingual English signage predominates throughout Orléans. No sector is immune, from automotive services to furniture stores to interior decorators to sports and leisure centres—even personal services. The same goes for the stores at Place d’Orléans, a major mall adjacent to the village. Throughout the commercial landscape, only a few businesses (like oil companies) persist in showing a French face to the public.
Not even the Orléans Chamber of Commerce or the developers who so avidly court new residents bother to include French on their signs. Their websites are also in English only, with the notable exception of Brigil, a well-known Gatineau contractor and developer. No one seems interested in promoting the concept of living en français. While many boast of Orléans “quality of life,” it appears that culture is not part of the equation—though some Franco-Ontarians may beg to differ.
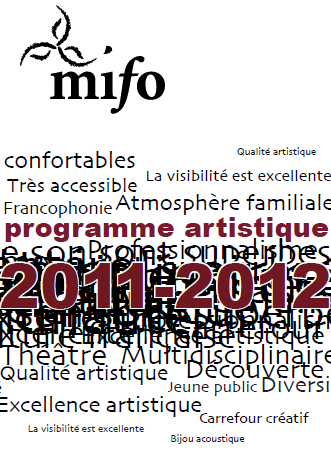
Poster promoting MIFO’s 2011–2012 programming
Living Together, Getting Along
Orléans’ francophones seem unphased by this linguistic imbalance in commercial signage. They have by and large adopted the same behaviours as Franco-Ontarians elsewhere, using French or English depending on the circumstances. Most are so bilingual that they can effortlessly and comfortably pass from one language to another in the course of a conversation. This behaviour attests to a veritable “bilingual identity” that has been described by studies on this community.
While language may be an issue for a number of Franco-Ontarian organizations in Orléans, it is not a bone of contention for them, any more than it is for individual citizens. Orléans is a place where francophones and anglophones live, work and play together in harmony. MIFO, among other groups, has become much less confrontational since 2010 when its new status as a charitable organization forced it to sideline political actions. Orléans exemplifies a new way to live in French in Ontario, one characterized more by a desire to work together with the anglophone majority than to make demands and fight to achieve them.
A Promising Future for a Thriving Franco-Ontarian Community
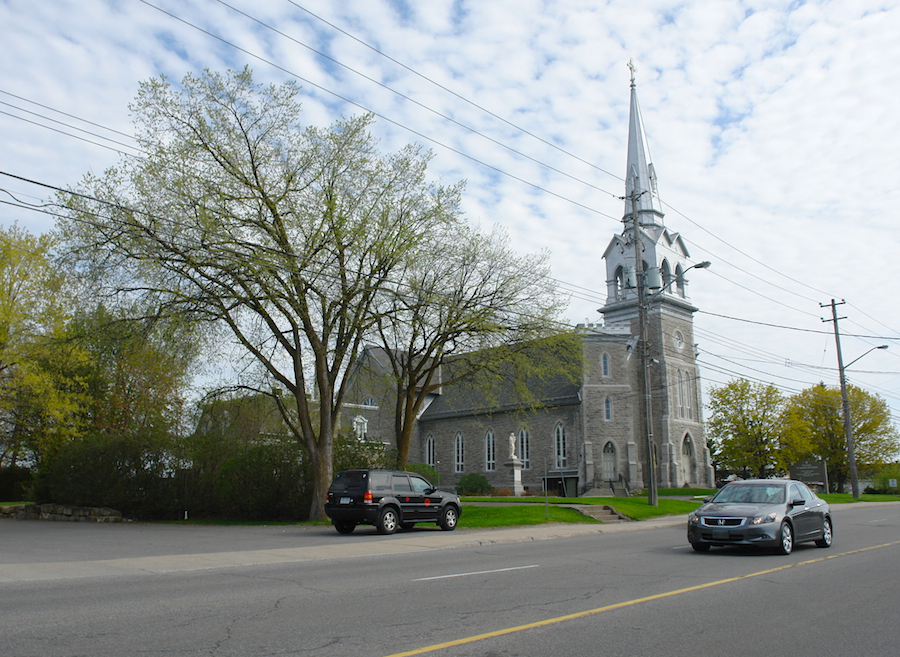
St-Joseph Church in Orléans, a suburb of Ottawa
Orléans is unusual for the diversity of opportunities and elements it makes available to the francophone community, like so many threads that can be woven into a new cultural fabric and identity. On the one hand the suburb abounds in geographical markers reminding francophones of the more traditional side of their identity: their French origins and Catholic past, as well as the sometimes epic battles their parents fought to establish the French-language institutions vital to living their everyday lives in their own language. On the other hand Orléans’ public spaces show the signs of a resolutely contemporary francophone culture and community characterized by openness to others (both francophone and francophile alike) and intercultural exchange. Orléans is attracting an increasing number of francophone immigrants, who in turn are transforming the culture from within. Today, the suburb that was once a village reconciles both sides of this identity, fuelling diverse manifestations of the Franco-Ontarian imagination. In this way Orléans plays an integral role in the renewal of the Franco-Ontarian community and constitutes a clear sign of its bright future.
——–
This piece is courtesy of the Encyclopedia of French Cultural Heritage in North America.
——–
Bibliography
Farmer, Diane (1996) Artisans de la modernité : les centres culturels en Ontario français. Ottawa, Les Presses de l’Université d’Ottawa. Le chapitre 7 porte sur le MIFO, « entre francité et urbanité ».
Gilbert, Anne (1999) Espaces franco-ontariens. Ottawa, Le Nordir. Le chapitre 5, intitulé « Ville et banlieue » est consacré à une comparaison entre Vanier et Orléans.
Gilbert, Anne, sous la direction de (2010) Territoires francophones. Études géographiques sur la vitalité des communautés francophones du Canada. Québec, Septentrion. Le chapitre 5 porte sur le paysage linguistique en Ontario français, avec des allusions à celui d’Orléans. Le chapitre 13 porte sur un éventail de communautés franco-ontariennes, dont Ottawa.
Orléans, 150 ans d’histoire. 1860-2010. Comité du livre du 150e anniversaire d’Orléans, 2010.
Orléans, Publi-reportage Le Droit, 24 novembre 2010
Secteur Orléans, Cahier publicitaire Le Droit, 5 avril 2011