Category: Urban Issues

  • Ground Zero Tolerance: With No Politician Willing to Take Charge, the 9/11 Recovery has Dragged on Far Too Long

    This piece originally appeared in the Village Voice.

    A decade into its unhappy and unexpectedly long life, Ground Zero has undergone its annual if short-lived transformation from New York politicos’ red-headed stepchild to belle of the ball, at least until September 12.

    Governors Cuomo and Christie, among other politicians, have been reportedly jockeying with the mayor for pride of place at the Bloomberg-run anniversary ceremony to score valuable camera time at a charged event that’s valuable to politicians precisely because of its aura of being outside of politics—much as the 40-plus TV specials, complete with “investigations” of twins lost in the twin towers and endless ads featuring terror porn of the planes striking the towers are somehow supposed to be in the “public interest.” The “sacred” site has doubled nicely as a profitable one, as detailed by Graham Rayman in last week’s Voice.

    In a sense, the politicians who will pay tribute this week are benefiting from their own neglect: Except for one week a year, New York’s elected leaders try to have as little as possible to do with Ground Zero. And that’s the main reason why 10 years later and despite a booming real estate market for most of it, there’s still a Ground Zero for them to make pilgrimage to and offer on-air genuflections. The question remains: Once the annual ritual has passed, is there a politician willing to take ownership of Ground Zero?

    In part, the problem has been Giuliani’s big shadow. “American’s Mayor,” who has profited immensely from the unlikely title in the years since, emerged as such a potent symbol in his final days in office that the area’s political leaders turned their attention elsewhere—and let a series of unelected, unresponsive, and unproductive special authorities (read: bureaucrats) take control of the site. Mayor Bloomberg turned his attention to his Far West Side Olympics dream, while a succession of weak governors in New York and New Jersey never managed to leave a mark despite their control of the Port Authority, which owns the site. Bloomberg, whose star has of late been dimmed by two strong new governors, has emerged as the closest thing to a de facto spokesman for the site, while still maintaining some distance from it.

    Absent an elected leader willing to stake his office to the site, a dangerous gamble no one has taken so far—Ground Zero has “progressed” through a series of ill-conceived “master plans”—the Freedom Tower, the Libeskind Master Plan, the insanely pricey Calatrava PATH station, the ever-more-pricey memorial that will finally open on September 11, 2011—that kept the private market from rebuilding even as demand boomed in the low-interest bubble the Fed inflated after the attack in part to dampen its economic impact. It’s no coincidence that the only completed structure at the 16-acre site is private developer Larry Silverstein’s 7 World Trade Center and that the other towers have managed to draw future tenants only through highly subsidized leases for “needy” tenants such as Goldman Sachs. The most glaring example of the absence of leadership, though, was the August 2007 Deutsche Bank fire, which killed two firefighters and seriously injured dozens more after city Housing and Fire inspectors missed glaring violations in the structure, which, at that point, had been awaiting teardown for nearly six years. (It finally took more than nine to take it down.) Neither Bloomberg nor any other politician took much heat for a needless tragedy that cost the lives of additional first responders.

    Years of public frustration with the impossibly slow pace of rebuilding finally manifested in last year’s ugly fight over the so-called “Ground Zero mosque.” Although liberal New Yorkers tried to pretend Republicans had hijacked a local issue to score cheap points nationally, polls showed New Yorkers overwhelmingly opposed the Muslim community center, which, in fact, would be located several blocks from the site. Margaret and Peter Steinfels, co-directors of the Fordham Center on Religion and Culture, recalled hearing a Catholic priest speculate that the surprising outburst of anti-Muslim sentiment, which was largely absent from the city after the attack itself, wouldn’t have happened if the site had been rebuilt. “The priest,” the Steinfelses said, “felt that this void left a lot free-floating emotion that had been displaced to opposition to the Islamic center.”

    The absence of local accountability extends to the events of 9/11, as well as the site. The brave uniformed officials who ran into the cloud as others fled now find themselves reduced to actuarial table figures. The Victims Compensation Fund Special Master Sheila L. Birnbaum, another politically insulated appointee, isn’t covering cancer-related medical costs, arguing a causal link hasn’t yet been proved.

    Chris Ward, the Port Authority executive director appointed by Governor Paterson in 2008, who has had success in pushing construction forward ahead of the anniversary, when national attention will briefly refocus on the site, albeit at a steep price tag, delivered a powerful speech last week that seemed to be a parting shot amid reports that Governor Cuomo wants to bring in his own man after the anniversary to finish the job.

    Calling the September 11, 2011, opening a moment to “begin the important process of weaving this memorial at the heart of the site into the fabric of New York City,” Ward said the PA had “stepped back from a difficult conversation about what the World Trade Center should be, and stripped the site of what I call monumentalism, and focused on construction, of what it could be.”

    If Cuomo manages, with Ward or a replacement, to finally heal the open wound that’s bedeviled the city for a decade, New Yorkers will remember. If he fiddles around as his predecessors have, we’ll remember that, too. Any change at the Port Authority needs to come with a credible plan and time frame on which to judge the results and the governor.

    It’s late, but it might not be too late.

    Contact Harry Siegel at hsiegel@villagevoice.com

    Photo courtesy of bbcworldservice

  • A Fly in the Econometrics? Exaggerating Urbanization

    I was surprised to read in Science Digest that the increase in the urban land from 2000 to 2030 could be as much as 590,000 square miles (1.53 million square kilometers), which Science Digest went on to say would house an increase in the urban population of 1.47 billion people. The shock was because the researchers are suggesting that the substantial urbanization that will occur over the first three decades of this century will be at American urban densities, 2500 per square kilometer or 1000 per square mile. 

    Urbanizing on 1 to 3 Acre Lots? But that was just the beginning. The econometric research, A Meta-Analysis of Global Urban Land Expansion by Karen C. Seto, Michail Fragkias, Burak Güneralp, and Michael K. Reilly, partially funded by the National Science Foundation, indicates that the increase in urban land area between 2000 and 2030 could be as much as 4,900,000 square miles, or 12,600,000 square kilometers. This is more than the area of Australia, Argentina and Mexico combined. It does, however, seem unlikely that developers and home builders will provide for the expanding urbanization in China, India, Indonesia, the Congo, South Sudan and Bangladesh with ranch houses on one to three acre lots.

    The 4.9 million square mile or 12.6 million square kilometer urban land increase figure is based upon the GRUMP database, which we reviewed a year ago. GRUMP found the world to have more than 1.3 million square miles of urban development or 3.5 million square kilometers. The GRUMP database is purported to use United States Census Bureau criteria for designating urban land, yet counts three times as much land in the United States as being developed as the Census Bureau. We also showed that the GRUMP urban area for Cairo was at least six times the actual urbanization based upon examination of Google Earth maps (Figure 1: map).

    ng-grump2


    At 4.9 million square miles or 12.6 million square kilometers the average new urbanization would be under 500 per square mile or 200 per square kilometer. These densities fall well short of the urban density thresholds of 1000 per square mile or 400 per square kilometer that are used by census authorities in Canada, France, the United Kingdom and the United States. These nations and others consider densities this low to be rural rather than urban. Indeed, parts of rural China have higher densities than the GRUMP density estimates.

    Estimating Gross World Urban Area: Other estimates of world urbanization are more modest than the GRUMP estimate, which indicated an urban land area of 3,532,000 in 2000. The US Geological Survey MODIS mapping system estimated world urban land area at 650,000 square kilometers in 2000. In A Planet of Cities, Shlomo Angel, Jason Parent, Daniel Civco, Alexander Blei, and David Potere (Angel) use USGS MODIS mapping and further modeling to estimate the 2000 world urban land area at 605,000 square kilometers. Another source, the European Union’s Global Land Cover system put the number at 308,000. The wide variation in estimates indicates the complexity of the task of estimating the world’s urban land area.

    The estimates can be evaluated by comparing their implied population densities.

    • The EU Global Land Cover estimate would have required an average urban population density of more than 9,000 per square kilometer (23,800 per square mile) in 2000, based upon the 2000 United Nations estimate of urban population. This is nearly as dense as the city of New York (not the urban area) and a quarter more dense than Singapore. Anyone who has traveled to urban areas around the world, large and small, would quickly observe that average densities approach neither New York City nor Singapore. The Global Land Cover estimate thus appears to be too low.
    • The GRUMP world land area estimate would mean that the average urban population was 800 per square kilometer in 2000 (2,000 per square mile). This would place the world urban population density at least 15 percent below that of the United States  (900 per square kilometer or 2,400 per square mile) or Canada in 2001 (1,000 per square kilometer or 2,500 per square mile). As every urban planner knows, the United States has the least dense urban areas of any major nation. GRUMP thus appears to substantially over-estimate the amount of urban land.
    • The MODIS and Angel estimates are similar. The MODIS estimate would require an average world urban density of 4,300 per square kilometer (11,100 per square mile), while the Angel estimate would indicate a world urban density of 4,700 per square kilometer (12,200 per square mile). These two estimates would appear the most accurate, because they are well above the US and Canadian densities and any visitor to Manila, Shanghai, Cairo or a myriad of other urban areas in the developing world cannot help but note the much higher densities. At the same time the MODIS and Angel are well below the EU Global Land Cover estimates, which appear to be very high (Figure 2). The MODIS and Angel estimates would indicate that approximately 0.5 percent of the world’s land area is urbanized.

    Demographia World Urban Areas also provides population, land area and urban density estimates, though its detailed data is limited to approximately the approximately 800 urban areas with more than 500,000 population. Applying the Angel, et al urban area size density ratios and projections for urban expansion to 2010 (Angel middle scenario), the Demographia world density estimate would be approximately 20 percent lower, while the urban land area would be 25 percent higher). Demographia World Urban Areas bases its estimates on national census bureau data for urban areas (Note) where it is available and for others estimates urban land area from Google Earth (these are the overwhelming majority of cases), using urban perimeters. More than 50 percent of the difference between the Demographia and Angel estimates results from the use of Census Bureau urbanization data in the United States.

    Believable and Unbelievable Projections: Angel also provides projections for the increase in urban land area. Between 2000 and 2030 Angel projects that new urbanization could be from a middle case of 700,000 square kilometers (270,000 square miles) to a high estimate of 1,160,000 square kilometers (445,000 square miles), with a low case of 360,000 square kilometers (140,000 square kilometers). These are believable figures that are only a small fraction of the high-end 12,600,000 square kilometer (4,900,000 million square miles) projections by Seto, et al.

    The circumstances that might lead to urbanization equaling the land area of Australia, Argentina and Mexico are not believable. A sufficient reasonableness test does not appear to have been conducted.

    Wendell Cox is a Visiting Professor, Conservatoire National des Arts et Metiers, Paris and the author of “War on the Dream: How Anti-Sprawl Policy Threatens the Quality of Life

    ——

    Note: Most of the world’s national census authorities provide geographical data for only legal jurisdictions, such as states, provinces, regions, counties, etc. In some nations, urban area is developed to indicate the population and land area of continuous urbanization. This occurs in the United States, Canada, the United Kingdom, France, Sweden, Denmark and other nations.

    Photo: Developing world urbanization trend to 2030 according to high-end proectiong based upon GRUMP. Houses on two acre lots in Morris County, New Jersey (suburban New York). From Google Earth Pro.

  • Applying Lessons from the UK Riots to Australia

    Many commentators correctly attribute the UK rioting to decades of misgoverning and miseducating youth. Contributing to this has been the breakdown of family discipline, the replacement of working fathers as role models and the creation of a culture of entitlement. Tony Blair has talked about a breakdown in public morality. Less convincingly, many on the left have attributed the cause to the social expenditure cuts of the Cameron Government, cuts that have actually made barely a dent in the proceeding Blair/Brown years of tumescent expenditure growth.

    Adding poison to the brew are government appointments and procedures that deflect police forces away from law enforcement into institutions that “reach out” rather than prevent wrong-doing, seek to understand miscreants rather than enforce the law, and try to contain disturbances rather than prevent them. The soft sociological and managerial ethos that has undermined policing in Britain is all too familiar here in Australia.

    But there are other factors at work. This is especially evident given the nature of those arrested. Many turn out not to be part of some jobless underclass but relatively affluent working people, some in their late twenties and early thirties.

    And the rioters are black and white – though hardly any Indians or other Asians. One reason for this is Asian family background, bringing values based on self-improvement by work rather than theft, reinforced by religious teachings, especially in the case of Muslims, the only group where a large majority are religious practitioners.

    While the complexion of the rioters will be subject to considerable analysis over future months, we can be confident about one hypothesis: few if any of the rioters own their own homes. This is because nothing engenders respect for property and others’ possessions more than people having a personal stake in property themselves. Property ownership – for most of us this means home ownership – is the key to creating a law abiding society. Where riots in England take place outside of areas other than those hosting electrical and sporting goods, they take place on council estates, in areas where people rent. If in owner-occupied housing areas, the rioters are outsiders.

    British families owning their own homes rose steadily up to the early 1980s, reaching 75 per cent. The figure has since fallen back to 70 per cent. More critically, the ability to get on the house ownership ladder has become increasingly difficult for large numbers of young people. Demographia reports that the average house in England now costs over five times the average family’s income. That’s up from three times the average family’s income 25 years ago. In London and other major cities the cost is much higher than this.

    Countless reports in England, Australia and the US demonstrate planning restraints over land use are the cause of houses becoming expensive. Governments do their level best to impose additional costs on house builders, especially through energy saving requirements, but the building industry is highly competitive and finds ways of largely offsetting these costs. However, when government regulations constrain the amount of land that can be built upon this engenders unavoidable costs.

    Ironically, after decades of acquiescing in creating shortages for new home building, the UK Government last month finally expressed a determination to do something about freeing up more land for building. That was met by the usual howls of protest from incumbent home owners wanting to avoid having “riff raff” moving close to them, barking on about preservation of villages and anxious to see a continued shortage of available properties in order to boost their own house values. But these self-centred blockages of new housing stock are contributing to an alienation of many people from mainstream values.

    British Labour Party leader, David Miliband, is arguing that a gulf between rich and poor is a cause of the rioting. He may well have home ownership in mind in offering as his solution, “we need to give people a stake in this society”. But “giving” is not a policy that will work. It morphs into an entitlement regime, which reinforces divisions within society and weakens the self-improvement ethos. Applied to housing, it is reminiscent of the US policy which required banks to make housing loans to those who were not credit-worthy, a policy still unraveling in mortgage defaults and collapsed price bubbles. Removing regulatory restraints that have driven housing prices into unaffordable ranges is the better approach.

    Not being a participant in a home owning democracy provides no excuse for trashing and thieving. But it is clear that there is a vast number of young people who have decided they are excluded and have become eager participants in hooliganism. Policies of tolerating misdemeanors and acquiescing in slack educational supervision will clearly be re-thought in the UK. But so also must be the policies creating barriers that shut people out of home ownership.

    There are lessons in the UK developments for Australia. Not the least concerns home ownership. A fundamental cause of the present economic malaise has been over-investment in US housing as a result misguided attempts to foster home ownership through forcing financial institutions to lend to people who were not creditworthy. This was motivated by the hope that the subsequent property stake would lead to an improvement in civil society on the part of those who found themselves excluded.

    These measures failed because they created a housing price bubble. However, removal of cost enhancing planning restraints would not be likely to bring the same housing inflation outcomes (indeed in states like Texas where the artificial price boosting caused by planning restraints is absent, home price inflation and busts has been modest).

    Planning restraints in Australia have created home costs that are six times family incomes (nine times family incomes in Sydney). House prices in Australia are therefore even higher than in England and urgent steps need to be taken to reform the planning policies that have caused this. If this means a society closer to the ideal of a property owning democracy, so much the better.

    Alan Moran is the Director, Deregulation at the Institute of Public Affairs.

    Photo by bobaliciouslondon.

  • High-density Housing Reflects Dense Government Thinking

    Citizens in Australia’s major cities are becoming increasingly unhappy about what they perceive as the escalating deterioration in their quality of life – traffic congestion, overloaded public transport, unaffordable housing for young people, increases in the costs of basic services and overcrowding. There is little doubt that recent election results and unfavourable opinion polls are partly an expression of this dissatisfaction.

    ‘Save Our Suburbs’ believe that these adverse trends are the result of high-density policies that have been imposed onto communities by state governments. Due to the misleading misinformation that has accompanied these policies, the public may not fully realise the connection between these policies on the one hand and deteriorating standard of living on the other. It is only when one sweeps the propaganda veil aside that one realises how shallow, trivial and sometimes downright deceptive the spin has been.

    We should start out by making it clear that we have no issue with anyone that prefers living in a high-density area or with the free market construction of buildings to fulfill this preference. The issue we have is with the enforced imposition of high density housing upon the bulk of Australians that don’t want it.

    The premise behind this government totalitarianism is that high-density living is better for the environment. They say that people will use their cars less and that greenhouse gas emissions will be greatly reduced. While these two propositions sound very much like commonsense the unfortunate fact is that the data does not bear them out. An idealised Melbourne study currently being quoted assumes that people, no matter where they live, will drive to the central business district daily. This is a completely unrealistic assumption.  Only 9.9 per cent of employment in Melbourne is in the CBD. The majority of destinations for most people in the suburbs lie close to where they live and they do not in fact make daily trips to the CBD.

    To get a better understanding we should look at the Australian Conservation Association’s Consumption Atlas, which shows greenhouse pollution per person in each postal code. The underlying research shows that the actual travel energy used by dwellers in inner Sydney suburbs is more than those in the outer suburbs, even when air travel is excluded.

    When domestic energy is added to travel energy, the energy total for people in the inner suburbs is 22 per cent more than those living in the outer suburbs.  This is because of energy needed in high-rise buildings for communal lifts, scores of individual clothes driers and ever-present security lighting in foyers and garage spaces.

    While we do concede that private transport generates somewhat higher greenhouse gas emissions than public transport, the difference is not nearly as much as people think. Greenhouse gas emissions per passenger kilometer on Sydney City Rail are 105 gm. The figure for the average car is 155 gm. It is much less for modern hybrid vehicles, being a mere 70 gm.

    Furthermore, a study of Melbourne areas shows that the people squeezed into newly converted dense areas did not use public transport to any greater extent and there was little or no change in their percentage of car use compared to living in the previous low-density.
    In fact, traffic congestion increases whenever high-density policies are imposed wherever you are in the world. Any slight increase that may occur in the proportion of people using public transport is overwhelmed by the greater number of people squeezed into that area. The resulting congestion causes higher fuel consumption and dangerous exhaust emissions. The authorities fail to admit that many people still require their cars for getting to the many workplaces, sporting facilities, and relatives and friends homes not easily reached by public transport and for transporting items that are impractical or illegal aboard public transport such as weekend recreation equipment and the family pet.

    High density advocates claim that high-density saves money. This is palpable nonsense. We are all acutely aware that high-density policies have resulted in a dramatic rise in the price of housing, due to the government enforced infill policy causing land scarcity, thereby locking out an entire generation of young people from the housing market. We are also conscious of substantial rises in the cost of services such as electricity, water and sewerage due to the incredibly inefficient modifications required to increase capacity in areas originally designed for lower densities.

    A tragic and often overlooked failure of high-density policies is the adverse effect on human health, especially mental health. There is a considerable body of peer-reviewed research proving the link between density and ill health. An article published on 23 June 2011 by eleven authors in the prestigious scientific journal, Nature, states that the incidence of schizophrenia in city dwellers is double that of people living in less crowded conditions. This article has received worldwide media attention. In view of the serious mental health situation existing in our society, those forcing high-density onto communities that do not want it, should hang their heads in shame.

    We reiterate that we have no issue with those of us that prefer living in a high-density area or with the free market construction of buildings to fulfill that limited demand. What we object to, is having draconian high density policies based on demonstrably faulty premises forced upon the 83 per cent of people that Australian research shows prefer to live in a free-standing home.

    This is especially so when the result is maddening traffic congestion, more greenhouse gases, a creaking and overloaded infrastructure, the young and disadvantaged unable to afford their own home and poorer health outcomes.

    This piece first appeared in On Line Opinion.

    (Dr) Tony Recsei has a background in chemistry and is an environmental consultant. Since retiring he has taken an interest in community affairs and is president of the Save Our Suburbs community group which opposes over-development forced onto communities by the New South Wales State Government.

    Photo by drewish.

  • How to Save Chicago

    The title raises the obvious question: Does Chicago need saving?

    I guess the answer is clear. Aaron Renn published a reviewofthe 2010 census, and for Chicago it was not pretty. Since 2000 the city lost over 200,000 people: nearly 7.5% of its Black residents, and almost 6% on non-Hispanic Whites. Only the Hispanic population grew, but at an anemic 3.4%. Even the metro area writ large isn’t doing all that well, growing by only 3.9% (against the nation’s 10%).

    Los Angeles, described as “a city in secular decline" appealed to the schadenfreude in my heart. As a Chicago booster, the decline of an arch-rival is emotionally (if irrationally) satisfying. But sadly, many of LA’s problems are Chicago’s issues as well: a decline of the central business district, an exodus of major businesses, the disproportionate influence of real estate on local politics, and ethnic politics. Add to that a still vibrant Outfit (mob), a lousy climate, and apart from Lake Michigan, little in the way of natural distinction, and you don’t have a pretty picture.

    Even some gentrification seems to be wearing thin. Walking along Clark St. there are plenty of empty store fronts. It’s beginning to look a little dreary (though still far from a slum).

    That all sounds pretty desperate. But there is some good news as well.

    • My wife and I inadvertently got off the Skyway one exit too soon and wound up driving down 87th St. to Stony Island. This is a thriving, middle-class Black neighborhood. Every storefront was occupied, and there was no graffiti! (Unlike graffiti-scarred Rome, which we also recently visited.)
    • Public transport is alive and well in Chicago. Trains and buses are clean, graffiti-free, and the passengers are civilized.
    • There is lots of affordable housing. Plenty of “luxury apartments” are for rent along Clark St. One can buy a perfectly nice condo for $100K or less. Many neighborhoods have been redeveloped and are really nice; Logan Square is a good example. This is the good side of the real estate bust, and gives the city a huge advantage over, say, New York or San Francisco.
    • Lakeshore Drive, Michigan Avenue, Wacker Drive, and even State Street are as fabulous as ever, especially in nice weather.

    So there is hope, but the patient is sick, and if things don’t change then Chicago could go the way of St. Louis or Detroit.

    So how can Chicago be saved? Here is my advice to Rahm Emanuel, the new Mayor.

    • Forget about the old business model – the world has changed. The days of small-time manufacturing or major banking centers are over. The notion that The Loop is going to be the home of large corporations is past. So concentrate on the new world: what can Chicago do well? I count three things: Residential, Retail, and Tourism. And Chicago has (quite inadvertently) done the residential part right. It’s the other stuff that needs attention.
    • Remember why Sears Roebuck started in Chicago: it was the center of the country. The Windy City is still is the center of the country. It should have the World’s Busiest Airport. It still is the railroad capital of America. It could be the retail capital of America. Chicago – The Loop, Michigan Avenue, Woodfield Mall, all of it – can be where America comes to shop. If relative pipsqueak Minneapolis can make a success of the Mall of America, just think what Chicago can do.
    • So – first step – lower sales taxes! We paid over 10% tax at a restaurant on Rush St. That’s crazy! Reduce sales taxes to 4% (or eliminate them entirely). Perhaps this will mean a decline in government revenue, but so what? It will create thousands of jobs and billions in business. (If politicians were really interested in their constituents rather than their own perks, this would be a no-brainer.)
    • Maintain the neighborhoods. I know the stockyards are long gone, but where is that really good steakhouse in Bridgeport? Likewise, I’m happy to drive to 87th and Stony Island for dinner and good music, but you need to ensure my safety. The city doesn’t need more real estate – it needs more cops, public transit, art, advertising, and street lights.
    • Free parking on Sundays. I know the city has taken a lot of flak for parking, but in principle it works. I parked within a couple of blocks of a fancy restaurant on Rush St. on a Friday night ($6). I parked within a block of Clark & Diversey so my wife could go shopping ($2). Before the new meters I would have had to drive around for an hour to find a place to park, and then it’d be many blocks away. Now it’s easy, and (compared to wasting time and gas) not expensive.

    But free parking on Sundays would bring them in from the suburbs in droves! New York does that, and that’s the only day we drive down to the City. Cut folks a break – it’s good business.

    • Improve public transit. That doesn’t mean new trains, but it does mean more safety. Let me take the train to Chinatown at night and have it be an enjoyable experience. Where is the convenient bus to Hyde Park? Why can’t I buy a tourist day-pass or a weekend pass for the CTA at my local station? And why do the ticket vending machines not accept credit cards? Oh, and if you do have an extra train or two, why not run A and B express trains on the Red Line? They did that 25 years ago.
    • Keep the cows. I don’t mean the stockyards, I mean the art. Of course the actual street-corner cows are passe, but Marilyn Monroe isn’t – she works. Use your architecture, your waterfront, your grand vistas. Use your imagination.

    Here is the key:  for Mayor Emanuel and for all politicians. The citizens have to earn money before you can tax it. Exorbitant sales taxes just spoil it for everybody. Yes, I know you need to spend money on schools and welfare and public-employee pensions. But you can’t do that if the money isn’t there in the first place.

    So get Chicago open for business. Lower sales taxes. Ensure public safety downtown and in the neighborhoods. Invest a little in mass transit. Give up just a bit of the parking revenue. Chicago is a great tourist and shopping destination, better than Rome in every way except ruins. Allow your citizens to cash in before Chicago itself becomes a ruin.

    Daniel Jelski is Dean of Science & Engineering State University of New York at New Paltz.

    Photo by smik67.

  • The Evolving Urban Form: Beijing

    China’s capital, Beijing, has long been one of the world’s largest urban areas. Some reports placed its population at over 1 million in 1800, which would have made Beijing the largest urban area  in the world at that time. Later in the nineteenth century, Beijing dropped below 1 million population, as London, Paris and later New York rose to prominence. As late as 1953, Beijing had a population of fewer than 3 million. Since then the city’s population has  increased more than six times (Figure 1).

    Beijing is one of China’s four "directly administered municipalities" or "provincial level municipalities," along with Shanghai, Chongqing and Tianjin (Note 1). Moreover, like Shanghai and Tianjin, Beijing is essentially a metropolitan area, composed of an urban area and exurbs approximating a labor market. This is unlike Chongqing, which has extensive rural areas and extends far beyond any plausible definition of a metropolitan area (having the land area approximately the size of Indiana or Austria).

    The Growing Beijing Urban Area: In the 1990s, Beijing added 2,700,000 people and had a population of 13.6 million in 2000. Between 2000 and 2010, Beijing population increased by more than double the previous increase, or an increase of 6 million people.

    The Expanding Beijing Urban Area: Based upon the most recent census, the next edition of Demographia World Urban Areas will estimate an urban area (urban footprint) population of 17 million, with an urban land area of 1,350 square miles (3,500 square kilometers) and an urban density of 12,600 per square mile (4,900 per square kilometer) in 2011. Beijing ranks as the world’s 12th largest urban area and is larger than any urban area in the United States or Europe with the exception of New York. As in other urban areas of China, there is considerable undeveloped land in enclaves within the suburban areas, which could develop further, raising both the population and the density.

    Falling Urban Densities: Even so, Beijing is far less dense than before. Deng and Huang at the State University of New York, Albany, place the 1949 urban land area at less than 25 square miles (63 square kilometers. Based upon its early 1950s population of less than 3,000,000, the population density of the entire urban area could have been more than 100,000 per square mile or 40,000 per square kilometer (precise urban population is not available). This is greater than the highest density major urban area today, Dhaka (Bangladesh) at 90,000 per square mile or 35,000 per square kilometer. Today’s urban Beijing may have an overall population density one-eighth that of the 1950s.

    This illustrates a reality often missed by urban analysts, who confuse population growth with increases in population density. In fact, as the Evolving Urban Form series (Note 2) indicates, dispersion is at least as important in the expansion of megacities as population growth itself. Population densities generally decline as urban areas add residents.

    Suburbanizing Beijing: Consistent with the international urban trends, most growth over took place outside the core (see table at bottom and Figure 2). As Beijing has suburbanized, it has added "ring roads," (beltways or loops) which except for the 1st ring road (around the Forbidden City) are freeways, often with Texas-style frontage roads (See "2nd Ring Road" photo). Now there are six ring roads and there has been some discussion of a seventh, which would extend to the adjacent Hebei province to the south. Real-time traffic conditions on the first five ring roads can be seen at the Beijing Traffic Management Bureau site (the 6th ring road is outside the map)


    2nd Ring Road with frontage roads

    At the same time, Beijing’s expansive suburbs do not resemble the low-density suburbanization of Phoenix, Portland, Perth or Paris. Much of the development is in high rise condominiums and a substantial part is lower quality, lower rise development that houses Beijing’s large and growing migrant population (referred to as the "floating population"), most of whom do not have Beijing resident (hukou) status. Even so, there is no shortage of detached luxury housing (called "villas") in western style developments. such as "Orange County." More recently there is increasing demand for a more modern version of the "siheyuan" (courtyard) housing makes up the renown "hutong" areas of Beijing and other Chinese cities. One website refers to the "siheyuan" as the Chinese version of the "American Dream" and a recent China Daily commentary even suggested that this type of housing should constitute the future expansion of Beijing.  However, a quick review of real estate offerings for the new siheyuans, makes it clear that they are simply unaffordable for a growing middle class that finds it difficult to afford new flats in high rises outside the 4th ring road.  

    Hutong neighborhood (Dongcheng qu)

    A map of Beijing’s districts can be seen here, with color coding that corresponds to the geographical divisions in the table.

    The Inner City: During the last census period, less than one percent of the population growth has been in the inner city, which consists of the districts of Xicheng and Dongcheng, largely inside the 2nd ring road and contains the Forbidden City, Tiananmen Square, the Drum Tower (see photo below) and Bell Tower, and the Yonghegong Lama Temple (Buddhist). These districts, which contain nearly all of the remaining hutong (see photo above) residences grew only 2.2 percent. At 61,000 people per square mile (23,500 people per square kilometer), inner Beijing approaches the population density of Manhattan or the Ville de Paris.


    Toward the Drum Tower, from Jingshan Park

    Outside the Inner City: More than 99 percent of Beijing’s growth was outside the inner city. The first and second ring suburbs accounted for 96 percent of the growth, while the outer areas accounted for three percent of the growth.

    First Ring Suburbs: The four inner suburban districts of Beijing captured 52 percent of the provincial growth between 2000 and 2000. Overall, the four suburban districts added 3.2 million people, a nearly 50 percent increase in population. The population density in the inner suburbs was 19,400 per square mile in 2010 (7,500 per square kilometer). This is a higher density than the city of San Francisco. The inner suburban districts are generally located within the 5th ring road. The first ring suburbs include the district of Chaoyang, which has the largest population and where at least one-half of the population    generally lack Beijing residency (hukou). Chaoyang is also home to the new Beijing "central business district," (CBD) which is the largest concentration of high rise towers in the urban area includes  the controversial architectural icon, the CCTV Headquarters (photo at the top). The development of the CBD in the inner ring suburbs and other major commercial development are indicative of a dispersion of employment that, if permitted to continue, could ease Beijing’s legendary traffic congestion.

    Second Ring Suburbs: The outer suburban districts accounted for 44 percent of the provincial population increase between 2000 and 2000 and 2010. However, the outer suburban districts had the highest growth rate, at 72 percent, The outer suburban districts are generally located outside the 5th ring road and include considerable rural territory. The population density is 2100 per square mile (800 per square kilometer). Beijing Capital International Airport is located in this area, though it is under the jurisdiction of the inner ring district of Chaoyang. This airport is now the world’s second busiest in passenger volume, following Atlanta and having passed perennial runner-up O’Hare International in Chicago. At current growth rates Beijing Capital International could become the world’s busiest airport within five years.

    Outer Areas: The outer areas are largely rural and well outside the urban area. Nonetheless, the growth rate in the outer areas was well above the national rate and six times the rate of the inner city. The outer areas gained 186,000 people, approximately four times the inner city gain.

    Future Challenges: The floating population Beijing (and Shanghai) represented most of the population growth from 2000 to 2010. More than 7 million of Beijing’s nearly 20,000,000 population are migrant workers.   Government officials have expressed concern at the rate of population growth and have indicated an interest in severely limiting future population growth. Among Beijing’s considerable challenges is providing sufficient water for its large population. Beijing lacks the plentiful supply of water that is available to many urban areas of central and southern China (example, Shanghai, Nanjing, Wuhan and Chongqing) and the government is building a system to divert water especially from the Yangtze River. The 2020 census results could reveal a significant slowdown in growth, if these problems are not sufficiently addressed. 


    Beihei Park

    Wendell Cox is a Visiting Professor, Conservatoire National des Arts et Metiers, Paris and the author of “War on the Dream: How Anti-Sprawl Policy Threatens the Quality of Life

    ——–

    Note 1: What are translated as "cities" in China are not cities as understood in the West. A "shi" in China (translated as "city") is actually a region that may approximate a metropolitan area or labor market area in the West (with an urban core and a much larger surrounding rural territory). Some "shis" are much larger, however, such as Chongqing, which covers a land area similar to that that of Austria and nearly as large as Indiana. Chongqing and many other "cities" are far larger than any plausible metropolitan area definition.

    "Shi" may exist either at the provincial level (as in the case of Beijing, Chongqing, Shanghai and Tianjin) or it may exist within a provincial level jurisdiction, such as Nanjing in Jiangsu. Guangzhou in Guangdong or Wuhan in Hubei. Every square mile of a province (excepting the provincial level jurisdictions) is divided into shis, prefectures or comparable units, in the same way that US states are divided into county level jurisdictions or the regions of France are divided into departments. To complicate matters more, shis themselves may have county (xian) level shis within their borders, such as Cixi, a county level shi with approximately 1,000,000 people within the Ningbo shi in Zhejiang province.

    Note 2: Other megacities reviewed in this series have been: Jakarta, Los Angeles, Manila, Mexico City, Mumbai, New York ,Seoul and Shanghai .

    Photo: CCTV Headquarters in new Beijing CBD, Chaoyang district. Photo by Iamdavidtheking.

    All other photos by author.

  • Austin’s Not That Weird

    Don’t let the cupcake stands fool you. For years, locals pressed the need to Keep Austin Weird. Besides spawning lazy clichés (Keep Austin Wired, Keep Austin Moving, Keep Austin on Every List of Best Places to Live), the Keep Austin Weird movement overlooks the obvious: the city’s not that weird.

    Weird for Texas? Sure. Austin is like a rebellious preacher’s kid. It’s cool, popular, breaks all the rules, and doesn’t go to church very much. Family members from elsewhere visit from time to time, but everyone wonders if they’re all part of the same family.

    It’s been this way forever. When most of the state decided to join the Confederacy, Austin declined. When most of the state decided to join the Republican Party, Austin declined.

    The capital is more counter-Texas than counter-culture. Austin boasts unique attractions, festivals, and music venues. It’s livable, a hard term to quantify until Austinites visit other cities and return recounting their flaws. Austin also has an infectious, welcoming spirit. You can strike up random conversations with random people at the grocery check-out. Still, it’s not as strange as advertised. Let’s dispel the most common myths:

    MYTH #1: It’s San Francisco. It’s not. The City by the Bay is smaller, denser, and more ethnically diverse. Both cities have roughly equal populations, but Austin packs them into approximately 300 sq. miles; Austin is six and half times larger than San Francisco. Neither city has a white majority, but nearly one in two Austinites is white, compared to just four in ten San Franciscans. So Austin’s full of Stuff White People Like: trailer food, snow cone stands, vintage clothiers, writer’s groups, Paleolithic restaurants, coffee shops, and yoga studios. It’s not the gayest city in Texas, either. Dallas narrowly edges out Austin, according to analysis by the Williams Institute at the UCLA School of Law.

    MYTH #2: It’s a small town. As the 14th largest American city, Austin has big city problems.

    Traffic tops the list. Forget rush hour. It’s not unusual to find your car parked on I-35, the city’s clogged artery, on a Sunday afternoon. The ill-equipped interstate reflects city planners’ inverse Field of Dreams strategy: if you don’t build it, they won’t come. Back when Austin really was a small town, some thought expanding I-35 would encourage newcomers. They came anyway.

    A growing metropolis suffers growing pains, and Austin hasn’t outgrown racial or economic segregation. Housing costs, among the state’s highest, contribute to geographic divisions. The city’s affluent congregate in the west side, while middle-earners who want homes settle near, or in, once-empty Williamson and Hays counties. Austin’s east-siders are mostly low-income minorities, but as The Atlantic’s Ta-Nehisi Coates observes, gentrification is changing this.

    In search of cheap in-town property, a mix of white urban professionals and bohemians started sprucing up homes just east of I-35 over a decade ago. High-end lofts now co-exist, a bit awkwardly, next to mercados. The east side has become less a barrio, with new stores, houses, and other developments dotting neighborhoods. Still, it’s no yuppie playground.

    MYTH #3: It’s Babylon. Fear not, God-fearing Americans! Austinites aren’t as eccentric or wayward as you may have heard. For years, natives have touted wandering gender-bender Leslie Cochran as their mascot. To locals, Leslie embodies Austin’s free-spirit; to outsiders he’s evidence Austin is Gomorrah near the Guadalupe. Leslie nearly died in 2009, however, and Jennifer Gale, a homeless transgendered activist, died in the cold in 2008. Austin still has its fair share of eccentrics—the unicycle, mind you, is a perfectly acceptable mode of urban transport—but you won’t find fire-eaters on every corner.  

    This city of alleged non-conformists dresses the same (and never up). Shorts and flip-flops, the uniform of least resistance, will get you in nearly any club or restaurant. The University of Texas, state government, and tech companies compose Austin’s economy. Professors, bureaucrats, and software engineers—let the Bacchanal begin! During South by Southwest, locals can easily pinpoint the Bay Area-Portland-Williamsburg interlopers. As they party, promote, and pose, the skinny jean set manically turns their attention from iPhones to panel discussions to guest-list gatherings. Austinites run at a more relaxed pace. Unlike these coastal scenesters, they would rather chill out than stand out.

    MYTH #4: It’s not like other cities. In many ways, Austin is exceptional. The urban core features gems like Zilker Park, a marvelous pink granite Capitol, and home-grown eateries. Leave the central core, however, and you quickly encounter big-box sameness.

    As you head south of Ben White Boulevard or north of the University of Texas, national retailers, food chains, and strip malls appear. Once a destination concert venue, Southpark Meadows is now a destination for south Austin Target shoppers. Up north, The Domain, an upscale shopping village, gives off a gentle North Dallas pretention, which is the opposite of Austin weird.

    Even Whole Foods, the Temple of Austin, causes headaches. The retailer is Disneyland for foodies, if you can get there or find parking. Sky-rise condos flank the flagship store, and getting past nearby intersections and into a parking space can feel like a bumper car ride. This congested urban development angers locals who fear their homeland now caters to well-off creative professionals instead of cash-strapped musicians and artists.

    No wonder some residents feel compelled to remind everyone to Keep Austin Weird. Put it on a tee-shirt. Put it on a bumper sticker. Shout it from your co-op’s rooftop: I have seen the Promised Land, and it is (or was) weird.

    How odd that a progressive city would revert to this reactionary battle cry. Those who love the phrase look back and see an odder, better place or ahead and see disturbing signs of normalcy. Both sales pitch and civic anthem, the Keep Austin Weird campaign aspires to change development through mantra. Like a New Age chant, it hopes to alter consciousness. If you say it enough, maybe it will come true.  

     Does Austin have to be weird to be special? It has plenty of attractive, well-educated citizens, natural beauty, and warm weather (record-setting levels this year, in fact). It’s still far cheaper than most coastal meccas. When magazines rank it as a great place to move or start a business, weirdness isn’t their criterion. Despite the big city headaches, the quality of life is still pretty sweet. Can’t we just follow The Beatles’ advice, and let Austin be?

    Writer Jason Thurlkill grew up near Dallas. He reported for “The Hotline” and a “New York Observer” publication. Previously, he worked for a Washington D.C. political consulting firm. He studied government at the University of Texas and earned his Master of Public Policy at the University of Chicago.

  • Suburbanized Core Cities

    The suburbs of major metropolitan areas captured the overwhelming majority of population growth between 2000 and 2010, actually increasing their share of growth, as has been previously reported. However, it is often not understood that much of the recent central city (Note 1) growth has actually been suburban in nature, rather than core densification. In fact, historical core cities (Note 2) vary substantially. In some cases, core cities are largely pre-war and transit oriented, such as New York, Chicago and San Francisco. In other cases, much of historical core city is automobile oriented suburban in character. This article provides a classification of historical core cities based upon the extent of their pre-automobile cores as well as population and land area data.

    Central Cities before World War II: Auto-oriented suburbanization began before the Great Depression.  In 1940, transit’s urban market share in the United States appears to have been higher than that of Western Europe today (Note 3). Each of the nation’s largest metropolitan areas (then called "metropolitan districts") boasted a strong, dense core, and could be generally delineated by the city limits of the largest municipality.

    In the years after the Second World War, many cities annexed considerable territory. At the same time, a number of new major metropolitan areas emerged which effectively lacked a dense core. For the purposes of analysis, the historical core cities of the 51 major metropolitan areas (those with more than 1,000,000 population) have been divided into three categories, based upon the extent of the suburban development within their borders. The categories are defined in Table 1 and data is provided in Tables 2 and 3 in the attached PDF document.

    Table 1
    Classification of Historical Core Municipalities

    Nature of Historical Core Municipality:
    Classification based upon 2010 City Limits

    Large Urban Core in 1940?

    2010
    City Limits

      Pre-War & Non-Suburban

    Yes

     Is pre-war core; nearly all included land area was developed by 1940. Little development that is post-war suburban in character. Little or no change in boundaries since 1940.

      Pre-War  & Suburban

    Yes

    Includes pre-war core, however contains substantial development that is post-war suburban in character (2010 boundaries contain substantial areas that were greenfield in 1940)

      Post War & Suburban

    No

    Has smaller pre-war core: less than 100,000 population in 1940 and nearly all development is post-war suburban in character.

    The historical core municipality is the municipality with the largest 1940 population in the present metropolitan area (metropolitan statistical area).
    There can be more than one historical core municipality in a metropolitan area, with the exception below.
    There can be a second historical core municipality if (1) it is adjacent to a historical core municipality classified as "Pre-War  & Non-Suburban," (2) had a 1940 population at least 25 percent of the first historical core municipality and (3) a population density of at least 5,000 per square mile.
    Multiple municipality names listed in some other metropolitan areas for reference purposes.

    Pre-War & Non Suburban: The first category is the "Pre-War & Non Suburban" historical core cities. Each of these 19 cities is itself a pre-automobile core. City boundaries have changed little since before World War II and nearly all land was developed at that time (Note 3).

    Overall, these cities had a population density of 11,900 per square mile in 2010 (Figure 1). However, 16 of the cities have lost population since 1940, with only New York, San Francisco and Oakland having gained population, albeit very modestly. (Oakland lost population over the past decade.) Between 2000 and 2010 the "Pre-War & Non Suburban" historical core cities lost 424,000 people, or 2.2 percent of their population (Figures 2 and 3). Seven gained population, though in five of these cases (Boston, Hartford, Philadelphia, Providence and Washington) the 2010 population remained well below mid-century levels.

    Pre-War & Suburban: The second category is the "Pre-War & Suburban" historical core cities. These 27 cities had pre-automobile cores, usually quite small, in 1940, but also include (in their 2010 borders) substantial land that was undeveloped in 1940. Substantial automobile-oriented suburban development has occurred in these areas. The strong automobile oriented suburban influence is indicated by the average population density of 2900 people per square mile of land area, approximately one-fourth the density in the "Pre-War & Non Suburban" category.

    On average, the 2010 land area of the "Pre-War & Suburban" historical core cities is 3.2 times the land area of the corresponding urban areas in 1950 (areas of continuous development or the "urban footprint"). These urban areas included both the historical core city and the suburbs (Note 4).   The city of Jacksonville covers the most land area relative to its 1950 urban area, at 14.7 times. The city of Portland, the recipient of frequent praise by advocates of densification, covered more area in 2010 than its entire urban area in 1950 and its population density today is less than that of the entire urban area in 1950.

    The "Pre-War & Suburban" historical core cities added 1,520,000 people between 2000 and 2010. This translates into an average growth of 7.8 percent relative to the 2000 population. Three cities grew more than 100,000. Louisville added 341,000 people principally through a city – county merger, after its previous annexations had failed to stop its population decline. Between 1950 and 2000, Louisville has lost nearly one-third of its population while adding more than 50 percent to its land area.

    Charlotte added 191,000 people, principally due to a continuing annexation program. San Antonio and Houston took advantage of considerable undeveloped land within their city limits to add 183,000 and 146,000 people respectively.

    Post-War & Suburban:  The third category is the "Post-War & Suburban" historical core cities. None of these seven cities had more than 100,000 population in 1940 or a large pre-automobile core; these are essentially suburbanized cities.  In each case, the cities have undertaken huge annexations. On average, the 2010 city limits include nearly 6 times as much land as the corresponding urban areas in 1950. The city of San Jose, known for its densification policies, covers nearly 3 times as much land as its entire urban area in 1950, which included the city and all of the suburbs (Figure 4).

    The "Post-War & Suburban" historical core cities added 619,000 people between 2000 and 2010, for an increase rate of 15.5 percent, the largest percentage growth of the three categories.

    Perhaps surprisingly the population density of the "Post-War & Suburban" historical core cities was one-quarter above that of the "Pre-War & Suburban" category, at 3700 per square mile. This may be at least partially driven cities like San Jose, Las Vegas and Riverside-San Bernardino, which have generally avoided planning that required larger lots and below market densities.

    The cities of Philadelphia and Phoenix reflect these differing patterns.   In 2010 Philadelphia had a population density of more than 11,300 people per square mile and covered an area of 135 square miles. The city of Phoenix had a population density of under 3000 people per square mile and covered more than 500 square miles. Not even one square mile of the 2010 city of Phoenix equals the average density of Philadelphia. In 1940, Philadelphia had a population of 1.9 million, 30 times that of the 65,000 in Phoenix.

    As would be expected in a dense historic core city, Philadelphia has a substantial transit work trip market share, at 25 percent. This is five times that of the surrounding suburbs (5 percent). In contrast, the city of Phoenix has s a transit work trip market share of only three percent, below that of the Philadelphia suburbs. 

    Suburban Development Makes Cities Grow: As the data above indicates, virtually all net core city population growth over the past decade has been suburban in nature. Core cities characterized by substantial automobile-oriented suburbanization added more than 2.1 million residents, while the cities with little   automobile-oriented suburbanization lost more than 400,000. It turns out that even most “core” cites are more suburban than many imagine.

    ——————–

    Note 1: "City" has multiple meanings and analysts have not always provided  sufficient clarity when using the term. For example, "city" can mean a metropolitan area, and urban area, a municipality (incorporated jurisdiction) or as in China, a region either at the provincial or sub-provincial level. As used in this article, the term "city" means a municipality unless otherwise indicated.

    Note 2: The historical core city is the city in the present metropolitan area that had the largest population in 1940. Usually, this is the first named city in the official Census Bureau title. However, in two cases (Virginia Beach-Norfolk and Riverside-San Bernardino), the second named city is the historical core city because it was the largest in 1940.

    Note 3: There are no comparable data on overall transit market shares between Europe and the United States. However, Eurostat data for nearly 150 European metropolitan areas indicates that transit’s work trip market share averages approximately 17 percent. The same population range (over 100,000) of US metropolitan areas has a transit work trip market share of six percent. In 1940, the overall US transit market share was approximately 14 percent. Because transit work trip market shares are generally substantially higher than overall shares, it is suggested that the 1940 US transit market share was greater than the current share in Europe.

    Note 4: The city of Chicago made a substantial annexation largely to incorporate the land for O’Hare International Airport. This annexation did not materially increase post-war suburban development in Chicago and the city is thus classified as "Pre-War & Non-Suburban."

    Note 5: 1950 used because urban areas were not designated before that time.

    Wendell Cox is a Visiting Professor, Conservatoire National des Arts et Metiers, Paris and the author of “War on the Dream: How Anti-Sprawl Policy Threatens the Quality of Life

    Photo: City of San Antonio annexation map from the San Antonio Planning and Development Department. The red rectangle is the land area of the city in 1940. 

  • Inside The Sinosphere

    Avis Tang, a cool, well-dressed software company executive, lives on the glossy frontier of China’s global expansion. From his perch amid tower blocks of Tianfu Software Park on the outskirts of the Sichuan capital of Chengdu, the 48-year-old graduate of Taiwan’s National Institute of the Arts directs a team of Chinese software engineers who are developing computer games  for his Beijing company, Perfect World Network Technology, for  the  Asian and world market.

    A glossy software office in Chengdu seems a long way from the images of centrally directed, belching factories seeking to dominate the global economy. But a close examination of the emerging Sinosphere–or Chinese sphere of influence–shows an economy that is globally dispersed, multinational and increasingly focused on the high-tech and service sectors.

    Yet if Tang came to China to work for Interserv, a Taiwan game developer, he would see that the future of his industry–including its creative side–lies not only in the coastal cities but, increasingly, in those stretching across the vast Chinese interior. “In ten years perhaps all these cities will follow the path of Shanghai,” says Tang, as technology allows businesses that once had to situate themselves in coastal megacities to expand into the interior.

    Widely considered one of the most “livable” of China’s big cities, Chengdu seems to Tang something of an incipient Silicon Valley. The area’s software revenues increased more than tenfold over the past decade, while an estimated 200,000 people are expected to be working in the city’s software industry by 2012.

    Like many of his fellow managers at the sprawling park, home to over 800 foreign-owned companies, Tang is not a citizen of China.  He’s from Taiwan and never set foot in the People’s Republic before 2001.  His wife remains in Taiwan (Tang flies there every month or two to see her).

    Chinese capitalism has relied on diaspora entrepreneurs like Tang. In this sense, the rise of China represents the triumph of a race and a culture. Indeed for most of its history China’s most important export was not silk or porcelain but people. To measure the rise of the Sinosphere, one has to consider not just China itself but what historian Lynn Pan has described as the “sons of the Yellow Emperor.”

    The Sinosphere’s roots lie with the Han expansion into southern China during the Tang dynasty (618-907). By the 12th century, the newly Sinofied southern Chinese had started moving south. There they created trade-oriented colonies like Vietnam, Burma, Malaya and the island of Java. In the 1600s Chinese settlers overcame the aboriginal inhabitants of Taiwan, creating another powerful base in the South China Sea.

    At its height, during the expeditions of the legendary eunuch Admiral Zheng Hein in the early 15th century, China’s maritime “sphere of influence” extended all the way to the Indian Ocean and beyond.

    Although ensuing Chinese regimes pulled back from expansion and all but abandoned their scattered children, the colonies, particularly in Southeast Asia, survived.  They developed business and industries suitable to their new homes, but also maintained their cultural heritage and language. After the Chinese Communist takeover of the mainland in 1949, the diaspora colonies retained their capitalist orientation. Many established trading operations and sent their children to the United States, Canada and Australia, where they enjoyed remarkable success.

    Hong Kong, Singapore, Taipei, Rangoon, Bangkok and Jakarta can be seen as the original testing grounds for Chinese capitalism. In the past few decades North American regions such as Silicon Valley, Southern California, Toronto, Vancouver and New York-New Jersey have been added to the mix. Overall the entire overseas Chinese population has risen to nearly 40 million. Taiwan, which is de facto independent, is home to an additional 23 million, and Hong Kong and Macau, officially part of China but governed under different laws, boasts some 7.5 million.

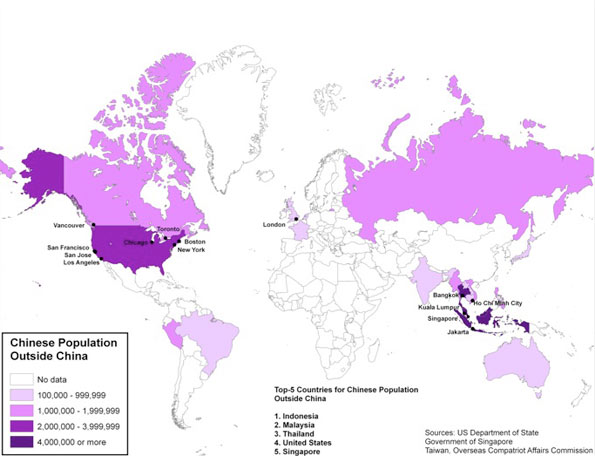
    Even today the ties between overseas Chinese and their home country remain close. The original diaspora countries—including Hong Kong–remain principal sources of investment into China. Among the ten largest sources for inbound investment to the PRC are Hong Kong, by far the largest investor, fourth-ranked Singapore and ninth-ranked Taiwan. Each brings more investments into China than such major powers as Germany, France, India and Russia. The United States, home to the largest overseas Chinese population outside Asia, ranks fifth.

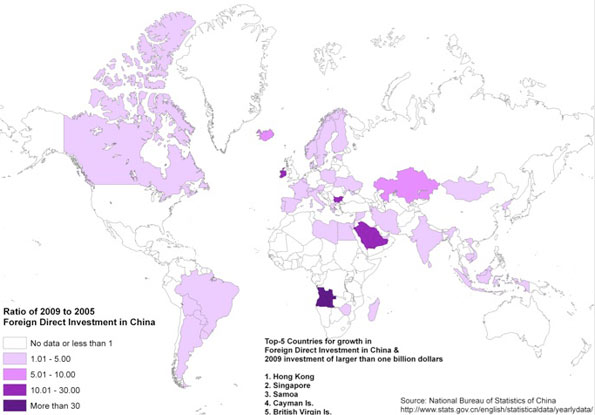
    Other investments come from places like British Virgin Islands, the Cayman Islands and Samoa, which often act as conduits for investors who do not want to be too closely monitored. This seems to include many Chinese investors, particularly in Taiwan, who may not want too much scrutiny of their outlays into the PRC. This includes even Chinese government -owned firms such as China Mobile Communication Corp., which has established an investment HUB in the far away British Virgin Islands.

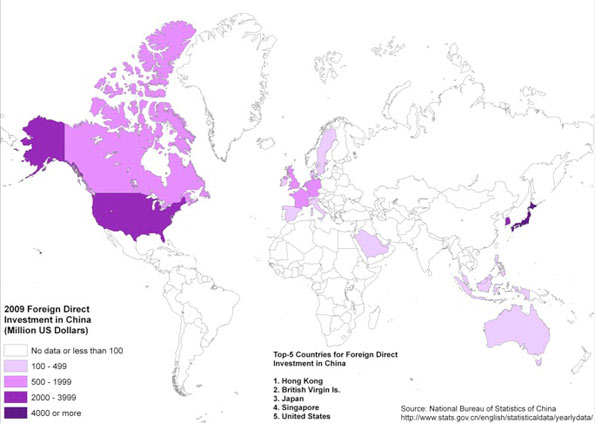
    As China itself has become wealthier, financial flows from the diaspora have continued to increase. Hong Kong’s investment into China grew from $18 billion in 2005 to $45 billion four years later. Singapore’s investment surged from $2.2 billion to $4.1 billion in the same years. This has occurred while new investment from such powerhouses as the United States, Japan, Korea and Germany has stagnated or even dropped.

    The second phase of the Sinosphere has been dominated largely by industrial projects, many of them financed or helped technologically by the diaspora. Much of trade, initially, was targeted to the rich consumer markets of North America, Europe and Japan.  Between just 2007 and 2009 China’s share of world exports expanded from 7% to 9%.

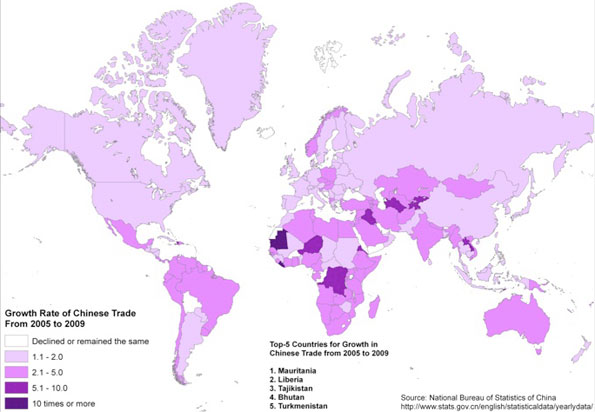
    But today the Sinosphere’s trade flow is shifting. An analysis of trade growth between 2005 and 2009 shows a significant change in focus away from advanced countries to the developing world. In the second half of the last decade, for example, trade with the United States, Japan, Germany, South Korea and the Netherlands grew by less than 50%. In contrast, commerce with key developing countries–including Afghanistan, Tajikistan, Mauretania, the Democratic Republic of the Congo, Liberia Turkmenistan, Iraq and Laos–grew ten times. Trade with large emerging economies, notably Brazil, India, Mexico and South Africa, increased five times during the same period.

    China’s thirst for resources is a big driver of this shift. Now the world’s largest car market and consumer of energy, China is in great need of oil, gas, and other natural resources. It also requires vast amounts of foodstuffs, notably corn and soybeans, for its increasingly urbanized population.

    Two of China’s new trade thrusts follow historic patterns of expansion, the first being growing investment in the Mekong Delta and Southeast Asia (Laos, Vietnam, Myanmar, Thailand, Cambodia and Malaysia). For 2010, Chinese invested $7.15 billion in energy projects alone in Myanmar. On the military side, this also includes moves by China to secure offshore islands for energy development, which is a potential source of conflict with Vietnam, the Philippines and Japan.

    The second big expansion is along the old “silk road” connecting eastern China to the energy and mineral rich “ stans” of Central Asia. This shift enhances the importance of inland Chinese cities, such as Xi’an, Chengdu and Chongqing, which are natural entrepots for central Asian trade. Perhaps even more important may prove the role of Kashgar, which was designated last year as the Special Economic Zone. Sitting on the western edge of the Xinjiang Uyghur Autonomous Zone near the border of Tajikistan, the Chinese envision Kashgar as the main rail and air link to the stans. Recent disturbances by the local Muslim majority, however, could threaten these ambitious plans.

    As China’s economy and wealth has grown, it has moved from being merely a recipient of inbound investment into a major exporter of capital. China’s outbound investment is growing much faster, rising 21% in just the past year; its overseas investment overall has grown from 53.3 billion in 2005 to 224.4 billion in 2009.

    Although still the largest destination for foreign investment, the country has vaulted into the top four in terms of outbound outlays just  behind the U.S., Japan and the U.K. It is not inconceivable that China could challenge the U.S. as the world’s top foreign investor.

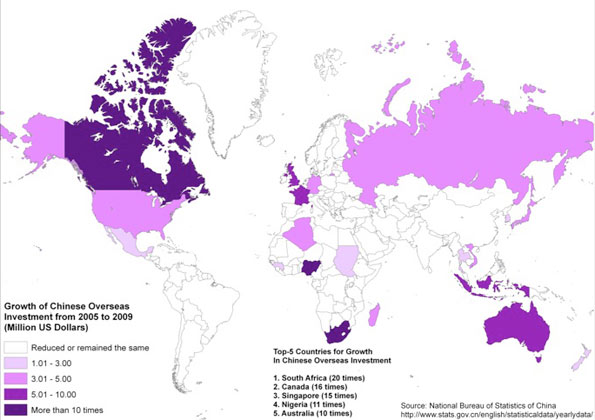
    The country’s investment strategy seems to be following two powerful trends.  One has to do with the acquisition of resources to feed the Chinese industrial machine and its growing consumer market. This explains the rapid growth of investment into the Middle East, South America and Africa. Four of the five fastest-growing investment areas for large scale investments–South Africa, Canada, Nigeria and Australia–are all major commodity exporters. Chinese investment in these countries has been growing from three to five times as quickly as those in the U.S. or Western Europe.

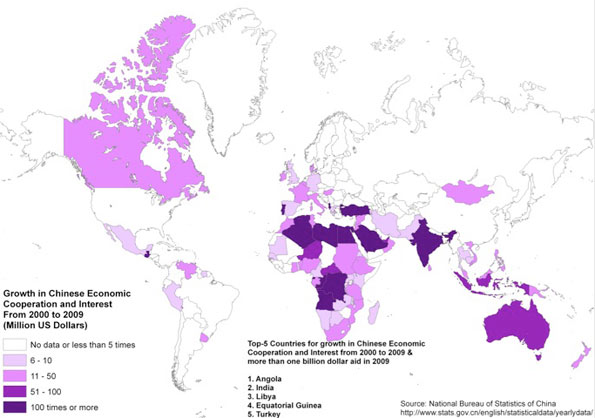
    The second, less obvious, trend relates to the idea that these countries, with generally faster growing populations, represent the most lucrative future markets for Chinese exporters.  This may be best seen in the rapid growth of Chinese government grants as well as the provision of interest-free and concessional bank loans, such as those provided by the government’s Exim bank, primarily to Chinese companies seeking to invest in developing nations, especially Africa, over the past decade. PRC financial backing for companies and projects in countries such as Angola, India, Equatorial Africa, Turkey, Egypt, the Congo and Algeria have grown over 100 times since 2005. Other key developing countries such as South Africa, Ethiopia, Somalia and Ghana all saw increases of tenfold or more.

    These developments tell us something of the future of the Sinosphere. It will be largely funded by the Chinese and their diaspora, less focused on the West and more on developing countries, including increasingly those outside the traditional stomping grounds of Chinese entrepreneurs.  The emerging Sinosphere is also likely to be somewhat less focused on manufacturing and more on services like real estate, finance and high-technology exports. This is partially due to the appeal, for manufacturers, of less expensive, more youthful countries like Bangladesh, Vietnam and Myanmar.  Wages for manufacturing workers in the Philippines, Vietnam and Indonesia are now less than half of those in China.

    These shifts are already evident by looking at recent trends in inbound investment to China, much of it from the diaspora and tax havens. Between 2005 and 2009, for example, industrial investment fell from 70% to barely 50% in 2009. The total investment in industry has remained stagnant while dollars into scientific research have grown almost five-fold. We can expect more of this as China prepares to challenge America, Japan and other advanced countries in basic research. At the same time investment into real estate has tripled, while both software and financial flows have more than doubled.

    All this explains the importance Chinese officials place on expatriates like the Taiwan-born Tang. In the 1980s and 1990s Taiwanese and Hong Kong firms spearheaded the development of China’s manufacturing prowess. Now the mainland leadership hopes that high-tech executives such as Tang will nurture and direct China’s leap into the first ranks of the global digital economy, with Perfect World’s Chengdu engineers epitomizing the future imagined by China’s aggressive regional officials. The fact that the company’s games are based largely on Chinese mythology makes the effort an even more natural fit. But Perfect World is not just looking at the Chinese or diaspora markets; it is also marketing aggressively to young gamesters in Europe and North America.

    All this can be seen as a direct challenge to the long dominant software and entertainment industries of the West, heretofore largely unchallenged by China. In a world increasingly  ’SINOFIED’  there may be huge potential for Sinosphere companies to move beyond exporting tangible goods, and increase their trade in ideas and culture to the rest of the world.

    “We are well on our way,” Tang explains from his perch in Chengdu. “China’s move into this kind of business is just beginning.”

    This research was conducted with support from the Legatum Foundation.

    This piece originally appeared at Forbes.com.

    Joel Kotkin is executive editor of NewGeography.com and is a distinguished presidential fellow in urban futures at Chapman University, an adjunct fellow of the Legatum Institute in London, and Senior Visiting Fellow at the Civil Service College in Singapore. He is author of The ity: A Global History. His newest book is The Next Hundred Million: America in 2050, released in February, 2010.

    Sim Hee Juat is currently a research associate with the Centre for Governance and Leadership at the Civil Service College of Singapore. The maps were created by Ali Modarres, Chairman of the Geography Department at California State University, Los Angeles.
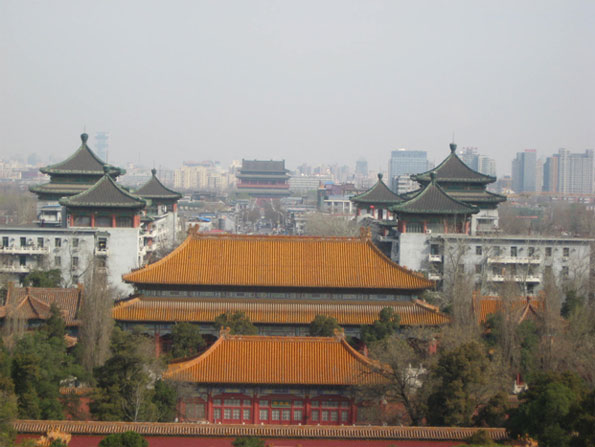
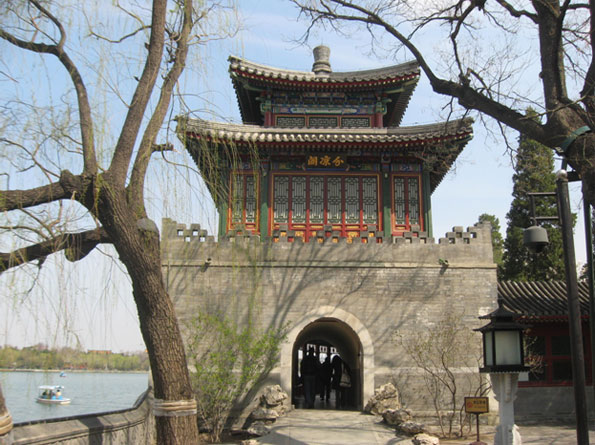
    Photo by avlxyz.

  • Megabus – King of the Road

    In recent years there’s been a resurgence in intercity bus travel, driven by the rise of low cost, non-stop service linking tier one cities like New York, Chicago, and Washington, DC with other regional hubs in their surrounding areas. This is a lively and diverse market, particularly on the east coast, with providers like Megabus, Bolt Bus, Greyhound, and a host of so-called “Chinatown” buses.

    These offer service for very low fare, ostensibly as low as a dollar, but more typically $20. Still, that’s far cheaper than even driving in most places, and certainly than flying. These services typically involve curb side loading (no stations) adjacent to a city’s main train station, making them almost a quasi-rail service or rail adjunct, while giving many of the same rail benefits as direct CBD-CBD service without requiring extensive, and expensive, ground transport on either end. With amenities like AC power outlets and free wi-fi – which many Amtrak and commuter trains don’t yet offer – it’s easy to see why they are popular. And this isn’t just with the stereotypical bus ride customer, but increasingly with everything from hip Millennials to the mothers of yuppies coming into the big city for a visit. Megabus and others are drawing an entirely new market who previously would have discounted intercity bus service – including Yours Truly.

    With a low cost service that gets people out of cars and planes and into what is basically a shared transit vehicle, you would think that Megabus would be extremely popular in the urbanist/sustainability community. But you’d be wrong. A large segment of them have indeed seen the virtues of this new school intercity bus service, but a surprisingly large number of them actually revile Megabus.

    Among the common complaints are that Megabus is “subsidized” because it uses valuable curb side real estate in cities for free, that they are implicitly subsidized by highway funding, that passengers waiting for the bus at the stop are a nuisance, that the buses clog the streets and pump fumes into the air in a way that harms the “neighborhood,” and that the service really isn’t that good because of congestion. Even the government of Washington, DC is getting in on the act, as reported they want to charge Megabus a fee for access to their loading zones.

    Every last one of these is bogus. The quickest way to illustrate this is to simply ask how urbanists would react if anti-transit forces made similar arguments against ordinary municipal bus service.

    First, municipal bus service is massively subsidized, both from a capital and operating perspective. Megabus pays for its own buses, drivers, and fuel and actually pays taxes to the government. As for subsidies from free use of curbside real estate and highway funding, large amounts of our city streets – including on pretty much every block on major streets in major cities – have permanently dedicated space to bus stops. The bus agency does not pay for these. City buses also runs on streets paid for with highway and general fund dollars. And in any case, this concrete investment in streets and highways is a sunk cost, with buses contributing little to general freeway congestion.

    As for passengers congregating at stops, that’s frequently the case with city buses as well, as this picture from Chicago shows:

    And to argue about crowds hurting city life seems a bit odd given that we’re told one of rail’s benefits is bringing all those people in to patronize businesses. I know I’ve made purchases at businesses near the Megabus stop that I wouldn’t have otherwise made. And in places like Midtown Manhattan, there are already vehicles of all types more or less continuously stopped or even double parked along the avenues. Megabus is barely a blip here. Plus don’t forget all the loading zones that already serve many private businesses all over our cities.

    Also, these bus stops are typically located in the CBD near a train station, which is already crowded and which itself can be a huge (and tax free) mega-structure in the city that poses disruption in its own right (e.g., Grand Central Terminal). What this also means that any fumes and such disproportionately are in the CBD, not really a neighborhood. Again, many train stations also feature diesel fume generating trains (Metra’s trains in Chicago were recently noted as having unsafe diesel fume concentrations). And also, city buses generally do pump out fumes as well, and truly in the neighborhoods. Anyone who’s spent time in a city knows the delight of having a poorly tuned bus pull away from the stop belching a huge black cloud. I frequently get to experience this while out jogging in my neighborhood.

    Again, if an anti-transit writer tried to disparage investment in city buses with the arguments raised against Megabus, they’d be laughed out of the house by the urbanist/sustainability crowd.

    So why the complaints? They can speak for themselves, but I suspect a couple of items. Firstly, some people just don’t like private sector solutions. That’s a view I can respect, but not agree with. But more importantly, I think that there’s fear that successful private sector intercity bus service undermines the case for high speed rail that is near and dear to the urbanist heart.

    Indeed, it is true that in many cases Megabus frankly does undermine the case, particularly for the “Amtrak on steroids” style HSR proposals on the table in places like the Midwest. Megabus already delivers basically the end to end journey times of the proposed Midwest “high speed rail” system with similar amenities but without the need for billions in government expenditures. Even on the east coast, NYC to Providence has a journey time not that much worse than the Acela – and at 20% of the ticket price. Congestion might be a real concern, but if so, customers would notice. But give Megabus some credit – they build this into their schedules. Generally the journey times are as advertised.

    I prefer to look at it differently though. What Megabus & Co. are proving is that there is a viable market for intercity transit-style travel at the right price. Thus they are helping to get people used to the idea of traveling that way and in a sense priming the pump for high speed rail at a later date as demand increases. The bus operators are doing the hard work of creating and proving out the market for this. Also, Megabus will hopefully force the backers of many of these HSR proposals to rethink their concept around 110MPH peak speeds in favor of true high speed rail. And even in the worst case, Megabus doesn’t say anything against such slam dunk investments as further upgrades to the NEC. Conceivably if and when HSR investments are made, these bus operators will service a different, lower end market and/or evolve into more of a rail complement. (For another perspective on this, see “Will Megabus Kill High Speed Rail?.”)

    In any event, I’m totally puzzled by the lack of enthusiasm or outright hostility against a service which is providing cost effective, green transport and getting people out of their cars today without tax expenditures. That’s not to say these services can’t be improved. Perhaps they should make some payment for curbside space. The wi-fi service is frequently inoperable. And their buses, particularly later in the day, can see schedule slippage as problems cascade. Perhaps some stops should be relocated to be less disruptive. But all of these are easily solvable problems. None of them vitiates the fact that these intercity bus services are one of the best transport innovations of our time.

    Aaron M. Renn is an independent writer on urban affairs based in the Midwest. His writings appear at The Urbanophile, where this piece originally appeared.

    Photo by Sidddd