Suggestions that we can grow the Auckland, NZ economy by encouraging business into the central business district (CBD) in the interests of innovation do not reflect the weight of experience. Sure, higher order professions have tended to concentrate there, and become relatively more important as manufacturing, retailing, and distribution have decamped. And in Auckland, at least, tertiary education has become a major player in the CBD. University employment has boosted the scientific as well as education sector.
But much as introductions might be made and ideas swapped over coffee, the real capacity to bring innovation to fruition belongs in the workshops, laboratories, production lines, and sales office of real companies.
Obvious as it may seem, we need more – and bigger – businesses to lead the way if Auckland is to grow through innovation and the resulting productivity gains. This blog is about why this is so and how we might help.
Firm growth and local linkages
The argument reflects a long-standing interest in industry, but the principles also apply to things like financial services, software, and design.
My most compelling experience is dated. In the seventies I visited 120 firms in the emergent electronics industry in inner London (the heart of creativity according to the density gurus), outer London, and central Scotland. What I learnt then still seems relevant today.
I wanted to know how businesses in different localities grow. I examined where they made their purchases and where their markets were. I was particularly interested in how much they depended on the local area to sustain their growth.
The results were no surprise: the more successful firms depended least on their local area. As higher value, higher growth firms expanded, though, they did strengthen reliance on their local workforce. Critical local skills became embedded even as businesses became international in scope. A commitment to and dependence on an established workforce became a key to maintaining the presence of innovative or high tech firms in an area. This experience still rings true when we think about firms like Fisher and Paykel, Glidepath, and Rakon in Auckland today.
Growth firms are nevertheless highly likely to invest away from their home base. By itself that’s no bad thing. It may be the beginning of the end, though, if they cannot raise the finance locally. As the weight of their equity shifts offshore, so their local presence becomes more tenuous.
The best outcome is probably when innovative and growing firms can be supported locally, generating local jobs, deepening local skills, and building local household and business income even as their business with the rest of the world grows.
And that’s where we seem to struggle in Auckland, despite some exceptions. As firms succeed here they often cannot find the resources they need to grow and maintain their local roots.
Relocating to grow
The companies I analysed all those years ago more or less sorted themselves out. In Inner London there were still a few post-war innovators beavering away. For the most part these had not grown much. The real inner London success stories, the firms that had prospered, were largely gone. They may have kept an office in the city but R & D, production, and distribution had moved elsewhere.
Elsewhere was outer London, or the new towns, villages, and cities in southeast England. This included a world-leading electronics belt centered on Reading, an hour from the City of London.
A key step in firm growth is the ability to relocate from small start-up premises. Consequently, localities away from congested inner cities were where the real innovation was taking place.
The new firm nurseries
Where do new companies come from in the first instance? It’s not coffee shops in the CBD and there aren’t too many enduring ideas sketched on beer coasters in inner city pubs. Some – the exceptions – may be born of enthusiasts working in garages.
Most new firms I found in the UK research were outside London. Many had spun-off established companies. This suggested one key to innovation: knowledgeable employees leaving firms to do it their way. Often they spied opportunities in their former employment that the established business could not exploit – new processes or materials, new products or applications, or new markets.
In some cases, existing businesses spun off their own new enterprises to exploit new opportunities outside existing operations.
The rise of innovative, growth firms in low density areas outside London was hardly surprising. Space was affordable, whether a start-up factory unit or land or premises for expansion. Firms could attract staff because the living and commuting was easy. Compared with London, costs were favourable. And when they relocated, firms tried to go where key staff could easily follow.
Later – in the late eighties – I visited the Cambridge Technology Park some 90 minutes north of London. This was a highly successful centre of innovation and investment. A low density environment attracted innovative light industry to easily accessed sites on the fringes of a provincial city –itself a university centre – set in an attractive living environment.
The dynamics behind Silicon Valley near San Francisco were similar. Leading edge firms here have continued to spin off imitators and innovators in an area with room to expand and access to great living conditions. Again, a key university, Stanford, is a contributor to ongoing success and business vitality.
The ingredients of a dynamic economy
This, then, is another key to a dynamic economy: the capacity of larger, older firms (and other institutions) to create the seed bed from which the new ones grow and expand in a continuous process of industry evolution – birth, growth, decline, and death.
As a variation aside, the process of firm evolution today includes the take over and reconfiguration of the old and tired. Under-performing businesses are acquired and their assets rationalised, potentially renewing creative energy. Leaner businesses may result, with new capital, a new sense of direction, and more vigorous management.
(Of course, a takeover may also be a financial play, with assets stripped, pumped, and packaged for a share market float, with precious little value added).
We need the places — and space — where old firms can operate without incurring endlessly increasing costs, growth firms can expand, and new firms come into being. What we cannot expect to do is conjure new enterprise out of an entrepreneurial vacuum. And we definitely shouldn’t seek to straitjacket new firms and old within an inner city environment.
What can we do?
One reason for Auckland’s under-performance may be that our planning has acted inadvertently against sustained business renewal and growth. Plans have may have over-focused on the inner city. Planners have concentrated on how and where we can live and failed to plan for where we might work. We dragged our feet in the zoning of substantial areas of affordable business land. As a result, we have pushed up the cost and pushed down the appeal of Auckland as a place for growing firms.
One simple thing we could do is make sure that there is plenty of industrial land available. This should be well connected, preferably removed from the congestion of inner Auckland. There are a few good opportunities on the books of the council at the moment. Large parcels at Silverdale, Massey North, Drury, and Pokeno are in various stages of planning, for example. Bringing these plans to fruition will lift the prospect of Auckland participating in a productivity-led recovery. Tying the areas together – and to the ports and airport – through the motorway system will provide the connections they need locally and internationally.
There are other issues to be addressed. We could do with a focus in education on the skills, culture, and aptitude to make things happen. Our universities must continue to connect individually and jointly with diverse vocational needs across the business board. And let’s continue to explore how to attract capital to invest in expanding firms within the region.
I am not assuming we can compete with the cheap land and labour of Asia, or match the host of engineers that Asian universities turn out each year. But when people with the right skills and background do come along, let’s ensure that they encounter an environment that supports entrepreneurship and growth, and not leave them doodling and dreaming in inner city coffee shops. And let’s do what we can to make sure that leaving town is no longer the mark of a successful firm.
Phil McDermott is a Director of CityScope Consultants in Auckland, New Zealand, and Adjunct Professor of Regional and Urban Development at Auckland University of Technology. He works in urban, economic and transport development throughout New Zealand and in Australia, Asia, and the Pacific. He was formerly Head of the School of Resource and Environmental Planning at Massey University and General Manager of the Centre for Asia Pacific Aviation in Sydney. This piece originally appeared at is blog: Cities Matter.
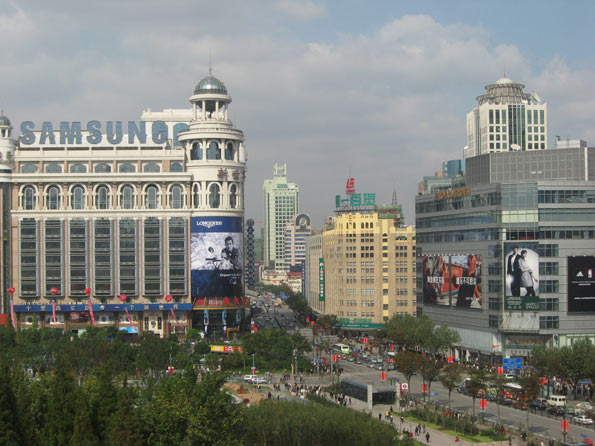
Photo by man’s pic


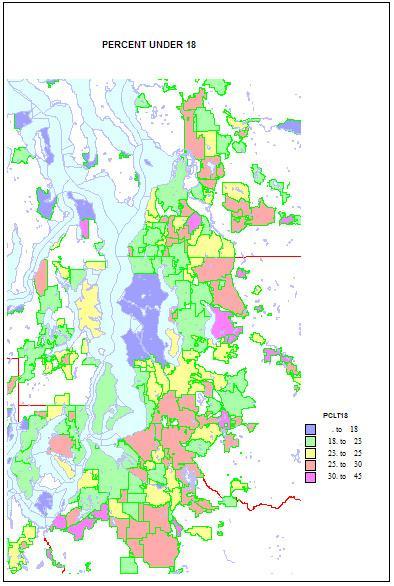 Higher shares of persons under 5 reveal areas of young families. The highest shares are in military bases and Latino towns in eastern Washington, but are quite high, over 12 percent, in the farthest suburban and exurban places around Seattle such as Duvall and Snoqualmie. They are lowest in retirement towns, on islands such as Vashon and Bainbridge, and in some college towns such as Pullman.
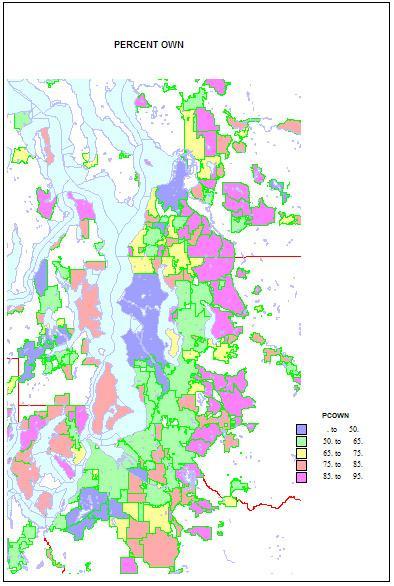 Home ownership is related to both age and household types. Rates of home ownership are extremely high, in the 90s in newer and more affluent suburbs, with mainly single family homes; the rates are lowest on military bases, college towns, and in a few less affluent suburbs, such as Tukwila. As for the city of Seattle — which has indeed changed its character in a fundamental way — home ownership has dropped to a low of 48 percent. This shift helps us understand the cleavages in Seattle’s body politic, as a formerly very middle class city adjusts to an influx of singles, renters, and young people.
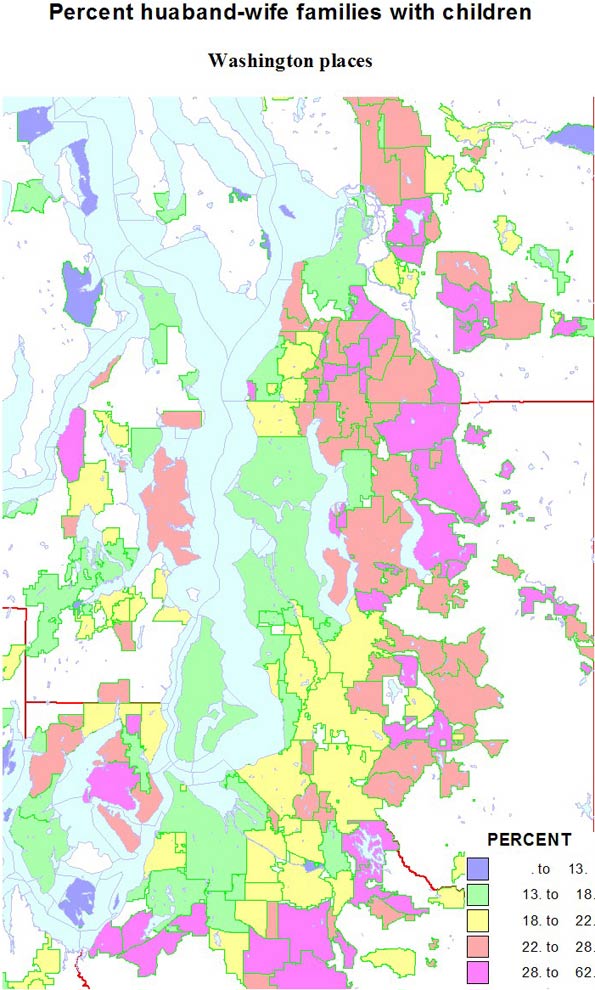
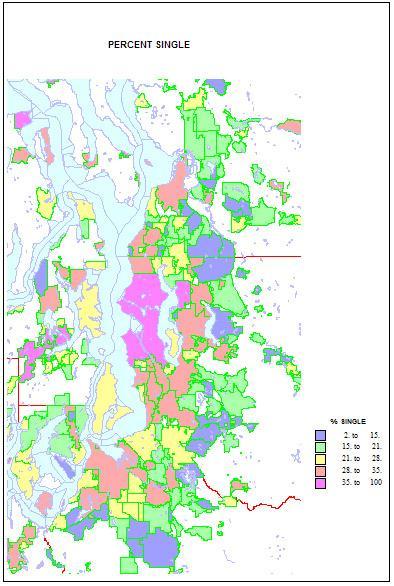 Conversely, singles are highest in two island towns, Friday Harbor and Langley, but Seattle is an extremely high 41 percent. Shares are lowest in the same new suburbs rich in families, as in Sammamish, at 11 percent. Shares of unmarried partners are a high 10 percent of households in Seattle, but are higher on Indian reservations and the cities of Hoquiam and Aberdeen. The share of single-parent households is also high on Indian reservations, in less affluent and more ethnic suburbs like Parkland and Bryn Mawr and Tukwila. It is lowest in the newer, family-filled far suburbs.


