Ideas matter, particularly when colored by religious fanaticism, wreaking havoc even in the most favored of places. Take, for instance, Iran, a country blessed with a rich heritage and enormous physical and human resources, but which, thanks to its theocratic regime, is largely an economic basket case and rogue state.
Then there’s California, rich in everything from oil and food to international trade and technology, but still skimming along the bottom of the national economy. The state’s unemployment rate is now worse than Michigan’s and ahead only of neighboring Nevada. Among the nation’s 20 largest metropolitan regions, four of the six with the highest unemployment numbers are located in the Golden State: Riverside, Los Angeles, San Diego and San Francisco. In a recent Forbes survey, California was home to six of the ten regions where the economy is poised to get worse.
One would think, given these gory details, California officials would be focused on reversing the state’s performance. But here, as in Iran, officialdom focuses more on theology than on actuality. Of course, California’s religion rests not on conventional divinity but on a secular environmental faith that nevertheless exhibits the intrusive and unbending character of radical religion.
As with its Iranian counterpart, California’s green theology often leads to illogical economic and political decisions. California has decided, for example, to impose a rigid regime of state-directed planning related to global warming, making a difficult approval process for new development even more onerous. It has doubled-down on climate change as other surrounding western states — such as Nevada, Utah and Arizona — have opted out of regional greenhouse gas agreements.
The notion that a state economy — particularly one that has lost over 1.15 million jobs in the past decade — can impose draconian regulations beyond those of their more affluent neighbors, or the country, would seem almost absurd.
Californians are learning what ideological extremism can do to an economy. In the Islamic Republic, crazy theology leads to misallocating resources to support repression at home and terrorism abroad. In California green zealots compel companies to shift their operations to states that are still interested in growing their economy — like Texas. The green regime is one reason why CEO Magazine has ranked California the worst business climate in the nation.
Some of these green policies often offer dubious benefits for the environment. For one thing, forcing California businesses to move to less energy-efficient states, or to developing countries like China, could have a negative impact overall since shifting production to Texas or China might lead to higher greenhouse gas production given California’s generally milder climate. A depressed economy also threatens many worthy environmental programs, delaying necessary purchases of open space and forcing the closure of parks. These programs enhance life for the middle and working classes without damaging the overall econmy.
But people involved in the tangible, directly carbon-consuming parts of the economy — manufacturing, warehousing, energy and, most important, agriculture — are those who bear the brunt of the green jihad. Farming has long been a field dominated by California, yet environmentalist pressures for cutbacks in agricultural water supplies have turned a quarter million acres of prime Central Valley farmland fallow, creating mass unemployment in many communities.
“California cannot have it both ways, a desire for economic growth yet still overregulating in the areas of labor, water, environment,” notes Dennis Donahue, a Democrat and mayor of Salinas, a large agricultural community south of San Jose. Himself a grower, Donahue sees agricultural in California being undermined by ever-tightening regulations, which have led some to expand their operations to other sections of the country, Mexico and even further afield.
Other key blue collar industries are also threatened, from international trade to manufacturing. Since before the recession California manufacturing has been on a decline. Los Angeles, still the nation’s largest industrial area, has lost a remarkable one-fifth of its manufacturing employment since 2005.
California’s ultra-aggressive greenhouse gas laws will further the industrial exodus out of the state and further impoverish Californians. Grandiose plans to increase the percentage of renewable energy in the state from the current unworkable 20% to 33% by 2020 will boost the state’s electricity costs, already among the highest in the nation, and could push the average Californian’s bill up a additional 20%.
Ironically California, still the nation’s third largest oil producer, should be riding the rise in commodity prices, but the state’s green politicians seem determined to drive this sector out of the state.. In Richmond, east of San Francisco, onerous regulations pushed by a new Green-led city administration may drive a huge Chevron refinery, a major employer for blue collar workers, out of the city entirely. Roughly a thousand jobs are at stake, according to Chevron’s CEO, who also questioned whether the company would continue to make other investments inside the state.
Being essentially a religion, the green regime answers its critics with a well-developed mythology about how these policies can be implemented without economic distress. One common delusion in Sacramento holds that the state’s vaunted “creative” economy — evidenced by the current bubble over surrounding social media firms — will make up for any green-generated job losses.
In reality the creative economy simply cannot make up for losses in more tangible industries. Over the past decade, as the world digitized, the San Jose area experienced one of the stiffest drops in employment of any of the 50 largest regions of the country; its 18% decline was second only to Detroit. Much of the decline was in manufacturing and services, but tech employment has generally suffered. Over the past decade California’s number of workers in science, technology, engineering and math-related fields actually shrank. In contrast, the country’s ranks of such workers expanded 2.3% and prime competitors such as Texas , Washington and Virginia enjoyed double-digit growth.
So who really benefits from the green jihad? To date, the primary winners have been crony capitalists, like President Obama’s newly proposed commerce secretary, John Bryson, who built a fantastically lucrative career (he was once named Forbes’ “worst valued chief executive”) while running the regulated utility Edison International. A lawyer by training, Bryson helped found the green powerhouse National Resources Defense Council. He’s been keen to promote strict renewable energy standards that also happen to benefit solar power and electric car companies in which he holds large financial stakes.
Other putative winners would be large international companies, like Siemens, that hope to build California’s proposed high-speed rail line, the one big state construction project favored by the green-crony capitalist alliance. Fortunately , the states dismal fiscal situation and rising cost estimates for the project, from $42 to as high as $67 billion, as well as cuts in federal subsidies, are undermining support for this project even among some liberal Democrats. Even in a theocracy, reality does, at times, intrude.
Finally, there are the lawyers — lots of them. A hyper-regulatory state requires legal services just like a theocracy needs mobs of mullahs and bare knuckled religious enforcers. No surprise the number of lawyers in California increased by almost a quarter last decade, notes Sara Randazzo of the Daily Journal. That’s two and a half times the rate of population growth.
The legal boom has been most exuberant along the affluent coast. Over the past decade, the epicenter of the green jihad, San Francisco, the number of practicing attorneys increased by 17%, five times the rate of the city’s population increase. In the Silicon Valley, Santa Clara and San Mateo counties boosted their number of lawyers at a similar rate. In contrast, lawyer growth rate in interior counties has generally been far slower, often a small fraction of their overall population growth.
If California is to work again for those outside the yammering classes, some sort of realignment with economic reality needs to take place. Unlike Iran, California does not need a regime change, just a shift in mindset that would jibe with the realities of global competition and the needs of the middle class. But at least with California we won’t have to worry too much about national security: Given the greens anti-nuke proclivities, it’s unlucky the state will be developing a bomb in the near future.
This piece originally appeared at Forbes.com.
Joel Kotkin is executive editor of NewGeography.com and is a distinguished presidential fellow in urban futures at Chapman University, and an adjunct fellow of the Legatum Institute in London. He is author of The City: A Global History. His newest book is The Next Hundred Million: America in 2050
, released in February, 2010.
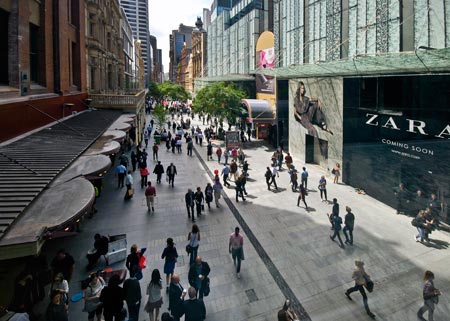
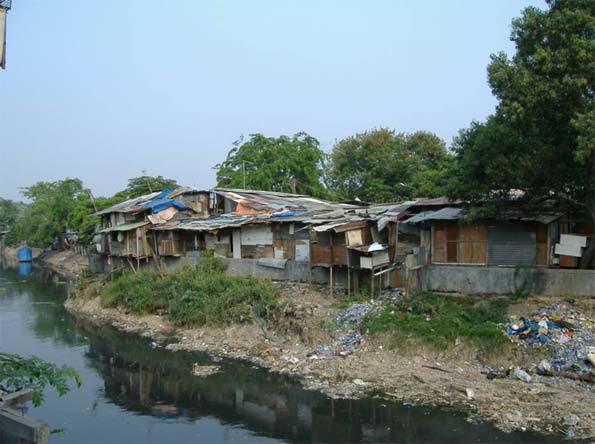
Photo by msun523