Category: Urban Issues

  • What kind of Cities do we Want, Sustainable, Liveable or Resilient?

    A critical issue from the dreadful earthquake that has severely damaged so much of central Christchurch, taken so many lives, and terrified so many residents of the whole urban area, lies in whether the Central Area should be rebuilt. Some believe it should be abandoned for some other location; others see an opportunity to set new standards in sustainability, urban design, energy efficiency, or whatever ideal urban form takes your fancy.

    Let’s put the issue of “sustainable cities” to one side because the can words means anything, and hence mean nothing.  It has become one of the most overused phrases in the English language.

    Not surprisingly, Many of Auckand’s leaders are thrilled by the recent official ranking of Auckland as the tenth most livable city in the world, and have announced their determination to make Auckland even more “liveable” than it is now. This target of livability is also surfacing in Christchurch, normally to bolster demands for urban rail, transit-oriented gentrification, promoting cycling and walking, and making the city attractive to the “creative class”.

    However this quote from a US urban blog should give the livability boosters pause:

    Much of the highly touted livability of Portland has come at the expense of making it unlivable, that is, unaffordable, to anyone without a six figure income. The creative and professional classes thrive in Portland because they are the only ones who can afford it, and they are the ones who appreciate the development style the city has tried to mandate.

    I first raised this issue of ‘rich folk’s livability’ in How Can Cities With Unaffordable Housing Be Ranked Among The Most Livable Cities In The World? here on NewGeography. Then Wendel Cox further quantified such city’s “unlivable reality" in Unlivable Vancouver, in NewGeography.

    Cities designed to be sustainable or livable are likely to be unaffordable for all but a few.

    The Case for Resilient Cities

    Many of us watched the devastation caused by the floods in Queensland, Australia, driven by major rainstorms inland, and Pacific Typhoons devastating the West Coast and the hinterlands. The combination of a strong El Nina with the Pacific Decadal Oscillation means such events will be more common and more extreme in this part of the world than we have become used to since the similar combination of 1917/18.

    However, Phil McDermott, on his blog Cities Matter was quick to comprehend the lessons to be learned by our political leaders and urban planners.

    He opens his blog comment Cities in Search of Resilience with:

    An age of extreme events?

    Without debating whether an increase in the frequency of extreme events reflects climate warming, such events can be catastrophic when they impact on densely populated areas. Natural disturbances, whether geophysical (tsunami, earthquakes, mudslides) or climatic (flooding, hurricane strength winds, tidal surges), become disasters if they strike heavily populated centres. 

    So do human acts of aggression. The tactic of terrorising civilian populations taken to new heights in the bombing raids of the Second World War and adopted by today’s extremists is most effective – and destructive – when directed at the heart of major cities.

    Later in the post Phil sets out the following vulnerabilities generated by the current "compact city" planning paradigm:

    It relies on sophisticated, centralised interdependent systems of services. This creates greater capacity for disruption when any one part fails. Economies of scale in utilities may come with increased risk of failure under duress.  This applies to sewage treatment infrastructure, communications, water, energy distribution, and power supplies. It also applies to public transport systems.

    Poorly designed intensification reduces permeable surfaces, intensifying flood impacts.

    Converting brownfield and even greenfield sites (such as undeveloped urban space) to housing or mixed use reduces the safety valve of open space and increases vulnerability associated with the concentration of buildings and populations.

    Crowding more people into smaller spaces around constrained road capacity reduces prospects for rapid evacuation from the city or into safe structures and areas.
    Lifting the density of buildings increases the consequential impacts of severe events by such things as the collapse of structures, the spread of fire, and the transmission of disease.

    Read the whole post here. You might think Phil was setting out a list of lessons to be learned from Christchurch – but that "extreme event" was still in the future. A few days later, Phil responded to this tragedy with a second blog post, that picked up the same theme, titled "A Cruel Blow to a Beautiful City" which offers this timely warning:

    We cannot resist the power of earthquakes, hurricanes, tsunami, and the like. But we can perhaps limit the devastation that accompanies them.

    The implosion of many of Christchurch’s beautiful heritage buildings is a tragedy on its own, the wiping from the landscape of much of the City’s and nation’s history. But seeing the collapse of more modern buildings is sobering. 

    What are the lessons of architecture and engineering that might be drawn from this?

    How much resistance can we realistically build into our structures?  Or should we be thinking less rigidly, and explore designs that deflect or reduce the impacts when buildings are faced with irresistible forces? Should we think more about the survival of the people in and around buildings and less about the survival of the structures? Are there innovations in design that offer refuge, protection, and escape even if walls crumble and floors collapse?

    This event in Christchurch must surely erode planners’ resistance to the decentralisation that is the mark of a prosperous, modern city, that makes it that little bit more liveable, and so much more resilient in the face of disaster?

    Surely, Hurricane Katrina, and these events in Australia and New Zealand suggest that planners should stop worrying about sea level rises that MIGHT, or might not, happen in 100 years – with plenty of warning – and start thinking more about making our cities resilient in the face of catastrophic events which we know can happen tomorrow – hurricanes, cyclones, blizzards, volcanoes, earthquakes and tsunami.

    However, the proper debate should not be as simple-minded as "high rise vs. low rise" or "old vs. modern". In Christchurch, liquefaction contributed to the collapse of some of the modern buildings. In the Kyoto earthquake some robust high-rise blocks simply fell over, because of the total collapse of the ground under the building, but remained in one piece.

    Such problems and issues are not solved by sets of simple rules but by the application of skill, experience and wisdom. 

    Owen McShane is Director of the Centre for Resource Management Studies, New Zealand.

    Photo by Kym Rohman

  • Are Chinese Ready to Rent?

    In 2010 “House price” ranked third on the list of the top 10 most popular phrases used by Chinese netizens. It came to no one’s surprise. In most Chinese cities housing prices have increased significantly over the past decade, with an especially sharp rise over the past three years.

    “House Price” is a term used loosely, due to the fact that the vast majority of Chinese real estate is made up of apartments or condominiums, while only a small few are town houses or fully detached homes. However, terminology aside, owning a property is the greatest life-goal for most Chinese citizens.

    It is worth mentioning that in China property ownership does not mean land ownership as it does in the West. According to Chinese law, what people are buying is similar to a land-use right, which in the case of residential property, expires after 70 years (40 years for commercial property). The countdown begins on the date that the real estate developer signs for the land, and not on the homeowner’s date of purchase.

    So why do Chinese people have such zest for real estate?

    Different from the western mentality: “Home is where your heart is” or “home is where you hang your hat;” the traditional Chinese concept is: “home is where your house is.”

    Prior to the 1980s, people still followed the custom of living with their parents after getting married. It was not uncommon to see a three-generation family living together in a single home. At that time renting was unheard of, as most apartments, if needed, were provided for free to a person or family by their employer, typically a state-owned entity.

    With China’s transformation from a strictly planned economy to a market economy, many state-owned companies became limited companies which restricted    free housing provision. However, employees were given the option of buying their current residences at a very low price, and most people did.

    Increasingly today, when a young couple gets married , both sets of parents make their utmost effort to help their children purchase a home. For many young people who do not live in their original hometown, it is  essential that they buy a property in the city where they work, as that is the easiest way for them to obtain a local hukou (urban residence permit). Without this, they cannot enjoy the same rights and social benefits as the locals. 

    People in China refer to the demand from young couples as “rigid demand,” meaning they must bear the social pressure to purchase a house before they can get married.

    For middle-aged Chinese, buying a house is seen as a relatively simple and secure investment, because as indicated in Figure 1, housing prices have increased steadily over the past decade.

    This may now be getting out hand and the Chinese government has identified housing prices as a serious national issue. Some macro restrictive policies on home buying were issued in April 2010. Figures issued by the National Statistical Bureau, Figure 2, prove these restrictive policies did relieve somewhat the rate of house price increase.

    Immediately following the New Year, the Chinese central government announced that its top priority for 2011 would be controlling inflation. Shortly afterwards, a more stringent policy designed to limit speculation was issued on January 26th, 2011. Subsequently, each city issued its own policies based on this, with Shanghai and Chongqing, two Zhixiashi (provincial level municipalities administrated directly under the central government) taking the lead.

    Shanghai issued the following policies on February 1st, 2011.

    1. Any household purchasing a second home must provide a 60% down payment on a mortgage; and the interest rate on the mortgage will be 110% of the benchmark rate.
    2. From the publication date of this policy, households who already own one house will only be allowed to purchase one additional home.
    3. From the publication date of this policy, households who already own two or more houses will not be allowed to purchase any additional homes.
    4. Individuals selling a home less than five years since the date of purchase will be charged an additional sales tax of 5.5% of the full sales price.

    Many more cities followed in step, and announced their own sets of policies in the following weeks.

    Only one month after these policies came into effect, it is difficult to determine their effectiveness as house prices are still increasing compared with last year, although rate of change has dropped.

    The steady price has led to a renewal of interest in rented public housing. Chongqing became the first city to respond to the central government’s call with plans to build 40 million square meters  in public-rent housing units, which will provide accommodation to 1-2 million people within the next three years and to 800,000 families by 2015. In total, Chongqing will invest 120 billion RMB (18.3 billion USD) on public-rent housing construction.

    By 2012, Chongqing will also grant the urban hukou to 3 million farmers (10 million by 2020) with rural Hukou. In exchange, these farmers will give up their agricultural land, most of which will be developed into public-rent apartments.

    Who will be eligible to apply for public-rent housing?

    Chongqing’s criteria are as follows:

    1. Applicants must be over 18 years of age.
    2. Applicants must have a job which provides steady income.
    3. Monthly income must be under 2000 RMB (305 USD) for individuals and 3000 RMB (457 USD) for families. (These two numbers will fluctuate according to other economic index changes.)
    4. Families must not already have housing or have housing in which the average space per family member is lower than 13m2.

    One thing worth pointing out is that there is no hukou limit for public-rent housing applications, which means that citizens from other cities are equally qualified. All eligible applications will be placed into a lottery and public-rent apartment allocations will go to the lottery winners.

    These public-rent apartments range from 39m2 or 420 square feet (1 bedroom, 1 living room) to 53 m2 or 570 square feet (2 bedrooms, 1 living room) with the corresponding monthly rent around 390 to 530 RMB (59 to 81 USD). When you consider that the current average price of residential property per square meter in Chongqing is 5700 RMB (868 USD), that means a person could rent a 53 m2 apartment for 47.5 years before paying the equivalent cost of purchasing an apartment of the same size.

    Following suit, many other cities in China have also started to construct public-rent apartments.

    Are all the problems solved?

    Certainly this can help most lower-income citizens to find a place to live, but there are other problems. Tenants in China are not protected by laws that uphold renter’s rights as in the west. This is largely due to the fact that there are few apartment buildings owned by a single company or person. Citizens can only rent directly from home-owners with virtually no regulatory controls over the personal renting market.  Long-term leasing contracts are nearly impossible to negotiate, and landlords are able to demand large increases in rent, or even eviction at a whim. This means that renters have no stability, and usually have to face the difficulty of moving frequently.

    More buildings designed specifically for renting, and regulations protecting both tenants and home-owners are desperately needed.

    China has a long way to go when it comes to providing accommodation for its 1.3 billion citizens. Although one clear problem lies with the resources to construct the ”hardware”, this country’s development cannot continue without also upgrading its “software”: people’s way of thinking. In this case, that means convincing people to accept the idea of renting, reversing centuries of preference for ownership.

    Lisa Gu is a 26-year old Chinese national. She grew up in Yangzhou (Jiangsu) and lives and works in Nanjing (Jiangsu).

    Photo by Charles Ryan

  • California’s Demographic Dilemma: A Class And Culture Clash

    The newly released Census reports reveal that California faces a profound gap between the cities where people are moving to and the cities that hold all the political power. It is a tale that divides the state between its coastal metropolitan regions that dominate the state’s politics — particularly the San Francisco Bay Area, but also Los Angeles — and its still-growing, largely powerless interior regions.

    Indeed, the “progressives” of the coast are fundamentally anti-growth, less concerned with promoting broad-based economic growth — despite 12.5% statewide unemployment — than in preserving the privileges of their sponsors among public sector unions and generally affluent environmentalists. This could breed a big conflict between the coastal idealists and the working class and increasingly Latino residents in the more hardscrabble interior, whose economic realities are largely ignored by the state’s government.

    The Census shows that the Bay Area and Los Angeles are growing at their slowest rate in over 160 years under American rule. Between 2000 and 2010 Los Angeles gained less population than in any decade since the 1890s. Its growth rate was slower than metropolitan Chicago, St. Louis and virtually every region that has reported to date, with the exception of New Orleans.

    This reflects not only the poor economy of the past few years, but also a widely cited drop-off in foreign immigration and continued massive outmigration of residents to other states. One reason for this mass exodus may be soaring house prices — largely the product of strong regulatory restraints — which appear to have contributed to slowing population growth after 2003.

    Yet not all of California is stagnating demographically. The state’s interior region — what I call “The Third California” — is growing steadily. While  Orange County, Los Angeles, San Francisco, San Jose and the Silicon Valley increased their population by only 6% or less over the last decade, inland areas such as Riverside-San Bernardino, Sacramento and the Central Valley saw growth of 20% or more. Overall, the interior counties together gained 2 million residents , roughly twice as many as the combined coastal metropolitan areas.

    The reasons for this growth are not difficult to comprehend. In boom times and hard times, housing prices in the coastal regions tend to equal as much as seven or eight times a median family income. The prices in the interior can be three times or less.

    In addition, during the past two decades, the interior region enjoyed fairly strong economic growth. Pro-business county governments promoted the expansion not only of housing, which boosted construction, but of basic industries such as food processing, manufacturing and warehousing. According to economist John Husing, the Inland Empire alone accounted for over 40% of the state’s total job growth.

    Today, in the wake of the collapsed housing bubble, these interior counties are reeling, with double-digit unemployment (in some cases reaching closer to 20%) and what appear to be diminishing prospects. Five of the nation’s 10 metro areas for foreclosures are located in California’s interior.

    Under normal circumstances, lower housing prices and business costs would lead — as in past recessions — to a spate of new economic growth, but this the radical turn in California government could keep these areas permanently poor.

    Essentially, the Third California has become hostage to the coastal cities and their increasingly bizarre economic policies. Under first Arnold Schwarzenegger and now Jerry Brown, California has embraced a series of radical environmental edicts that spell disaster for the more blue-collar interior. These include dodgy land use policies designed to combat “climate change” but essentially seek to steer middle- and working-class Californians out of their cherished suburban homes and into densely packed urban apartment complexes.

    The last election confirmed the Bay Area’s ascendency in Sacramento. Gov. Jerry Brown was previously mayor of Oakland (a city that actually lost population this decade), while the lieutenant governor, former San Francisco Mayor Gavin Newsom, and the new attorney general, Kamala Harris, are from the city by the Bay.  The San Francisco area’s population may be about the same as the Inland Empire’s, but its political perspective now dominates the state.

    Husing describes San Francisco as “a bastion of elitist thinking” due to a large “trustifarian” class who have turned the city into favorite spot for green and fashionably “progressive” think tanks. This thinking is increasingly influential as well in a rapidly changing Silicon Valley. In the past the Valley was a manufacturing powerhouse and had to worry about such things as energy prices, water availability and regulatory relief. But the increasingly dominant information companies such as Apple, Facebook, Twitter, Google and their wannabes are widely unconnected to industrial production in the region. To be sure, they have created a financial bubble in the area that has made some fantastically rich, but according to researcher Tamara Carleton they have contributed very little in new net job creation, particularly for blue-collar or middle-class workers.

    There’s a bit of a snob factor here. Fashionable urbanistas extol San Francisco as a role model for the nation. The City, as they call it, has adopted the lead on everything from getting rid of plastic bags and Happy Meals is now considering a ban on circumcision. When it comes to everything from gay rights to bike lanes, no place is more consciously “progressive” than San Francisco. So why should that charmed city care about what happens to farmworkers or construction laborers in not-so-pretty Fresno?

    Class and occupational profile also has much to do with this gap between the Californias. Husing notes that the Bay Area has far more people with college degrees  (42%) than either Southern California (30%) or the Central Valley (where the percentage is even lower). Green policies that impact blue-collar workers — restraining the growth of the LA port complex, restricting new single-family home construction or cutting off water supplies to farmers — mean little distress for the heavily white, aging and affluent Bay Area ruling circles.

    But such moves could have a devastating impact on the increasingly Latino, younger and less well-educated populace of the interior. Outside of the oft-promised green jobs — which Husing calls “more propaganda than economics” — it is these less privileged residents’ employment that is most likely to be exported to other states and countries, places where broad-based economic growth is still considered a worthy thing.  “By our ferocious concentration on the environment, we have created a huge issue of social justice,” Husing points out. “We are telling blue collar workers we don’t want you to have a job.”

    This all presages what could be the greatest issue facing California — and much of the country — in the decades to come. In places where San Francisco-like fantasy politics preside, expect to witness a growing class and ethnic divide, with consequences that could prove catastrophic to the future of our increasingly diverse society.

    This piece originally appeared at Forbes.com

    Joel Kotkin is executive editor of NewGeography.com and is a distinguished presidential fellow in urban futures at Chapman University, and an adjunct fellow of the Legatum Institute in London. He is author of The City: A Global History. His newest book is The Next Hundred Million: America in 2050, released in February, 2010.

    Photo by wstera2

  • New Jersey: Still Suburbanizing

    The state of New Jersey virtually defines suburbanization in the United States.  New Jersey is not home to the core of any major metropolitan area but, major portions of the nation’s largest metropolitan area (New York) and the fifth largest metropolitan area (Philadelphia) are in the state (See map). These two metropolitan areas comprise 17 of the state’s 21 counties. Another county (Warren) is in the Allentown, Pennsylvania metropolitan area, while Atlantic (Atlantic City), Cumberland and Cape May are single-county metropolitan areas. No one, however, should make the mistake of imagining that New Jersey is wall to wall suburbanization. In the 2000 census, more than 60 percent of the state’s land area was rural, with urban areas (areas of continuous urban development) making up less than 40 percent of the state’s land area, while 94 percent of the 2000 population was urban (which includes suburban).

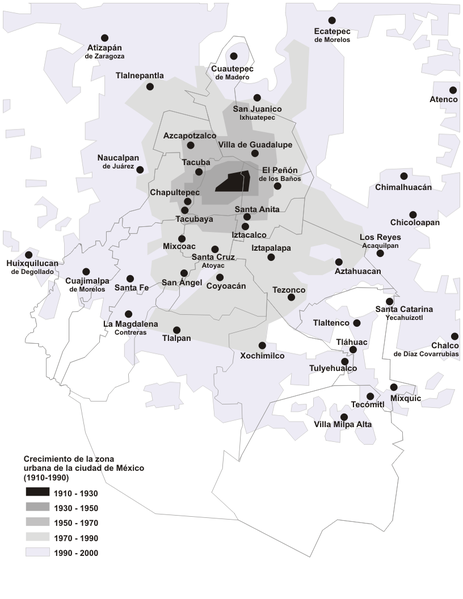
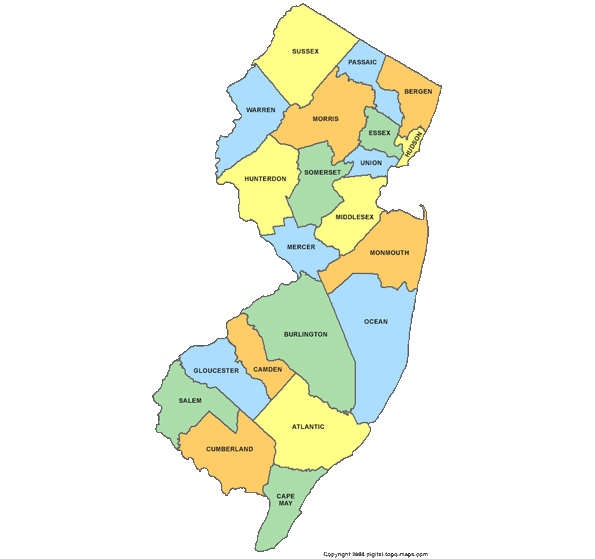
    Map courtesy of Passaic Public Library

    The recently released 2010 census data indicates that the dispersion of New Jersey population, which was underway by 1900 and continued apace in the last decade.

    New Jersey’s Larger Municipalities: This is not to suggest that it was a bad decade for the larger municipalities in the state. However, the 20th century was not kind to New Jersey’s largest municipalities. At some point during the century, six municipalities reached a population of 100,000 or more. Four of these municipalities were near the city of New York and were eventually engulfed by its suburbanization (Newark, Jersey City, Paterson and Elizabeth). Another, Camden, was engulfed by Philadelphia’s expansion and the last, the state capital Trenton, is midway between the cores of the two metropolitan areas and has more recently become a part of the New York metropolitan area.

    The new decade started out better for these municipalities. Newark, Jersey City, Elizabeth and Camden gained population between 2000 and 2010. However, even after the population gains, Newark’s population remains 165,000 (37 percent) below its 1930 peak. Jersey City remains 70,000 (22 percent) below its 1930 peak, despite the growth of a new financial district just across the Hudson River from lower Manhattan. Camden remains approximately 35,000 (37 percent) below its 1950 peak. Of the four municipalities gaining population, Camden did the best, adding 6.9 percent to its population, a full 50 percent above the statewide increase of 4.5 percent.

    Paterson and Trenton posted small population losses. Trenton remains nearly 45,000 (33 percent) below its 1950 peak (Table 1).

    Table 1
    New Jersey Municipalities Achieving 100,000 Population
    Census Population Peak
    Municipality 2000 2010 Change % Change Population Year
    Newark      273,946    277,140       3,194 1.2%     442,337 1930
    Jersey City      240,055    247,597       7,542 3.1%     316,715 1930
    Paterson      149,222    146,199      (3,023) -2.0%     149,227 2000
    Elizabeth      120,568    124,969       4,401 3.7%     124,969 2010
    Trenton        85,403      84,913         (490) -0.6%     128,009 1950
    Camden        78,672      84,136       5,464 6.9%     124,555 1950
    Total      947,866    964,954     17,088 1.8%   1,285,812
    Balance of State   7,466,484  7,826,940    360,456 4.8%
    New Jersey   8,414,350  8,791,894    377,544 4.5%   8,791,894 2010


    Elizabeth and Paterson however have been far more successful in retaining their population than other older municipalities, both in New Jersey and around the nation. Both Elizabeth and Paterson have become majority Hispanic and have a sizeable African American community. They also have a large immigrant community.  In Elizabeth, 45 percent of the population is foreign born, almost four times the national rate. Paterson has an immigrant population of 25 percent.  

    The Older Suburban Counties: Nonetheless, even with the modest population reversals in four of the five municipalities in the Philadelphia and New York metropolitan areas, their corresponding older suburban counties grew slower than the rest of the state in the 2000s. Combined, Camden, Essex, Hudson, Passaic and Union counties – fast growing suburbs of the early 1900s – grew at a rate of 1.6 percent, compared to the statewide growth rate of 4.5 percent, capturing 12 percent of the statewide growth.  (Table 2).

    Table 2
    New Jersey County Population Growth by Area
    Area 2000 2010 Change % Change Share of Growth
    5 Older Suburban Counties  2,923,130  2,969,617    46,487 1.6% 12.3%
    Balance of NY & Phila Metropolitan Counties  4,887,467  5,184,873  297,406 6.1% 78.8%
    Outside NY & Phila Metropolitan Area     603,753     637,404    33,651 5.6% 8.9%
    Total  8,414,350  8,791,894  377,544 4.5% 100.0%
    Note: 5 Older Suburban Counties Include Camden, Essex, Hudson, Passaic and Union


    The Newer Suburban Counties: The bulk of New Jersey’s growth has taken place, as in the rest of the country, in more newly suburbanizing counties of the Philadelphia and New York metropolitan areas (Note 1). The growth rate in these counties was 6.0 percent, well above the statewide growth rate of 4.5 percent. Overall, the outer suburban counties accounted for 73 percent of the state’s population growth during the 2000s. The strongest growth was in Ocean County, which is at the furthest distance (fifty to one hundred miles) from New York City.  Ocean County grew 13 percent, adding 66,000 people to its population, nearly one-fifth of the state population gain. Gloucester County, in the Philadelphia area also grew 13 percent, adding 33,000 to its population. Ocean and Gloucester accounted for more than one-quarter of New Jersey’s population growth. Only one other county added more than 50,000 people, Middlesex, which is adjacent to the New York City borough of Staten Island in New York, much of which is made up of postwar suburbanization.

    Counties Outside the Large Metropolitan Areas: The counties outside the New York and Philadelphia metropolitan area, Atlantic, Cape May, Cumberland and Warren added 5.6 percent to their population and nine percent of the state’s population gain. The largest growth was in Atlantic County (8.7 percent) and Cumberland County (6.1 percent), both adjacent to counties of the Philadelphia metropolitan area. Cape May County had the largest population loss in the state, at 4.9 percent (Essex County, where Newark is located, lost 1.2 percent, the only other county to lose population).

    Small Area Analysis: The dispersion of the population is also illustrated by "place" data, which includes incorporated municipalities (Note 2) and "census designated places."

    Generally, newer housing reflects the distance of suburbs from the urban core. Gaining a larger share of population growth, this demonstrates a primarily  suburban, rather than urban core oriented, expansion.  An analysis of the more than 500 places (municipalities and "census designated places") indicates that the greatest share of New Jersey’s growth is in new suburban areas.

    Among places in which housing has a median construction date of 1945 or earlier, there was a 0.8 percent reduction in population. The growth rate then rises with each 10 year increment, reaching 4.0 percent in places with a median construction date of 1976 to 1985 and 11.1 percent for places with a median construction date of later (though this is the smallest category).

    However, the growth in these places accounts for only 18.5 percent of the state’s population gain. The other 81.5 percent was outside the incorporated municipalities and the census designated places. This population is generally in the state’s townships, some of which are older (such as North Bergen or Woodbridge), but most of which are much newer.  However, much of the growth in the townships was in newer areas, with 84 percent in areas with median construction dates of 1966 or later (Note 3)

    Thus, all-metropolitan New Jersey is becoming more suburban, while older, major municipalities such as Newark, Jersey City and Camden are enjoying a welcome respite from their generally steep declines.

    Note 1: These counties include Bergen, Burlington, Cumberland, Hunterdon, Mercer, Middlesex, Monmouth, Morris, Ocean, Salem, Somerset and Sussex.

    Note 2: New Jersey township officials have been engaged with the Census Bureau in a dispute over whether New Jersey townships should be considered incorporated. This analysis uses the "non-incorporated" status as defined by the Census Bureau, without taking a position on the nature of the disagreement.

    Note 3: The Census Bureau routinely makes changes to "census designated places" between censuses. As a result it is not possible to reconcile the township and place totals to the state total. There is a discrepancy of approximately 1.5 percent. This discrepancy is small enough to make the township figures generally reflective of the median construction dates.

    Wendell Cox is a Visiting Professor, Conservatoire National des Arts et Metiers, Paris and the author of “War on the Dream: How Anti-Sprawl Policy Threatens the Quality of Life

  • The Protean Future Of American Cities

    The ongoing Census reveals the continuing evolution of America’s cities from small urban cores to dispersed, multi-polar regions that includes the city’s surrounding areas and suburbs. This is not exactly what most urban pundits, and journalists covering cities, would like to see, but the reality is there for anyone who reads the numbers.

    To date the Census shows that  growth in America’s large core cities has slowed, and in some cases even reversed. This has happened both in great urban centers such as Chicago and in the long-distressed inner cities of St. Louis, Baltimore, Wilmington, Del., and Birmingham, Ala.

    This would surely come as a surprise to many reporters infatuated with growth in downtown districts, notably in Chicago, Los Angeles, Denver and elsewhere. For them, good restaurants, bars and clubs trump everything. A recent Newsweek article, for example, recently acknowledged Chicago’s demographic and fiscal decline but then lavishly praised the city, and its inner city for becoming “finally hip.”

    Sure, being cool is nice, but the obsession with hipness often means missing a bigger story: the gradual diminution of the urban core as engines for job creation. For example, while Chicago’s Loop has doubled its population to 20,000, it has also experienced a large drop in private-sector employment, which now constitutes a considerably smaller share of regional employment than a decade ago. The same goes for the new urbanist mecca of Portland as well as the heavily hyped Los Angeles downtown area.

    None of this suggests, however, that the American urban core is in a state of permanent decline. The urban option will continue to appeal to small but growing segment of the population, and certain highly paid professionals, notably in finance, will continue to cluster there.

    But the bigger story — all but ignored by the mainstream media — is the continued evolution of urban regions toward a more dispersed, multi-centered form. Brookings’ Robert Lang has gone even further, using the term “edgeless cities” to describe what he calls an increasingly “elusive metropolis” with highly dispersed employment.

    Rather than a cause for alarm, this form of  development  simply reflects  the protean vitality of American urban forms.  Two regions, whose results were released last week, reveal these changing patterns. One is the Raleigh region, which has experienced a growth rate of 42%, likely the highest of the nation’s regions with a population over 1 million. This metropolitan area, anchored by universities and technology-oriented industries, is among the lowest-density regions in the country, with under 1,700 persons per square mile, slightly less than Charlotte, Nashville and Atlanta.

    Unlike the geographically constrained older urban areas, Raleigh’s historical core municipality experienced strong growth, from 288,000 to 404,000, a gain of 40%. This gain was aided by annexations that added nearly 30% to the area of the municipality (from 113 to 143 square miles). The annexations of recent decades have left the city of Raleigh with an overwhelmingly suburban urban form. In 1950, at the beginning of the post-World War II suburban boom, the city of Raleigh had a population of 66,000, living in a land area of only 11 square miles.

    Even here, however, the suburbs (the area outside the city of Raleigh) gained nearly two-thirds of the metropolitan area growth (65%) and now have 64% of the region’s population. Over the last ten years, the suburbs have grown 43%. It is here that much of the economic growth of the Research Triangle has taken place, as companies concentrate in predominately suburban communities such as Cary.

    Yet in most demographically healthy urban regions, the growth continues to be primarily in the suburban centers. One particularly relevant example is the Kansas City area, a dynamic region anchoring what we have identified as “the zone of sanity.” Like most American regions, the Kansas City area is growing, but in ways that often do not resemble the fantasies of urban density boosters.

    KC’s growth pattern is important and could be a harbinger of what’s to come in this decade. Along with Indianapolis, this resurgent Heartland region is expanding faster than the national average. It is also attracting many talented people, ranking in our top ten list of the country’s “brain magnets,” a performance better than such long-standing talent attractors as Seattle, Portland, San Francisco, and Boston. Between 2007 and 2009, the Kansas City region’s growth in college-educated residents was more than twice the rate of our putative intellectual meccas of New York, Chicago or Los Angeles.

    But despite the wishes of some  in Kansas City’s traditional establishment, this cannot be interpreted as meaning that  the “hip and cool” are being lured en masse to the city’s inner core. Over the past decade, as in most American regions, Kansas City has expanded far more outward than inward. Despite a modest increase in the city’s population of some 18,000 — much of it in the city’s furthest urban boundaries — the city’s population remains below its 1950 high. On the other hand, some 91% of its 200,000 population increase occurred in the suburban periphery.

    Critically, it is important to note that this expansion reflects not so much the growth of “bedroom” communities, but a dramatic shift of employment to the periphery. By far the most important center for this new suburban growth in jobs and people lies across the river in Johnson County, Kan.. Over the past decade, Johnson County has accounted for roughly half of the region’s total growth.

    Johnson County  – which boasts among the highest levels of educated people in the country — also has become the primary locale for many technology and business service firms, with more people commuting into the area than out. This reflects an increasingly suburbanized economic base. Over the past decade the urban core of Jackson County has lost 42,000 jobs, while the surrounding suburbs have grown by 20,000, with the biggest growth in largely exurban Platte County.

    So what does this tell us about the future of the American urban region?  Certainly the expansion of relatively low-density peripheral areas negates the notion of a  ”triumphant” urban core. Dispersion is continuing virtually everywhere, and with it, a movement of the economic center of gravity away from the city centers in most regions.

    But in another way these patterns augur a bright future for an expansive American metropolis that, while not hostile to the urban center, recognizes that most businesses and families continue to prefer lower-density, decentralized settings.  The sooner urbanists and planners can accommodate themselves to this fact, the sooner we can work on making these new dynamic patterns of residence and employment more sustainable and livable for the people and companies who will continue to gravitate there.

    This piece originally appeared at Forbes.com

    Joel Kotkin is executive editor of NewGeography.com and is a distinguished presidential fellow in urban futures at Chapman University, and an adjunct fellow of the Legatum Institute in London. He is author of The City: A Global History. His newest book is The Next Hundred Million: America in 2050, released in February, 2010.

    Kansas City skyline photo by Tim Samoff

  • High Speed Rail: The Dream Scheme Scenario

    Ever since Jay Gould, Leland Stanford, and Cornelius Vanderbilt acquired their first legislatures, railroads have been best understood as political networks, rather than as transportation lines. The Obama administration is hyping high-speed rail (HSR) with a $53 billion proposal not because the president is a trainspotter or because he collects back copies of the Official Guide of the Railways (like I do). Rather, it’s because politicians understand that the states blew their money on generous pension plans, pretentious sports stadiums, and bridges to nowhere, and now need billions to plug their budget deficits. It’s easier to funnel money into tapped–out state capitals under the smoke and mirrors of a feel-good rail project than it is to announce that the federal government stands behind states’ subprime debts. The Government Accounting Office estimates unfunded state liabilities at $405 billion, which is probably what HSR would, in the end, cost. Think of it as the Stimulus Express.

    The high-speed scheme is a dream of superfast trains, traveling at 150 m.p.h., linking Portland, Maine, and Charlotte, North Carolina; Chicago with St. Louis and Kansas City; the Orlando corridor in Florida (which the governor there has rejected); and express trains in Texas and California. Another way to look at the proposed HSR network is to imagine it connecting the cities and states that Obama needs to carry if he is to have a chance of winning the 2012 election.

    Along the high-speed tracks-to-be are stops in Michigan, Ohio, North Carolina, Florida and Pennsylvania, which are key 2012 electoral contests. Red states west of the Mississippi, by contrast, will have to wait for Amtrak’s Southwest Chief to arrive three hours late in Dodge City.

    Before the U.S. goes into hock over HSR, it might consider making a virtue of low-speed rail. Slow food has it followers. Why not the same for slow trains, since that’s the best that Amtrak can offer? Herewith are ten ideas that will get more (fare-paying) Americans back on the (less-than-perfect) rails. Implementing them wouldn’t cost anywhere near $53 billion. Done right, they would even make money.

    • Privatize the corridor services between Boston and Washington, Chicago and St. Louis, and San Diego and Los Angeles. But mandate that at least two competing companies operate passenger service on the lines. If American railroads are not interested in the job, French or German national rail companies would bid on the service.
    • Sell off the franchise rights to Amtrak passenger cars to mall stores, restaurants, and bars. A movie car could run between Philadelphia and Pittsburgh, and a discotheque (Pullman 54) could operate, for example, on the night train from New Orleans to Atlanta. I am sure the Outback restaurant chain would want some cars in the West. Who cares about speed if you are having fun or can use the time productively? I would happily ride the Barnes & Noble to Charlotte or the L.L. Bean to see my family in Maine. Why can’t Amtrak add a few FedEx Kinko cars?
    • Auction off Amtrak’s sleeping car services to Hyatt, Holiday Inn, Embassy Suites or Motel 6. They know more than Amtrak does about making beds.
    • Instead of catering to the gun lobby (Amtrak now allows passengers to pack heat), work with the car rental agencies to create a car-sharing alliance at Amtrak stations to solve the problem of getting anywhere from far-flung places like the Richmond station, which is located miles from downtown.
    • Spin off Amtrak Vacations to Outward Bound, the American Youth Hostel Association, Carnival Cruises, the Boy Scouts, or the Green Tortoise (a hippie bus tour company), and let them offer rail cruises to national parks, jazz festivals, fall foliage, major league stadiums, and jamborees.
    • Create Amtrak University, and outfit trains to take high school and college students to places like Gettysburg, Little Big Horn, Bunker Hill, the Grassy Knoll, Mark Twain’s museum in Hannibal, Missouri, and Marion, Ohio (where Warren Harding ran the local newspaper).
    • Invent a clean steam engine that runs on scrubbed American coal, and market passenger railroads as green travel, locally grown.
    • Retrofit some baggage cars to carry bicycles easily and cheaply, and develop a national network of “Rails and Trails,” so that passengers can have a seamless connection between the train and their bikes. At the moment, it’s easier to ship a gun on Amtrak than it is to take a bike.
    • Deregulate passenger service, to encourage the flourishing short-line rail industry to carry passengers on some of their freight lines, as the Housatonic R.R. Is proposing to Pittsfield, Massachusetts.
    • Invest surplus funds in commuter rail projects, including the proposed Hudson River tunnels that New Jersey Governor Chris Christie turned down. Commuter rail is a proven, if dreary commodity. High-speed rail dreams are the stuff of State of the Union addresses, but the top ten commuter systems together transport about 1.63 million passengers daily (Amtrak has 74,000 a day).

      Most commuter systems need nicer stations, easier links to other lines and buses, and to provide comfort zones with better coffee (not a federal budget concern), clean restrooms, and Wifi. I love the coming Long Island Rail Road link to Grand Central and the new BikePorts of the Massachusetts Bay Transportation Authority.

    Had the United States integrated high-speed rail into the Interstate Highway system — imagine tracks in the median strips — the idea might have worked. Imposed on a society addled with cars and planes, it has the risk of becoming a cost-overrun nightmare of $82 million a mile versus $2.4 million for traditional rails.

    Much of the infrastructure is already in place to develop a national revival of low-speed rail, at a fraction of the costs of subsidized HSR. The trains we have can be privatized, franchised, hot spotted, double-bedded, and showered, and no one will care about the engine speed. To save billions, if not to make money, why can’t the U.S. subscribe to the words of author Paul Theroux: “Better to go first class than to arrive.”

    Photo by Jeramey Jannene of train tracks right outside of Havenwoods State Forest in Milwaukee, Wisconsin.

    Matthew Stevenson is the author of Remembering the Twentieth Century Limited, a collection of historical essays. He is also editor of Rules of the Game: The Best Sports Writing from Harper’s Magazine.

  • Is Nashville the Next Boomtown of the New South?

    I traveled to Nashville for the first time in 2007, spending most of my time in the downtown area. I posted my impressions here, noting the high growth and high ambition level as well as the fantastic freeways, but also the generally unimpressive development and built environment.

    I did another fly-by in April 2008. I made a conscious effort to try to get out and see different areas this time around. My tour guide was an Indy native who had spent the last decade or so in the northeast. He’d moved to the city about a year previously, so was seeing some of this for the first time himself. But it worked well, I thought.

    I believe Nashville is an extremely important case study for metros in the Midwest to examine. Here is a city that was a sleepy state capital for many years while other southern towns such as Atlanta and Charlotte took off. Then it began heading on an upwards trajectory. It is not yet at such a high growth rate that it appears to be a completely different sort of place than the Midwest. Its population growth is only 1.9% per year, for example, not much higher than Midwest growth champion Indianapolis at 1.5%. But all the trend lines are accelerating. Corporate headquarters are flocking, in city development is booming, transplants from the north are arriving. It would not surprise me to see this city pop into a higher gear when the economy turns upwards again.

    Nashville is a great case study because we can observe the inflection point in growth more or less as it happens. And also try to make sense of what is driving it. And to understand why Midwestern cities aren’t seeing it. I look at Nashville and ask myself: what does this place have on the Midwest? Compare it to Columbus, Cincinnati, Indianapolis, Louisville, Kansas City, and Milwaukee and see if anything jumps out that would explain it. Some unique factor of Nashville. Consider:

    • Nashville is smaller than most of those places today, so it isn’t size
    • It can’t be just because Nashville is in the south or a no income tax right to work state. Memphis in the exact same state and is hurting. Birmingham and Montgomery haven’t done much in right to work Alabama.
    • Its college degree attainment of 31% is below many comparable Midwest cities, though it should be noted that Nashville is moving up the league tables fast. It was recently ranked the 4th biggest “brain magnet” in the United States.
    • It has no particular unique industry or assets. It can cite its Music City USA image, which certainly drives tourism and money. But Midwestern cities have other equivalent things they can counter with. Plus, it was Music City USA all the time it was a sleepy state capital as well.
    • Just being the state capital doesn’t explain it. Indy and Columbus are both in that role and are getting out paced by Nashville.
    • Having a consolidated city-county government is not unique. Indy and Louisville are both consolidated, and Columbus is quasi-consolidated because of the ability of that city to annex most of Franklin County and even parts of several adjacent counties.
    • There are mountains, but the geography does not appear to be particularly compelling.
    • There are not fabulous historic districts in every region. In fact, while there are some nicer neighborhoods, much of the city is built out exactly like most Midwestern burgs of equivalent size. A lot of it is outright dumpy.
    • Its cultural institutions are not as advanced as Midwestern ones. The Nashville Symphony isn’t going to take on the Cincinnati Symphony any time soon, that’s for sure.
    • It doesn’t have some fortress home grown companies that are driving it.
    • It has Vanderbilt University, but most Midwestern cities have a good school in them too.

    I compare Nashville to the top performing Midwest metros and just scratch my head. Nashville’s arguably got nothing on the Midwest and in many ways is playing from an inferior position. So what is going on?

    I’ll take a shot at explaining a few things I’ve noticed. I’m not saying these are necessarily the answers. But they are things to consider. If I were head of strategy for a Midwestern metro, I’d be conducting an extensive peer city comparison of Nashville to try to figure it out in more detail. But here are some thoughts:

    • First, as I previously noted, is the extremely high ambition level. These guys are clearly looking at places like Atlanta, Dallas, Charlotte, etc. and saying “Why not us?” Their mission is to become one of America’s great cities. There’s no “era of limits” in Nashville. You see this come through, for example, in their convention center plans, which call for 1.2 million square feet. It comes through in their highways, which are being built 8-10 lanes with HOV lanes, as if getting ready to become the much bigger city they plan to be. It shows in the numerous residential high rise and midrise projects. It shows in how Nashville, unlike every comparable Midwest metro, already has a commuter rail line in service. Midwesterners recoil from change, and would view becoming the next Charlotte or Atlanta with horror. But Nashville is eager to move up to the premier league, so to speak.
    • Second is the unabashedly pro-growth and pro-business stance. Every development in the Midwest is opposed by some group of NIMBY’s. Densification, even in downtown areas, is often anathema to influential neighbors. Not in Nashville. Huge tracts of inner city are being rebuilt from vacant lots or single family homes into multi-story town houses or condos. There are midrises all over the place. It does not appear that development has any problem getting approved there.
    • Third is low taxes and costs. Tennessee does not have a state income tax. Electricity from the TVA is dirt cheap. Property taxes cannot be increased without a public vote. It remains to be seen if this environment can be sustained, but for right now, cost appears to be an advantage.
    • Fourth is that they’ve embraced instead of rejecting their heritage. Rather than saying that country music is for hillbillies and an embarrassment to their new ambitions as a big league city, they’ve proudly embraced it. They updated the image with a glitzy, “Nashvegas” spin and made it the core of what Nashville is all about. Most Midwestern elites seem to view their existing heritage negatively. But great cities have to spring from the native soil in which they are born. Their character has to be organic. Import all the fancy stores, restaurants, sports teams, transit lines, etc. you want, but it won’t distinguish your city. Nashville learned this lesson well, probably from Atlanta. The southern boomtowns took their existing Southern heritage, dropped the negative items that needed to be changed, updated the core positive elements, and created the vision of the “New South”. This is something that can be embraced by the masses, unlike the elitist transformations that are often promulgated.
    • Fifth is that, again, they appear to have studied the lessons of places like Dallas, Atlanta, Charlotte, etc. They’ve seen the need for freeways. They’ve looked at the style of development and the neo-traditional urban form. I was very impressed to see that there while most condo developments and such were fairly undistinctive, I did not note any that exhibited poor urban design form. When I consider the poorly designed projects that are frequently implemented in, say, downtown Indianapolis, it is easy to see who gets out more. Nashville has done its homework.
    • Sixth, Nashville is realistic and open to self-criticism without being self-flagellating. I posted my previous take on the city on a discussion forum dedicated to that city. Given the modestly negative tone contained in much of it, I expected to get crucified. Surprisingly, most of them basically agreed with it. Too many cities in the Midwest either engage in naive boosterism or wallow in woe-is-us. Perhaps because of the large number of newcomers, there’s a more realistic assessment of where Nashville stands. And this enables rational decisions about where it needs to go.

    If anyone else has observations to share, I would love to hear them.

    Here are some photographs I took while there. First, a view of the Tennessee capitol building across a green space I believe is called the Bicentennial Mall.


    A street scape in Hillsboro Village, a small commercial district near Vanderbilt University.


    The Pancake Pantry in Hillsboro Village, a breakfast place of high local repute. I was initially skeptical but the food was actually pretty darn good. This place is huge and there was still a line out the door at 10am on a Friday morning. Pretty crazy.


    The storefronts are a nice urban touch, but if you look behind this building you see a gigantic parking lot. This is perhaps an example of faux-urbanism. Putting the parking lot in the back doesn’t make it any less a strip mall. It is a difference in form, not function.


    One of the many vacant lots with a “condos coming soon” sign.


    The main road heading west of out downtown, West End Avenue, is developed at very high densities. I haven’t seen much in the way of this in most Midwestern cities. Midrises line both sides of the road basically from downtown to the interstate loop. It’s a six lane mega-street that moves tons of cars, but appears to have great bus service as well.


    Here is another one under construction.


    A proposed, but I believe not yet funded, high rise development. Indianapolis readers will no doubt recognize one of the towers as a clone of the proposed Intercontinental hotel for Pan Am Plaza that lost out as the convention center anchor hotel.


    If you continue out to the west from here, you run into neighborhoods like Green Hills, which is where the most premier shopping in the area is found, and the suburb of Belle Meade, which serves as Nashville’s mansion district. Unlike traditional Midwestern mansion districts, this one is more rural in nature, with large estates that wouldn’t be out of place in a plantation. I did not take pictures of these areas, however.

    Back closer to downtown is a nearby area known as the “Gulch”. It is not too far from Nashville’s Union Station.


    This appears to be some seedy industrial district that is being transformed all at once by a series of large developments. It also has several clubs and restaurants. I ate at a seafood place called Watermark that was surprisingly good. I believe most of the places are upscale chains, though I’m not sure if Watermark is or not. Here’s a picture of some of the development.


    More development


    North of downtown is a small historic district called Germantown. This was rather unimpressive if you ask me. I didn’t see much that was German about it. It sure isn’t Columbus’ German Village, that’s for sure. There were some restaurants there. I had lunch at one of them which, fortunately for them, I can’t remember the name of because it was terrible. This area is mostly older single family homes.


    The amazing thing about this area is that almost every vacant or industrial parcel was being redeveloped as condos. This really brought home to me the difference between Nashville and the Midwest. Were this, say, the Cottage Home area in Indianapolis, the local neighborhood association would use their historic district status to keep developments like these out. In Nashville, they are seen as a positive. Here are some examples.


    More condos


    More condos with retail space. Sorry for the very blurry pic but it was raining as you can see.


    More condos being built, and still more proposed.


    You get the picture. Also, note from all these photos the lack of design disasters. These are all workmanlike structures. The challenge for Nashville is that while there is a ton of new development, all of it is in a relatively generic, undistinguished style that could be in the downtown of almost any city. I did not get a strong sense of any type of vernacular style emerging. That is something I’d be looking for if I were them.

    Lastly, here’s one suburban example that shows something I pointed out last time. Namely that even in brand new, upscale subdivisions they aren’t putting in sidewalks on both sides of the street. I find this very odd. While I noticed some bike lanes this time around, Nashville’s definitely got a long ways to go when it comes to pedestrian and bicycle friendliness.


    Nashville is definitely a city that is on an upward trajectory. The volume of urban development and the business attraction success are impressive. It is exceeding even the best performing Midwest metros in that regard. However, it still lags the top southern and western metros. The current rate is very healthy, but probably isn’t sufficient to realize the civic ambitions. It remains to be seen whether Nashville can put it in another gear and take its place among the boomtowns, or whether it will merely stay on its current growth path. Either path is possible or a valid civic choice. While always possible, the likelihood that Nashville is going to take a major downtown does not appear high in the short term.


    Aaron M. Renn is an independent writer on urban affairs based in the Midwest. His writings appear at The Urbanophile, where this piece originally appeared.

  • The Evolving Urban Form: The Valley of Mexico

    The last 60 years of urban growth in the Mexico City area should dispel any belief that suburban dispersion is principally an American phenomenon or even limited to the high income world. Over the last 60 years, all of the population growth in what is now called the Valley of Mexico metropolitan area and urban area has occurred outside the urban core (See Map). In this regard, the declining population in Mexico City urban core mirrors that of other urban cores, such as the city of Chicago, the city of Copenhagen, the city of Paris and nearly all other urban cores in the high income world.


    Map: Valley of Mexico Urban Area: Northernmost Urbanization Excluded

    A New Name: the Mexico City metropolitan area is one of only two out of the world’s more than 25 megacities (10 million or more population) that has adopted a name more reflective of geographical reality, shedding reference to the urban core, which is declining in influence virtually everywhere. The other name-changing metropolitan area is Jakarta where the name Jabotabek is an acronym composed of the beginning of four large municipality names.  Mexico’s national statistics bureau, the Instituto Nacional de Estadística y Geografía (INEGI) has designated the Mexico City metropolitan area as the "Zona Metropolitana del Valle de México," which translates to the Valley of Mexico metropolitan area.

    According to the broadest definition, the Valley of Mexico metropolitan area had a population of 21.4 million according to the 2010 census. The Valley of Mexico joins a lengthening list of metropolitan areas with more than 20 million people. No reliable world ranking of metropolitan areas is feasible, because of varying definitions by nations and other population estimating sources (Note: Metropolitan Ranking). It can be said with assurance that the world’s largest metropolitan area is Tokyo – Yokohama, with approximately 40 million people and perhaps even that Jabotabek ranks second at nearly 30 million people. Other metropolitan areas making legitimate claims to having more than 20 million people include Seoul, Sao Paulo, Mumbai, Delhi, Manila and New York (Note: New York).

    The Valley of Mexico Urban Area

    In the early 1980s, the Valley of Mexico was expected to become the world’s largest urban area. A number of factors worked to keep that from happening, such as a falling birthrate and the devastating earthquake of 1985, which slowed growth and the simple problems created by the unmanageable scale of the region. This led to greater decentralization both to peripheral parts of the Valley of Mexico as well to other Mexican states.   

    In 2010, the Valley of Mexico urban area had a population of 19.4 million people. The urban area is estimated to cover 780 square miles (2,020 square kilometers), for a population density of 25,000 per square mile (9,700 per square kilometer). This makes the Valley of Mexico urban area approximately one-fourth the density of Dhaka (Bangladesh), the densest urban area in the world and similar in density to the Cairo urban area. The Valley of Mexico is less than three times as dense as the Paris urban area and less than four times the density of North America’s most dense urban areas, Los Angeles and Toronto. The next edition of Demographia World Urban Areas: Population & Projections (current edition) will show the Valley of Mexico to be the world’s ninth largest urban area.  

    The key issue here is a population growth rate that has plummeted since 1950. In the 1950s and the 1960s, the Valley’s population growth exceeded 5.5% annually. The rate fell to 4.0% during the 1970s, and dropped to 1.6% in the 1980s and 1990s. By the 2000s, the annual population growth rate had fallen to 0.8% (Figure 1).

    Urban Core: Former Mexico City:  In 1950, the core “delegations” constituted Mexico City – Cuahtemoc, Miguel Higalgo, Venustiano Carranza and Benito Juarez had 2.23 million people out of the urban area’s 2.88 million. Mexico City covered a land area of 54 square miles (139 square kilometers). In 1970 the population rose to a peak of 2.85 million with a peak population density of 53,000 persons per square mile (20,500 per square kilometer). At this point a severe population decline began, with a drop of more than 1.1 million people to 1.68 million by 2005. This represented a 41 percent drop in population density, two 31,000 persons per square mile (12,000 persons per square kilometer). A modest increase to 1.73 million people occurred between 2005 and 2000 in the urban core.

    In 1950, the urban core accounted for 78 percent of the urban area population. By 2010 this figure had fallen to under nine percent (Figure 2).


    The Suburbs: As of the 2010 census, more than 90 percent of the urban area population lives in what has historically been the suburbs.  Since 1950, the urban core has lost 500,000 residents; while suburban areas have added more than 17 million. Thus, the suburbs have accounted for more than 100 percent of the growth in the urban area over the past 60 years (Figure 1). During the 1950s, the suburbs accounted for more than 80 percent of the growth and in each decade since that time the suburbs have been 95 percent or more of the growth.

    In the earlier decades, the suburbs inside the Distrito Federal (but still outside the urban core) accounted for most of the growth, 93 percent during the 1950s and 53 percent during the 1960s. However from the 1970s to the present the growth has shifted to the more distant suburbs outside the Distrito Federal. These suburbs have captured at least 70 percent of the growth, including between 80 percent to 90 percent over the past two decades.

    Valley of Mexico Metropolitan Area

    The trend of continuing dispersion is evident in the metropolitan area trends. As defined in 2005, the Valley of Mexico metropolitan area included the 16 "delegations" (boroughs) of Mexico City (the Distrito Federal), and 60 municipalities (municipios), 59 of which are in the adjacent state of Mexico and the last of which is in the more northerly state of Hidalgo. In the late 2000s, another 28 municipalities in the state of Hidalgo were proposed for addition to the metropolitan area (and are included in this analysis).

    The metropolitan area is divided into five parts, the urban core (pre-1994 Mexico City), the urban balance of the Distrito Federal, inner ring municipalities, which are adjacent to the Distrito Federal, the outer municipalities before the proposed expansion and the 28 municipalities in the state of Hidalgo.

    Between 2000 and 2010, the urban core of the former Mexico City added 38,000 people or two percent to its population but accounted for only two percent of total metropolitan area population growth. Thus, during the 2000s, suburbs (areas in the urban area outside the urban core) gained 98 percent of the population growth (Figure 3).

    The vast majority of the growth took place either in the outer delegations – some 12 percent of growth –while the inner suburbs of the state of Mexico captured 9 percent of the growth. The "lion’s share" of the growth was in the outer suburbs of the states of Mexico and Hidalgo, at more than 75 percent.

    Clearly, the Valley of Mexico metropolitan area is prime example of the suburbanization and reduced urban densities that have occurred virtually around the world.

    Valley del Mexico Population: 2000 to 2010
    Geographical Sector 2000 2010 Increase Rate Share
    Urban Core (Former Mexico City) 1.692 1.730 0.038 2% 2%
    Balance of Distrito Federal 6.913 7.143 0.230 3% 13%
    Distrito Federal 8.605 8.873 0.268 3% 15%
    Inner Muncipalities 6.061 6.232 0.171 3% 10%
    Outer Municipalities 3.730 5.032 1.302 35% 75%
    Hidalgo Expansion 0.993 1.240 0.248 25% 14%
    Total 19.390 21.378 1.740 9% 100%
    In millions

    ——

    Note: New York: according to US Census Bureau estimates from 2009, the New York metropolitan area had slightly less than 20 million people. However the Combined Statistical area (which includes the Connecticut suburbs) had a population of 22 million people. Because metropolitan areas are labor market areas, the extent of their transport systems is an important factor in delineation. In the case of New York, the extent of the highway and transit systems is sufficient to suggest the combined statistical area as more appropriate for international comparisons.

    Note: Metropolitan Area Ranking: There is only one known research effort to consistently define and rank the world’s metropolitan areas. Richard L. Forstall (who ran the Rand McNally "Ranally" international metropolitan area program), Richard P. Green and James B. Pick, produced that list, which was limited to the top 15 in the world. This small number, in relation to more than 750 metropolitan areas in the world with more than 500,000 people illustrates both the difficulty of obtaining sufficient data and the complexity of the research.

    Note: Pachuca de Sota: the entire urban area is within the Valley of Mexico metropolitan area.

    Photo:  Cathedral, Mexico City (by author)

    Wendell Cox is a Visiting Professor, Conservatoire National des Arts et Metiers, Paris and the author of “War on the Dream: How Anti-Sprawl Policy Threatens the Quality of Life

  • Can Common Sense, and maybe Mickey, Save Orlando’s Transit Mess?

    The week’s debate about high-speed rail has once again polarized our populace, inflamed irrationality, and sent everyone back to their familiar corners.  Little constructive debate is possible when major newspapers are flailing the governor for rejecting money and the seemingly global revolutionary fervor is gripping local citizens who rallied in protest Wednesday night around downtown Orlando’s Lake Eola.  None of this will do any good for the service workers trying to get to their jobs in the theme parks or for downtown cube dwellers streaming to scattered office parks. With or without light rail the city inches closer and closer to the traffic hell of Atlanta, or worse even, DC. After all, both cities already have large rail transit systems.

    What will do some good is a creative discussion of some real change that can occur to improve our commute.

    We must recognize that we are stuck with our cars.  They aren’t going away.  We can’t wish them away. We have to make them better fast, because with changes blowin’ in the wind and with oil jumping back up over $100 a barrel.

    The high-speed bullet train – a sort of latter-day interstate highway program – sounded like a great idea at first, a welcome alternative to the ardor of air travel and the gas-sucking monotony of driving.  It has shortcomings, however, it will likely prove obscenely expensive, and once one gets to the destination, one is typically relegated to more driving.

    Nor is this some form of effective industrial policy.  The things will be built overseas – Germany, Japan or most likely China –  a great jobs program for someone else.  And tourists, who vastly prefer the freedom of car rental and driving, aren’t likely to use it except as a novelty for one of their visits to our wonderful place.  Perhaps the bitterest part of the bullet train pill: it will indebt our children and grandchildren to pay off landowners giving up their land in eminent domain – which produces nothing – and the cost of complex machines made overseas. The bullet train ends up being a clumsy solution imposed from above, rather than a grassroots solution to our real problems. 

    Any frequent driver on Interstate 4 between Orlando and Tampa can tell you there are four basic kinds of traffic: tourists in buses or cars; freight, in the form of tractor-trailers: business travelers (who need the flexibility of a car on the other end): and personal travelers.  Instead of targeting an expensive solution at just the smallest form of traffic, personal travel, a 4-part solution is suggested, all of which would add up to far less than $2 billion that minimally the high-speed line would have cost.

    1.  Trains can be good – for freight.  There are already freight lines running between Tampa and Orlando.  Getting the freight off of tractor-trailers and onto these freight lines, where it is vastly cheaper to move goods, should be a no-brainer for the state.  Use some of the DOT money to modernize freight depots along the pathway, incentivize freight customers to move their goods onto trains, and this will vastly improve the situation.
    2. Tourists can drive – at a price.  Our state should be treat itself with higher regard and also encourage a culture of sustainability for those visiting us.  Higher taxes on rental cars should be charged, and the taxes placed in an environmental fund to remove some of the unsightly development that has defaced our region, and return it to the special place it once was.
    3. Give business travelers an alternative.  If there were an affordable air shuttle between Tampa and Orlando, at the right price it would be full.  Little Embraers (made in Melbourne, by the way) taking off from FBOs at Orlando Executive Airport, Sanford Airport, and Orlando International Airport and landing in Tampa airfields would be worth $100 a seat, if the time/cost tradeoff were analyzed.  Ybor City for lunch, anyone?
    4. Give personal drivers an alternative.  For the cost of less than 50 miles of new road, a totally independent alternative to I-4 is waiting out there.  The first link of this road would connect Tampa’s Crosstown Express to Lakeland’s Western Beltway.  The next link of this road would connect the Western Beltway to the Greenway at Celebration.   Drivers will be able to go from downtown Tampa to downtown Orlando without their wheels touching I-4 even once.  Nice.

    And now, for the big one.  Right smack in the middle of the white-hot I-4 corridor lays a large, private entity, Disney, has been operating a private, train-based mass transit system for the last 40 years.  High labor costs?  Yes.  Fossil fuel driven?  Yes.  This entity has been strangely silent over the entire debate.

    If this entity were to wake up and seize the opportunity before it, one might see a true train that works.  First of all, the monorail was planned with some sense: it connects dense areas together.   If Disney were to offer to build, as a private development, extensions of its monorail reaching out to Tampa on one side and Orlando on the other, the air rights for this system could be along government-owned I-4 (no imminent domain costs).  This entity is also highly encouraged to charge market rate and to make a profitable venture out of operating this system. And the taxpayers would not be stuck with the bill.

    A vision for transit between Tampa and Orlando needs to be truly holistic, taking into account all types of traffic connecting the two regions.  This vision also needs to be locally driven, taking advantage of local strengths and assets already in place.  The high speed bullet train does none of this.  Instead, a multi-faceted solution that provides flexibility at both ends, leverages our current strengths, and partners with the strongest player in the region has a chance of truly making a difference in the present tense and likely future budget climate  This is what sustainability is truly about, and is what our future generations deserve.

    Richard Reep is an Architect and artist living in Winter Park, Florida. His practice has centered around hospitality-driven mixed use, and has contributed in various capacities to urban mixed-use projects, both nationally and internationally, for the last 25 years.

    Photo by Joe Penniston

  • The State of Silicon Valley

    Every year, the top officials, policy wonks, and business managers convene at the annual State of the Valley conference to discuss and debate the health of the region. Over a thousand attendees trekked to San Jose, Calif., on Feb. 18 for the release of this year’s report. Published since 1995 by Joint Venture Silicon Valley Network and distributed for free, the new 2011 Index of Silicon Valley reported bleak indicators and a gloomy outlook.

    The event provided Valley insiders a moment to reflect on the economic storm, and the mood was darkly optimistic. A persistent phrase tossed out was the “new normal,” old Wall Street jargon describing a repressed economic environment. Growth is too slow to bring down the unemployment rate, and government intervenes to save a struggling private sector.

    Tally of the Valley

    Certainly Silicon Valley has had its share of troubles suffering from poor state finances and severe global competition. Unemployment has hit nearly 10 percent, higher than when the recession started. The region’s population of three million, comprised of Santa Clara and San Mateo Counties, has continued to drop as talent leaves for opportunity in cheaper pastures. Foreign immigration, considered a critical factor in the region’s entrepreneurship, dropped by 40 percent to its lowest level in the last decade since 2009 and stayed flat through 2010.

    Adding to the woe, Silicon Valley towns are facing budget shortfalls and downsizing their public services. San Jose faces a 10th straight year of red ink, adding up to a gap of $110 million in the next fiscal year. Caltrain plans to close up to 16 stations to survive a record $30.3 million deficit – about one-third of the commuter rail’s operating budget.

    Education has also taken a big hit. The California college system is wheezing from tremendous budget cuts, calculated at $1.4 billion across the state, which hit all three levels of tertiary education. Foothill-De Anza Community College, one of the largest community college districts in the U.S., confronts roughly $10.9 million in cuts on top of drastic budget slashes from previous years.

    Further, the local housing market remains stagnant, and 2010 marked, due in part to a tough regulatory environment, the third consecutive year that Silicon Valley was the least affordable California region for first-time home buyers.

    In the Eye of the Beholder

    It’s a dismal state of affairs if you ask the local old guard. Judy Estrin, former chief technology officer of Cisco Systems, grumbled that one problem was outsourcing. Too many startups were adopting the practice in her view, and she told the audience, “Don’t automatically go to China.”

    Others were concerned that jobs were being shipped simply to towns east across the bay. Much ballyhooed and well-subsidized sectors, such as cleantech, would not produce enough jobs to be economically meaningful in the recovery. Attendees were fearful that the Valley has lost its edge.

    If those who know Silicon Valley best are somewhat pessimistic, the Valley looks golden for many looking from the outside. The day before the conference, President Obama sought money and advice from the Valley’s tech elite, including Steve Jobs of Apple and Mark Zuckerberg of Facebook. Obama’s agenda was to push innovation, and aside from escaping the U.S. capital now and then, it is tellingly that he turned first to Silicon Valley.

    The Valley has also inspired other city governments. New York City – which once boasted its own “Silicon Alley” was winning over the Valley’s decidedly suburban model – recently asked Stanford University to help train its urban talent. As one local reporter put it gleefully, New York is “hoping to replicate our Apple in The Big Apple”.

    Although financial analysts once considered Apple washed up as a stock less than 10 years ago, the technology company is now lauded for transforming the mobile and entertainment industry and turning Silicon Valley into a mobile mecca. Goaded by Apple, mobile manufacturing giant Sony Ericsson is shifting all its product development from Sweden to Silicon Valley. Nokia, the world’s largest mobile phone maker, is also reportedly considering plans to relocate its executives to the Valley.

    Growing Regional Value, Not Growth

    The prevailing question remains: how will Silicon Valley sustain its lead in innovation. For some the response is to either raise taxes or cut public services as a matter of survival. At the State of the Valley conference, the overriding call to action was to unite 110 local governments through centralized regional leadership. However, the notion of a regional governing body had been introduced before in the 1990s and failed instantly in California state legislation.

    So what might the future hold? Last year’s report card aside, financial analysts are cheery about the Valley’s prospects. Silicon Valley Bank’s Financial Group reports that technology spending is expected to grow by more than five percent in 2011. The majority of their clients finished 2010 in better financial shape than the prior year, and median revenues for all early and growth stage technology clients grew 50 percent from the year before.

    The IPO market has woken from its slumber. Seven tech IPOs have already occurred this year, raising $700 million in total, with an average return of 26.5%, according to research firm Renaissance Capital. Even the international press is writing about the next boom being led by Silicon Valley.

    For all the money being generated, Silicon Valley is not producing more jobs in the local economy. Many startups look to Facebook as a leader in the social media space. Its user base of 600 million has generated a massive population that dwarfs that of the U.S. Yet the company has only about 2000 employees. Facebook presents a conundrum. Is it an innovative global leader that has mastered the art of efficient scaling that is the beginning of a new era in Silicon Valley, or has Facebook become the antithesis of economic growth for the U.S. administration?

    Similar to Facebook, Apple is also spurning growth – at least as defined by the conventional measure of new jobs. The company has redefined the tech industry by creating new technologies and new solutions, but not necessarily creating new growth for the region directly. While Apple employs just 30,000 people, the subcontractor that actually assembles its products employs over a million workers, all in China. Developers for Apple’s software applications and hardware accessories are scattered around the world. Instead, Apple has fostered an ecosystem whose heart resides in Silicon Valley.

    Silicon Valley is changing perceptions and practices once again. Like the proverbial cat with nine lives, Silicon Valley has at least several more transformations ahead.

    Tamara Carleton, Ph.D., is a Fellow at the Foundation for Enterprise Development. Her research studies the organizational processes and structures that enable radical technological innovation.