Category: Urban Issues

  • What The Census Tells Us About America’s Future

    With the release of results for over 20 states, the 2010 Census has provided some strong indicators as to the real evolution of the country’s demography. In short, they reveal that Americans are continuing to disperse, becoming more ethnically diverse and leaning toward to what might be called “opportunity” regions.

    Below is a summary of the most significant findings to date, followed by an assessment of what this all might mean for the coming decade.

    Point One: America is becoming more suburban.

    For much of the past decade, there has been a constant media drumbeat about the “return to the cities.” Urban real estate interests, environmentalists and planners have widely promoted this idea, and it has been central to the ideology of the Obama administration, the most big-city dominated in at least a half century. “We’ve reached the limits of suburban development,” Housing Secretary Shaun Donovan opined last February, “People are beginning to vote with their feet and come back to the central cities.”

    Donavan and others cite such things as the energy price spike in the mid-aughts as well as the mortgage crisis as contributing to the “back to the city” trend. Yet in reality the actual numbers suggest that Donavan and his cronies may need a serious reality check. The Census reveals that, contrary to the “back to the city” rhetoric, suburban growth continues to dominate in most regions of the country, constituting between 80% and 100% of all growth in all but three of the 16 metropolitan areas reporting.

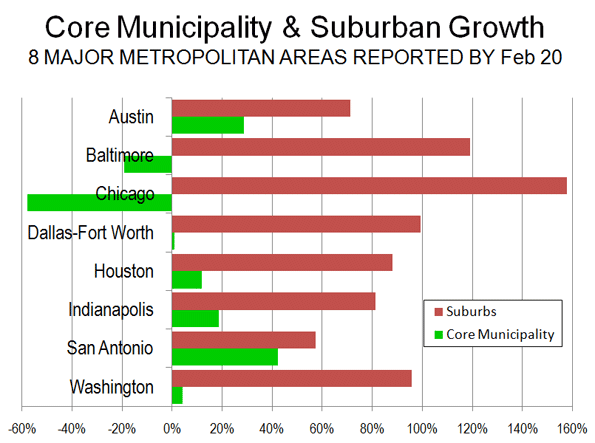
    This includes sprawling regions like Houston, “smart growth areas like Seattle and Portland  (where suburbs accounted for more than 80% of all growth over the decade) and Midwestern regions like St. Louis, which like Chicago saw a sharp decline in the urban population. The only exceptions have been Oklahoma City, Austin or San Antonio, with vast expanses still allowing for much of new development to take place within the city limits.

    To be sure, no one should pretend that urban fortunes have sunk to their 1970s nadir. Yet overall, central cities, which accounted for a 11% of metropolitan growth in the 1990s, constituted barely 4% of the growth in the last decade.  Some core cities, notably Chicago, have shrunk after making gains in the ’90s. Indeed Chicago — the president’s adopted hometown and the poster child of the urban “comeback” — took what analyst Aaron Renn humorously dubbed “a Census shellacking,” losing some 200,000 people, while the outer suburban ring continued to grow and diversify their populations. The Windy City’s population is now down to the lowest level since the 1910 Census.

    Point Two: America is becoming more diverse, and the diversity is spreading.

    The racial reordering of America is proceeding apace. Nowhere is this more clear than in Texas, where Hispanic and Asian populations have driven much of the state’s demographic growth. Latinos alone now account for roughly 38% of all Texans. Immigration rates in Dallas and Houston  are now higher than for Chicago, Washington, Seattle and Atlanta. Texas, notes long-time observer Candace Evans, is becoming the country’s premier laboratory for promoting a successful diversity.

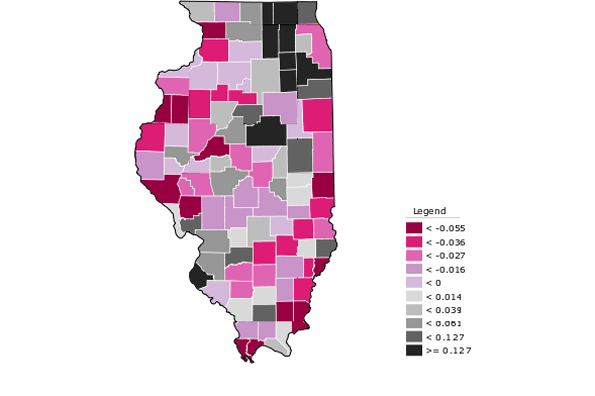
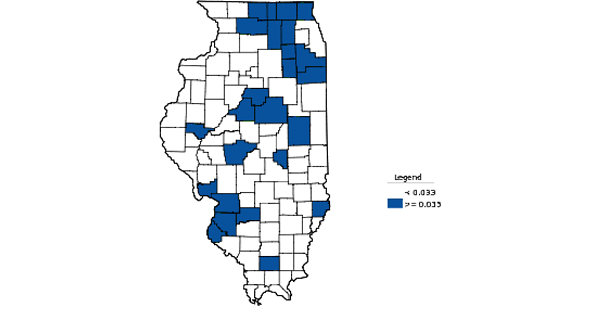
    There are other major shifts in ethnic demographics. For one thing, minorities continue to head to the suburban rings around most major cities. African-Americans and even Latinos may be fleeing places like Chicago, but they continue to move in large numbers to suburban locales in surrounding Illinois counties. , especially south of the city.  Others appear to  have headed to places like the traditional black-opportunity magnet of Atlanta and or other southern hubs, such as Nashville.

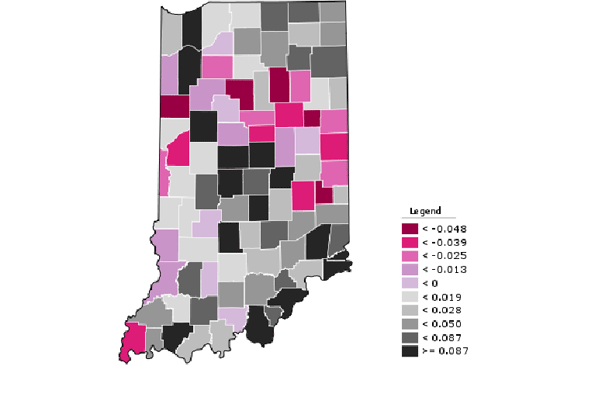
    Another trend appears to be the migration of ethnic minorities to areas that, in the past, have been primarily white. This is clear in the thriving Indianapolis area, where the African-American population grew by 28% and the Hispanic population by 161%, or some 56,000 souls.   Look for more minority growth in such areas which have the advantage of affordable housing, robust economies and better than average job growth.

    3. The Shift to “Opportunity Regions”

    As the economy slid in the last years of the decade, population growth slowed, particularly in some Sun Belt states, such as Florida and Nevada, that thrived during the bubble. In contrast newcomers flocked to places, notably in the Texas cities, that offered better prospects. Austin, San Antonio, Houston and Dallas-Ft. Worth regions all grew by 20% or more over the decade.

    The key here seems to be affordability and jobs. As economist Mark Sharpe has illustrated, Texas private sector job growth last year was 2.7%, compared with 1% nationally. Unfortunately, unemployment remains over 8%, since of this growth was absorbed by newcomers. In contrast, places with the slowest, or negative growth, tend also to be losing jobs. For example, although the residential population of Chicago’s loop tripled in the past decade to 20,000,the famed business district lost almost 65,000 jobs.

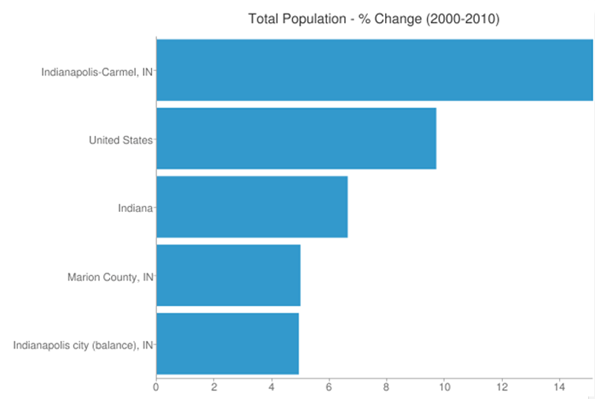
    But it’s not just Sun Belt cities that are gaining on places like Chicago.  Indianapolis has emerged as a different kind of “opportunity region.” It lacks the dynamism and diversity of the Texas cities, but it has continued to attract people from all over the country, including the surrounding rural or old Rust Belt parts of the state. Overall the Indianapolis region grew nearly 15% over the decade, roughly 50% higher than the national average, as much as Portland and more than Seattle.

    In contrast, growth seems to be slowing in some formerly hot areas. Population increases for Seattle, Portland and Denver were around 14%,  about half the rate of the previous decade. Part of this may have to do with high unemployment, particularly in Oregon, and high housing prices. Still, these three areas continue to grow much faster than regions such as Chicago, St. Louis or Baltimore where growth struggled in the single digits

    Possible Long-term Implications

    These shifts suggest that the Obama administration might want to rethink its high-density and urban-oriented strategy. Despite all the media focus on an imagined “back to the city” movement, Americans continue to disperse to “opportunity regions” and toward the suburbs. As a result, expect generally conservative-leaning suburbs and exurbs to gain more power after reapportionment and core city influence to decline further.

    Yet the Census numbers also have some unsettling aspects for Republicans. The increasing minority population even in heartland states such as Indiana, not to mention Texas, could undermine GOP gains, particularly if the party listens to its strong nativist wing. Diversification in the suburbs could ultimately turn some of these areas to the center or even left.

    The new American generation arising in the census will be increasingly diverse. A growing portion will consist of the children of immigrants, and they will be predominately English-speaking.  This suggests a more active and engaged minority population, perhaps susceptible to a pro-growth GOP message and the economy of “opportunity regions” but likely hostile to overtly anti-immigrants posturing.

    Whatever your politics or economic interests, the Census suggests that the country is changing in dramatic way– if not always in the ways often predicted by pundits, planners or the media. It usually makes more sense  to study  the actual numbers, than follow the wishful thinking of largely urban-centric, big-city-based and often quite biased analysts.

    This piece originally appeared at Forbes.com

    Joel Kotkin is executive editor of NewGeography.com and is a distinguished presidential fellow in urban futures at Chapman University, and an adjunct fellow of the Legatum Institute in London. He is author of The City: A Global History. His newest book is The Next Hundred Million: America in 2050, released in February, 2010.

    Indianapolis Photo by IndySawmill

  • Census 2010: A Texas Perspective

    If you want to get a glimpse of the future of the U.S., check out Fort Worth, TX. Never mind the cowboy boots, but you might want to practice your Spanish.

    Texas is growing explosively and much of that growth is among Latinos.   The latest Census Bureau figures show the Lone Star State grew by 20%, to over 25 million people, recording about a quarter of the nation’s overall growth. The rate of growth was twice the national average. The implications are huge politically, as Texas stands to gain 4 new Congressional seats from this expansion, and Hispanic leaders want in.

    A majority of the Hispanic growth came from births to families already living here. While migration from other states and countries contributed about 45%.  

    The Texas story stands in contrast to the Rust Belt states and the Northeast, where overall growth is minimal.   Texas’s Hispanic-fueled growth spurt out-paced the entire countries, helped brace our housing market and our economy.

    A close look at Texas growth reveals much about   American’s home-buying habits. Rural areas got smaller – few want to live in the boonies of far west Texas while it appears suburban areas won over the most transplants.

    But arguably the biggest winner was Ft. Worth, or Cow Town as we call it. Fort Worth grew by a whopping 38.6%, the largest increase in the state, followed by Laredo’s 33%, Austin at 20.4%, and San Antonio at 16%. In contrast the city of Dallas, my home, grew by a scant .8% – a bit deflating to a city all puffed up about a $354 million arts center, a downtown park and greenway, and the $185 million Perot Museum of Nature & Science underway.

    Houston remains the state’s largest metropolitan area but sustained growth of only 7.5%, though Harris County – mostly due to growth in the suburbs – grew by 20%. As in Ft. Worth and elsewhere, Hispanics have been the driver, and now comprise 41% of the Harris County population. The biggest growth took place in formerly rural towns just outside the big cities, one-shop stop farmer’s crossings or granaries.  

    Curtis Tally shakes his head at how fast little Justin, north of Fort Worth, has grown. Subdivisions sprouted up on what was once farmland around his Justin Feed Co. in southern Denton County. From 1891 residents in 2000, Justin has 3,246 today.  

    "We were selling seed for pastures; now we’re selling seeds for lawns," Tally, 74, who has been in business in Justin since 1958, told the Fort Worth Star Telegram.

    If you think that’s amazing, wait ‘till you get to Fate, Texas, 25 minutes east of Dallas on Interstate 30. Ten years ago you would have missed Fate, a town of 500 so small the utility invoicing was done on postcards if you blinked while driving. Today, Fate is the fastest-growing town in the state, with 6,357 residents – an increase of 1,179%!  Residents who live there say it’s far enough away from Dallas to be in the country, but still close to the big city. Fate draws many first time homebuyers who are starting families (home prices range from $50,000 to $300,000) Here’s what Fate resident Tina Nelson told The Dallas Morning News:

    “My kids can go ride bikes all day long and I don’t have to worry too much about where they are,” said Tina. “It’s like the 1950s (here) the sun goes down and everyone’s porch light comes on.”

    On the western side of Lake Ray Hubbard, a few minutes from Fate and slightly closer to Dallas is Sunnyvale, another fast-growing little hick town where professionals are building $2 million dollar homes on a 124 acre family ranch turned into home sites called St James Park. They send their children to a two-year old, $50 million public school with the highest ratings in the state.

    The young man building homes on the 49 two acre estate sites is Jojy Koshy of Atrium Fine Homes. At 31, Jojy holds a masters in business from the University of Texas and tells me, with pride, how his parents immigrated to the Dallas suburb of Plano in 1986 from India.

    “My parents instilled a strong work ethic in us,” he says. “I know this market is challenging, but I believe that if I work longer, harder, and keep our clients completely satisfied, we will have a great business.”  

    It’s the same story across the state. The Interstate 35 corridor between Austin and San Antonio filled in with development as the cities merged closer to becoming one big schizophrenic metropolis. The string of counties along the Rio Grande, anchored by Brownsville and McAllen have been growing, and may be beneficiaries of the crime wave south of the border.   A sharp Dallas Realtor took out an ad in the Monterrey newspaper advertising homes for sale in Dallas and snagged several buyers. Even the wife of the Monterrey mayor moved to a Dallas suburb, escaping the cartel and seeking to be closer to her family here.

    Aside from escaping death in Mexico, what is driving people to Texas? Start with our rising star, Fort Worth. The city has both a cowboy pizzazz personality and a lower crime rate than Dallas. Fort Worth’s arts district has overshadowed Dallas’s for years, and the neighborhoods offer true community – places where the kids can still walk, not be bussed, to school. Rose Bowl winner Texas Christian University is on the upswing, downtown is charmingly vibrant, and an urban renaissance is taking hold on the city’s western edge called West 7th.   

    What are people seeking in Texas? I’d call it quality of life with room for upward mobility: affordable homes with mortgage payments that leave some money for recreation, good public schools for their kids and generally less onerous tax regime.

    Yet with our many gains, Texas faces great challenges. The state has the third-highest teenage pregnancy rate in the nation, which is actually an improvement from last year, when we were number two. There are a rising number of children are living in poverty in Texas. Many of these children may be anchor babies born to illegal immigrants who cross the border to ensure their children and ultimately, themselves, citizenship. In 2006, 70% of the women who gave birth at Dallas County’s Parkland Memorial Hospital were illegal immigrants.  

    Increasingly, Latinos, illegal or not, take those babies home to the suburbs. Texas suburbs are no longer lily-white.  This is true in working class places like Bedford, Texas, outside Fort Worth, where the black population has almost doubled. In affluent Southlake, the population this decade shifted from 95 percent Anglo down to 88 percent.   Looking for a great selection of Asian food? You’ll starve (or go broke) in downtown Dallas. Go north to Carrollton, Texas where you’ll find a 78,000 square foot Super H Mart in what was once a Mervyns department store. Inside you’ll find seven types of gray, fuzzy, Chinese long, acorn, spaghetti, butternut, and kombucha squash eight food stalls said to rival any of those found in Seoul and Singapore, two cities known for their gourmet street food. Manduguk, anyone?

    The new Texans are coming here not just to live, but to dig in economically.  

    In the end, we are seeing the birth of a Texas that is neither the white bread, big hair idyll of the cultural conservatives or the free market dystopia imagined by liberals. It is becoming more diverse, without losing its capitalist energy. With all its blemishes,  the emerging Texas may well become the model for how America evolves in the coming decades.

    Candy Evans is an independent journalist based in Dallas, Texas, She covers Texas for AOL’s HousingWatch and blogs at secondshelters.com.

    Photo by Rick

  • Census 2010: Urbanizing Indiana

    The first Census results for Indiana were recently released, painting a picture of an increasingly metropolitan state.  Indianapolis continues to be the growth champion as its strong economy attracted people from the rest of the state, as well as increasingly diverse populations.  Although  the core of Indianapolis fell well below expectations, its population did not fall like that of Chicago. In a switch from some other regions, the outer suburbs also lagged expectations while inner suburbs boasted a robust performance.

    Population Change in Indiana

    The map below shows how Indiana’s counties faired between Census 2000 and 2010, with counties gaining population in black, and those losing population it in red.

    Many rural and small industrial counties either shrank or posted anemic population growth while most metro counties, especially suburban ones, were standouts.  This is particularly illustrated by this map highlighting only those counties that grew faster than the statewide average:


    This list features heavily counties in suburban Indianapolis, Cincinnati, Louisville, and Chicago, as well as areas near midsized cities like Fort Wayne and Evansville.  Big Ten college towns Bloomington and Lafayette also did well.

    Metro Indianapolis: Indiana’s Growth Champion

    But the clear population winner was metro Indianapolis, which grew at a rate 15.2%, nearly double the US average and well above that of the state:

    The growth even extended even to the central city/county, with Marion County breaking the 900,000 barrier.   The 231,137 people added by metro Indy was fully 57% of total statewide growth, even though that region only contained 25% of the state’s population in 2000.  Unsurprisingly, metro Indy added 15,000 jobs during the last decade  while the rest of the state shed nearly 200,000 of them.

    Indy Suburban Migration Missed Expectations, But No Core Renaissance Either

    Indianapolis showed some of the same urban core patterns as Chicago, which bodes ill for the back to the city story at the national level.  There is a city-county consolidation in effect which muddies the waters here, but the old township boundaries that are still reported by the Census Bureau as minor civil divisions can serve as a proxy for old boundaries.  Center Township covers most of what used to be the old City of Indianapolis, while the remaining townships constitute the Inner Suburbs and the collar counties the Outer Suburbs.

    Those of us who are urban boosters were excited that the Census Bureau estimates showed Center Township’s decades long population slide ending and even hitting an inflection point during the 2000s. Alas, these Census results demolished that notion as Center Township was shown to have lost 24,268 people, falling well short of estimated population in 2009.  Like Chicago, the inner city also featured a large black exodus.

    But the Outer Suburbs didn’t fare that well either, especially Hamilton County.  Long ranked among the fastest growing in the entire United States, I had been waiting to see if growth there might have been slightly above trend as in the past and put them over the 300,000 mark. It turns out to be a very different story, as Hamilton County’s 2010 population was 274,659, actually coming in below the 279,287 the Census Bureau had estimated in 2009. Still, the majority of regional growth was still in the Outer Suburbs, although less than estimated.

    This of course means that the Inner Suburbs did better than expected, particularly the southern ones of Perry and Franklin Townships, which still have some greenfield development opportunities left.  As in cities across the US, older Inner Suburbs of Indy have been experiencing their own problems as they aged. But this shows that the problems may not be as bad as feared.  Though the economy doubtlessly affected this, nevertheless it still buys additional time for transformations driven by demographic growth and entrepreneurship among immigrants and a burgeoning black middle class to take root.

    More Diversity, But Still Not That Diverse

    Indianapolis and Indiana grew more diverse during the 2000s particularly with Hispanic immigration. But again the changes were concentrated in metro areas.  And Indianapolis, long a very white city with a black minority, showed very strong growth in diversity, but still not enough to make this a truly diverse place in the manner of New York or Los Angeles.

    As in Chicago, the core lost black-only population, but other than that it was a very different story.  Metro Indy added 48,824 new blacks, a growth rate of 22.8% that outpaced overall growth.  This boosted black population share by nearly one percentage point.   Unlike Chicago, where local journalists are asking what happened to the city’s incredible shrinking black population, leading Indy black talk show host Amos Brown issued a press related titled “Blacks Fueled Indy’s Growth in 2010 Census Reports” to trumpet the black numbers there. One big reason might be: in contrast to Chicago, Indianapolis’ African-Americans did not have to flee south for jobs or affordable housing.

    The black core population decline in Indy seems less driven by gentrification than the prosaic concerns that generally drive suburbanization, such as safer streets,  better housing and schools.  This migration pattern is very evident in places like the Inner Suburban Lafayette Square area, which in addition to becoming a thriving immigrant business district is also home to large numbers of black owned businesses that are helping to transform this once decaying area.

    The state’s black population as a whole remains heavily concentrated in large urban areas, with Marion and Lake Counties accounting for 62% of the state’s total black population.

    Indy’s Hispanic growth surged as well, with 66,715 new Hispanics representing a 161% increase, though this is less than some expected. Hispanic population growth was more evenly spread, though from a total numbers perspective Indy and northern Indiana dominated the growth, as illustrated by the following chart of total Hispanic population growth in the last decade:

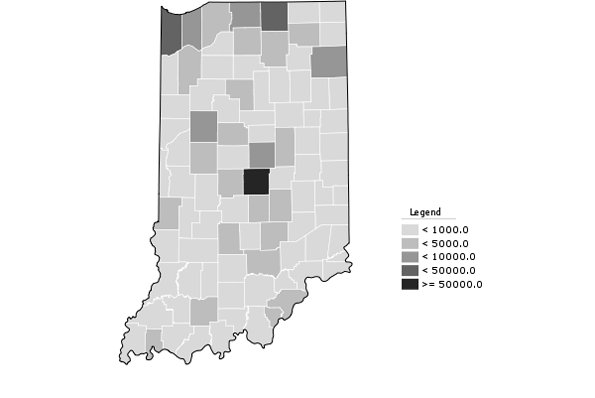
    Indy’s Asian population also more than doubled to almost 40,000..  Add this all up and the metro area non-Hispanic white-only population share dropped by six percentage points, but remains at 74.6%.  The city of Indianapolis itself is pushing 40% minority, however.  Regardless, this is still a material change and shows that metro Indy is a strong magnet not just for whites, but for pretty much everybody.  Its challenge is to continue building on this for the future, while the state’s challenge will be to  pull itself up to Indy’s level of demographic and economic performance.
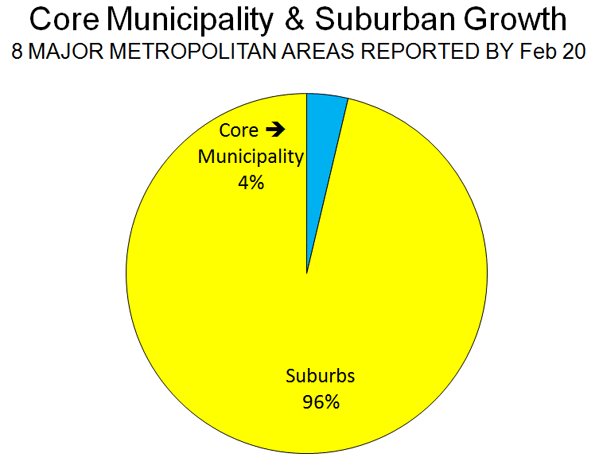
    Aaron M. Renn is an independent writer on urban affairs based in the Midwest. His writings appear at The Urbanophile.

    Photo by Carl Van Rooy

  • The Still Elusive “Return to the City”

    Metropolitan area results are beginning to trickle in from the 2010 census. They reveal that, at least for the major metropolitan areas so far, there is little evidence to support the often repeated claim by think tanks and the media that people are moving from suburbs to the historical core municipalities. This was effectively brought to light in a detailed analysis of Chicago metropolitan area results by New Geography’s Aaron Renn. This article analyzes data available for the eight metropolitan areas with more than 1 million population for which data had been released by February 20.

    Summary: Summarized, the results are as follows. A detailed analysis of the individual metropolitan areas follows (Table 1).

    • In each of the eight metropolitan areas, the preponderance of growth between 2000 and 2010 was in the suburbs, as has been the case for decades. This has occurred even though two events – the energy price spike in mid-decade and the mortgage meltdown – were widely held to have changed this trajectory. On average, 4 percent of the growth was in the historical core municipalities, and 96 percent of the growth was in the suburbs (Figure 1).
    • In each of the eight metropolitan areas, the suburbs grew at a rate substantially greater than that of the core municipality. The core municipalities had an average growth from 2000 to 2010 of 3.2 percent. Suburban growth was 21.7 percent, nearly 7 times as great.  Overall, the number of people added to the suburbs was 14 times that added to the core municipalities.
    Table 1:
    Metropolitan Area Population: 2000-2010
    2000 Population
    Historical Core Municipality Suburbs Metropolitan Area
    Austin              656,562            593,201         1,249,763
    Baltimore              651,154         1,901,840         2,552,994
    Chicago           2,895,671         6,053,068         8,948,739
    Dallas-Fort Worth           1,188,580         3,972,964         5,161,544
    Houston           1,953,631         2,761,776         4,715,407
    Indianapolis              860,454            664,650         1,525,104
    San Antonio           1,144,646            567,057         1,711,703
    Washington              572,059         4,181,934         4,753,993
    Total           9,922,757       20,696,490       30,619,247
    2010 Population
    Austin              790,390            925,899         1,716,289
    Baltimore              620,961         2,089,528         2,710,489
    Chicago           2,695,598         6,599,081         9,294,679
    Dallas-Fort Worth           1,197,816         5,173,957         6,371,773
    Houston           2,099,451         3,846,449         5,945,900
    Indianapolis              903,393            852,848         1,756,241
    San Antonio           1,327,407            815,101         2,142,508
    Washington              601,723         4,883,034         5,484,757
    Total         10,236,739       25,185,897       35,422,636
    Change: 2000-2010
    Austin              133,828            332,698           466,526
    Baltimore              (30,193)            187,688           157,495
    Chicago             (200,073)            546,013           345,940
    Dallas-Fort Worth                 9,236         1,200,993         1,210,229
    Houston              145,820         1,084,673         1,230,493
    Indianapolis               42,939            188,198           231,137
    San Antonio              182,761            248,044           430,805
    Washington               29,664            701,100           730,764
    Total              313,982         4,489,407         4,803,389
    Percentage Change: 2000-2010
    Austin 20.4% 56.1% 37.3%
    Baltimore -4.6% 9.9% 6.2%
    Chicago -6.9% 9.0% 3.9%
    Dallas-Fort Worth 0.8% 30.2% 23.4%
    Houston 7.5% 39.3% 26.1%
    Indianapolis 5.0% 28.3% 15.2%
    San Antonio 16.0% 43.7% 25.2%
    Washington 5.2% 16.8% 15.4%
    Total 3.2% 21.7% 15.7%
    Chicago excludes Kenosha County, WI
    Washington excludes Jefferson County, WV
    Indianapolis core municipality: Indianapolis & Marion County

    Analysis of Individual Metropolitan Areas: The major metropolitan areas for which data is available are described below in order of their population size (Figure 2 and Table 1).

    Chicago:The core municipality of Chicago lost 200,000 residents between 2000 and 2010. Suburban growth was 546,000, adding up to total metropolitan area growth of 346,000 people. The suburbs accounted for 158 percent of the metropolitan area growth. The core municipality decline was stunning in the face of the much ballyhooed urban renaissance in that great city. Yet this renaissance was limited enough as to not lead to an expanding population.

    The decline in the core municipality population represents a major departure from the 2009 Bureau of the Census estimates, which would have implied a 2010 population at least 170,000 higher (assumes the growth rate of 2008 two 2009).

    Instead all of the growth was in the outer suburbs, beyond the inner suburbs of Cook County.

    Dallas-Fort Worth: The historical core municipality of Dallas had a modest population increase of 9000, or less than 1 percent between 2000 and 2010. In contrast, the suburbs experienced an increase of 1.2 million, or 30 percent. Thus, approximately 1 percent of the metropolitan area growth was in the core municipality, while 99 percent was in the suburbs, most of it in the outer suburbs. The inner suburbs added 14 percent to their 2000 population, while the outer suburbs added 36 percent.

    The population figure for the core municipality of Dallas – consistently among the strong core areas –  was surprisingly low, at 9 percent below (117,000) the expected level. The suburban population was 1 percent (71,000) below expectations.

    Houston: The historical core municipality of Houston had comparatively strong population growth, adding 146,000 and 8 percent to its 2000 population. However this figure was 8 percent, or 174,000 below the expected figure. By contrast, the suburban growth was 39 percent, more than five times that of the central jurisdiction. The suburban population growth was 1,085,000, more than six times that of the core jurisdiction. The suburban population was 4 percent or 144,000 higher than expected.

    The core jurisdiction of Houston accounted for 12 percent of the metropolitan area growth while the suburbs s accounted for 88 percent. This was evenly distributed between the inner suburbs of Harris County and the outer suburbs. The inner suburbs added 38 percent to their population while the outer suburbs added 41 percent.

    Washington:Reversing a decade’s long trend, the historical core jurisdiction of Washington (DC) had a small population gain between 2000 and 2010. But the Washington, DC gain of 30,000 pales by comparison to the suburban gain, which was more than 20 times greater, at 700,000. The core jurisdiction accounted for 4 percent of the population gain, while the suburbs accounted for 96 percent.

    More than 60 percent of the growth in the metropolitan area was outside the inner suburban jurisdictions that border Washington, DC (Arlington County and Alexandria in Virginia, together with Montgomery County and Prince George’s County in Maryland), while the inner suburbs accounted for 36 percent of the growth. The population increase in the inner suburbs was 9 percent, compared to 37 percent in the outer suburbs.

    Jefferson County in West Virginia was not included in the analysis because data is not yet available.

    Baltimore: The historical core municipality of Baltimore, the site of another ballyhooed urban comeback, lost 30,000 people, or 5 percent of its 2000 population. Baltimore’s 2010 population was 4 percent or 16,000 below the expected level. The suburbs experienced a 10 percent or 188,000 person increase.  The region’s population increase was roughly equal in numbers between the inner suburbs and the outer suburbs, although the exurban percentage increase was nearly twice as large.

    San Antonio:The historical core municipality of San Antonio experienced the largest population increase among the eight metropolitan areas, at 183,000, a roughly 16 percent population jump. The city of San Antonio accounted 43 percent of the growth while suburbs in Bexar County and further out accounted for a larger 57 percent. However, the suburban population increase was 248,000 or 44 percent. This is something of a turnaround in trends that favored the city of San Antonio in the past because of its vast sprawl and predominant share of the metropolitan population.

    The city of San Antonio population was 5 percent or 65,000 people short of the expected 2010 level. The suburban population was 15 percent more or 104,000 more than the expected level.

    Indianapolis:The historical core area of Indianapolis and Marion County (including enclaves within Indianapolis) grew 5 percent and accounted for 19 percent of the metropolitan area growth. In contrast, the surrounding suburbs grew 28 percent, representing r 81 percent of the metropolitan area growth. Overall, the core municipality added 44,000 people, while the suburbs added more than four times as many, at 188,000.

    Austin:The historical core municipality of Austin experienced the greatest growth of any core jurisdiction in the eight metropolitan areas, at 20 percent. Even so, growth in the suburban areas was nearly 3 times as high at 56 percent. The city of Austin accounted for 29 percent of the metropolitan area population growth, while the suburbs accounted for 71 percent. Overall, the central municipality grew 134,000, while the suburbs grew 2.5 times as much, at 333,000.

    Generally it is fair to say that, so far, suburban areas are growing far faster than urban cores. In addition, most of the fastest growing core municipalities are those areas that are themselves largely suburban, particularly in relatively young cities like San Antonio, Houston and Austin.
     
    Among the eight metropolitan areas analyzed, the older core jurisdictions (with median house construction dates preceding 1960) tended to either lose population or grow modestly. This is illustrated by the city of Chicago, with a median house construction date of 1945, Baltimore with a median house construction date of 1946 and Washington with a median house construction date of 1949 (Table 2). Generally, the central jurisdictions with greater suburbanization (with median house construction dates of 1960 or later) grew more quickly. For example, highly suburban central jurisdictions like Austin with a median house construction date of 1983 and San Antonio, with a median house construction date of 1970, grew fastest. So much for the long forecast, and apparently still elusive, “return to the city”.

    Table 2:
    Historical Core Municipalities: Growth & Median House Age
    Historical Core Municipality
    Growth: 2000-2010 Share of Metropolitan Growth Median House Construction Year
    Austin 20.4% 28.7% 1983
    Baltimore -4.6% -19.2% 1946
    Chicago -6.9% -57.8% 1945
    Dallas-Fort Worth 0.8% 0.8% 1974
    Houston 7.5% 11.9% 1975
    Indianapolis 5.0% 18.6% 1967
    San Antonio 16.0% 42.4% 1979
    Washington 5.2% 4.1% 1949
    Average 3.2% 3.7%

    Wendell Cox is a Visiting Professor, Conservatoire National des Arts et Metiers, Paris and the author of “War on the Dream: How Anti-Sprawl Policy Threatens the Quality of Life

  • Dallas Charges Up for the Electric Chevy

    If they build it, will we come? Planners, utilities, auto industry execs, and retailers are hopeful that we will, as they get themselves ready for electric vehicles in the Dallas/Fort Worth Metroplex. This isn’t a pie-in-the-sky vision for the future. The reality is unfolding right now. In 2011, NRG Energy will install upwards of 70 car-charging stations across Dallas and Forth Worth. As the Nissan Leaf and the Chevy Volt begin to penetrate the D/FW market, NRG aims to capture the revenue stream from charging car batteries here, just it is doing in Houston. NRG’s news comes on the heels of electric utility TXU Energy’s announcement of its own installation of twelve public charging stations being allocated across Dallas and Fort Worth.

    I’ve been watching the wave for several years as part of my work with emerging companies. At numerous conferences on electric vehicles, I’ve observed stakeholders – many of them in competition with each other – come together to swap ideas, network, and hammer out standards. It’s been an education in the necessity of collaboration to foster sustainable development.

    Cooperation hasn’t been guided by idealism so much as by the urge to survive in a market that, until recently, was practically non-existent. Start-ups that have failed to collaborate have fallen by the wayside. As one conference speaker joked, “We’ve got to build up the market before we tear each other down.”

    Profit-making may be the motivation of electric-vehicle manufacturers, but others at the table have their own agendas for EV readiness. The city of Dallas, for example, is in Serious Nonattainment status for ozone pollution. The region risks losing funding if it doesn’t clean up its air. “Seventy percent of air pollution in Dallas comes from on-road/off-road vehicles, so EVs can play a substantial role in resolving this,” said Jennifer Cohen, Executive Director for the North Texas Clean Air Coalition. Cohen was an organizer of the Electric Vehicle North Texas Electric Vehicle Showcase last September at the State Fair of Texas.

    At the Electric Vehicle Showcase. Betsy del Monte, Director of Sustainability for Dallas-based construction giant BECK told a panel, “Mass transit alone cannot solve our problem. We also need to look at the broader picture in terms of development. Of the palette of materials that we have available, EVs are one of the tools we must come to rely on.”

    Tom Reddoch, Director of Energy Efficiency for Electric Power Research Institute, agreed: “This is a success story. EPRI is connecting two giants, the electric industry with the auto industry.” To assist stakeholders with the information they need to build communities that can sustain a transition to electric vehicles, EPRI sees three keys: regionally-driven consumer attitudes, the installation of charging infrastructure in order to ensure a positive response for the drivers’ first experiences, and utility readiness. “We have plenty of capacity to go around, especially if people charge at night,” said Reddoch, “but there could be localized effects where cars cluster. The construction community, developers, and architects need to address this together.”

    At a technical level, tools are emerging that can help integrate electric vehicles into the transportation landscape. “We’ve arrived at an interesting nexus between the power industry and the auto industry,” said Brad Gammons of IBM. “There is not going to be a dominant leader so we need standards across the value chain… Collaboration ensures that things happen efficiently.”

    Not all collaboration requires complex software. Some of it is happening on the ground, person to person. The installation of electric vehicle charging infrastructure in D/FW is giving two cities with a long (if friendly) rivalry a chance to mutually benefit by working together. “To get the mayor of Fort Worth to travel to Dallas to talk about EVs is huge,” said Jim Greer of Oncor electricity.

    Range anxiety continues to be a barrier to electric vehicle adoption, even though three-fourths of Americans commute less than 40 miles per day. “To handle range anxiety, we need to provide home-based charging capability,” said del Monte from BECK.

    At the same time, Half Price Books unveiled Dallas’ first public charging station. Granted, there’s not a line around the block for the EV charger yet. But just having it at one of Dallas’ most popular bookstores sends a tangible signal to drivers that the future is here and now.

    As the infrastructure falls into place, the question remains: Will drivers buy the cars? We’ll find out very soon. The Chevy Volt is scheduled to arrive on car dealers’ lots in Dallas-Fort Worth in March.

    Photo of the Chevy Volt, a plug-in electric vehicle by IFCAR

    Anna Clark is the author of Green, American Style and the president of EarthPeople. She lives in one of Dallas’ first residences to earn a Platinum-LEED certification from the U.S. Green Building Council.

  • Britain’s Housing Crisis: Causes and Solutions

    British house construction has remained at a low level for a decade.   Total new house and flat completions for all tenures last year were 113,670 for England, 17,470 for Scotland, and 6,170 for Wales. Excluding Northern Ireland that is 137,310 for Britain. Under 140,000 homes a year is low for a nation of 60 million.

    We are nearly at the lowest level of housing production since reliable records began in the 1920s. (Note 1)  

    Anyone expecting British house building to pick up soon will be disappointed, even as the housing market inflates into another bubble. Grant Shapps,  the Coalition government’s Housing and Local Government Minister, is also hoping that house price inflation will not return to make the present housing predicament worse.  

    He will be disappointed, too. Shapps wants modest deflation and more houses to be built. However, he is powerless to make that happen while his government sustains the national denial of Freehold development rights that in Britain defines the planning system. By denying landowners the right to build on any land they own, the system works against significant levels of housing production.

    The renewal of house price inflation

    The low level of production all but guarantees renewed house price inflation. According to estate agency Savills, inflation-adjusted house prices grew by 68 per cent in the decade up to 2010, even after the British housing market finished wobbling during the sub-prime mortgage finance crisis. Savills told readers of The Telegraph that house prices will inflate by 40 per cent in real terms over the next decade.  

    Britain’s vast majority of home owners will be relieved. Most people have felt uneasy with financial dependency on the debt and equity in their home. For most British households wages and pensions are insufficient.

    At the root of the problem lies the peculiar nature of Freehold in Britain. The government enjoys an effective national instrument in their effort to protect the housing market. An old innovation of the post-war planning system, this ensures cheap farm land can never come onto the market to allow the building of low cost homes in great volume, sufficient to precipitate a housing market crash worth having. Planning as a denial of development rights works very well to protect the members of the Council of Mortgage Lenders.

    This keeps house building volume low.   Britain’s former volume house builders have begun to make the painful adjustment to work within the Coalition’s planning system. It will not be easy for them.

    The national denial of development rights is sustained, and in many ways the problem is worse under the Conservative-led coalition than under New Labour.

    The house builders have been stripped of New Labour’s national target of 240,000 net additional homes a year, but that was an unmet and inadequate target.   Even more troubled are plans to develop 50 proposed “eco towns” also proposed by Labour, itself a small, even deluded, enterprise that is pathetic compared to development elsewhere in the world.

    Urban expansion and new settlements – whether in Britain or elsewhere – require land. And Britain, contrary to popular belief has land aplenty. The restraints placed on builders can best to described in the words of Sir Peter Hall, as a “Land Fetish”.   

    The planning system also is host to an eco-fetish that the Coalition appears willing to sustain regardless of housing need.

    Inevitably some house builders will have subscribed to the idea that the environment is too precious to allow much land to be developed, but not all.  This leaves no centralised attempt to satisfy the demand for new household formation following from population growth, the needs of immigrants, or to encourage the replacement of the worst housing stock. For greens of the more misanthropic persuasion, opposition to both population and production makes sense. They don’t want humanity to reproduce either biologically or industrially. They don’t want a world that is always about advancing human interests through industry.

    Yet the need for new homes won’t so easily go away.

    A three sided predicament

    This contemporary British housing trilemma will not be easily resolved. The country seems to accept expensive, inadequate housing and mortgage debt as a fact of life.  

    Yet this leaves us with no solution for future needs.

    Something needs to change.  Hugh Pavletich and Wendell Cox publish as Demographia have found – for the seventh year running – increasing unaffordability of British housing.  

    The Solution: 250 New Towns

    The only reasonable solution is to tear down the current planning structure. What we need is an audacious move to build some 250 new towns.

    This movement would try to replicate past successes. In the brief inter-war period, 1918 to 1938, popular owner occupation flourished, with economically struggling farmers keen to sell their Freehold land to house builders.  

    How long will Britain live with low levels of construction, increasingly higher prices and consistently low levels of affordability? The increasing drag of house price inflation on household incomes and the acceptance of poor quality British housing in short supply cannot be sustained indefinitely.  

    How long will Britain sustain housing unaffordability as a financial opportunity, protected by a weak government?  

    The British collective obsession with inflating house prices must end sometime, unless we are to lose all sense of housing primarily as somewhere useful to live.  

    The freedom to build on your own land will deflate the housing market, dramatically in some locations.  Giving all landowners their Freehold right to build will liberate the commercial construction industry from the burden of inflated land prices, allowing disruptive advances in industrial production.  

    If Britain faces the house price inflation projected by Savills in the next 10 years there are many home owners dependent on housing equity who will not object. Neither will the house builders object too much as they build a low number of luxury eco-homes, to the undoubted applause of the architectural press. They may enjoy the praise for their greenness. Farmers might subsist as environmentalists. Greens will be sufficiently deluded to imagine there was some point to all this. The City will make a healthy return.

    The green zealots are conspicuous, and need to be confronted by industrialists with a sense of humanity. Now is no time to let them get away with their anti-humanism.

    Britain certainly is capable of more than is currently being discussed. National housing output had peaked in 1968 at 413,714, more than twice the current rate.

    We have to answer the question: Who will organise to better explain and end the housing predicament in low wage industrial Britain? We are hoping the 250 new towns club can start the ball rolling.

    —-

    Note 1 – Marian Bowley, ‘Table 2, Numbers of Houses Built in England and Wales between January 1, 1919 and March 31, 1939’, in Housing and the State 1919-1944, London, George Allen & Unwin, 1945, p 271

    Ian Abley, Project Manager for audacity, an experienced site Architect, and a Research Engineer at the Centre for Innovative and Collaborative Engineering, Loughborough University. He is co-author of Why is construction so backward? (2004) and co-editor of Manmade Modular Megastructures. (2006) He is planning 250 new British towns.

  • Obama’s High-Speed Rail Obsession

    Perhaps nothing so illustrates President Obama’s occasional disconnect with reality than his fervent advocacy of high-speed rail. Amid mounting pressure for budget cuts that affect existing programs, including those for the inner city, the president has made his $53 billion proposal to create a national high-speed rail network as among his top priorities.

    Our President may be an intelligent and usually level-headed man, but this represents a serious case of  policy delusion. As Robert Samuelson pointed out in Newsweek, high-speed rail is not an appropriate fit for a country like the U.S. Except for a few areas, notably along the Northeast Corridor, the U.S. just lacks the density that would make such a system work. Samuelson calls the whole idea “a triumph of fancy over fact.”

    Arguably the biggest problem with high-speed rail is its extraordinary costs, which would require massive subsidies to keep operating. Unlike the Federal Highway Program, largely financed by the gas tax, high-speed rail lacks any credible source of funding besides taxpayer dollars.

    Part of the pitch for high-speed rail is nationalistic. To be a 21st century super power, we must emulate current No. 2 China. But this is a poor reason to indulge in a hugely expensive program when the U.S. already has the world’s most evolved highway, freight rail and airline system.

    Also, if the U.S. were to follow the Chinese model, as some have suggested, perhaps it should impose rule from a Washington version of a centralized authoritarian government. After all, dictatorships are often quite adept at “getting things done.”  But in a democracy “getting things done” means balancing interests and efficiencies, not following orders from above.

    In China high-speed rail is so costly that the trains are too expensive for the average citizen. Furthermore, construction costs are so high the Chinese Academy of Sciences has already warned that its debts may not be payable. This experience with ballooning costs and far lower fare revenues have raised taxpayer obligations in Taiwan and Korea and added to heavily to the national debt in Japan.

    The prospect of mounting and uncontrollable costs has led governors to abandon high-speed projects  in Ohio, Wisconsin and most recently Florida, where a battle to save the Tampa-Orlando line has begun . In times of budget stress, the idea of building something new, and historically difficult to contain by costs, becomes a hard sell.

    Oddly, the leaders of California, faced with one of the worst fiscal positions in the country, are determined to spend several billions on what Sacramento Bee columnist Dan Walters has dubbed a “train to nowhere” for 54 miles between Madera and Corcoran — two unremarkable and remote Central Valley towns. The proposal makes the former Alaska Sen. Ted Stevens’ notorious ”bridges to nowhere” project seem like frugal public policy.

    California’s train to nowhere has been justified as part of wider project to construct a statewide system. But the whole idea makes little financial sense: The University of California’s Institute for Transportation describes the high-speed proposal as based on an “inconsistent model” whose ridership projections are simply not “reliable.”

    Equally suspect are cost estimates, which have doubled (after adjustment for inflation) from 1999 to $42.6 billion last year and. A new study says that the project could currently cost close to $65 billion. Costs for a ticket from Los Angeles to San Francisco, originally pegged at $55 one way, had nearly doubled by 2009, and now some estimates place it at about to at least a $100 or perhaps much as $190 — considerably more than an advanced-purchase ticket on far faster Southwest Airlines.

    There’s growing political opposition to the system as well, and not just among penny-pinching right-wingers. Residents and local officials in the San Francisco Peninsula, a wealthy and reliably liberal portion of Silicon Valley, largely oppose plans to route the line through their communities. This includes some prominent liberal legislators, such as San Mateo’s Assembly Jerry Hill, who has threatened to put high-speed rail back on the ballot if costs start to surpass initial estimates. Another Democrat, California Treasurer Bill Lockyer has doubts that the rail authority will be able to sell the deal to potential bond-buyers   due in part to a lack of consistent estimates in ridership or cost.

    So why is Obama still so determined to push the high-speed boondoggle? Largely it’s a deadly combination of theology and money. Powerful rail construction interests, notably the German giant Siemens, are spreading cash like mustard on a bratwurst to promote the scheme. Add to that construction unions and the ever voracious investment banks who would love to pocket fees for arranging to sell the bonds and you have interests capable of influencing either party.

    Then there’s what might be called the “density lobby” — big city mayors, construction firms  and the urban land owners. These magnates, who frequently extort huge public subsidies for their projects, no doubt think it grand to spend billions of public funds on something that might also increase the value of their real estate.

    And finally there are the true believers, notably planners, academics, green activists and an army of rail fans. These are people who believe America should be more like Europe — denser, more concentrated in big cities and tied to the rails. “High speed rail is not really about efficient transport,” notes California transit expert and accountant Tom Rubin. “It’s all about shaping cities for a certain agenda.”

    Yet despite their power, these forces face mounting obstacles. As transportation expert Ken Orski points out, the balance of power in the House now lies with suburban and rural legislators, whose constituents would not benefit much from high-speed rail. And then there are governors, increasingly Republican and conservative, very anxious not to add potentially huge obligations to their already stressed budgets.

    The most decisive opposition, however, could come from those who favor transit spending but understand to the need to prioritize.  High-speed rail is far more expensive than such things as fixing current commuter rail and subways or expanding both public and private bus service. Indeed, the money that goes to urban rail often ends up being diverted from other, more cost-effective systems, notably buses.

    The choice between high-speed rail and more conventional, less expensive transit has already been presaged in the fight against expanding LA’s expensive rail system by organizations representing bus riders. These activists contend that rail swallows funds that could be spent on buses

    Much the same case is being made the San Francisco peninsula. The opponents of high-speed rail on the San Francisco Peninsula are outraged that the state would spend billions on a chancy potential boondoggle when the popular Caltrain commuter rail service is slated to be curtailed or even eliminated.

    One can of course expect that anti-spending conservatives will be the biggest cheerleaders for high-speed rail’s decline. But transit advocates may be forced to join the chorus of opposition, in order to steer   transit spending towards more basic priorities as buses in Los Angeles, subways in New York or commuter rail in the San Francisco Bay Area.

    In an era of tough budgets, and proposed cutbacks on basic services, setting sensible transportation priorities is crucial. Spending billions on a conveyance that will benefit a relative handful of people and places is not just illogical. It’s obscene.

    This piece originally appeared in Forbes.

    Joel Kotkin is executive editor of NewGeography.com and is a distinguished presidential fellow in urban futures at Chapman University, and an adjunct fellow of the Legatum Institute in London. He is author of The City: A Global History. His newest book is The Next Hundred Million: America in 2050, released in February, 2010.

    Photo: Center for Neighborhood Technology

  • The Evolving Urban Form: Seoul

    Based upon the preliminary results of the South Korea 2010 census, Seoul has become the world’s third largest metropolitan area. The jurisdictions making out the metropolitan area, the provincial level municipality of Seoul (which is the national capital), the province of Gyeonggi and the provincial level municipality of Incheon now have a population of approximately 23.6 million people. This is third only to Tokyo – Yokohama, which has a population of approximately 40 million and Jabotabek (Jakarta), which is approaching 30 million. While international metropolitan area population estimates should be taken with a "grain of salt," (Note 1: Metropolitan Areas) the rise of Seoul is nearly unprecedented in the high-income world. Further, many more people are projected to move to the Seoul metropolitan area as the trend of rural and smaller area migration to larger urban areas continues.

    A Difficult History: However, any analysis of Seoul and its progress must begin in the context of the overall economic progress of South Korea and its difficult history.

    Seoul was a major battleground in the Korean War of 1950 to 1953. During 1950 alone, military control of the municipality of Seoul changed hands four times. Today, despite the precariousness of the political situation on the Korean Peninsula, the northern suburbs of Seoul are as close as four miles (seven kilometers) from the demilitarized zone, which forms the border with North Korea. 

    Strong Economic Growth: A very poor country even before the war, South Korea has been an economic success story. Based upon data produced for the Organization for Economic Cooperation and Development by the late economist Angus Maddison, South Korea had a gross domestic product per capita (purchasing power parity) of less than $1300 (2010$) in 1950. It had peaked, as a Japanese colony, somewhat above that level before World War II, but never approached one quarter of the GDP per capita of the United States and averaged less than one third of then high income Argentina.

    After the Korean War, initial economic progress was slow. As late as 1965, South Korea’s GDP per capita was less than that of Mozambique. Since that time, South Korea’s GDP per capita has risen from approximately $2000 to $30,200 in 2010 It exceeded Argentina in the 1980s.  

    South Korea today has a higher GDP per capita than Spain and New Zealand and less than 10 percent behind the European Union, on which it is gaining quickly. As the capital, the Seoul is a prosperous metropolitan area in a prosperous country.

    South Korea’s prosperity is also considerable contrast to that of North Korea’s. South Korea’s GDP per capita is more than 15 times that of North Korea (Figure 1). This would make any future reunification far more expensive for South Korea then Germany’s unification was for West Germany, because the economic disparity, though substantial, was much less.

    The Urban Area: Growing and Dense: The Seoul urban area (area of continuous development) includes the municipality of Seoul and also includes the urbanization of Incheon, to the west and substantial suburban development in the province of Gyeonggi on the other three sides (Note 2: Urban Areas). Based upon an analysis of data from the 2010 census, we have estimated the Seoul urban area population at 22.5 million. The next edition of Demographia World Urban Areas: Population & Projections (current edition) will show Seoul to be the world’s third largest urban area, trailing only Tokyo-Yokohama and Delhi (which recently passed Mumbai to become India’s largest urban area). Jakarta, the second largest metropolitan area, ranks as the fourth largest urban area, though will soon pass Seoul, because of much stronger growth. Among high income world urban areas, Seoul’s population growth has been greater than that of any other since 1950 except for Tokyo-Yokohama. Seoul added more than 20 million people, while Tokyo-Yokohama added more than 25 million people. By comparison, New York added less than 10 million people and Paris added 4 million people.

    Seoul’s population density is among the highest of the world’s affluent urban areas. With population density of 27,000 people per square mile (10,400 per square kilometer), Seoul ranks second in the high income world among urban areas of more than 5 million people, trailing only Hong Kong, which is more than twice as dense. Thus, Seoul is more than twice as dense as Tokyo-Yokohama, three times as dense as Paris and four times as dense as Los Angeles or Toronto, the densest urban regions in North America.

    With the exception of Hong Kong, no first world urban area has the density of high rise condominium developments as are found in Seoul. While virtually all of the recent urban expansion in both population and geography has been in the suburbs, nearly all of the new residences are in high rise buildings.

    Seoul is also the home to massive city real estate developments. For example, Ilsan, in Gyeonggi is a very large planned high-rise community to the north of the Han River (which bisects the urban area), west of Seoul and north of Icheon. Most of Ilsan was developed by the early 2000s. The high rise development of Songdo, four miles (seven kilometers) south of the core of Incheon is intended to be home to 75,000 people and 50 million square feet of office space.

    Seoul’s Han River is crossed by multiple bridges, including architectural icons. A new international airport (Seoul-Incheon) was opened in 2005, 43 miles (70 kilometers) away from the Seoul central business district. This airport, on an island west of Incheon is most remote international Airport among the world’s megacities (urban areas over 10 million population), 8 miles further even than Narita International Airport from central Tokyo. Domestic flights continue to operate out of Gimpo Airport, which is halfway between the cores of Seoul and Incheon.

    Distribution of Population Growth: The municipality of Seoul – the capital district – is one of the largest municipalities in the world, with nearly 10 million people (Note 3: Municipalities). However, like many core municipalities that have not expanded their boundaries, Seoul is losing population. The 2000 census shows the population to have declined 900,000, or nearly 10 percent, from 1990. The population loss during the 2000s was a somewhat more modest 200,000.

    Since 1990, all the population growth in the Seoul metropolitan area since has been in the suburbs. The province of Gyeonggi has gained more than 5 million residents, while the municipality of Incheon has added more than 800,000 residents.  During the 2000s, the province of Gyeonggi added enough population to exceed the municipality of Seoul as the largest provincial level jurisdiction in the metropolitan area (Table).

    Seoul Metropolitan Area Population: 1960-2010
    Year Metropolitan Area Provincial Level Jurisdiction
    Seoul Gyeonggi Incheon
    1960 5.1 2.4 2.7  
    1970 8.6 5.3 3.3  
    1980 14.9 8.3 6.6  
    1990 18.6 10.6 6.2 1.8
    2000 21.4 9.9 9.0 2.5
    2010 23.6 9.7 11.3 2.6
    In Millions
    Incheon created from Gyeonggi in 1981


    The Future? There is also some question about whether Seoul will remain the national capital. In 2004, the national government decided to move the capital to Gongju, 90 miles (150 kilometers) south of Seoul. The decision was both preceded and followed by considerable political jockeying and it appears that the government is backtracking on the capital move (though construction has begun).

    Regardless of the eventual fate of the new capital, Statistics Korea projections indicated that the Seoul metropolitan area will continue to expand. The population of the municipality of Seoul is expected to decline through 2030 while the suburban jurisdictions of Incheon and Gyeonggi are expected to continue their growth. Further, more rapid growth is anticipated in North Chungcheon and South Chungcheon provinces as the metropolitan area, and perhaps even the urban area spreads further to the south. This larger metropolitan area is projected to grow to more than 31 million people by 2030.

    —-

    Note 1: Metropolitan Areas: Metropolitan areas are the economic dimension of the urban form. They represent the labor markets (area from which people commute to the urban area) and thus include both the urban area and surrounding economically attached rural and exurban areas. There are no international standards for delineating metropolitan areas and most national statistical agencies have no such delineation. The nations that do giving me metropolitan areas have differing standards and even within nations there are substantial difficulties. The only serious attempt to define metropolitan areas based upon consistent standards was by urban expert Richard L. Forstall (who ran the Rand McNally "Ranally" international metropolitan area program), Richard P. Green and James B. Pick. The complexity of the research is indicated by the fact that their list is limited to the top 15 in the world. Other attempts to delineate metropolitan areas generally rely on complete second or third level jurisdictional boundaries, such as counties, states or provinces. This can lead to specious comparisons of densities, because the jurisdictions that are used vary so much in size. This is perhaps best illustrated by comparing Portland and Riverside – San Bernardino. In 2000 (latest available data), the Riverside – San Bernardino urban area had a densities slightly higher than that of Portland. Yet the metropolitan areas vary greatly in size, due simply to the size of the counties that comprise them. The two counties of the Riverside – San Bernardino metropolitan area cover four times as much land area as the seven county Portland metropolitan area.

    Note 2: Urban Areas: urban areas are the structural dimension of the urban form (the "urban footprint"). Urban areas are the area of continuous urban development. They may also be called urbanized areas (such as United States, United Kingdom, France, India and Canada); urban centers (Australia) or urban agglomerations (United Nations). Canada will switch its terminology for urban areas to "population centres" in the 2011 census. The distinction between urban areas and metropolitan areas can be confusing and has led some internet – based lists to somewhat indiscriminately mix the two. Moreover, the term "urban area" has even been used to denote an area well beyond the continuous urbanization (more akin to a metropolitan area), such as in its definition by statistics New Zealand.

    Note 3: Municipalities: international comparisons of municipalities (often called "cities," which is a term that can also be used for two substantially different concepts, metropolitan areas and urban areas) are generally invalid, because there is no geographic or population criteria between or even within nations by which municipalities are defined. This is illustrated by the fact that the world’s largest municipality, Chongqing is largely rural, not urban, and covers an area approximately the size of Austria or Indiana. While the municipality of Chongqing (and virtually all other Chinese "cities") is larger than its metropolitan area, municipalities may be far smaller than their metropolitan areas. For example, the municipality of Melbourne ("city of Melbourne") has less than 2 percent of the metropolitan area population, while the municipality of Atlanta has less than 10 percent of the metropolitan area.

    Note 4: The United Nations population estimates show the Seoul urban area to be limited to the municipality of Seoul which produces a far smaller estimate of less than 10 million people.

    —–

    Photo: Suburban Seoul (by author)

    Wendell Cox is a Visiting Professor, Conservatoire National des Arts et Metiers, Paris and the author of “War on the Dream: How Anti-Sprawl Policy Threatens the Quality of Life

  • Chicago Takes a Census Shellacking

    The Census results are out for Illinois, and it’s bad news for the city of Chicago, whose population plunged by over 200,000 people to 2,695,598, its lowest population since before 1920.  This fell far short of what would have been predicted given the 2009 estimate of 2,851,268. It’s a huge negative surprise of over 150,000, though perhaps one that should have been anticipated given the unexpectedly weak numbers for the state as a whole that were released in December.

    The American Community Survey data from last year show a clear improvement in items like college degree attainment (up 7.6 percentage points since the 2000 Census) and median household income (up 18%, which trailed the nation slightly, but beat Cook County and the state).  These data points show the very real improvements that have swept over a portion of the city, the visible gentrification that envelops the greater core area has now been shown to have been unable to power overall population growth, or to restrain the rampant exurbanization in the region.

    White and Black Flight

    The non-Hispanic White Only population of the city actually declined by 52,449, or 5.78%.  The “minority” population declined even further, -147,969 or 7.44%, meaning the city actually grew its white population share by 0.38 percentage points, perhaps indicating the early stages of the “Europeanization” of Chicago as the core gentrifies and disadvantaged groups and the white working class are pushed further to the fringe.

    Indeed, the Black Only population plunged by 177,401 as blacks increasingly moved to suburbs, especially southern ones  like Matteson, Lansing, Calumet City, Park Forest, and Richton Park, each of which added thousands of new black residents.  Some indications are that a significant number of black residents left the region altogether.  The traditional black magnet of Atlanta – which struggled through much of the decade – was a top five destination for people leaving Chicagoland over the past decade, and Chicago was the #2 source of in-migrants to Memphis, another black hub, according to IRS data.

    Hispanic population was the bright spot for Chicago, as the city added Hispanic residents to the tune of 25,218, or 3.35%.  Hispanics boosted their population share in the city by nearly 3 percentage points.  But even this growth isn’t that impressive.  The city of Indianapolis, at less than a third Chicago’s population, added over 45,000 Hispanics on a much smaller base.

    Demographic Reality: Massive Exurbanization

    Much has been made of Chicago’s legitimate and real urban core renaissance, but the cold reality remains that this is one of America’s most sprawling regions. Regional growth continued to be heavily focused not in the city or established inner suburbs, but the exurbs.  Kendall County more than doubled in population, and counties like Grundy, Boone, and Kane also made the top five in the state. Cook County, which is about half made up of the city of Chicago, as a whole actually lost population. And traditional suburban powerhouse DuPage has flattened, while Lake County, Illinois fell just short of the national average in growth. During the last decade, a net of over 25,000 people moved from metro Chicago to metro Rockford, making that city the #2 destination for those leaving Chicagoland. Given that Rockford is hardly an economic mecca, clearly exurbanization is spreading far beyond traditional metro boundaries. Sprawl of the most intense kind is alive and well in Chicagoland.

    The following map illustrates this, with a five bucket sort of 2000-2010 population percentage change, growing counties in black, shrinking in red:


    The raw data on regional growth speaks for itself:

    Core+Suburb vs. Exurb

    2000

    2010

    Total Change

    Pct Change

    Core + Established Suburb (Cook, DuPage, Lake Counties)

    6,925,258

    6,815,061

    -110,197

    -1.6%

    Exurb (Other IL Metro Chicago Counties)

    1,347,510

    1,771,548

    424,038

    31.5%

    This sprawl might be more understandable in rapidly growing cities like Atlanta and Houston that can both densify the core and grow outwards simultaneously.  But the Chicago-Joliet-Naperville-IL Metropolitan Division (the full MSA is not yet available since Wisconsin hasn’t been released yet) grew at less than half the national average. This means that the exurbanization trend in Chicagoland is almost entirely loss of population share by the core to the fringe.

    To put an even starker view on the concentration of growth in Illinois as a whole, this map highlights only those counties that grew faster than the already anemic statewide average:


    Other than a handful of counties, the group of fastest growing counties in the state is dominated by suburban and especially exurban Chicago and St. Louis counties.

    For those of us who’ve chosen to plant our flag in the city, these results are most unwelcome news, no two ways about it. This is especially true as underfunded pensions and city budget gaps loom large, and where the per capita load only goes up as the population goes down.  This report should be a call to arms to the next mayor and the city as a whole to make the promise of revitalization a reality, and bring growth and prosperity to the city as a whole, not just a the upscale core. Cities like Chicago have to become more aspirational; places of upward mobility to broad sections of the middle and working classes. The city and Cook County can’t afford another decade like this one.

    Aaron M. Renn is an independent writer on urban affairs based in the Midwest. His writings appear at The Urbanophile.

    Photo by Gravitywave

  • Segregation and Quality of Life

    CensusScope’s dissimilarity index measures the distributions of blacks and whites across a city to quantify the level of integration and segregation. The site discerned three major Midwestern cities in the top ten: Detroit, MI in second; Milwaukee, WI in third; and Chicago, IL in fifth. These cities are major hubs for their region, both socially and economically. But does segregation affect quality of life? And does it help or hinder job growth?

    In order to get a decent comparison between these segregated cities and their quality of life, it’s necessary to take into account three cities with relatively low segregation: Minneapolis at 107; Austin, TX at 179; and Madison, WI at 213.

    To estimate quality of life, let’s look at three factors from the American Community Survey, 2009: Percentage of population with a Bachelor’s degree of higher; percentage of population considered unemployed; and percentage of families below the poverty level. Comparing the different values with their respective city produces an interesting result.


    Chicago

    Detroit

    Milwaukee

    Austin

    Madison

    Minneapolis

    % Bachelor’s +

    33.3

    26.2

    30.9

    38.4

    40.3

    37.5

    % Unemployed

    8.5

    12.4

    7

    6.3

    5

    6.3

    % Below Poverty

    9.1

    11.1

    9.1

    5.8

    5

    5.8

    Source: U.S. Census American Communtiy Survey

    The cities with the most segregated neighborhoods tend to have a less-educated base, contain a higher amount of unemployed workforce, and also have more families below the poverty level. On the other hand, Madison, Minneapolis, and Austin all boast high levels of educational attainment, relatively low unemployment rates, and a smaller percentage of families living below the poverty level, although Austin comes close.

    However, Madison and Austin are relatively smaller than the other areas listed here, and have prospering tech sectors and contain well-known universities that tend to dominate the city’s economy. With respect to this, segregation may not be a factor at all. Instead, the city’s development and more tech-oriented economies may be the answer.

    From these results, one may be able to cite segregation as an obstruction to a strong quality of life. One variable that seems to stick out amongst the data is that of educational attainment. Does education reduce segregation, or does segregation impede education?>