Category: Urban Issues

  • New Index Estimates New House Cost Impact of Land Regulation

    In recent decades, an unprecedented variation has developed in the price of new tract housing on the fringe of US metropolitan markets. Nearly all of this difference is in costs other than site preparation and construction, which indicates rising land and regulation costs.

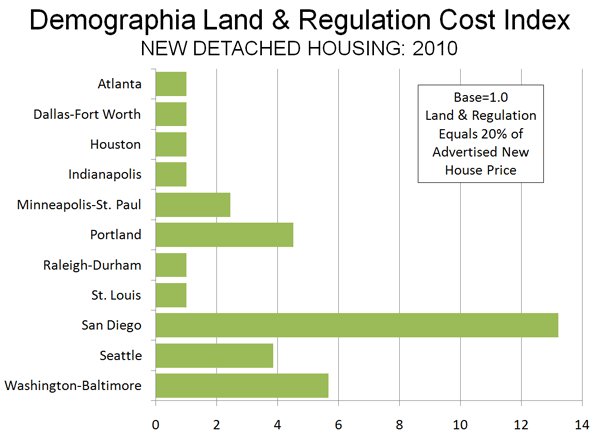
    Our first annual Demographia Residential Land & Regulation Cost Index estimates the price of land and regulation for new entry level houses compared to the historic norm in 11 metropolitan regions (Note 1). Metropolitan regions in which land and regulation costs remain at or below normal have an Index of 1.0 while those with land and regulation costs above normal will have an Index above 1.0 (Figure 1).

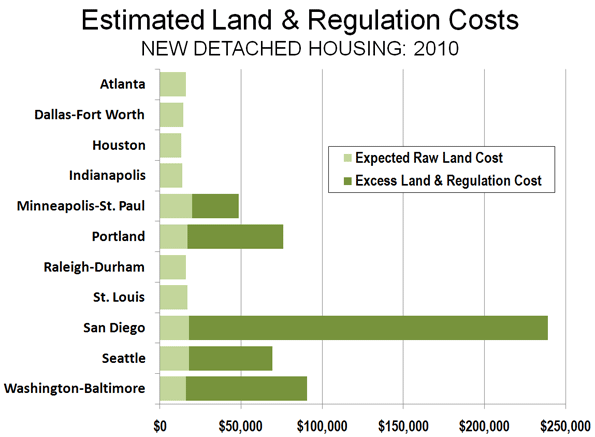
    More restrictive land use regulation is variously referred to as “smart growth,” “growth management” and other terms. More restrictive land use regulation is estimated to have added from nearly $30,000 (in Minneapolis-St. Paul) to more than $220,000 (In San Diego) to the price of a new home.

    Economic research has associated rising residential land costs with more restrictive land use regulations. The table indicates some of the more important price increasing impacts of more restrictive land use regulation.


    More Restrictive Land Use Regulation:

    Factors that Can Drive House Prices Higher

    1.. Increases underlying land costs

    2.. Increases planning and development costs

    3.. Raises financing costs

    4.. Encourages more expensive houses.

    5.. Increases construction costs

    6.. Encourages concentration of market power and land banking

    7.. Encourages land and housing speculation

    The Land and Regulation Ratio

    For decades, construction costs of tract house on the urban fringe in the United States have represented 80% or more of the advertised house price. The balance of 20% or less has been for land and regulation costs and will be referred to as the “land and regulation cost ratio.” In metropolitan markets with less restrictive land use regulation, the historic 20% or less land price ratio remains in place. The Demographia Residential Land & Regulation Cost Index assumes a 20% expected land and regulation ratio.

    In some metropolitan markets, however, house prices have increased far more rapidly than in the rest of the nation. The greater increase in house prices and escalation of land costs above the historic 20% land and regulation cost ratio has occurred in metropolitan markets burdened by more restrictive land use regulations. Urban growth boundaries, limits on the number of houses that can be built, large lot zoning and excessive development impact fees and the like are regulation strategies that increase the cost of land for building houses. These land cost increases are not the result of more rapidly rising construction costs or underlying market forces such as consumer demand.

    More restrictive land use land use regulation also creates obstacles to people buying houses, requiring them to devote more money to housing than necessary and increases their vulnerability to losses in the event of a financial downturn. This exposes mortgage lenders to increased risks of loan defaults. Finally, more restrictive land use regulation makes residential land development more dependent on politics, with the potential for greater influence through campaign contributions.

    The first annual Demographia Residential Land & Regulation Cost Index estimates cost of land and regulation for new entry level houses compared to the historic norm in 11 metropolitan markets. Each of the metropolitan regions in which house prices have risen above normal have adopted more restrictive land use regulations. Conversely, in each of the metropolitan regions in which house prices have not risen above normal levels, there is less restrictive land use regulation. During much of the Post-World War II era, all metropolitan markets had less restrictive land use regulations.

    Results

    The overwhelming majority of new housing in the United States continues to be detached and is built near or on the urban fringe (Note 2). For new detached homes, the Index is 1.0 in six metropolitan markets (Atlanta, Dallas-Fort Worth, Houston, Indianapolis, Raleigh-Durham and St. Louis). This indicates that land use regulation is less restrictive and does not add more than normal to the price of new homes (Note 3).

    In the other five metropolitan markets, the land and regulation cost ratio has risen above 20%, resulting in a higher Index. The Index is 2.4 in Minneapolis-St. Paul, 3.9 in Seattle, 4.5 in Portland, 5.7 in Washington-Baltimore and 13.2 in San Diego. It is estimated that more restrictive land use regulation raises the price of the least expensive detached houses from nearly $30,000 (in Minneapolis-St. Paul) to more than $220,000 (in San Diego) than would be expected if these metropolitan markets had retained less restrictive land use regulation (Figure 2).

    The metropolitan markets with more restrictive regulation have an average Demographia Residential Land & Regulation Cost Index of 5.9 for detached housing, while the metropolitan markets with less restrictive regulation average 1.0.

    Housing Affordability: Through the Bubble and Bust

    There is increasing concern about declining housing affordability across the nation. Even after the deflation of the housing bubble, house prices in some metropolitan markets remain well above pre-bubble prices and historic affordability standards. The housing affordability of the included metropolitan markets is illustrated by land use regulatory category in Figure 3. The Figure indicates the National Association of Home Builders-Wells Fargo Housing Opportunity Index for 1995, the peak of the bubble and early 2010, showing the percentage of households able to afford the median priced house. Similar affordability measures can be reviewed in the Annual Demographia International Housing Affordability Survey.

    Future Editions

    The 11 metropolitan regions included in the initial Demographia Residential Land & Regulation Cost Index were selected to provide a geographical and regulatory balance and because they had sufficient data from which to develop the Index. Additional areas will be added in future editions, with the intention of including all metropolitan regions with more than 1,000,000 population.

    ——-

    Note 1: The Index was derived from a database developed of new house offerings by national, regional and local builders, using internet sites and published metropolitan home guides. The period covered is January through June 2010.

    Note 2: In 2006, more than 85% of new single family houses sold in the United States were detached, according to Bureau of the Census data. Detached housing represents approximately 62% of all US housing units (including multi-unit dwellings).

    Note 3: In each of the metropolitan markets with less restrictive regulation, the estimated construction costs were more than 80% of the house price. By using a 20% land and regulation ratio, the house construction cost was capped at 80% of the house price. In each of the metropolitan markets with more restrictive regulation, the estimated construction cost was less than 80% of the house price.

    Wendell Cox is a Visiting Professor, Conservatoire National des Arts et Metiers, Paris and the author of “War on the Dream: How Anti-Sprawl Policy Threatens the Quality of Life

    Photo: Will County, Chicago urban fringe (By author)

  • The Real OC: Diverse, Dynamic and — Dare I Say — Progressive

    I recently returned to Orange County after a decade’s absence, fully aware that a stereotype of all-white, card-carrying-John Birchers still exists among many who remain unfamiliar with facts on the ground here.

    I never bought that old saw in the first place.

    And now, on a second venture into OC, I’m amazed by how deeply those old stereotypes have been buried under the accumulated accomplishments of everyday folks.

    The truth is that OC can rightfully claim ground as a leader when it comes to all sorts of popular buzzwords that are falsely applied to a lot of so-called cosmopolitan places.

    Start with “diversity,” a sop for all seasons in Los Angeles and other urban centers, where ethnic communities often are treated like so many pawns.

    Then there’s “dynamic,” another adjective that many metropolitan areas seem to think is theirs simply for the taking.

    Dare I add the presumptuous “progressive” to the list of over-used and seldom-earned buzzwords?

    I shall.

    In many ways OC, with its suburban reputation and libertarian leanings, comes closer to living up to the actual meaning of those words compared to many of the so-called cosmopolitan centers that cling to old stereotypes about this place.

    How do I figure?

    Take the campaign between Democratic incumbent Loretta Sanchez and Republican challenger Van Tran for the 47th District seat in the U.S. House of Representatives, an area that includes much of Central County.

    Tran has made Sanchez work hard in her re-election bid, no small feat considering her long incumbency.

    Neither candidate can count on ethnic appeal alone to propel them to the top. Latinos account for about 68% of the population in the district, which helps Sanchez. But voter registration is a different matter. Asians make up a smaller-but-still-significant base for Tran, with about 15% of the district—slightly more than whites. The winner will have to pick up a good chunk of voters outside their respective ethnic bases.

    That makes for a competitive race in a general election.

    And that’s a rarity in too many metropolitan areas.

    Consider Los Angeles, where ethnic communities too readily are factored like so many widgets into the calculus of ethnic politics. Electoral districts are carved up to turn this or that ethnic community into a lock for one political party or another.

    Candidates in these tailored districts typically get in line with power brokers before launching campaigns. There are occasional primary contests. But the differences between candidates in those intraparty affairs are usually so small that any debate is dominated by minute matters rather than any real difference in philosophies or policies.

    That’s stagnation.

    Some so-called cosmopolitan types might look at OC and say that the Sanchez-Tran race is an anomaly because of the challenger’s heritage. The local Vietnamese community ended up in OC after its founders fled a communist government, making it a natural for conservative, Republican politics here. That makes the community an outlier in terms of politics, ethnic or otherwise.

    That might hold up if it weren’t for Phu Nguyen, the Democratic nominee for the 68th District seat in the California Assembly, a territory that stretches from Anaheim to Newport Beach.

    Nguyen and Tran—Democrat and Republican— together belie any notion that the Vietnamese community is an outlier because of over-riding Republican loyalties in the local Vietnamese community.

    Nguyen’s opponent for the Assembly seat, Costa Mesa Mayor Allan Mansoor, points in the same direction as he engages in their high-spirited debate.

    Mansoor is a Republican who springs from Arabic and Finnish stock. The district that he and Nguyen vie to represent takes in parts of Little Saigon and Little Arabia, but does not feature a majority of voters of Vietnamese or Arabic heritage. There’s no big Finnish contingent, either.

    So you have a couple of candidates who can be readily identified by their ethnicities locked in an electoral battle that goes well beyond ethnic politics. They must reach beyond ethnic politics because the district in the heart of OC is too diverse for such narrow appeals.

    I don’t see any saints in the local political lineup. I’m willing to bet that both parties have tried to slice and dice the map to come up with districts that would make cynical use of ethnic communities.

    The point here is that OC attracts the sort of residents who reach beyond the familiar, pushing out here and bumping into one another there. Sure, Little Saigon is the major center of Vietnamese-American life, Santa Ana has an undeniably Latino core, and there is a Little Arabia in Anaheim. Yet those centers function more as cultural touchstones and less as assigned areas for members of those respective ethnic communities.

    The truth is that OC’s population mix is pretty well spread geographically and socioeconomically, with plenty of ambition—political and otherwise—throughout.

    That’s a different sort of diversity compared to what we hear so much about in a lot of so-called cosmopolitan centers.

    Sounds pretty dynamic.

    You might even call it progressive.

    Sullivan is managing editor of the Orange County Business Journal (ocbj.com)

    Photo by vansassa

  • The Privatization-Industrial Complex

    “I think this is just the latest way for people to make money off state and local governments. This is the new way the investment banks, their lawyers, and consultants squeeze the taxpayers….They’re going around making these deals, and it’s very lucrative. It’s like a circus coming to town.” – Clint Krislov

    Privatization has long been advocated by many conservatives as a good government measure. Traditionally, privatization was used a tool that subjects government monopolies to competition from the marketplace, driving down costs and improving quality of service. Privatization pioneer Steve Goldsmith, former mayor of Indianapolis and now deputy mayor of New York City, used to apply what he called the “Yellow Pages test.” If he could open the Yellow Pages and find several companies providing a service, he wondered why government should be in that business.

    As Mayor, Goldsmith privatized dozens of city services in Indianapolis, saving the city an estimated $120 million the process. This ranged from contracting out services, to forming a public/private partnership to implement a $500 million infrastructure improvement plan to hiring private managers to run – but not own or lease – the airport and water utility.

    Today, sadly, privatization is less about Goldsmith style operational effectiveness and more about providing jackpots for financiers who stand at the core of a growing privatization-industrial complex. Cities and states salivate over ways to sell or lease off underperforming public asset for large payouts. With local governments cash-strapped and the public unwilling to pay more in taxes, it is politically difficult to even bring user fees to a market rate. Combined with the potential billions in payoffs – Indiana received $3.9 billion for its toll road and Chicago $1.1 billion for its parking meter system – the appeal is obvious.

    But these transactions differ markedly from the Goldsmith-style privatization. They are driven not by efficiencies but by an investment banker mindset focus on money and narrow parameters of the asset operations. They also provide enormous temptation to elected officials to grab the money now even at the expense of future generations. They are also rife with potential conflicts of interest and incentive problems.

    One major source of conflict comes with the professional advisors that drive the deals. Since long term leases involve so much money and are so complex, they require millions of dollars of services from investment banks, lawyers, financial advisors, etc. Unlike for typical government transactions such as issuing bonds or contracting out services like printing, building maintenance, or call centers, for which cities have some experience, the vast majority of cities have little in house expertise for complex financial transactions.

    Thus local officials are at the mercy of these out of town experts to give them the best advice they need to defend the public’s interest. But what advice can we expect from these firms, who have a stake on highly leveraged deals? The people in the firm may be technically competent and possess the highest levels of personal integrity, but still are prisoners of a structural conflict of interest in promoting privatization transactions.

    Consider Morgan Stanley. An arm of Morgan Stanley was the winning bidder on the Chicago parking meter lease. That deal is widely seen as a disaster, giving the idea privatizing meters a black eye, and engendering such headlines as “Morgan Stanley’s $11 billion makes Chicago taxpayers cry (Bloomberg) and “Company [Morgan Stanley] Piles Up Profits from City’s Parking Meter Deal” (NY Times).

    Now Morgan Stanley is back, this time advising Pittsburgh and Indianapolis on potential parking meter privatizations. Morgan Stanley has a huge structural incentive to want those deals to go through. It would restart the market for parking meter privatization, and position the firm as the preferred advisor to cities. Even where they were not the city’s advisor, a restarted parking meter market means they could potentially bid on many more assets.

    If you make money on privatization transactions, then no deals means no money. So obviously these firms have every reason in the world to promote privatization and see deals go through regardless of whether any particular deal is good or not. This doesn’t mean they are crooks, it’s just the reality. These firms now form of the core of the “privatization-industrial complex” with an incentive to cheerlead for leading public assets because that’s how they make their money. They need deal flow, the more transactions the better.

    This was picked up on by Harrisburg, PA. Facing bankruptcy, the state offered an $850K grant to hire Scott Balice Strategies of Chicago, one of the nation’s top privatization financial advisors. The city council turned it down. As one city councilor noted, “Their recommendation is always the same: ‘sell assets’”.

    Many of these investment banks, operators, financial advisers, and law firms also have tight links with each other, and participate on deals together, often as partners, other times as opponents. The Pittsburgh Post-Gazette noted how many of these firms have ties to Chicago’s earlier round of privatization. “When Pittsburgh proposed leasing its public parking facilities, the city became a magnet for a passel of firms – many of them connected to Chicago by blood, politics or business – that pursues similar deals around the country. The firms may be partners in one city, rivals or referees in the next.” The winning bidder on the Pittsburgh parking transaction is actually Morgan Stanley’s partner in the Chicago deal, for example.

    These potential conflicts make it very difficult for cities to know they are making a good deal, especially since they lack the experience necessary to independently judge it. Right now, they often are at the mercy of their advisors. And ask yourself this: when was the last time a city or state looked seriously at one of these deals and their advisors told them not to do it?

    This is frequently combined with traditional clout driven contracting. Many of the Chicago parking meter firms had tight links to the Daley administration. Similarly, in Indianapolis a city-paid chief advisor to the office of the mayor is conveniently also a registered lobbyist for the winning bidder. This combination is a recipe for disaster, resulting in very long term deals that could be very bad for the public.

    Long term lease deals can still make sense – if they are done right. The Chicago Skyway and Indiana Toll Road deals were both home runs, for example. But given the enormous risks if something goes wrong, governments must put into a place a robust process for protecting the public, with a full airing and mitigation plan for the bad incentives that populate so many areas of this field.

    Aaron M. Renn is an independent writer on urban affairs based in the Midwest. His writings appear at The Urbanophile.

    Photo by ehfisher

  • Suburban Nation, but Urban Political Strategy

    Ideologues may set the tone for the national debate, but geography and demography determine elections.

    In America, the dominant geography continues to be suburbia – home to at least 60 percent of the population and probably more than that portion of the electorate. Roughly 220 congressional districts, or more than half the nation’s 435, are predominately suburban, according to a 2005 Congressional Quarterly study. This is likely to only increase in the next decade, as Millennials begin en masse to enter their 30s and move to the periphery.

    Now the earth is shaking under suburban topsoil — in ways that could be harmful to Democratic prospects. “The GOP path to success,” according to a recent Princeton Survey Research Associates study of suburban attitudes, “goes right through the suburbs.”

    The connection between suburbs and political victory should have been clear by now. Middle- and working-class suburbanites keyed the surprising election win of Republican Sen. Scott Brown in Massachusetts in January. Suburban voters were also crucial to the 2009 Republican gubernatorial victories in Virginia and New Jersey, two key swing states.

    Nationally, suburban approval for the Democrats has dropped to 39 percent this year, from 48 percent two years ago. Disapproval for President Barack Obama is also high — nearly 48 percent of suburbanites disapprove, compared to only 35 percent of urbanites. Even Obama’s strong support among minority suburbanites, a fast-growing group, has declined substantially.

    Many suburban voters, notes Lawrence Levy, executive director of the National Center for Suburban Studies at Hofstra University, appear to be undergoing “buyer’s remorse” for backing Obama and the Democrats last time around .

    Much of the suburban distress, of course, stems from the still perilous state of the economy. Obama’s mix of fiscal and monetary policies has provided much succor to Wall Street, where stock prices have soared 30 percent, and to big corporations, whose profits have risen by 42 percent. This has been great for Manhattan plutocrats — but not particularly helpful for the suburban middle class.

    Indeed the indicators most important to suburbanites – private sector employment, weekly earnings, home prices and disposable income – have all stagnated or even fallen since Obama took office. Fifty-three percent of suburban residents, according to the Princeton study, described their financial situation as “bad.” The vast majority have either lost their job or know someone who has lost theirs. Almost 40 percent have either lost their home or know someone who did – up from 27 percent in 2008.

    Given the stubbornness of this recession, neither the current administration or Congress gets credit for improving conditions. Barely 10 percent of suburbanites polled think the stimulus helped, one-third thought it hurt and the rest said it made little difference.

    But there may be other, perhaps more nuanced, reasons for the administration’s suburban disconnect. Many of the administration’s most high-profile initiatives have tended to reflect the views of urban interests – roughly 20 percent of the population – rather than suburban ones.

    When the president visits suburban backyards, it sometimes seems like a visit from a “president from another planet.” After all, as a young man, Obama told The Associated Press: “I’m not interested in the suburbs. The suburbs bore me.”

    More recently, Obama made clear that he is more interested in containing suburbia than enhancing it. In Florida last February, the president declared, “the days of building sprawl” are “over.”

    Much of the Obama policy agenda – from mass transit and high-speed rail to support for “smart growth” policies – appeals to city planners and urbanistas. Transportation Secretary Ray LaHood has spoken openly of “coercing” Americans out their cars and the Department of Housing and Urban Development is handing out grants to regions which support densification strategies that amount to forced urbanization of suburbs.

    This is a problem since the vast majority of Americans – consistently more than 80 percent – do not prefer to live in dense big cities. Most want a house rather than being forced to live in an apartment. And for all but a handful, a car, not a bus or train, remains not only the preferred way to get to work, but often the only feasible means to get work — mostly in the suburbs.

    If the Democrats want to mount an electoral comeback in suburbia, they need to take these realities into account . There are just not enough votes in core cities, upscale close-in suburbs or college towns to knit together a majority.

    Recovering suburbia s is not impossible for Democrats. Obama himself proved this in 2008, by essentially tying for the suburban vote — a remarkable achievement. Bill Clinton won in 1992 and especially 1996 by competing well in suburbs and exurbs. In the last two election cycles, the shift of suburbanites to the Democrats keyed the party’s steady gains in the Congress – accounting for, according to GOP sources, as many as 24 seats in the last two congressional elections.

    Most important, suburbanite identification with the Republican Party has continued to erode over the past two years, according to the Princeton survey. Instead the big winners have been independents, who have grown to 36 percent from 30 percent of the suburban electorate.

    These voters, for the most part, also tend to be less strident in their cultural views than either secular urbanites or rural evangelicals. More than one in five suburbanites is an ethnic minority — which could also help the Democrats.

    But to win even these suburban voters, the Democrats must offer solutions to suburbanites that go beyond devising their forced conversion to dense urbanity. They could refocus their efforts on climate change to suburbs-friendly strategies like telecommuting — perhaps the cheapest, quickest and most socially acceptable way to cut down on greenhouse gas emissions.

    Outside of greater New York, which has half the nation’s transit users, there are already about as many telecommuters as transit riders. Why not work to expand this phenomena, so well suited to the vast majority of the country?

    These suburb friendly approaches should be examined as the Democrats reflect on what many expect to be midterm electoral setbacks. They can only compete successfully on a national basis by jettisoning their apparent disdain toward the aspirations of suburban homeowners and begin treating them with respect.

    This article originally appeared at Politico.

    Joel Kotkin is executive editor of NewGeography.com and is a distinguished presidential fellow in urban futures at Chapman University. He is author of The City: A Global History. His newest book is The Next Hundred Million: America in 2050, released in February, 2010.

    Photo by Caesar Sebastian

  • Portland’s Runaway Debt Train

    Tri-Met, the operator of Portland’s (Oregon) bus and light rail system has been in the news lately, and in less than auspicious ways. For decades, the Portland area’s media – as well as much of the national press – has been filled with stories about the national model that Tri-Met has created, especially with its five light rail lines.

    The reality is less impressive. After spending an extra $5 billion over the past quarter century, public transit’s share of work trip travel in Portland is less than it was before. Moreover, the Portland has now become the 38th of the major metropolitan areas (over 1,000,000 population) in which more people work at home (such as telecommuting) than ride transit to work.

    Tri-Met’s more recent notoriety also reveals some serious concerns about financial management . Auditors recently finished their annual report, and it indicates that that Tri-Met has run up some rather large bills that it may be hard-pressed to pay.

    Unfunded Pension Liabilities: Unfunded liabilities on Tri-met’s employee pension funds have grown to more than $260 million. This deficit has developed because Tri-Met can not meet its obligation to pay into the pension funds on a current basis. Indeed, at the rate Tri-Met paid the pension funds for fiscal year 2010 (ended June 30), they would be more than eight years delinquent. Overall, the pension funds are nearly 50 percent under funded.

    Other Post-Employee Benefits: “Other Post-Employee Benefits” (OPEB), made up principally of retiree health care, pose a much bigger problem. As of the end of the fiscal year, the unfunded liability for these benefits was $817 million, up $185 million in just one year. Underfunding is an even greater problem. The retiree benefits are 100 percent under funded. Tri-Met has simply put no money aside for these benefits. Tri-Met has achieved world class status in underfunding its OPEB. The Los Angeles MTA, which carries nearly five times as much travel volume as Tri-Met had unfunded OPEB liabilities of only $730 million (still a huge figure) in 2009, which is the last data available.

    When challenged on the huge unfunded liability and its growth, Tri-Met General Manager Neil McFarlane responded to KATU-TV: “That’s adding apples, oranges and grapefruits together to get a completely unreasonable number.” One wonders what kind of complications the chief executive office of a publicly traded Fortune 500 company would face for similarly dismissing inconvenient data in its annual report (whether from the Securities and Exchange Commission, the board of directors or the stockholders).

    The auditor, Moss-Adams, LLP appended a standard opinion, to the effect that “… the financial statements … present fairly, in all material respects, the financial position of the District as of June 30, 2010…” At another point the auditors note their obligation to perform the audit to “obtain reasonable assurance about whether the financial statements are free of material misstatement.” As far as McFarlane is concerned, there may be some disagreement on whether the financial statements are “free of material misstatement, “given that they include a “completely unreasonable number.”

    A Train of Debt: Other Tri-Met woes come from its frequent bonds issues, which to date have been approved with little oppostion. The present bonded indebtedness is more than $250 million. The agency is asking the electorate for approval of another $125 million in bonds at the November 2 election. The Oregonian, which has been a friend to nearly everything Tri-Met has done, is recommending a “no” vote on the bonds, pointing out that they would not be necessary if Tri-Met had saved sufficiently for vehicle replacement. Further, Tri-Met is searching hard for more money to fund a deficit in its proposed light rail line to suburban Milwaukie in Clackamas County, which seems a questionable project given the agency’s inability to keep fares under control and maintain service levels.

    Bloated Benefits: John Charles, President of the Cascade Policy Institute raised eyebrows when he noted that Tri-Met’s employee benefits expense is by far the highest in the nation. Charles looked at 20 large transit agencies and found that employee benefits were equal to 152 percent of the wage bill, approaching double that of the next highest, San Francisco’s Bay Area Rapid Transit District and Washington’s Metropolitan Transit Authority. With their above 80 percent employer-paid benefits ratios, albeit lower than Tri-Met’s 152 percent, these agencies have nothing to be proud of. In the private sector, employer-paid benefits tend to be less than 25 percent of wages. Tri-Met’s 152 percent is six times that.

    Bloated Compensation: With a benefits ratio of 152 percent, payroll expense per employee is a stratospheric $115,000 annually (assumes the 2008 staffing ratio, later data not identified). In contrast, the average private sector employee in the Portland metropolitan area is compensated at approximately $55,000 annually, which includes wages and a 22 percent extra for benefits (Figure 1).

    Employees Ahead of Customers: Tri-Met implemented a fare increase in September and reduced bus service by 5.8 percent and light rail service by 3.5 percent. In the last 10 years, the basic bus fare has risen 71 percent, well above the 27 percent inflation rate (Figure 2). The fare increases and service cuts are imposing substantial hardship on many Tri-Met riders, who have limited incomes and no access to cars. The above inflationary fare increases represent a financial management failure of fundamental proportions.

    Yet while it was raising fares, Tri-Met also increased union employee compensation by three percent and covered increases of 7.5 percent to 22.5 percent on two employee health care programs. Tri-Met has admitted that these increases were not legal obligations (could this be a gift of public funds?). The cost of the non-obligatory wage increase was more than double the amount Tri-Met expects to raise from the September fare increase. Some discontinued service could have been financed with the rest of the wage increase money and the non-obligatory health care premium increases.

    Rising Costs: The question for Portland and Tri-Met remains whether this financial house of cards is sustainable. Operating and capital costs have, not surprisingly, skyrocketed. In fiscal year 2010, it is estimated that costs per passenger mile rose to more than $1.35. This is a full 40 percent above the the national transit average. This is more than five times the per passenger mile – full cost of cars and sport utility vehicles including all user costs and the portion of road expenditures (principally local streets) paid for by taxes – of less than $0.25.

    Fiscal Imprudence: Past and Future: There is some too-little, too-late good news for riders. Tri-Met has told the union that it will not cover health care benefits increases in 2011, nor will there be another non-obligatory wage increase. In its editorial opposing approval of the bond issue The Oregonian spoke of “past fiscal imprudence.” In appears that the mecca of transit is becoming less a role model and more a cautionary tale.

    Wendell Cox is a Visiting Professor, Conservatoire National des Arts et Metiers, Paris and the author of “War on the Dream: How Anti-Sprawl Policy Threatens the Quality of Life

    Photo: Mount Hood in exurban Portland (by author)

  • A Price on Carbon: the New Greenmail

    Hidden from view during the Australian election, a carbon price is back on the political agenda. This comes as no surprise. Anyone following the debate, however, will see that it has nothing to do with the environment. For some time we have been urged to “act now”, but the grounds keep shifting and changing. Early on it was the drought. Then the Great Barrier Reef. After that the Bali Conference. Then the election of Barack Obama. Next came the Copenhagen Conference. Then being “left behind” in clean technology. Now, apparently, “inaction will cost more in the end”. All have come and gone – including the drought which was supposed to be with us forever.

    Even so, we are assured that a price on carbon is “inevitable”.

    The frantic search for a rationale is driven by the plain fact that there is no environmental reason for Australia to have a carbon price. In tandem with efforts to manufacture urgency, there has been an equally devious campaign to misrepresent the process of climate change, or at least the IPCC’s “consensus” version. Crucial has been the cynical manipulation of words like “pollution” and “clean”. “Carbon pollution” is a scientifically absurd term designed to distort the basic issue. If the “consensus” science is right, the problem is with the concentrations of carbon dioxide, not the natural, clean, life-giving gas itself. Most of the public associate “pollution” with “dirty” emissions such as exhaust fumes and particulate matter. By definition, reducing such pollution is good. Many, if not most, still believe this is what climate action is about, thanks to obscurantist Greens and others. In the same way, “clean” energy is seen as the antidote to “dirty” or “polluting” gases. Who can be against cleanliness? Derivative terms like “the big polluters” are also deceptive.

    Greens, activists and others with a stake in climate action live in mortal dread of the public grasping the truth. Since the concentrations are the issue, rather than carbon dioxide as such, Australia can do nothing about climate change. Our share of global emissions is too small. Nor do the world’s highest emitters show any sign of caring about what we do.

    No Australian Prime Minister did, or could have done, more to push climate onto the world’s agenda than Kevin Rudd. Asked about the Copenhagen fiasco in the dying days of his prime ministership, Rudd delivered this famous outburst: “There was no government in the world like the Australian Government which threw its every energy at bringing about a deal, a global deal, on climate change. Penny Wong and I sat up for three days and three nights with 20 leaders from around the world to try and frame a global agreement.” The UN assigned Rudd a special role drafting the text of the prospective protocol. Ultimately, he was rebuffed by large and small emitters alike. The face-saving accord was cobbled together without him.

    Australia can’t combat climate change directly by reducing its own emissions, or indirectly by encouraging larger emitters to reduce theirs. If we lack the power to prevent adverse climate effects, should they eventuate, we can’t avoid any higher costs of delayed action. Forget the constant bleating about China “doing its part.” Now the world’s largest emitter, China’s official policy is to reduce the “carbon intensity” of its economy (the carbon emitted per unit of GDP), not to cut emissions. This means emissions will continue to rise, although (possibly) at a diminishing rate. The point is this “action” is way short of what the IPCC considers necessary to make a difference. Greens keep asking the wrong question. It’s not whether China does “something” that matters, but whether that something is relevant. India does even less. As for the second largest emitter, opinion polls suggest a carbon price will remain dead in the United States after the November mid-term elections.

    So why must Australia have a carbon price? One thing is for sure: it has nothing to do with climate. In his early interviews as Minister for Climate Change, Greg Combet referred to it, repeatedly, as “a very important economic reform”. Calling it an environmental measure would raise too many awkward questions. Certainly, a carbon price has serious economic impacts, but gracing it with the label “economic reform” is disingenuous. The word “reform” connotes improvement. Economic reform is designed to spur growth by improving productivity and efficiency. In contrast, a carbon price damages productivity, by raising cost inputs, and hampers efficient resource allocation. It isn’t economic reform. It’s an environmental measure, but utterly futile.

    Climate activists were elated when Marius Kloppers, the boss of BHP Billiton, recently declared that a global carbon price is inevitable, so Australia should get in early. His grounds for this belief are a mystery. All the evidence suggests that a global price on carbon will be as elusive as world peace. He would have been on firmer ground to restrict his prediction to Australia. Still, environmental factors were far from Kloppers’s mind. As the arguments for a carbon price fall in succession, one lingers on. Endless speculation is undermining investor confidence, so the argument runs, and producing uncertainty in industries with long investment lead times, like the capital-intensive energy industry. This can only be ended with the swift introduction of a carbon price. Of course the argument is entirely circular. The activists, politicians and journalists who push this line are themselves instrumental in generating the speculation, uncertainty and paralysis, and for obvious reasons.

    Back in the 1980s, “greenmail”, an amalgam of blackmail and greenback, referred to the practice of buying enough shares in a company to threaten a takeover, thereby forcing the company to buy the shares back at a premium. As the practise and word have since faded away, perhaps it’s time to revive the term “greenmail” and invest it with new meaning. Greenmail occurs when officials and activists with media power disrupt stability and certainty in a particular industry, maintaining pressure and an air of crisis, to intimidate business leaders holding out against some senseless green measure.

    If Australia does end up with a carbon price, it will be due to greenmail rather than any rational consideration.

    This article first appeared at The New City Journal.

    Photo by Amit (Sydney)

  • Living In Denial About Transportation Funding

    The reaction of various advocacy groups to President Obama’s recent call for a $50 billion stimulus spending plan for transportation infrastructure was predictable. They applauded the President’s initiative and thought that Congress should promptly approve the spending request. The benefits of investing in infrastructure are undisputable and the need for funds is urgent and compelling, they (or their press releases) proclaimed.

    But convincing the next Congress of the need to act, whether to fund the infrastructure “down payment” of $50 billion or to authorize a proposed $500 billion multi-year surface transportation program, will not be easy. Most congressional lawmakers do not perceive infrastructure as an urgent priority. They see no signs of a popular outcry about the stalled transportation reauthorization, nor do they perceive a groundswell of grassroots support for massive transportation investments.

    Indeed, what the lawmakers see is just the opposite. They witness New Jersey voters strongly approving Governor Chris Christie’s decision to cancel work on the long-planned rail tunnel under the Hudson River because, says the Governor, “the state simply doesn’t have the money” to pay for overruns in the potential $9-14 billion project. Mr. Christie, no doubt, has in mind the experience of Boston’s Big Dig which was projected in 1982 to cost $2.8 billion and ended up costing $15 billion.

    The lawmakers also see Republican candidates for governor in California (Meg Whitman), Florida (Rick Scott), Ohio (John Kasich) and Wisconsin (Scott Walker) pledging to cancel high-speed rail projects in their states if elected — and running ahead of their Democratic opponents who unanimously support President Obama’s $8 billion high-speed rail initiative. They see the public greeting with a yawn a bold and visionary Amtrak proposal to link Boston and Washington with a dedicated high-speed rail line. They read in a much noticed Sunday Times Magazine article “Education of a President,” (October 12) that the President himself thinks “there’s no such thing as ‘shovel-ready projects’ when it comes to public works.” And they hear an Administration unable to explain how the $50 billion infrastructure initiative will be paid for. When asked, a top administration official could only lamely reply “Stay tuned, we’ll let you know.”

    More evidence of public reluctance to spend on infrastructure comes from the findings of a new October 2010 survey by the Pew Center on the States and the Public Institute of California titled “Facing the Facts: Public Attitudes and Fiscal Realities in Five Stressed States.” By a large margin, respondents in five states (California, Arizona, Florida, Illinois and New York) showed a strong unwillingness to support additional transportation funding and offered to put transportation on the chopping block when asked which of their state’s biggest expenses they would least protect from budget cuts.

    It may be impolitic to suggest it, but dire warnings about the sorry state of the nation’s infrastructure seem to come largely from organized interests — stakeholders and advocacy groups. That is not to say that the nation’s transportation infrastructure has not been neglected or that America does not need better roads and transit systems. But rightly or wrongly, congressional lawmakers often discount cries about “crumbling infrastructure” as self-serving demands for more government money, often for projects that yield small economic return.

    Moreover, many lawmakers come from rural districts that experience little traffic congestion, whose roads are well maintained and which never hope to benefit from high-speed rail service. Their reluctance to spend more money on public works also has been fueled by what they see as disappointing results from the stimulus initiative. As Rep. John Mica (R-FL), ranking member of the House Transportation and Infrastructure Committee and potential future T&I Committee chairman in the 112th Congress likes to point out, more than 60 percent of the stimulus infrastructure dollars still remain unspent, while unemployment in the construction industries remains high. All this adds weight to the legislative reluctance to tackle an ambitious infrastructure spending bill any time soon.

    As one of our colleagues, a sincere and lifelong transportation advocate, put it, “the transportation community is mostly talking to itself and living in denial about the changing political mood.” That mood—in the nation at large as well as in the next Congress— is unmistakably becoming more conservative and skeptical of big government. An overwhelming 70 percent of Americans think the government does not spend taxpayers’ money wisely, according to a recent Rasmussen poll. Newly elected members of Congress will be marching to the drum of fiscal discipline and looking for ways to curb out-of-control spending, a GOP aide told us. Congress will be closely questioning costly new federal initiatives no matter how well intentioned, he added. The expansive federal-aid surface transportation program as we have known it in the past may no longer be thought politically acceptable or fiscally affordable.

    And who knows, the new mood of fiscal restraint may even infect the White House. As one senior White House adviser, quoted in the Sunday Times Magazine story, put it, “there’s going to be very little incentive for big things over the next two years unless there’s some sort of crisis.” And we doubt that by this he meant “infrastructure crisis.”

    Ken Orski has worked professionally in the field of transportation for over 30 years.

    Photo by woodleywonderworks

  • Who’s Racist Now? Europe’s Increasing Intolerance

    With the rising tide of terrorist threats across Europe, one can somewhat understandably expect a   surge in Islamophobia across the West. Yet in a contest to see which can be more racist, one would be safer to bet on Europe than on the traditional bogeyman, the United States.

    One clear indicator of how flummoxed Europeans have become about diversity were the remarks last week by German Chancellor Angela Merkel saying that multi-culturalism has “totally failed” in her country, the richest and theoretically  most capable of absorbing immigrants. “We feel tied to Christian values,” the Chancellor said. “Those who don’t accept them don’t have a place here.”

    One can appreciate Merkel’s candor but it does say something the limitations about the continent’s ability, and even willingness, to absorb immigrants. It’s quite a change from the generations-old tendency among Europeans, particularly on the left, to denigrate America as a kind of hot bed for racism.  Yet even before the latest report of potential terrorist attacks in several western European cities, the center of Islamophobia – and related ethnic hatreds – has been shifting inexorably to the European continent.

    Of course, America has always had its bigots, and still does. And of course, Islamists who threaten or commit violence need to be arrested and thrown behind bars. But, to date, neither major political party has been able to make openly white-supremacist politics a successful leading platform. After all, what was the last time anyone took Pat Buchanan , who has made comments similar to those of Merkel, seriously? Despite the brouhaha over the Arizona anti-illegal alien law, only 5% of Americans consider immigration the nation’s most pressing issue, according to a September Gallup poll.

    The situation in Europe is quite different. Openly racist, anti-immigrant and Islamophobic groupings are on the rise, and they are wreaking havoc on once subdued European politics. Traditional mainstream parties are declining, and the new racist parties can be seen in broad daylight in Austria, Switzerland, Denmark, Sweden and the Netherlands, where populist firebrand Geert Wilders has suggested banning the Koran. In Italy the anti-immigrant Northern League is already hugely powerful.

    It is true that as many Europeans as Americans–about half–think immigration is bad for their countries.  The big difference is what Europeans are willing to do about it. Just consider French President Nicholas Sarkozy’s farcical effort this fall to expel the hapless Roma.

    Yet for most Europeans the big issue is not purse-snatching gypsies but fear and loathing toward the expanding presence of Muslims–who are at least three times as numerous in the E.U. as in the U.S.  Over half of Spaniards and Germans, according to Pew, hold negative views of Muslims. So do roughly 40% of the French. In contrast, only 23% of Americans share this sentiment.

    More disturbing, Europe is actually putting these ethnic hostilities into law. An early sign came this winter, when the usually phlegmatic  Swiss voted to prohibit the building of new minarets. More recently a ban on burqas – the admittedly unattractive female body suits favored by some orthodox Muslims – passed in France, home to Europe’s largest Muslim community. The same measure is now being considered in Spain.

    These actions reflect a broad, and deepening, stream of European public opinion. A recent Pew survey found that over 80% of the French support banning the burqa, as do over 70% of Germans and a large majority of Spaniards and British.

    In contrast, nearly two-thirds of Americans find the burqa ban distasteful. Burqas don’t exactly stir admiring glances in the shopping mall, but few Amercians think we need to ban them. The basic ideal of “don’t tread on me” means “don’t tread on them” as well – at least until they start blowing themselves up at Wal-mart.

    This nuance escapes some of our own knee-jerk racial obsessives, like the Atlanta Journal Constitution’s Cynthia Tucker, who equates opposition to a mosque at Ground Zero as proof of a “new McCarthyism”  aimed against Muslims. But you don’t have to be a bigot to have second thoughts about erecting a mosque at the very spot where innocents were slaughtered by radical Islamists.

    Critical here are profound differences between the U.S. and Europe  in  the role played by ethnicity, race and religion. On the continent national culture is precisely that — the product of a long history of a particular ethnic group. Small minorities, such as Jews in Holland or Armenians in France, are tolerated but expected to submerge their ethnic identities. France has many artists and writers who may be Jewish, but you don’t see many French Woody Allens or Larry Davids who exploit their otherness to help define the national culture.

    Muslim attitudes in Europe are not exactly helpful either.  European Muslims often seem more interested in breaking the national mold than adding to its contours.  More than 80% of British Muslims, for example, identify themselves as Muslims first before being British. This is true of nearly 70% of Muslims in Spain or Germany. Similarly, up to 40% of Britain’s Islamic population believe that terrorist attacks on both Americans and their fellow Britons are justified.

    This alienation also reflects an appalling social and economic reality. In European countries immigrants can receive welfare more easily than join the workforce, and their job prospects are confined by education levels that lag those of immigrants in the United States, Canada and Australia. In France unemployment among immigrants–particularly those from Muslim countries–is often at least twice that of the native born; in Britain Muslims are far more likely to be out of the workforce than either Christians or Hindus.

    Partly due to a less generous welfare state, American immigrant workers with lower educations have, for the most part, been more economically active than their nonimmigrant counterparts.  The contrast is even more telling among Muslim immigrants. In America most Muslims are comfortably middle class, with income and education levels above the national average. They are more likely to be satisfied with the state of the country, their own community and their prospects for success than are other Americans—even in the face of the reaction to 9-ll.

    More important still, more than half of Muslims identify themselves as Americans first, a far higher percentage than in the various countries of Western Europe.   More than four in five are registered to vote, a sure sign of civic involvement. Almost three-quarters, according to a Pew study, say they have never been discriminated against–something that is definitely not the case in Europe where a majority, according to Pew, complain of discrimination.

    Over time, these differences between Europe and America may become even more pronounced. America is becoming increasingly diverse, but it is also growing demographically, and Muslims make up a very small part of that. There’s little fear in Anerica of the kind  of  Muslim envelopment that appears to threaten a  rapidly aging, and soon to be depopulating, Europe.

    Of course the U.S. still has its bigoted Islamophobes, just as it has its own small cadre of vicious Islamists. One law of history appears to be that morons will be morons.   But America’s culture seems strong enough to resist the anti-immigrant hysteria emerging throughout Europe. This is one case where  la difference between America and Europe may prove  a very good thing indeed.

    This article originally appeared at Forbes.com.

    Joel Kotkin is executive editor of NewGeography.com and is a distinguished presidential fellow in urban futures at Chapman University. He is author of The City: A Global History. His newest book is The Next Hundred Million: America in 2050, released in February, 2010.

    Photo by World Economic Forum

  • Chicago’s Eroding Competitive Performance (Chicago vs. New York)

    A lot of my thinking on Chicago has been shaped by an overarching view of its performance. Believe it or not, I used to be a huge Chicago cheerleader. I don’t think there’s any doubt that during the 1990’s, Chicago rediscovered its mojo and was really tearing up the charts of performance for big cities. But something changed in the mid-2000’s. I date it to the opening of Millennium Park. Millennium Park was a huge home run for the city, and obviously a key positive part of Mayor Daley’s legacy, no matter what the cost over runs. It added hugely to reconnecting the Loop to the lakefront park system, created a huge tourist attraction, and probably more than any other single factor sparked a residential boom in the Loop itself.

    But Millennium Park was also a sort of high water mark for the city. While I can name a lot of great things the city did before then, after that, there have arguably been more negatives than positives, ranging from a failed Olympic bid that monopolized civic attention for far too long, to a white elephant of a partially completed $300M train station under Block 37 (which hopefully will some day look like a wise move in retrospect), to a disastrous parking meter lease. What’s more, Chicago started hemorrhaging jobs and its economic performance cratered. I think anyone who looked at the situation honestly would have to admit a good chunk of the wind has gone out of the city’s sails. That’s not to say Chicago is doomed. It has fantastic strengths and resources. But it is trending the wrong direction.

    I think this is massively underdiscussed locally, both because the city is imbued with an admittedly not uncommon booster club society culture, and because America’s struggles generally of late make it seem like Chicago is just part of a macrotrend. It is, but it’s more than that.

    I’m going to illustrate Chicago’s reversal today by comparing it to New York City, looking at various key civic performance data. I’ll try to compare both metro and city where possible (all data is metro unless explicitly labeled as city), and to back to 1990 where possible, though for many items I could only conveniently get data for the past decade. You’ll see that where once Chicago was crushing New York, now the situation has reversed itself, erasing 20 years of relative gains for Chicago.

    New York’s Quality of Life Program

    While reading this I want you to keep in mind my recent post on New York’s quality of life agenda. I said I would demonstrate how that is paying dividends, and this post shows that too. Though perhaps I can’t claim causation, think about the correlation at least. In the 90’s and early 2000’s it was Chicago who was the leader in transportation and urban space, with its streetscape program and median planters, the wrought iron fence program, one of the first large scale bike lane deployments, the McDonald’s cycle center at Millennium Park, and more. Now Chicago has stagnated while New York powers ahead on all those items I’ve written about before. It’s hard for people to make the mental leap from stagnant transport planning and banal public place design to economic performance. So hopefully this helps make the picture clear.

    Population Growth

    Here’s a chart from the last decade. For these charts, I am sometimes inconsistent on my use of percentages as multiplied by 100 or not. I did not have time to make them consistent, but keep in mind that any 0.XX value should be multiplied by 100 unless otherwise noted.


    Population Growth – July 1, 2000-July 1, 2009

    Source: Census Bureau Population Estimates Program

    This one is a mixed result. Both regions have anemic growth, but Chicago wins on the metro measure while losing on the city measure. Despite the city of Chicago’s massive condo building boom, its population has been stagnant.

    Jobs

    Here is where it starts getting ugly.


    Source: BLS Current Employment Statistics

    You see Chicago jumping out to a big lead in job in the 90’s, only to see that relative performance gain almost completely erased by today. A year by year view shows this in action.

    This may be the scariest one of the bunch. I think back to 1992 when I first started work out of college. My employer was still hiring aggressively in Chicago even though it was during a recession, while one of the first rumors I heard when I started was about an east cost layoff. This chart backs that anecdote up. Now the shoe is on the other foot.

    If you pull the monthlies for 2010 to date, the situation is continuing on this trend.

    Unemployment Rate

    Unsurprisingly, we see the same trend at work in the unemployment rate, where New York was far higher than Chicago in the early to mid-90’s, but is now consistently below it.


    Source: BLS Local Area Unemployment Statistics

    Gross Domestic Product

    GDP is a basic measure of economic output. The data is only available at the MSA level for a short term period at present, and there’s some debate over how accurate narrow geographic parsing of this variable is, but the same trend is in evidence.


    Source: BEA Regional Economic Accounts

    Please keep in mind that for this and most of the other charts, I rendered them as percentage type comparisons to make the data comparable between cities. If you looked at the actual underlying values, New York’s GDP per capita is already far higher than Chicago’s – $57,097 vs. $45,463. The chart above only measures the growth in the spread between them.

    Personal and Household Income

    Again, not surprisingly, the trend flows through to per capita income:


    Source: BEA Regional Economic Accounts

    And the year by year view of the same data:

    One might argue that this is influenced by the finance bubble that particularly blessed New York. And possibly so. So let’s take a look at an alternate data point, median household income from the Census Bureau. As a median value, this should be less likely to reflect huge gains at the high end. Unfortunately, the Census 2000 data for MSAs is based on the old definition, and it wasn’t a straightforward matter to recalculate this to current definitions, so here is city only performance for the last decade:


    Source: Census 2000 and ACS 2009

    Doesn’t matter – same result.

    Educational Attainment

    I’ll round out with a couple of additional factors often viewed as important. First, the increase in percentage of adults with a college degree. Note that this is a percentage point change (difference), not a percentage change in the total value.


    Source: Census 2000 and ACS 2009

    Back to a mixed result, with New York winning on the regional basis, but Chicago doing better in the city.

    Commuting

    And lastly, a couple of commuting stats. First, public transportation mode share for commuting. Note that this again is a percentage point change, not a percent change.


    Source: Census 2000 and ACS 2009

    There’s debate to be sure on the value of public transit, but clearly New York has outperformed on getting people onto buses and trains. How has that changed commute time? Let’s take a look:

    Source: Census 2000 and ACS 2009

    The city of Chicago had a much bigger drop in commute times. I personally wouldn’t be too excited about this since since lower commute times nationally appear to be driven (so to speak) by the poor economy rather than transport efficiency. Whatever the case, New York performed slightly better on a regional basis.

    Before concluding I should note that the ACS survey has a margin of error associated with it, which should be taken into account before reading too much into changes in values derived from it. I’m only reporting the headline number.

    Conclusion

    While Chicago had a couple of bright spots, it’s pretty clear that not only is New York ahead of Chicago, something that is to be expected, but it is pulling away. It would be easy to say that New York is one of a kind and that nobody can compete with it. Well, it is one of a kind, and while it isn’t a direct competition, Chicago was doing far better than New York as recently as 15 years ago. So it can be done and indeed was being done.

    The reality is that Chicago is falling behind versus traditional peer cities, to say nothing of emerging global cities around the planet. Perhaps it’s not a direct competition, but if you aren’t creating jobs, economic output, and wealth, you aren’t going to be able to make the investments to stay relevant. One reason New York has been doing what it has been on the public space and transportation front and Chicago has not is that New York is in a lot better shape financially. We are watching the cultural institutions of Detroit get dismantled before our eyes as that city can no longer afford them. Clearly, Chicago is no Detroit and never will be. But that can serve as a sort of cautionary tale of what happens when the wealth generating capacity of your city erodes. Chicago is going to find it tougher and tougher to keep up unless it figures out a way to restore the regional economic engine to good working order. That, more than anything, is the key challenge not just for the next mayor, but for all the city and regional leadership.

    This piece originally ran at The Urbanophile.

    Aaron M. Renn is an independent writer on urban affairs based in the Midwest. His writings appear at The Urbanophile.

    Photo by Stuck in Customs

  • The Future of a Hub: Can Singapore Stay On Top of the Game?

    Viewed from a broad, historical perspective, Singapore’s position as a hub is far from inevitable or unassailable. History shows that hubs come and go. Malacca used to be the centre of the spice trade in Southeast Asia. Venice was the centre of East-West trade throughout the Middle Ages. Rangoon, now Yangon, was the aviation hub of Southeast Asia before 1962.

    Is Singapore in danger of also ceding its hub status as a result of forces beyond our control? The case of Malacca is instructive. By the 16th Century, the city on the Malay peninsula had become the most important port in Southeast Asia. It served as the bridge between the spice-producing islands of Southeast Asia and the markets in Europe and Asia. Malacca became so integral to East-West trade that a Portuguese traveller and writer, Tome Pires, proclaimed that “who is Lord of Malacca has his hand on the throat of Venice”.

    Malacca was a forerunner of the free port that Singapore was to become. It welcomed foreign merchants as well as their trade. But after the Portuguese conquest of the city in 1511, it declined as the spice hub of the region, as the Portuguese – and later the Dutch – sought to achieve monopolistic control of the spice trade. Fierce competition from neighbouring ports such as Johor meant that traders had other options. The city soon declined and today is best known as a tourist attraction.

    Half a world away from Malacca, Venice emerged as the European hub of the global trading network. For nine hundred years, Venice was a flourishing centre of trade between Europe and Asia, especially in silk, grain and spices. Geography played an important role in Venice’s rise. Its relative isolation from the mainland insulated it from the confusing and often deadly politics of the Italian states.

    Venice concentrated its resources and energies on advancing its commercial interests in distant regions. By the 13th century, Venice was the second largest city in Europe after Paris, and its most prosperous. It linked the main trade routes between Europe and Asia.

    But eventually Venice also declined. The fall of Constantinople to the Ottomans in 1453 disrupted the traditional overland trade route from Europe to Asia, forcing Europe to find alternative trade routes to the East. At the turn of the 16th century, Portugal’s discovery of a sea route to the East Indies undermined Venice’s monopoly. New ports emerged to become Europe’s main intermediaries in the trade with the East, striking at the very foundation of Venice’s wealth. With its centrality as a commercial hub broken, Venice declined and eventually fell to the Austrians in 1797.

    The Theory of Hubs

    Malacca and Venice are both examples of hubs in that first flourished and then declined as trade routes and technologies changed. Simply defined, hubs are the exceptionally well-linked nodes in a network. Malacca and Venice exploited their commanding positions in the main trade networks of their times. They consolidated their hub positions by astute diplomacy, openness to talent from elsewhere, and broadening the range of their activities beyond just trade.

    Throughout history, hubs have been the main engines of economic growth and development. Network theory provides us with insights to explain why hubs acquire wealth more easily than other nodes in a network. Today, as in the past, the world’s economic geography remains dominated by hubs which are the focal points of opportunity, growth and innovation. Firms locate where skills, capabilities and markets cluster.

    A recent study identified the existence of 40 mega-regions worldwide. They are defined as places that claim large populations, large markets, significant economic capacity, substantial innovative activity, and highly skilled talent. Many of these 40 mega-regions are formed by hub cities growing outward and into one another. Singapore is one of these hubs.

    Today, of course, air transport plays a critical role in establishing hubs. Air hubs make previously unlinked cities accessible to one another in just one or two links. Singapore is classified as a “connector” hub – it is a hub within the East Asian/Southeast Asian region, with a high number of links to cities in other regions. So in 2007, while Changi Airport was ranked 19th by the Airports Council International in terms of passenger numbers, it was ranked 6th if only international passengers are considered.

    If Singapore is a central node connecting different regions, what might undermine this position? Challenges could come from two directions. The first is competitors in the region, such as Kuala Lumpur, Bangkok and Hong Kong, as well as those from other regions, such as Dubai. Dubai is the largest aviation hub in the Middle East and is a fierce competitor for the Australia-Europe traffic. Another challenge is from long-haul flights. The same technology that allows Singapore Airlines to bypass Tokyo on flights to Los Angeles could one day allow Emirates to fly non-stop from Dubai to Sydney, and Qantas or British Airways to fly non-stop along the “kangaroo route” from London to Sydney.

    The more cities move away from the hub-and-spoke model of air transportation to point-to-point transportation, the more difficult it will be for Singapore to retain its status as an aviation hub. This is conceptually no different from Venice losing its hub status because alternative and more direct trade routes were found between markets in Europe and spice producers in the East.

    This threat underlines the importance of constantly re-inventing Singapore as a hub. It would be fatal to assume that the density of connections that we have today and the centrality that we enjoy in today’s networks – whether in air transportation, maritime, or other networks – are permanent. New technologies might create new networks with their own hubs and connectors. Whether we will continue to be a hub in the networks that emerge will depend on our capabilities, on our ability to seize early mover advantages, and on how quickly the new networks emerge.

    I think it is possible to distil five factors that determine the success and sustainability of hubs like Singapore.

    1. Establish your role early. Singapore built the first container port in the region. This gave us first-mover advantage. We exploited it, and Singapore was propelled to the front rank of global container ports.
    2. Ensure open access and maximum connectivity. Singapore under the British thrived because of its status as a free port. In contrast places like Jakarta languished under the Dutch policy of controlling and taxing trade. Being well-connected and plugged into dense networks confer far more advantage than efforts to monopolise production or to control access to resources.
    3. Capitalise on and exploit small initial advantages. The research on networks suggests that the economic development process is highly path-dependent: the choices we face today are largely shaped by the choices we made in the past and the capabilities that we have already built up. Singapore was able to become a leading petrochemicals hub because we were able to build on our early success in attracting oil refinery activities.
    4. Constantly re-invent and diversify the hub’s value proposition. In Singapore’s context, our status as a maritime hub gives us the opportunity to develop strengths in new areas that go beyond our traditional role as a port. These include ship financing, ship insurance and various ancillary activities that the shipping industry depends on. This diversification will also give us greater resilience in the face of uncertainties and rapid changes in the maritime industry.
    5. We need a strong sense of belonging. If people only see Singapore as “Hotel Singapore”, then when there is an economic downturn or other problems, they will move to where the opportunities are greater. The challenge is to maintain a core that will sustain the hub through economic cycles.

    Singapore’s continued success as a hub depends both on its connections to the world, as well as connections to its citizens wherever they may now live. Our strategic response to the limitations of our physical size must be to strengthen our hub position by boosting not only its physical connections to networks, but also in other domains – an R&D hub, an intellectual hub, and even a cultural and entertainment hub.

    To avoid the fate of Malacca or Venice, we must re-invent and re-position ourselves and stay ahead of the competition. This is the imperative that will determine our future as a city-state, as both a place and a nation.

    Peter Ho is Senior Advisor to Singapore’s Centre for Strategic Futures. Before retirement, he was the Head of Civil Service in the Singapore Government.

    Photo by Storm Crypt