The evolution of cities is a protean process–and never more so than now. With over 50% of people living in metropolitan areas there have never been so many rapidly rising urban areas–or so many declining ones.
Our list of the cities of the future does not focus on established global centers like New York, London, Paris, Hong Kong or Tokyo , which have dominated urban rankings for a generation. We have also passed over cities that have achieved prominence in the past 20 years such as Seoul, Shanghai, Singapore, Beijing, Delhi, Sydney, Toronto, Houston and Dallas-Fort Worth.
Nor does our list include the massive, largely dysfunctional megacities–Mumbai, Mexico City, Dhaka, Bangladesh–that are among planet’s most populous today. Bigger often does not mean better.
Instead, our list focuses on emerging powerhouses like Chongqing, China, (population: 9 million), which Christina Larson in Foreign Policy recently described as “the biggest city you never heard of.”
Chongqing sits in the world’s most important new region for important cities: interior China. These interior Chinese cities, notes architect Adam Mayer, offer a healthy alternative to coastal megacities such as Shanghai, Hong Kong, Shenzen and Guangzhou, which suffer from congestion, high prices and increasingly wide class disparities. China’s bold urban diversification strategy hinges both on forging new transportation links and nurturing businesses in these interior cities. For example, in Chengdu, capital of the Sichuan province, new plane, road and rail connections are tying the city to both coastal China and the rest of the world. And the city is abuzz with new construction, including an increasing concentration of high-tech firms such as Dell and Cisco.
India, although not by plan, also is experiencing a boom in once relatively obscure cities. Its rising urban centers include Bangalore (home of Infosys and Wipro), Ahmedabad (whose per-capita incomes are twice that of the rest of India) and Chennai (which has created 100,000 jobs this year). Many of India’s key industries–auto manufacturing, software and entertainment–are establishing themselves in these cities.
The growth of India and China also creates opportunity for other emerging players, particularly in Southeast Asia by creating markets for goods and services as well as investment capital. Potential hot spots include places like Hanoi, Vietnam, which is attracting greater interest from Japanese, American and European multi-national firms upset with China’s often bullying trade practices and rising costs. Malaysia’s capital Kuala Lumpur–with its rising financial sector–also displays considerable promise.
Africa also boasts many huge, rapidly growing cities, but it’s hard to identify many of these places–like Lagos, Nigeria, Luanda, Angola or Kinshasa, the Democratic Republic of the Congo–as bright prospects. One exception may well be Cape Town, the beautiful South African coastal city that shone so well during the recent World Cup.
Latin America, too, has a plethora of huge and growing cities, but it’s hard to nominate the likes of Mexico City or Sao Paulo as likely hot spots for future sustainable growth.
The best economic prospects in this region lie in more modestly sized cities like Santiago, the capital of resource-rich Chile, and even Campinas, Brazil, a growing smaller city–with 3 million residents–that lies outside the congested Sao Paolo region. This shift to smaller-scaled cities, as Michigan State’s Zachary Neal points out, has been conditioned by massive improvements in telecommunications and transportation infrastructure throughout the urban world. Today, he asserts, it is the ability to network long-distance–not girth–that makes the critical difference.
This is clear in the Middle East, where the emerging stars tend to be smaller cities. Tel Aviv, whose total metropolitan area is no larger than 3 million, has emerged as a major center for technology as well as one of the world’s premier diamond centers. The other leading candidates in the region hail from the United Arab Emirates, notably oil-rich Abu Dhabi and perhaps its now weakened neighbor, Dubai.
In North America the best urban prospects–Raleigh-Durham, N.C.; Austin, Texas; Salt Lake City; and Calgary, Canada–are far smaller than homegrown giants New York, Chicago and Los Angeles. Generally business-friendly and relatively affordable, these cities will attract many talented millennials as they start forming families in large numbers later in this decade.
Europe’s urban problem lies with stagnant or slow-growing population levels, and in the south at least, very weak economies. The only rapidly growing big city lies on the region’s periphery: Istanbul, which straddles the border between Europe and Asia and faces many of the problems common to developing-country mega-cities.
Overall, the populations of Europe’s cities are growing at barely 1%, the lowest rate of any continent. With low birthrates and growing opposition to immigration, it seems unlikely that any European city will emerge as a bigger global player in 20 years than today.
Other leading cities all over the world may also be in the early stages of fading from predominance. In the United States, according to analysis by the California Lutheran University forecast, Los Angeles and Chicago, America’s second and third cities, respectively, have fallen behind not only fast-comers like Houston and Dallas-Fort Worth, but even historically dominant New York in such key indicators as job generation and population growth.
Similarly Berlin, once seemingly poised to thrive in the post-Cold War future, has chronic high unemployment and a weak private sector, compared with Germany’s generally smaller, less unruly successful cities. The Osaka-Kobe-Kyoto area in Japan may also be set to fade a bit, due largely to the overwhelming predominance of Tokyo and the general demographic and economic decline of Dai Nippon.
Of course, none of this is set in stone. But this list provides an educated peek into which cities are best positioned to prosper and grow in our emerging era of cities.
Chengdu, China
The development of interior China, long on the back burner of national priorities, has reached the country’s western-most large city. Chengdu is abuzz with new construction, including an increasing concentration of high-tech companies, including Dell and Cisco. New plane, road and rail connections are tying the city to both coastal China and the rest of the world. With a metropolitan population of 6 million, economic factors–including lower costs–may prove critical to the capital of the Sichuan province. The business-friendly city still has a way to grow to catch up to the GDP per capita of Shanghai.
Chongqing, China
Chongqing enjoys rapidly improving transportation links with its neighbors to the west and the coastal megacities. Foreign companies like Ford, Microsoft, Hewlett Packard and Singapore-based Neptune Orient Lines are flocking to the city. The Business Times of Singapore reports that since 1998, Chongqing’s GDP has quadrupled from $21 billion to $86 billion. Last year alone, Chongqing’s GDP expanded at almost twice the rate of China as a whole. The population, according to United Nations projections, should grow from 9 million to 11 million by 2025.
Ahmedabad, India
This is the largest metropolitan region in Gujarat, perhaps the most market-oriented and business-friendly of Indian states. Gujarat’s policies helped lure away the new Tata Nano plant from West Bengal (Kolkata) to Sanand, one of Gurajat’s exurbs. One Indian academic, Sedha Menon, compares the state–which has developed infrastructure more quickly than its domestic rivals–with Singapore and parts of Malaysia. Per-capita incomes in Gujarat are more than twice the national average. India’s seventh-largest city has a population of roughly 5.7 million and is expected, according to the U.N., to grow to over 7.6 million by 2025.
Santiago, Chile
Santiago boasts a diversified economic base: mining, textile production, leather technologies and food processing. Its favorable investment climate has enticed many multinational companies; there are few restrictions on foreign investment, and transparency is extensive. Recent surveys have ranked Chile and Santiago as leading locations in Latin America in terms of competitiveness. The 2010-2011 Global Competitiveness Report ranked Chile the highest in terms of competitiveness (based on institutions, infrastructure, macroeconomic environment, education, market efficiency, financial market development, et. al).
Raleigh Durham, North Carolina
Even in hard times this low-density, wide-ranging urban area has repeatedly performed well on Forbes’ list of the best cities for jobs. The area is a magnet for technology firms fleeing the more expensive, congested and highly regulated northeast corridor. One big problem obstructing the region’s ascendancy has been air connections. But Delta recently announced a large-scale expansion of flights there from around the country. Population growth will likely be lead by educated millennials seeking affordable housing and employment opportunities. Today the region has 1.7 million residents; the State of North Carolina projects it will grow to 2.4 million by 2025.
Tel Aviv, Israel
This urban region of roughly 3 million may boast the most vibrant economy of any along the Mediterranean. Tel Aviv and its surrounding environs control the vast majority of Israel’s high-tech exports, making it what may well be the closest thing to a Silicon Valley outside East Asia or California. It also boasts a household income that is nearly 50% above the national average for Israel. But perhaps its greatest asset is its free-wheeling lifestyle: Tel Aviv combines an Israeli entrepreneurial culture with the attributes of a thriving seacoast town.
Kuala Lumpur, Malaysia
Kuala Lumpur’s prospects lie in a development strategy focused on improving its air service, road and trade infrastructure, much as occurred in previous decades in Singapore. The urban area’s population has grown to over 5.8 million, and demographer Wendell Cox projects a population of roughly 8.2 million by 2025. KL has emerged as a global Islamic financing hub and maintains close ties with the Arabian Gulf’s finance sector. Educational and health care institutions also bolster the city’s growth. Forbes lists Kuala Lumpur as one of Asia’s future financial centers.
Suzhou, China
As in the U.S., some of the fastest-growing cities in China are located close to the bigger cities. Suzhou, only 75 miles from Shanghai, seems well positioned to benefit from spillover growth from the megacity. Known as the Venice of China, with many attractive canals and vast international tourism potential, its beauty and history could help secure its aspiration to become “the world’s office.” Some reports suggests Suzhou may already be the most affluent city in China; demographer Wendell Cox estimates that per-capita income is more than three times that of interior cities like Chengdu.
Hanoi, Vietnam
Chinese, Japanese, American, Singaporean, European and Indian companies identify this fast-growing city as ripe for industrial and infrastructure growth. The population of the region has doubled since the end of the Vietnam War to almost 3 million, and the U.N. projects a population of 4.5 million by 2025. Along with Ho Chi Minh City (formerly Saigon), Hanoi is expected be one of the fastest-growing GDPs in the world. Hanoi’s GDP growth rate for the first nine months of 2010 was estimated at 10.6%, almost twice that for the same period of last year.
Chennai, India
Formerly known as Madras, this metropolitan area of 7.5 million, up from 4.7 million 20 years ago, is projected by the U.N. to approach 10 million by 2025. Located on India’s east Asian coast, the city has so far this year created over 100,000 jobs–more than any other Indian city outside of the much larger Delhi and Mumbai. Chennai’s metropolitan area is taking full advantage of India’s soaring industrial sector, particularly the booming automobile sector. Electronics, led by Dell, Nokia, Motorola, Samsung, Siemens, Sony and Foxconn, are also booming. Chennai is home to India’s second-largest entertainment industry, behind Mumbai.
Austin, Texas
Austonites tend to be smug–but they have good reason. The central Texas city ranked as the No. 1 large urban area for jobs in our last Forbes survey. Along with Raleigh-Durham, Austin is an emerging challenger for high-tech supremacy with Silicon Valley. The current area’s population is 1.7 million and is expected to grow rapidly in the coming decades. Austin owes much both to its public sector institutions (the state government and the main Campus of the University of Texas) and its expanding ranks of private companies–including foreign ones–swarming into the city’s surrounding suburban belt.
Abu Dhabi, United Arab Emirates
Oil rich Abu Dhabi is among the world’s wealthiest countries in terms of per-capita GDP, which exceeds $68,000. However, the non-oil sector is likely to grow to about 45% of the GDP in coming years. To do so, the government has started to invest its oil revenues in construction, tourism and the electricity and water industry. Abu Dhabi is also helping to keep its neighbor Dubai afloat. If Dubai, with its world class infrastructure, can make a comeback, a global city separated by 80 miles of desert Arabian Gulf coastline could arise.
Campinas, Brazil
Campinas, located around 50 miles north of São Paulo, the country’s dominant industrial center, has attracted many technology companies, including IBM, Dell, Compaq, Samsung and Texas. The city also boasts a major research and university center. Firms engaged in high-tech activities–following a global pattern–tend to cluster in relatively pleasant, affordable and efficient places. Campinas could prove a big Brazilian beneficiary of this trend.
Melbourne, Australia
Australia has resources galore and relatively few people. But which of its cities is poised to benefit most from the nation’s expanding trade with China and India? Sydney’s costs have been shooting up–particularly for housing, but Melbourne’s political class seems about to open up new land for suburban development to restore some of the area’s affordability for younger Australians. Demographer Bernard Salt has predicted that Melbourne’s population will exceed Sydney‘s in less than 20 years. Melbourne also boasts Australia’s most walkable and pleasant urban cores , a pleasant San Francisco-like climate and a European ambiance.
Bangalore, India
Many big players in tech and services–Goldman Sachs, Cisco, HP as well as India-based giants like Tata–have located operations in Bangalore. But the city also boasts home-grown tech giants Infosys and Wipro, which each have over 60,000 employees worldwide. Since 1985 Bangalore’s population has more than doubled to over 7 million and is projected by the U.N. to reach 9.5 million by 2025. In the future, maintaining Bangalore’s advantage over smaller, less congested cities could prove a challenge.
Salt Lake City, Utah
Once seen as a Mormon enclave, the greater Salt Lake urban area–with roughly 1 million people –has every sign of emerging as a major world player with a wider appeal. The church still plays a critical role, in part by financing a massive redevelopment of the city’s now rather dowdy city core. The area’s population has doubled since the early 1970s and will grow another 100,000 by 2025 to well over 1.1 million. New companies are flocking to this business-friendly region, particularly from self-imploding California. Increasing national and global connections through Delta’s hub will tie this once isolated city closer with the wider world economy.
Nanjing, China
The one-time Imperial and Republican (Nationalist) capital sits only 150 miles from Shanghai. The relative affordability of Nanjing has drawn huge construction projects to the city, which is also the capital of Jiangsi Province. The city is developing a transport hub, and huge commercial construction projects abound in the downtown area. A majority of employment is in the fast-growing service sector. The metropolitan economy grew 50% just between 2006 and 2008, and future rapid growth is likely.
Cape Town, South Africa
The second-largest city in South Africa behind Johannesburg, Cape Town made the most of the recent World Cup. The region of some 3 million boasts fast-growing communications, finance and insurance sectors. Cape Town is looking to intellectual capital, transportation assets, business costs, technology, innovation and ease of doing business as its primary assets. In 2009 Empowerdex rated Cape Town as the top-performing municipality in South Africa for service delivery. About 97% of the operational budget went to infrastructure development, ensuring that households can enjoy adequate sanitation and water access.
Calgary, Canada
You don’t have to buy the notion of a climate-change-driven northern ascendancy to see a bright future for Alberta’s premier city. Calgary is positioned well on the fringe of Canada’s largest energy belt and enjoys lower taxes and less stringent regulations than its Canadian rivals. Calgary has been hit by a slowdown in energy business, but over time demand from China, India and a slowly recovering world economy should boost this critical sector. The region is expected to be back to its familiar place on top among Canadian urban economies by next year.
The World’s Diminishing Cities: Chicago, Ill.
Great cities don’t only rise, some decline. Even with Barack Obama in the White House, Chicago is struggling with persistent job losses that, since 2000, are exceeded only by Detroit among the nation’s top 10 largest U.S. regions. The Windy City’s deficit as a percentage of spending–a remarkable 16.3 %–is now higher than Los Angeles and twice that of New York. Moreover, crime remains stubbornly high, and the widely hyped condo boom has left a legacy of uncompleted buildings, foreclosures and vacancies.
The World’s Diminishing Cities: Berlin, Germany
By all rights, Berlin should be a European boomtown: The capital of united Germany, a natural crossroads to the east and Europe’s bohemian hot spot. But it remains, as its mayor, Klaus Wowereit, famously remarked, “poor but sexy.” Berlin suffers unemployment far higher than the national average, and its gross added-value per inhabitant amounted to just over half that created by residents in the northern city of Hamburg, which has about half as many people. One-quarter of the workforce earns less than 900 euros a month, and one out of every three children lives in poverty.
The World’s Diminishing Cities: Osaka-Kobe-Kyoto, Japan
Few places possess a more glorious urban pedigree than Japan’s Kansai region. But the shift of manufacturing to China and other countries has undermined the economy of Osaka, traditionally the industrial heart of Japan. As Japan shrinks both economically and demographically, Tokyo, the world’s largest city, looms ever larger while Osaka’s role is, as one demographer put it, “fading away.” Tokyo’s population, now over 30 million, has grown to be double that of the Osaka region, and continues to outpace it. Most critical: It is to Tokyo, not Osaka, that Japan’s diminishing reserves of educated young people–and industries dependent on their talent–are headed.
This article originally appeared at Forbes.com.
Joel Kotkin is executive editor of NewGeography.com and is a distinguished presidential fellow in urban futures at Chapman University. He is author of The City: A Global History . His newest book is The Next Hundred Million: America in 2050
 , released in February, 2010.
Photo by Sarmu
The furor over a mosque in Manhattan has swirled around issues of personal freedom and collective tolerance. But very little of the discussion has focused on the pros and cons of construction of places of worship in our cities and suburbs, or on their tax status. In a country that displays high rates of worship and has a growing population, it’s to be expected that religious spaces would be on the increase. Yet, like all things that are added to the built environment, churches, synagogues, temples and even meeting halls can have a negative impact on those who live in the area. Economists term this a ‘negative externality’.
Parks are a simple analogy, in that it is nice to have somewhere to walk your dog if you live nearby, but it is not so pleasant if dogs are shipped in by their owners from other neighborhoods to use the space, especially if they have little incentive to clean up after themselves [that would be the owners, not the pets]. Places of worship are the same, insofar as it might be convenient to have a temple next door, but only if it is for a compatible religion. If not, it is just another source of traffic and noise for the neighborhood, and if it is a religion that is presently controversial, then there is even more likelihood of unhappiness.
One of the reasons that so many congregations can afford to build new spaces for themselves is that religious enterprises are not taxed. A glance at the chat rooms across the Internet suggests that this is a warm-button topic — not of major importance, but ready to become so at a moment’s notice. Those who patrol these issues have developed a rather neat logic for this tax exemption, namely, that payment of income or property taxes by religious institutions would violate the separation of church and state. Indeed, the Supreme Court seems to have fostered this logic, arguing in 1970 in Walz vs. Tax Commission of the City of New York, that a tax exemption for churches “restricts the fiscal relationship between church and state, and tends to complement and reinforce the desired separation insulating each from the other”.
Logically then, payment of taxes by religious groups should indeed be considered unconstitutional. But what if we were to separate the payment of taxes on income from the payment of property taxes? It’s reasonable enough to argue that the former should be exempt, especially if you are comfortable with the reality that plenty of corporations and many affluent individuals pay little or nothing in income tax.
However, the non-payment of property taxes is quite different, as it has a large impact on the way in which cities operate. Religious enterprises can afford to outbid their competitors when purchasing land as they buy at a discount, namely, the dollars saved on non-payment of property taxes. Put another way, they can afford to purchase marginally larger properties, as they are able to fold the putative taxes into their bids for land.
Congregations can often afford to buy prime locations at urban intersections; in the suburbs, they can afford to buy larger lots and build mega-churches with vast parking lots. The scale of these developments can be remarkable. A new LDS temple that is planned for Gilbert, Arizona will cater to tens of thousands of worshipers on a 21 acre site.
Now, I would rather that the urban fabric be maintained than be left idle, especially at present, while the construction industry is in poor shape. It makes little sense, though, to encourage market distortions. Churches can break up the land-use in a city, inserting a structure that is used intermittently among, say, office spaces for which there can be high demand. Building any kind of religious structure in Manhattan, where land can fetch $100 million per acre, serves to drive up the costs of real estate yet further. In the suburbs and exurbs, where land is of course infinitely cheaper, the distortion is less, but the impacts are potentially higher. Vast mega-churches have all the impact of a Wal-Mart but none of the tax benefits, and of course none of the jobs.
How much are we talking here in hard cash? My simplistic calculations and equally non-rigorous research suggest that there are approximately 350,000 religious spaces in the US. If we assume that each occupies 10,000 square feet [and many are five to ten times larger], then that would be approximately 80,000 acres of land on which taxes are not being paid. Clearly, few of those acres are as expensive as those in Manhattan, but even in suburban Phoenix, raw land reached $300,000 per acre before the 2008 correction. My arithmetic suggests that $20 billion of land is being used without tax payment, which would amount to tens of millions annually.
Places of worship are in general highly inefficient uses of space if you simply take into account the number of hours per week they are used. This notwithstanding, they place a burden on the public purse in terms of water and sewerage links, road maintenance, and fire and police protection—the fact that they are unoccupied may actually increase the cost of surveillance. These services, plus the opportunity costs of lost taxes, come at a moment when nearly all municipalities and most States are looking for ways to replace contracting revenues. Law professor Evelyn Brody has done a fabulous job in documenting the ways in which non-payment is hurting the public sector, and the innovative ways in which some jurisdictions are using PILOTS (payments in lieu of taxes) to make up the losses.
As we know, religion is a touchy subject. Asking congregations to pay their property taxes will be taken by many as an assault on religious freedom. But if we also look at the larger class of charitable and non-profit organizations, we find many small charities that could not and thus should not pay property taxes. Small churches, mosques and temples would be in this category. But there are also non-profit organizations that are wealthy; Harvard University should pay millions of dollars on its holdings in Boston, and the same is true of large, wealthy religious organizations with land holdings throughout the country’s urban areas.
Why single out what many regard as ‘the good guys’? The answer is that welfare subsidies distort the market, wherever and whenever they occur. That’s true of mega-churches, and it’s equally true of new shopping malls that receive tax incentives to locate in one jurisdiction rather than another. Taxes are of course anathema to many in our society, but then so is welfare. So let’s be consistent and get rid of property tax subsidies for developers and large charities, regardless. If that includes large churches, then so be it. The new revenues will be a boon for municipalities, so that they can provide services for those who need them most. Some organizations will claim they cannot pay, but even there the news is not bad: There is evidence that when land-uses change, redevelopment can have a multiplier effect. This was true of plenty of military sites, and it has been documented for churches being re-purposed in inner city redevelopment areas.
In its 1970 decision, the Supreme Court observed that “the power to tax involves the power to destroy.” Yet it is also the case that the power to provide exemptions is a powerful distortion of the ways that cities organize themselves as efficient providers of goods and services. To the extent that we can have a sensible discussion of religion or taxation, let’s explore just which interests are served by subsiding worship.
Photo by rauchdickson of Solid Rock megachurch, Monroe, Ohio
Andrew Kirby is an urbanist based in Phoenix. For several years he lived next door to the 12th century church in Cholsey in the UK, where Agatha Christie is buried.
.
The rise in telecommuting is the unmistakable message of the just released 2009 American Community Survey data. The technical term is working at home, however the strong growth in this market is likely driven by telecommuting, as people use information technology and communications technology to perform jobs that used to require being in the office.
In 2009, 1.7 million more employees worked at home than in 2000. This represents a 31% increases in market share, from 3.3 percent to 4.3 percent of all employment. Transit also rose, from 4.6% to 5.0%, an increase of 9% (Note). Even so, single occupant automobile commuting also rose, from 75.7% to 76.1%, despite the huge increase in gasoline prices. The one means of transport that continued to decline was car pooling, which saw its share decline from 12.1% in 2000 to 10.0% in 2009.
The increase in working at home was pervasive in scope. The share of employees working at home rose in every major metropolitan area (over 1,000,000 population), with an average increase of 38%. The largest increase was in Charlotte – ironically a metropolitan area with large scale office development in its urban core – with an 88% increase in the work at home market share. In five metropolitan areas, the increase was between 70% and 80% (Richmond, Tampa-St. Petersburg, Raleigh, Jacksonville and Orlando). Only five metropolitan areas experienced market share increases less than 20% (New Orleans, Salt Lake City, Rochester, Buffalo and Oklahoma City). Nonetheless, the rate of increase in the work at home market share exceeded that of transit in 49 of the 52 major metropolitan areas. Transit’s increase was greater only in Washington, Seattle and Nashville (where the transit market share is miniscule).
The working at home market share increase was also strong outside the major metropolitan areas, rising 23%.
Working at home is fast closing the gap with transit. In part driven by the surge in energy prices since earlier in the decade, transit experienced its first increase since data was first collected by the Bureau of the Census in 1960. Yet working at home is growing more rapidly, and closing the gap, from 1.7 million fewer workers than transit in 2000 to only 1.0 million fewer in 2009. At the current rate, more people could be working at home than riding transit by 2017. This is already the case in much of the country outside the New York metropolitan area, which represents a remarkable 39 percent of the nation’s transit commuters. Taking New York out of the picture, 31% more people (1.35 million) worked at home than traveled by transit, more than 4 times the 7% difference in 2000 (Table 1, click for additional information).
| Table 1 |
| Transit & Work at Home Share of Commuting |
| Major Metropolitan Areas: 2000 & 2009 |
|
|
|
|
|
|
|
| |
Transit |
Work at Home |
| Metropolitan Area |
2000 |
2009 |
2000-2009 |
2000 |
2009 |
2000-2009 |
| New York |
27.4% |
30.5% |
11.4% |
2.9% |
3.9% |
32.6% |
| Los Angeles |
5.6% |
6.2% |
11.6% |
3.5% |
4.8% |
35.3% |
| Chicago |
11.3% |
11.5% |
2.0% |
2.9% |
4.0% |
37.1% |
| Dallas-Fort Worth |
1.8% |
1.5% |
-13.3% |
3.0% |
4.1% |
37.0% |
| Philadelphia |
8.9% |
9.3% |
3.7% |
2.9% |
3.9% |
35.0% |
| Houston |
3.2% |
2.2% |
-29.2% |
2.5% |
3.4% |
37.4% |
| Miami-West Palm Beach |
3.2% |
3.5% |
9.7% |
3.1% |
4.5% |
48.0% |
| Atlanta |
3.4% |
3.7% |
8.7% |
3.5% |
5.6% |
59.9% |
| Washington |
11.2% |
14.1% |
26.6% |
3.7% |
4.5% |
22.7% |
| Boston |
11.2% |
12.2% |
9.8% |
3.3% |
4.3% |
31.9% |
| Detroit |
1.7% |
1.6% |
-4.7% |
2.2% |
3.1% |
40.1% |
| Phoenix |
1.9% |
2.3% |
17.5% |
3.7% |
5.3% |
44.3% |
| San Francisco-Oakland |
13.8% |
14.6% |
6.0% |
4.3% |
6.0% |
40.5% |
| Riverside |
1.6% |
1.8% |
9.0% |
3.5% |
4.6% |
32.6% |
| Seattle |
7.0% |
8.7% |
25.0% |
4.2% |
5.1% |
23.6% |
| Minneapolis-St. Paul |
4.4% |
4.7% |
6.4% |
3.8% |
4.6% |
20.6% |
| San Diego |
3.3% |
3.1% |
-7.0% |
4.4% |
6.6% |
50.2% |
| St. Louis |
2.2% |
2.5% |
14.2% |
2.9% |
3.5% |
22.5% |
| Tampa-St. Petersburg |
1.3% |
1.4% |
11.0% |
3.1% |
5.5% |
75.7% |
| Baltimore |
5.9% |
6.2% |
5.8% |
3.2% |
3.9% |
23.2% |
| Denver |
4.4% |
4.6% |
4.3% |
4.6% |
6.2% |
36.4% |
| Pittsburgh |
5.9% |
5.8% |
-2.9% |
2.5% |
3.2% |
28.5% |
| Portland |
6.3% |
6.1% |
-3.0% |
4.6% |
6.1% |
32.9% |
| Cincinnati |
2.8% |
2.4% |
-13.4% |
2.7% |
3.8% |
40.3% |
| Sacramento |
2.7% |
2.7% |
0.8% |
4.0% |
5.4% |
33.1% |
| Cleveland |
4.1% |
3.8% |
-8.1% |
2.7% |
3.4% |
25.0% |
| Orlando |
1.6% |
1.8% |
15.4% |
2.9% |
4.9% |
71.4% |
| San Antonio |
2.7% |
2.3% |
-12.5% |
2.6% |
3.4% |
29.0% |
| Kansas City |
1.2% |
1.2% |
4.6% |
3.5% |
4.3% |
24.7% |
| Las Vegas |
4.4% |
3.2% |
-26.8% |
2.3% |
3.3% |
45.1% |
| San Jose |
3.4% |
3.1% |
-9.6% |
3.1% |
4.5% |
44.4% |
| Columbus |
2.1% |
1.4% |
-35.0% |
3.0% |
4.1% |
36.7% |
| Charlotte |
1.4% |
1.9% |
32.2% |
2.9% |
5.4% |
88.1% |
| Indianapolis |
1.3% |
1.0% |
-22.2% |
3.0% |
3.7% |
24.7% |
| Austin |
2.5% |
2.8% |
11.7% |
3.6% |
5.9% |
64.6% |
| Norfolk |
1.7% |
1.4% |
-17.7% |
2.7% |
3.4% |
27.9% |
| Providence |
2.4% |
2.7% |
12.8% |
2.2% |
3.6% |
64.5% |
| Nashville |
0.8% |
1.2% |
38.5% |
3.2% |
4.3% |
34.6% |
| Milwaukee |
4.2% |
3.7% |
-12.5% |
2.6% |
3.2% |
25.3% |
| Jacksonville |
1.3% |
1.2% |
-9.1% |
2.3% |
4.0% |
73.8% |
| Memphis |
1.6% |
1.5% |
-8.1% |
2.2% |
3.1% |
41.3% |
| Louisville |
2.0% |
2.4% |
20.2% |
2.5% |
3.1% |
22.9% |
| Richmond |
1.9% |
2.0% |
6.5% |
2.7% |
4.7% |
76.8% |
| Oklahoma City |
0.5% |
0.4% |
-13.0% |
2.9% |
3.1% |
4.7% |
| Hartford |
2.8% |
2.8% |
-1.3% |
2.6% |
4.0% |
53.6% |
| New Orleans |
5.4% |
2.7% |
-50.3% |
2.4% |
2.9% |
19.2% |
| Birmingham |
0.7% |
0.7% |
-2.3% |
2.1% |
2.7% |
29.5% |
| Salt Lake City |
3.3% |
3.0% |
-10.1% |
4.0% |
4.7% |
17.8% |
| Raleigh |
0.9% |
1.0% |
10.7% |
3.5% |
6.0% |
74.4% |
| Buffalo |
3.3% |
3.6% |
7.9% |
2.1% |
2.3% |
8.3% |
| Rochester |
2.0% |
1.9% |
-4.3% |
2.9% |
3.3% |
13.7% |
| Tucson |
2.5% |
2.5% |
1.8% |
3.6% |
5.0% |
36.3% |
| Total |
7.5% |
8.0% |
6.4% |
3.2% |
4.4% |
37.7% |
|
|
|
|
|
|
|
| Other |
1.0% |
1.2% |
12.3% |
3.4% |
4.2% |
23.0% |
|
|
|
|
|
|
|
| National Total |
4.6% |
5.0% |
9.2% |
3.3% |
4.3% |
30.9% |
|
|
|
|
|
|
|
| Major metropolitan areas: Over 1,000,000 population in 2009 |
|
|
| Metropolitan Area definitions as of 2009 |
|
|
|
|
| Data from 2000 Census and 2009 American Community Survey |
|
|
The rise of working at home is illustrated by the number of major metropolitan areas in which it now leads transit in market share. In 2000, working at home had a larger market share than transit in 28 of the present 52 major metropolitan areas. By 2009, working at home led transit in 38 major metropolitan areas, up 10 from 2000. Between 2000 and 2009, the working at home market share increased nearly 6 times as much as the transit share in the major metropolitan areas (38.4% compared to 6.4%).
Working at Home Leaps Above Transit In Portland and Elsewhere: Perhaps most surprising is the fact that Portland now has more people working at home than riding transit to work. This is a significant development. Portland is a model “smart growth” having spent at least $5 billion additional on light rail and bus expansions over the last 25 years. Portland was joined by other metropolitan areas Houston, Miami-West Palm Beach, New Orleans and San Jose, all of which have spent heavily on urban rail systems. Working at home also passed transit in Cincinnati, Hartford, Las Vegas, Raleigh and San Antonio (Table 2).
| Table 2 |
| Work at Home Share Greater than Transit |
| Major Metropolitan Areas |
|
|
|
|
| Atlanta |
Houston |
Norfolk |
Sacramento |
| Austin |
Indianapolis |
Oklahoma City |
Salt Lake City |
| Birmingham |
Jacksonville |
Orlando |
San Antonio |
| Charlotte |
Kansas City |
Phoenix |
San Digo |
| Cincinnati |
Las Vegas |
Portland |
San Jose |
| Columbus |
Louisville |
Providence |
St. Louis |
| Dallas-Fort Worth |
Memphis |
Raleigh |
Tampa-St. Petersburg |
| Denver |
Miami-West Palm Beach |
Richmond |
Tucson |
| Detroit |
Nashville |
Riverside |
|
| Hartford |
New Orleans |
Rochester |
|
|
|
|
|
| Indicates working at home passed transit between 2000 and 2009 |
|
Further, the shares are close enough at this point that working at home could surpass n transit in Milwaukee, Cleveland and Minneapolis-St. Paul in the next few years.
Transit: About New York and Downtown
As noted above, transit also has gained during this decade. However, the gains have not been pervasive. Out of the 52 major metropolitan areas, transit gained market share in 29 and lost in 23. As usual, transit was a New York story, as the New York metropolitan area saw its transit work trip market share rise from 27.4% to 30.5%. New York accounted for 47% of the increase in transit use, despite representing only 37% in 2000. New York added nearly 500,000 new transit commuters. This is nearly five times the increase in working at home (106,000). Washington also did well, adding 125,000 transit commuters, followed by Los Angeles at 73,000 and Seattle at 41,000.
Transit’s downtown orientation was evident again. This is illustrated by the fact that more than 90% of the increased use in the major metropolitan areas occurred in those metropolitan areas with the 10 largest downtown areas (New York, Los Angeles, Chicago, Philadelphia, Houston, Atlanta, Washington, Boston, San Francisco and Seattle). Among these, only Houston experienced a decline in transit commuting.
Implications
Working at home has been the fastest growing component of commuting for nearly three decades. In 1980, working at home accounted for just 2.3% of commuting, a figure that has nearly doubled to 4.3% in 2009. This has been accomplished with virtually no public investment. Moreover, this seems to have happened without any loss of productivity. Companies like IBM, Jet Blue and many others have switched large numbers of their employees to working at home. These firms, which necessarily seek to provide the best return on their investment for stockholders and owners would not have made these changes if it had interfered with their productivity.
Over the same period, and despite the recent increases, transit’s market share has fallen from 6.4% of commuting in 1980 to 5.0% in 2009. At the same time, gross spending over the period rose more than $325 billion (inflation and ridership adjusted) from 1980 levels. Inflation adjusted expenditures per passenger mile have more than doubled since that time.
Given the remarkable rise of telecommuting, its low cost and effectiveness as a means to reduce energy use, perhaps it’s time to apply at least some of our public policy attention to working in cyberspace. It presents a great opportunity, perhaps far greater and far more cost-effective than the current emphasis on new rail transit systems.
———-
Note: Work trip market share reflects transit in its strongest market, trips to and from work. Transit’s overall impact, measured by total roadway and transit travel (passenger miles) is approximately 1%, compared to the national work trip market share of 5%.
Wendell Cox is a Visiting Professor, Conservatoire National des Arts et Metiers, Paris and the author of “War on the Dream: How Anti-Sprawl Policy Threatens the Quality of Life ”
”
Photograph: DDFic
While the new Memphis Islamic Center in Cordova, TN awaits completion, members meet at a nearby church building that houses Cordova’s Heart Song Church. The Christian congregation has opened its doors to the Muslim community as a gesture of good will.
This kind act is in contrast with other recent activities, like an August arson fire to an Islamic Center’s construction equipment in suburban Murfreesboro just south of Nashville. And to complicate things even more, there’s that tiny little church that had planned to burn the Qur’an on September 11th. While all of this is going on, there is of course the ongoing debate surrounding plans to build a mosque near ground zero.
These stories serve to illustrate the ongoing struggle many Americans have with how to navigate the country’s shifting religious climate.
The United States is the most religiously diverse country in the world. We already noticed that much of America’s religious geography has trended suburban, as indicated in a previous article titled “The Suburbanization of Religious Diversity.” This has put new religions face-to-face with America’s mainstream faiths. The big question remains: how do “mainstream” (Evangelical, Catholic, and Mainline Protestant) Americans view neighbors both culturally distant yet geographically close?
Many Americans say that religious beliefs affect their views on social issues such as abortion, same-sex marriage, and the death penalty. On the other hand, fewer Americans, according to a Pew Research Center report, are inclined to lean on their religious beliefs when it comes to issues like immigration or the environment. Only 7% of Americans say that religion is “the most important influence on their opinions about” immigration but more than one third report that religion influences their opinions on same-sex marriage.
It ends up being a matter of interpretation. Some Christians cite Biblical texts to inform their approach towards new and diverse residents in their communities. “And you shall not wrong a stranger or oppress him, for you were strangers in the land of Egypt.” (Exodus 22:21) Or, “(God) executes justice for the orphan and the widow, and shows His love for the alien by giving him food and clothing.” (Deuteronomy 10:18).
Recalling a role that Christianity played concerning “immigration” in ancient Greco-Roman society, sociologist Rodney Stark wrote, “To cities filled with newcomers and strangers, Christianity offered an immediate basis for attachments.”
So is the same true for the country’s new immigrant populations?
Gwinnett County near Atlanta, for example, has seen an influx of new foreign-born neighbors over the past two decades. Duluth, one of Gwinnett County’s largest communities, epitomizes the cultural diversity of the county.
In 2008, as part of a multi-church research project, several of Duluth’s pastors gathered as a “learning community” on a monthly basis to discuss ways in which Duluth’s churches could better serve their community. The pastors agreed that their churches were not culturally integrated with the many ethnic congregations scattered around the community. The pastors were asked how people would know whether or not churches were making a difference in their community. One of the pastors stated that it would be significant if each person could identify one friend of a different economic sector or different culture and be able to say that they met at church.
It’s no secret that the religious beliefs of America’s new immigrants don’t always mesh with the country’s more traditional, or mainstream, religious groups.
Some believe that America is, traditionally speaking, a “Christian” nation. This is also the perception of others outside the United States. Just ask a student studying in the U.S. from a Middle Eastern country how he or she perceives America’s religious identity . Yet, not all Americans take the position that America is a “Christian” country. Others suggest that North America has always been home to diverse religious ideas.
Some mainstream religious groups and religious adherents, however, feel threatened by the increased religious diversity in this country. They view pluralism as a dangerous thing, something that might impede or compete with the values of those who share a more traditional (traditional-Christian) perspective on faith and life in the United States.
At the same time, sociologists and cultural anthropologists who study religions have stated for years that the even center of “Christian” demography no longer resides in the West . Today, Christianity’s geography looks less European and more Asian, African, and Latin American – cultures that will constitute upwards of half America’s population in the next 30 – 40 years when minorities become the majority.
This is a key issue facing places like Knoxville, which with nearly 700 churches, has more churches per capita than any other city in Tennessee. Religion has shaped Knoxville’s social climate more than any other factor in the city’s history. But even in Knoxville, religious geography is changing.
According to the findings from the Religious Congregations and Membership Study conducted ten years ago by the Association of Statisticians of American Religious Bodies (ASARB), more than 10,000 Knoxvillians claimed adherence to some “other” religious tradition – meaning non-Evangelical, non-Mainline Protestant, non-Orthodox, and non-Catholic.
Today, there is at least one Buddhist center in Knoxville. And according to Brian Long, a writer with the Knoxville News Sentinel, as of 2007 there were 300-500 Hindu families in the area. Knoxville has also had a growing Muslim population since the 1970s and today has roughly 4000 Muslim adherents and three places of worship in the Knoxville region.
Some of America’s more traditional religious groups view new(er) religions in the U.S. such as those in Knoxville to be “compassionate” or “peaceful” religions, while others believe that a religion like Islam is “wicked” or “evil”, even “dangerous,” according to a study produced by the Tennessee-based Lifeway Research group earlier this year.
Then again, it depends on where you live, work, and play.
A few years ago, Deborah Laverty of the Northwest Indiana Times reported that “efforts to establish mosques resulted in controversy and lawsuits” in some of Chicago’s suburbs.
However, in the same article titled “Muslim Mecca in Merrillville,” Laverty wrote about a favorable reception given to Muslims in the region by others. Regarding a willingness of some to invest in the area’s newest Muslim center, Laverty wrote, “One reason the group has chosen to invest in Merrillville is because the community has welcomed those of the Muslim faith with open arms.” Quoting an investment banker, Laverty pointed out, “The Muslim community (in Merrillville) is growing because of a good relationship with members of the law enforcement, government officials and even those of other religions and faiths. We haven’t had any negative incidents and the word is getting around, even in Chicago…”
As the country’s demography continues to change, “mainstream” religious groups in the U.S. will undoubtedly re-calibrate their approaches to the country’s new religious landscape. Already there are some community-based movements that consist of people from diverse religious traditions attempting to figure out how they can serve the common good of their cities without blending together incompatible theological beliefs. Such groups from both “old” (mainstream) and “new” (not-so-mainstream) streams of thought are trying to help communities flourish and dispel fear.
Critical thinking and meaningful dialogue will have to be applied at every level as America grows more – not less – religiously diverse in years to come.
Since 2006, Travis Vaughn has conducted community studies in a number of U.S. cities. He is a visiting instructor at Covenant Theological Seminary and is the catalyst behind cityandcitizen.com.
Photo: Church in Santa Fe by author.
Portland Metro’s president, David Bragdon, recently resigned to take a position with New York’s Bloomberg administration. Bragdon was nearing the end of his second elected term and ineligible for another term. Metro is the three county (Clackamas, Multnomah and Washington counties) planning agency that oversees Portland’s land use planning and transportation policies, among the most stringent and pro-transit in the nation.
Metro’s jurisdiction includes most of the bi-state (Washington and Oregon) Portland area metropolitan area, which also includes the core municipality of Portland and the core Multnomah County.
Local television station KGW (Channel 8) featured Bragdon in its Straight Talk program before he left Portland. Some of his comments may have been surprising, such as his strong criticism of the two state (Washington and Oregon) planning effort to replace the aging Interstate Bridge (I-5) and even more so, his comments on job creation in Portland. He noted “alarming trends below the surface,” including the failure to create jobs in the core of Portland “for a long time.”
Bragdon was on to something. Metro’s three county area suffers growing competitive difficulties, even in contrast to the larger metropolitan area (which includes Clark and Skamania counties in Washington, along with Yamhill and Columbia counties in Oregon). This is despite the fact that one of the most important objectives of Metro’s land use and transportation policies is to strengthen the urban core and to discourage suburbanization (a phenomenon urban planning theologians call “sprawl”).
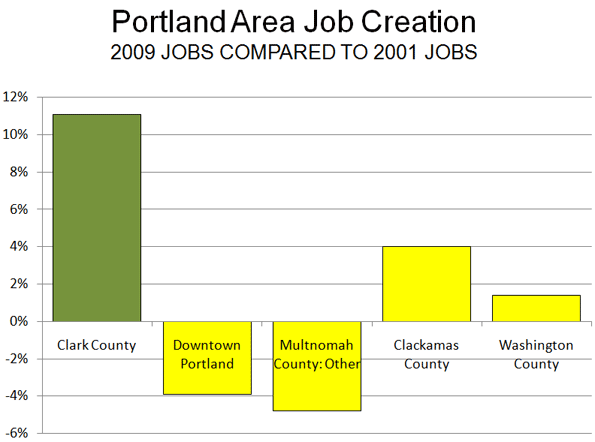
Anemic Job Creation: Jobs have simply not been created in Portland’s core. Since 2001, downtown employment has declined by 3,000 jobs, according to the Portland Business Alliance. In Multnomah County, Portland’s urban core and close-by surrounding communities, 20,000 jobs were lost between 2001 and 2009. Even during the prosperous years of 2000 to 2006, Multnomah County lost jobs. Suburban Washington and Clackamas counties gained jobs, but their contribution fell 12,000 jobs short of making up for Multnomah County’s loss. The real story has been Clark County (the county seat is Vancouver), across the I-5 Interstate Bridge in neighboring Washington and outside Metro’s jurisdiction. Clark County generated 13,000 net new jobs between 2001 and 2009 (Figure 1).
Domestic Migration: Not only are companies not creating jobs in the three county area, but people are choosing to locate in other parts of the metropolitan area.
Between 2000 and 2009, the three counties – roughly 75% of the region’s total population in 2000 – attracted just one-half of net domestic migration into the metropolitan area. Washington’s suburban Clark County, across the Interstate Bridge, added a net 48,000 by domestic migration and has accounted for 40% of the metropolitan area’s figure all by itself.
Core Multnomah County, which had nearly double Clark County’s 2000 population, added only 4,000 net domestic migrants, at a rate less than 1/20th that of Clark County. Suburban Clackamas and Washington counties did better, but between them achieved barely one-half of the Clark County rate.
Exurban Columbia and Yamhill counties, outside the jurisdiction of Metro but inside the metropolitan area, added nearly 13,000 domestic migrants, more than three times that of Multnomah County, despite their combined population less than one-fifth that of Multnomah’s in 2000.
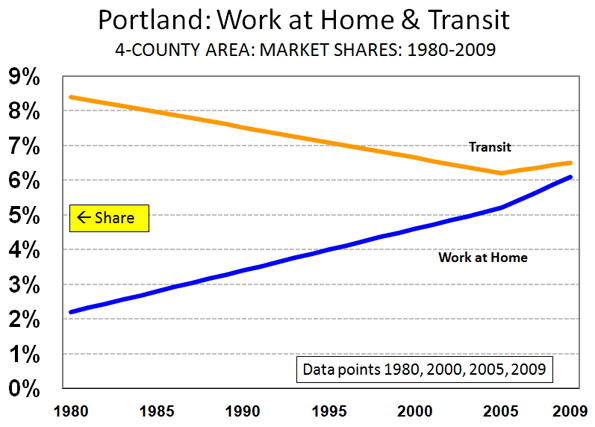
Effects of Pro-Transit Policies: Portland’s unintended decentralization has even damaged the much promoted, and subsidized, public transit agencies. Despite Portland’s pro-transit policies, the three county transit work trip market share fell from 9.7% in 1980, before the first light rail line was opened, to 7.4% in 2000, after two light rail lines had opened. Two more light rail lines and 9 years later, (2009) the three county transit work trip market share had fallen to 7.4%, despite the boost of higher gasoline prices. The three county transit work trip market share loss from 9.7% in 1980 to 7.4% in 2009 calculates to a near one-quarter market share loss. By contrast, Seattle’s three county metropolitan area, without light rail until 2009, experienced a 5% increase in transit work trip market share from 1980 to 2009 (8.3% to 8.7%).
While taxpayer funded transit was attracting less than its share of new commuters out of cars, one mode –unsupported by public funds – was doing very well. Between 1980 and 2009, working at home rose from 2.2% of employment to 6.2%. in the four county area (including Clark County). Thus, nearly as many people worked at home as rode transit to work in 2009 (Note). Already, working at home accounts for a larger share of employment than transit in the larger 7 county metropolitan area. All of this is despite Portland’s having spent an extra $5 billion on transit in the last 25 years on light rail expansions and more bus service. (Figure 2).
Why is the Three County Area Doing Less Well? Why have Portland’s policies that are designed to help the core failed to draw jobs and people? People who move to the Portland area from other parts of the nation are probably drawn by the lower house prices in Clark County, where less stringent land use regulation has kept houses more affordable. New housing in Clark County is also built on average sized lots, rather than the much smaller lots that have been required by Metro’s land use policies. House prices are also lower in the exurban counties outside Metro’s jurisdiction.
As Metro has forced urban densities up in the three county area and failed to provide sufficient new roadway capacity, traffic congestion has become much worse. A long segment of Interstate 5 in north Portland seems in a perpetual peak hour gridlock unusual for a medium sized metropolitan area, which is obvious from Google traffic maps that show average conditions by time and day of week. Even more unusual is the gridlock on a long stretch of the US-26 Sunset Highway that serves the suburban Silicon Forest of Washington County. A long overdue expansion will soon provide some relief on US-26. However transportation officials seem in no hurry to provide the additional capacity necessary to reduce both greenhouse gas emissions and excessive travel delays on Interstate 5 in north Portland. People who move to Clark or the exurban counties can avoid these bottlenecks by working closer to home or even in the periphery of the three county area.
Portland has important competitive advantages, such as a temperate climate and marvelous scenery. It also helps to be close to hyper- uncompetitive California, which keeps exporting households to neighboring states. But a higher cost of living driven by policies that have kept prices 40% higher than before the housing bubble (adjusted for household incomes), and increasing traffic congestion make Portland’s three county area less competitive and nearby alternatives more attractive.
This is not surprising. More intense regulation deters business attraction and expansion. An economic study by Raven Saks of the Federal Reserve Board concluded that … metropolitan areas with stringent development regulations generate less employment growth. At least part of the reason the Metro region’s diminished competitiveness lies with a failed strategy that appears to be having the exact opposite effect to what has been advertised – and widely celebrated – among planners from coast to coast.
Note: 1980 three county data not available on-line.
Wendell Cox is a Visiting Professor, Conservatoire National des Arts et Metiers, Paris and the author of “War on the Dream: How Anti-Sprawl Policy Threatens the Quality of Life”
Photograph: South Waterfront Condominiums, Portland. Photo by author