Category: Urban Issues

  • The Livable Communities Act: A Report Card

    With much fanfare, the Banking Committee of the United States Senate approved the Livable Communities Act (S. 1619, introduced by Democratic Senator Dodd of Connecticut). A purpose of the act is expressed as:

    …to make the combined costs of housing and transportation more affordable to families.

    The Livable Communities Act would provide financial incentives for metropolitan areas to adopt “livability” policies, which are otherwise known as “smart growth,” “growth management” or “compact city” polices.

    “Livability” is the latest rallying cry for planners who want to draw lines around urban areas and force people out of their cars and into denser housing. Secretary of Transportation Ray LaHood has defined livability as “if you don’t want an automobile, you don’t have to have one.” This meaningless slogan presumes that people are forced to have cars. If you are rich enough, you can live without a car on the Upper East Side of Manhattan or Chicago’s Gold Coast. If you are poor enough, you cannot afford a car, which means fewer job prospects and higher retail prices from merchants serving a captive market.

    Perhaps someday we will be beamed from place to place as in Star Trek. However, in the interim, a serious alternative to the car – hopefully a far cleaner, more efficient version – does not loom on the horizon. For all but a privileged few, cars and the quality of life and cars will remain “joined at the hip”. This is why research shows a strong correlation between the automobile access in an urban area and economic growth.

    The Report Card

    It is not premature to issue a report card on the Livable Communities Act, since the effect of its favored policy prescriptions are already well known. Metropolitan areas more inclined toward the act’s menu of livability policies (such as Los Angeles, San Francisco, Portland, Washington and others) are compared to other metropolitan areas (such as Dallas-Fort Worth, Atlanta, Indianapolis, Kansas City and others). Our analysis shows that, for most people, livability policies produce less livability, in terms of higher costs and a lesser quality of life, especially in greater traffic congestion, longer travel times and more exposure to air pollution (Note 1). They will therefore be referred to as “so-called” livability policies.

    Housing Affordability: The Livable Communities Act seeks to make housing more affordable. Sadly, the record associated with such policies in terms of affordability is nothing short of dismal.


    The Livable Communities Act receives an “F” for home ownership affordability


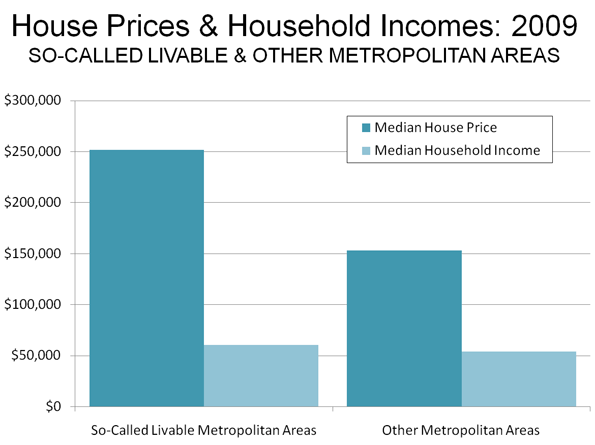
    House prices are considerably higher in the metropolitan areas more inclined toward so-called livability policies. The so-called livable metropolitan areas have nearly 50% higher house prices, after adjustment for incomes (Figure 1). If house prices were at the same level relative to incomes as in the other metropolitan areas, the median price would be $80,000 less. This would mean about $5,000 less in annual mortgage payments. In the least affordable so-called livable metropolitan areas, fewer than 40% of households can afford the median priced house (Los Angeles, New York and San Jose). In all the other metropolitan areas, more than 70% of households can afford the median priced house (Note 2). It takes a lot of gasoline to equal that difference.

    The Livable Communities Act receives an “F” for rental affordability.

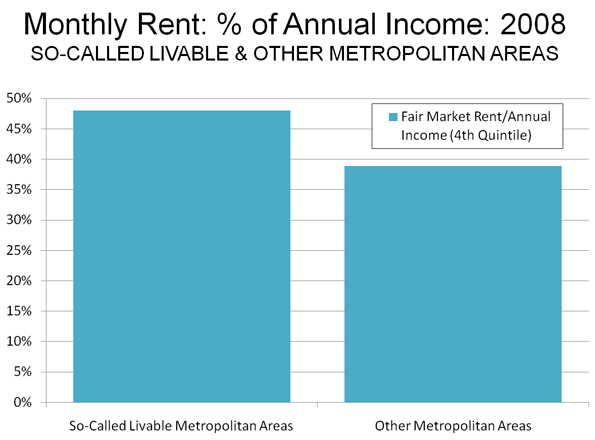
    Rents are also higher in the so-called livable metropolitan areas (Figure 2). The US Department of Housing and Urban Development “fair market rents,” (estimated at the 40th percentile of the rental market, including utilities) for a two bedroom apartment was 25% higher in the so-called livable metropolitan areas in relation to the fourth household income quintile (top of the bottom 25%).

    Why Housing is More Expensive in Livable Metropolitan Areas: The land use regulations typical of the so-called livable metropolitan areas force house prices up by prohibiting development on most available land (urban growth boundaries), imposing building moratoria or, in some cases, by requiring excessively large suburban lot sizes, making it impossible to build housing that is affordable to middle income households. All things being equal, prices increase where supply is restricted, as indicated by a broad economic literature.

    Transportation

    According to the findings in the Livable Communities Act the nation wastes 4.2 billion hours in traffic congestion and loses $87 billion annually from the costs of congestion. The congestion cost is principally the cost of time.

    Transportation Costs: Since commuting by transit nearly always takes longer than commuting by car (twice as long in 2007), any switch to transit is likely to increase costs (lost time is lost time, whether in a train or in a car). The balance of congestion costs are in excess fuel consumption, which would likely also increase under the so-called livability policies, because higher densities produce greater traffic intensities (this from Sierra Club based research), which means more congestion and slower travel speeds, which reduces fuel economy.

    The Livable Communities Act receives an “F” for transportation affordability

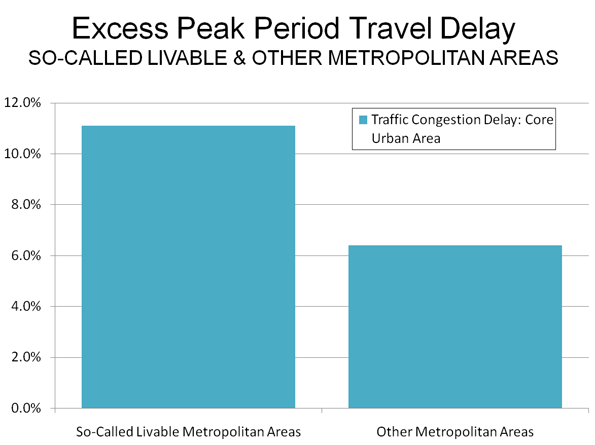
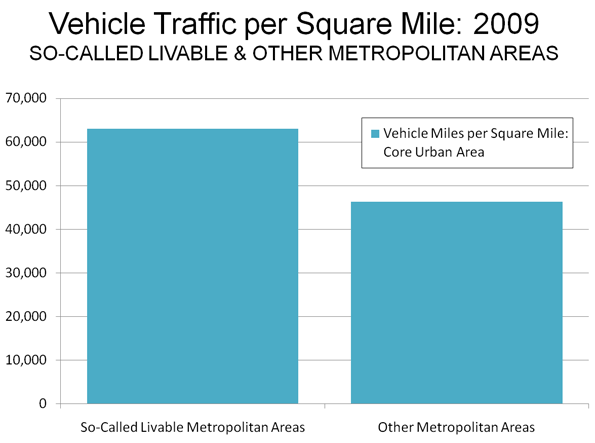
    Transportation Quality of Life: So-called livability policies worsen traffic congestion and air pollution. This is indicated by the latest INRIX traffic scorecard showing that average travel delays during peak travel periods are nearly 75% greater in the so-called livable metropolitan areas (Figure 3). Federal Highway Administration data indicates that the intensity of traffic is more than one-third higher in the so-called livable metropolitan areas (Figure 4)


    The greater traffic intensity also has negative health impacts. The American Heart Association noted that being close to congested roadways increases the likelihood of heart attack and stroke. The American Heart Association cites a study indicating that “a person’s exposure to toxic components of air pollution may vary as much within one city as across different cities.” Obviously, such exposure will be greater where traffic densities are higher.

    The Livable Communities Act receives an “F” on transportation related quality of life issues.

    Consumer Preferences

    In its findings, the Livable Communities Act says that the demand of new housing in dense, walkable (so-called “livable”) areas is 15 times the supply. This misses the extensive overbuilding of dense, walkable communities that ended in the huge condominium bust in Portland, Seattle, Los Angeles, Miami, Atlanta, Chicago and elsewhere. The supply of such housing exceeds the demand, particularly at the current price points.

    Consumer preferences are not revealed by planners’ delusions from surveys people answer in the abstract. For example, most people want shorter commutes, but they vastly prefer single family houses to apartments. In the real context of issues like costs, living space, or schools, people express their priorities.

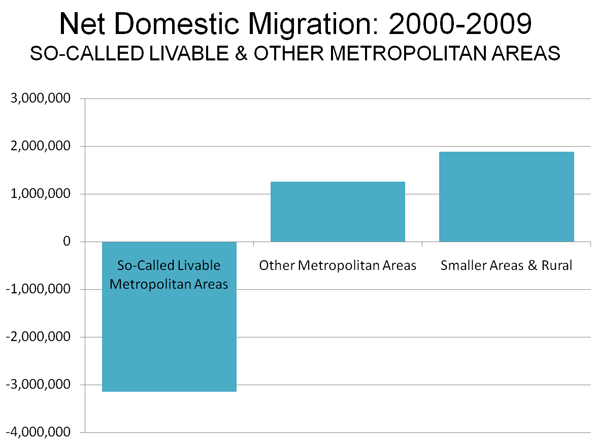
    The “litmus” test of so-called livability is what people do, not what they say they might do. Households continue to vote with their cars and are moving away from so-called “livable” areas. According to 2009 domestic migration data compiled by the Bureau of the Census:

    • The so-called livable metropolitan areas lost more than a net 3,140,000 residents to other areas of the nation, while other metropolitan areas gained more than 1,000,000 and smaller areas gained nearly 2,000,000 (Figure 5).
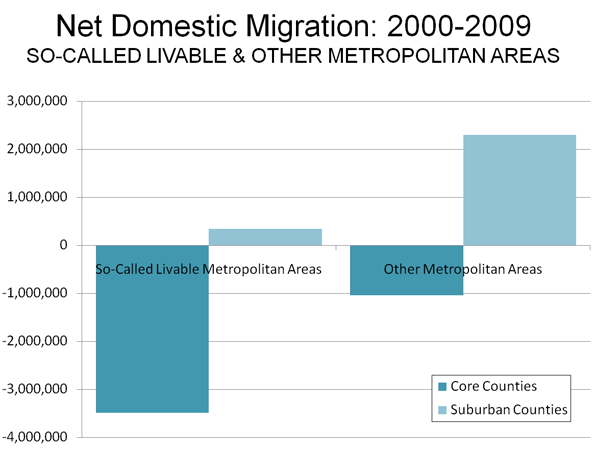
    • Nearly 3,500,000 residents left the core counties of the so-called livable metropolitan areas for other parts of the nation, while the suburbs gained 340,000 residents.
    • In the other metropolitan areas, more than 1,000,000 residents left the denser core counties, while the suburbs gained 2,300,000 (Figure 6).


    The Livable Communities Act receives an “F” for consistency with consumer preferences

    The Report Card: Not Livable at All

    The Livable Communities Act report card is shown below. In other words, if enacted, it is likely to produce a failing grade for families even if it wins straights A’s with planners, academics and inner city developers.

                                     Report Card

    Livable Communities Act

    Subject

    Grade

    Home Ownership Affordability

    F

    Rental Affordability

    F

    Transportation Affordability

    F

    Transportation Quality of Life

    F

    Consistency with Consumer Preferences

    F

    Overall Grade

    F

    Additional Comments: The favored policies would reduce mobility to major parts of the metropolitan area, which would reduce access to potential employment opportunities and retail establishments with lower prices.

    Note 1: The analysis covers metropolitan areas with more than 1,000,000 population. The “so-called” livable metropolitan areas are classified as those with “more restrictive” land use regulation by Demographia. The other metropolitan areas have less restrictive land use regulation. See note 7 of http://www.demographia.com/db-overhang.pdf.

    Note 2: Calculated from the National Association of Homebuilders-Wells Fargo Housing Opportunity Index.

    Wendell Cox is a Visiting Professor, Conservatoire National des Arts et Metiers, Paris and the author of “War on the Dream: How Anti-Sprawl Policy Threatens the Quality of Life

    Photo: Overbuilding Dense Walkability in Miami (photograph by author)

  • Cities: Size Does Not Matter Much Anymore

    The heart and brain are certainly not the largest organs in the human body, but they are arguably the most important. Why? The heart, through a miles-long network of capillaries, keeps every part of the body supplied with nutrients, and the brain, through an equally extensive network of nerves, provides instructions to every part of the body about what to do with those nutrients. They are important not because they are big, but because they are connected to everything else.

    It seems that cities work in much the same way. Some cities are much larger than others, but these size differences play virtually no role in their economic development today. Instead, urban economies depend primarily on cities’ connections to one another through networks of transportation, communication, business transactions, and cultural exchanges. Well-connected cities, regardless of their size, are more likely to develop robust regional economies.

    This is hardly a recent phenomenon. The ancient network of trade routes known as the Silk Road played a major role in the development of cities as commercial centers throughout Asia, and Rome’s imperial power was built upon and maintained by the fact that, proverbially, all roads led there. But, the importance of networks has become more critical recently for cities in the United States.

    In the past, dominated largely by agriculture and mass commodity production, bigger was better. America’s largest cities served as what Walter Christaller dubbed ‘central places.’ These central places served people living in the surrounding territory, as a place to purchase goods and services, and to sell crops and livestock. Bigger cities drew people in from further away, fueling their economic growth. However, as technological developments allowed people and goods to be transported more quickly and cheaply, people were no longer as shackled to the closest big city. Well connected cities, tied to other places by rail lines and highways, and more recently by airline routes and the internet, could benefit from consumers’ demand and workers’ labor in other places.

    Driven by such technological advances, the economic prosperity of American cities has become more tied to their connectedness than their sheer size. But, exactly what kind of connectedness is important can vary from place to place. Cities like New York or Chicago, which drew strength from their size in the past, today thrive largely by being well connected to other cities globally by multiple types of networks, serving simultaneously as transportation hubs, stock exchanges, and cultural centers.

    But the biggest change has been the rise of selected smaller cities. Some, not long ago relatively inconsequential, are now major players due to their linkages in more specialized networks. For example, much of Miami’s remarkable economic and demographic growth, and its status as a global city, is the result of its role as the primary economic and cultural bridge between North America and Central/South America. The Research Triangle in North Carolina and Silicon Valley in California have benefitted from intellectual linkages among universities and the world wide tech industry that join independent towns like Raleigh and Durham into cohesive urban regions. Even very small towns like Bentonville, Arkansas (2007 estimated population: 33,744) can be influential in the world arena with the help of vast supply-chain networks orchestrated by a major corporation (Wal-Mart) and large inflows of people made possible by a major airport (Northwest Arkansas Regional, nearly 1.2 million passengers in 2006).

    What does this change mean for American cities? Perhaps it’s more helpful to consider what it doesn’t mean. The heightened role networks and connectivity for cities likely does not herald the much-hyped death of distance, where internet technologies like high-resolution teleconferencing allow businesses to successfully operate anywhere. Certainly these technologies may simplify routine transactions like training employees at satellite offices, while email and social networking sites may help maintain existing relationships and collaborations over long distances. However, chance encounters that are almost impossible online but common in hallways or on sidewalks are frequently where new relationships are built and new ideas emerge. Even if technology did eliminate the need for proximity, real physical locations would still be significant. Not all cities are well connected, and this type of inequality serves to channel innovation and wealth toward some places and away from others. Although transportation and communication networks could disperse people and resources evenly across the landscape, more often they concentrate people and resources at key bottlenecks and ‘basing points’ in the networks.

    The triumph of networks over size also does not mean the triumph of all small towns over big cities. Size is not bad but simply increasingly irrelevant. Although large cities may encounter inefficiencies due to their size, strategically designed networks can offset many of them. For instance, congestion can be relieved by public transit worth using, or inadequate public services could be bolstered by improving inter-metropolitan coordination. Still, entrepreneurs increasingly seek to locate outside the city’s central core, in smaller suburbs or edge cities. This is a notable development in economic geography, and seems likely to continue. However, the success of these exurbs comes not from their independence from large cities, but instead from their interdependence upon them. Cheap land or favorable tax codes won’t likely transform an isolated small town into an economic powerhouse, while congestion and pollution won’t likely hinder the continued development of a well-connected port city.

    Ultimately, we need to change how we think about cities and their economic growth. Contrary to strategies that seek to ‘grow’ cities by building (or rebuilding) their tax bases, cities do not necessarily need more people or even more companies. Instead, city leaders need to concentrate on growth in terms of cities’ connectivity. Each new capillary or nerve takes a small amount of energy for the body to build, yet they are precisely what make the heart and brain such efficient and important engines of life. Similarly, forging new relationships between cities often does not deplete scarce resources, and cities that are linked to one another can exploit economies of scale by pooling their strengths, making them sleeker and more efficient. A city that stands on its own, no matter how large or small, is likely to burn out in the long run. But, a city that can draw on the resources of the whole world through extensive network connections to other cities, whether it is a metropolis or a hamlet, is likely to thrive.

    Zachary Neal, PhD, is assistant professor of sociology and global urban studies at Michigan State University. This essay draws on his recent study, “From Central Places to Network Bases,” that will appear in the research journal City and Community, and is available here.

    Photo by wzefri

  • Where’s Next: November May Determine Regional Winners

    As the recovery begins, albeit fitfully, where can we expect growth in jobs, incomes and, most importantly, middle class opportunities? In the US there are two emerging “new” economies, one largely promoted by the Administration and the other more grounded in longer-term market and demographic forces.

    The November election and its subsequent massive expansion of federal power may have determined which regions win the post-bust economy, but the stakes in November are particularly acute for some prime beneficiaries of what could be called the Obama economy: the education lobby, Silicon Valley venture firms, Wall Street, urban land interests and the public sector. All backers of his 2008 campaign, these groups have either reaped significant benefits from the stimulus or have used it to bolster themselves from the worst impact of the recession.

    In a sense the Obama policies are designed to overturn the pattern of economic dispersion –towards the exurbs, the south, the intermountain West, and more recently the Plains – that has defined the last half century. The biggest winner, in regional terms, is the Washington area. Even as local governments cut back, the federal establishment continues to swell. Federal employment, excluding the postal service, remains roughly 200,000 larger than in 2008.

    It is not surprising then that the capital district enjoys the highest job growth since December 2009 of any region. Indeed, the Great Recession barely even hit the imperial center. Given its current trajectory, it’s likely to remain the primary boom town along the east coast.

    There are other less obvious regional winners from Obamanomics. Wall Street, despite its recent wailing, has fattened itself on the Fed’s cheap money. It may benefit further from highly complex new financial regulations that will drive smaller, regional competitors either out of business or into mergers with the megabanks.

    Manhattan – a liberal bastion dependent on arguably the greediest, most venal purveyors of capitalism – enjoyed a revived high end consumer economy of high fashion, fancy restaurants and art galleries. Silicon Valley’s financial community also is seeing a surfeit of grants and subsidies for the latest venture schemes, keeping Palo Alto and its environs relatively prosperous. Perhaps this is the positive “change” that Time recently credited in its paen to the stimulus.

    Other regional winners from the Obama economy generally can be found in state capitals and University towns, particularly those with the Ivy or elite college pedigrees that resonate with this most academic Administration. One illustration can be seen in the relatively strong recovery of Massachusetts – home to many prestigious Universities and hospitals – which has seen jobs grow by 2.2 percent since the Obama ascension.

    Similar, albeit less dramatic recoveries can be found in Columbus, Madison and Minneapolis-St.Paul, with their large university communities and regional federal employment centers. Yet the political benefits of this growth may be limited. Many other parts of these same states, including the outer boroughs of New York are not doing well; aside from Columbus, Ohio has continued to skid as its industrial and corporate base dwindles, often moving to more business friendly states.

    At the same time, the strongest growth clusters in those regions that stick to the basics: relatively low taxes, pro-business regulations and continued infrastructure investment. Some regions – particularly in Texas, Alaska, Wyoming and the Great Plains – also have benefited from the growth in such basic industries as agriculture, oil and mining.

    Like resource-producing Canada and Australia, which barely felt the great recession, these economies have been boosted by continued growth in demand from countries like India and China. The current rise in food commodity prices, in part due to poor conditions in Russia and other former Soviet Republics, may further intensify this trend. Beyond the current food crisis, changing consumer tastes in boom markets like China seem certain to boost demand for such products as corn, used to help meet that country’s soaring demand for pork and other meat products.

    But perhaps even more important, once the economy recovers these areas – with their business friendly regimes and lower costs – may continue to siphon much of the next wave of industrial and even tech growth from the more expensive, largely Obama-friendly regions. Caterpillar, for example, one of the likely beneficiaries of expanded exports, recently announced plans to open a new assembly plant not in its Midwestern base but in Victoria, outside Houston.

    This trend has been building for at least a generation and seems likely to intensify under today’s highly competitive global business environment. If we start seeing a recovery in such things as auto sales, one can expect much of the new demand to be meant in efficient, largely foreign owned factories that have been gearing up across the Southeast. Unless powerful federal intervention forces Americans to buy General Motors products like the Volt, consumer preference is likely to be strongest for smart, fuel efficient brands built largely in towns from southern Ohio down to Texas.

    Perhaps even more significantly, these areas are also challenging the Obama regions in such fields as high-technology. Tech hiring has picked up in places like Silicon Valley, New York and DC, but consistently the fastest growth in science, engineering and technical jobs has been in low-cost states such as North Dakota, Virginia, New Mexico, Utah and Texas. Just recently, several major Silicon Valley powerhouses – Adobe, Twitter, Electronic Arts and eBay – announced major new expansions in Utah, a state that is among a brood seeking to move prized businesses, including even entertainment, from the Golden State.

    To a distressingly large extent, the fate of these two distinct economies may hinge on the outcome in November. If the Republicans gain an effective blocking majority – perhaps with a handful of centrist Democrats from growth-oriented states – many favored programs of the Obama economy may be cut or eliminated entirely. These include high-speed rail, increased subsidies for new light rail lines, massive investments in University research and investment breaks for renewable fuels.

    On the other hand, if the Democratic majority persists the tilt towards the Obama economy may even become stronger, as the Democrats will be the ones primarily losing their seats in many growth states. Many policies inimical to the growth states – support for government satrapies like General Motors, tougher restrictions on domestic fossil fuel development and policies designed to curb suburban single family housing – might even intensify.

    In this sense, we need to see November as much as a conflict between growth economies as an ideological contest. The results could determine what regions are next to boom, and whose economy will slow or even decline. What might be best – a compromise recognizing the need to boost growth in all regions – may be a too far a stretch of logic in this political climate.

    This article originally appeared at Forbes.com.

    Joel Kotkin is executive editor of NewGeography.com and is a distinguished presidential fellow in urban futures at Chapman University. He is author of The City: A Global History. His newest book is The Next Hundred Million: America in 2050, released in February, 2010.

    Photo by bcbeatty

  • The Suburbanization of Religious Diversity

    You can see the changes. A drive through suburban Lake County, IN, an hour from downtown Chicago makes you feel like you are somewhere between the set of Jean Shepherd’s A Christmas Story and the movie Hoosiers. Cultural and religious diversity would probably be the last two things on your mind in a region known more for its steel industry than its sacred space.

    Yet a quick glance to the east side of Colorado Street heading south makes you question your assumptions. Neatly tucked between farm land and homes sitting on lots of an acre or more, you see two structures that cause you to scratch your head and wonder, “Am I really in Indiana?” The Northwest Indiana Islamic Center and the region’s Sikh Temple of the Sikh Religious Society of Indiana sit side by side. They provide a visual reminder that suburban America has changed.

    In fact, much has changed. Religion in America is alive and well, but it’s different. Although Christian churches continue to dominate the religious landscape in the United States, there are new religious neighbors. Cultures and religious traditions that once existed “somewhere over there”, have moved beyond the large cities of the U.S. into the suburbs and exurbs, places where evangelical mega-churches have flourished for decades.

    Today, the United States is arguably the most religiously diverse place on the planet. And if the ethnic makeup of the U.S. stays its course for the next half-century, religious diversity will grow exponentially. The Census Bureau predicts that minorities will become the majority in the U.S. within 40 years. Religion in America could have a more robust Latino-Catholic flavor, with Hispanics numbering one in three U.S. residents by 2050. American religious geography will also include influences from Asian Indian cultural traditions. In Bible Belt states like Georgia, Hinduism is one of the fastest growing religions with more than 40,000 Hindus in the state, according to the New Georgia Encyclopedia. By 2000, Islam had already surpassed Southern Baptists in Chicago, with more than 120,000 adherents. Less than 10 years later, Chicago’s Muslim population is estimated to be around 400,000. The big new thing is that this diversity is increasingly found in suburbs. Throughout the country’s history, the places where religious and cultural diversity have been most concentrated were her cities. In fact, this has been the case around the globe. Immigrants journeyed to urban contexts en masse. The city provided the best place for jobs, people networks, and ethnic and cultural affinities. And, a smorgasbord of religious enclaves in the city made it easy for spiritually-minded people to connect and worship with other adherents in their particular tribe.

    On the other hand, the suburban and rural places were viewed as narrow-minded and ethnically homogenous. They were often seemed – and sometimes were – hostile to different religions and cultures.

    In the not-too-distant past, the suburbs were, for the most part, devoid of religious adherence outside of Catholic, mainline, or evangelical groups. However, demographic shifts have put the suburbs on a different trajectory. And religious traditions have followed suit.

    From an ethnic and religious standpoint, cities and suburbs have changed. Some would say they have changed sides. Of course cities will continue to grow, as more than 50 percent of the world’s population lives in city-regions today. City-regions will undoubtedly become more diverse. However, there are major changes to the way we think about communities and their populations in an area of globalization and urbanization. Demographers like Audrey Singer of the Brookings Institution have pointed out that cities have become more suburban-like, and suburbs have become more city-like, though this transition has been slowed to some degree by the current recession.

    Newer cities like Atlanta and older ones like Baltimore share this same pattern. It does not matter if the city is more suburban-like, or if the city is more like the archetypical city built with an infrastructure suitable for immigrants. Both are regions where foreign-born populations bypass the city altogether. This process was well under way before the turn of the last century, when census data revealed that foreign-born populations preferred suburbs over cities.

    Not surprisingly, this phenomenon also brought changes in the country’s religious landscape. Yes, the city and her urban districts remain a viable context to find places of faith, but things have shifted a bit.

    For example, in the past century, Islam, by design an urban religion, certainly migrated to large cities in the U.S. – notably Detroit, Chicago, and New York. But today the ummah has spread to smaller cities and suburban settings. Many Muslims have moved beyond the urban perimeter. Dearborn, MI and Northwest Indiana’s Lake County are two good examples, but these are by no means the exceptions.

    Suburban-friendly cities with large evangelical populations like Atlanta have also seen an increase in other faith traditions. In 2006 and 2007, the BAPS Shri Swaminarayan Mandir Atlanta, said to be the largest Hindu temple of its kind in the United States, was built in suburban Gwinnett County in Lilburn, GA. Much of Georgia’s Hindu population is centered in the sprawling suburbs around Atlanta. The Daily Beast recently ranked Atlanta #6 on their list of the 30 leading cities for Muslims in America (see America’s Muslim Capitals). Two other smaller cities in Georgia made the list, — Albany and Columbus.

    Not only are other religious traditions navigating the suburbs and smaller cities well, but non-Anglo evangelical populations are trending suburban too. Atlanta’s large Korean population is primarily suburban, as are the city’s Korean churches. In the ethnically diverse Atlanta suburb of Duluth, a city of roughly 26,000, the majority of new churches started since 2000 have been Korean. The Korean Church of Atlanta (UMC) is on the path to become a mega-church with new construction and an estimated 1700 people who regularly attend. Korean churches in Duluth and the surrounding area are very diverse themselves, denominationally speaking. Korean congregations include churches from Methodist, Presbyterian, Baptist, and Independent denominations.

    Back in Northwest Indiana, despite the decline of manufacturing jobs and high unemployment rates, the region continues to grow, albeit incrementally. Perhaps the most intriguing statistic is the number of immigrants who have moved to the region in recent years. Between 1990 and 2000, more than 70 percent of Lake County’s growth was attributed to immigration, according to a Purdue University study on immigration in Indiana. Ethnic changes in Lake County brought shifts to the area’s religious geography, too. In the county’s suburban communities of Merrillville and Crown Point, residents can find the aforementioned Islamic Center, an Islamic school, an Indian Cultural Center, the Sikh Temple, and Serbian, Macedonian, and Croatian congregations.

    Some of these changes to Lake County’s religious community came during a period of rapid decline in church attendance. In 2008, The Northwest Indiana Times reported a drop in church attendance of almost 30 percent between 1990 and 2000. This does not mean that all churches in the county are shrinking. Some, in fact, have become quite large. But their biggest source of growth may not be from less familiar religious traditions.

    Economic and social values will continue to intersect new religious traditions in the suburbs as minorities and immigrant populations grow. The culture of suburbs, with individualist values, will continue to have a varying affect on how religious groups establish and sustain themselves. It will be interesting to see how new religious groups affect the culture around them in the suburban neighborhoods they now call home.

    Religion is not going away as some 20th century scholars presumed. What is changing is the country’s religious complexion. How communities grapple with this change may say much about how they thrive in the future.

    Since 2006, Travis Vaughn has conducted community studies in a number of U.S. cities. He is a visiting instructor at Covenant Theological Seminary and is the catalyst behind cityandcitizen.com, coming in the fall of 2010.

  • A Pill For Los Angeles? Medicating the Megacities

    Los Angeles — and other modern megacities — conjure increasingly unique genetic profiles that point the way to a new medical industry: Call it urbo-pharmaceuticals. Investors are needed.

    Is there a pill that might inoculate us from smog?
    Is there a gene we can target that would make us resistant to resurgent infectious diseases?
    And is there a way to use genetic data to insulate new immigrants from some of the metabolic challenges of living in a new land of plenty?

    Welcome to the slowly emerging world of environmental medicine and its inevitable outgrowth, environmental pharmaceuticals: compounds specifically suited for mitigating the physiological challenges of mega-city life in the 21st century.

    The inchoate drive for such pills — disparate, proceeding in entrepreneurial fits and starts — is fueled by twin facts.

    First: Inflammation, the chronic-over-firing of the body’s immune system, now sits at the core of almost all scientific discussion of chronic diseases, diseases that persist despite thirty years of lifestyle advice, medication and surgical intervention.

    Second: Urban environments today are physiologically inflammatory beyond belief, their brew of fumes, crowding, germs and bad food wreaking all kinds of internal damage and prompting no end of lifelong medical problems. As Dr Marc Reidl, a specialist in respiratory disease at UCLA puts it, “Mega city life is an unprecedented insult to the immune system.”

    The consequent diseases — asthma and COPD, heart disease, diabetes, alcohol and drug addiction — are costly and life-sapping. They are accentuated by the huge inflows of young populations, many from poor rural environments, from Mexico to the Middle East. These new migrants bring their own unique pathogens, and their own unique vulnerabilities. Poverty fuels excess consumption of cheap fruits and sugars, pushes people into smog-proximate neighborhoods and pest-filled homes, and drives them to unhealthful behaviors. And certain genes — most notably the well-studied “hungry gene” — exacerbate the reaction. Consider:

    Asthma and COPD, considered among the world’s top medical concerns, seem to be activated by special sets of genes, some of which accentuate the impact of smog (along with tobacco smoke, the principle culprit in the industrialized world). Other genetic profiles seem to mitigate it. Researchers at the University of Southern California have identified both versions.

    In the Latino population, mutations in liver genes, particularly one well-known one named CYP450, seem not only to fuel alcohol abuse, but also to accentuate some of its gravest consequences: fatty liver disease and cirrhosis.

    Heart disease, as well as problem pregnancies, uncontrolled diabetes, and even sleep apnea, are increasingly driven not just by the traditional devils of unhealthy lifestyle and poverty, but by genes activated by uniquely urban pathogens and concentrated diesel and auto exhaust.

    Genes governing stress responses may be at the root of why traditional antibiotics do not work within the germy reality of big cities. For years, speaking the words “genes,” “immigrants,” and “public health” was the proverbial ticket to a social and political nether-land. It was almost as bad as talking about obesity. It is still a messy brew.

    Yet outside of “nannyism” (not necessarily such a bad thing), or trying to scare away any new migrants (which is), what can be done? One tack might be to take a cue from modern pharmacology’s attempt to develop a pill for Metabolic Syndrome, the debilitating mix of diabetes, high blood pressure and high cholesterol now prevalent in most developed nations. Can we design an urban poly-pill, one built specifically for the inflammatory storms of the mega-city? And can we point it at what might be called the big three: the impairment of respiration, metabolism and cardio vascular processes?

    UCLA’s Riedl, a specialist in respiratory disease, has zeroed in on oxidative stress — the damage caused by unstable, burned-up nutrient particles in the blood stream. He knew that anti-oxidant supplement regimes have been an overwhelming bust, most of them weak and not very good at targeting the body’s native anti-oxidant systems. Then came a number of insights made possible by genetics. Perhaps the most important was a molecule dubbed GSTM1. It is deeply implicated in fighting oxidative stress from smog and other pollutants. Riedl traced the pathway upstream and found that it was driven by another gene product called Nrf-2.

    Then he decided to pharmaceuticalize one molecule derived from broccoli sprouts, sulphoraphane, crafting a concoction using concentrates of the vegetable mixed with daikon root essence. The result was a compound he could try out in various concentrations in humans, then measure whether its effect on Nrf-2 were, in the lexicon of pharmaceutical development, “dose dependent.” It was. The next step will be to test how well it works in people exposed to constant high levels of smog.

    Though the path to any therapy remains long and arduous, Riedl holds a picture in his mind of one possible future. “The Holy Grail for us is if we could identify the population sub group that is most likely to have the mutation that impairs Nrf-2, and who are environmentally vulnerable —say, people who live close to freeways — and essentially do targeted chemotherapy for environmental insults.”

    Among urban woes, metabolic disorders are particularly troublesome. The NIH has singled out type 2 diabetes and fatty liver disease as the two biggest factors driving hospitalization, amputations and prescription drug use. Their effect on health care expenditure is huge and growing. Treatment — let alone prevention — has proved vexing.

    Two promising compounds are under serious study. The first is the grape skin compound known as Resveratrol. Though mainly known for its claim to extend mammalian lifespan, its true value is quietly emerging in diabetes treatment, where early clinical trials showed promising results but, unfortunately, several safety issues.

    And Metformin, a diabetes drug originally synthesized from the French lilac plant, may have huge protective benefits for urbanites. Researchers at UCLA Riverside have used microchip arrays to discover that it activates liver genes that dampen high insulin levels and vascular inflammation.

    At USC, one of the world’s leading centers for studying diabetes and liver diseases, scholars have pinpointed a gene that, when activated, causes fatty liver disease, another potential urbo-drug target. As Michael Goran, the head of USC’s diabetes research, notes: “In Mexican Americans there is mutation in a gene called PNPLA1 which is related to an elevation in liver fat which could be related to increased diabetes risk and definitely [is] related to longer term increase in liver disease; this mutation is highly prevalent in Hispanics/Mexican Americans; moreover, in our own research we have just discovered that: a) the effect of this gene is manifested very early in life and b) the effect of this gene on increasing liver fat is promoted by high sugar intake.”

    What about the heart? UCLA heart researcher Alan Fogelman, the dean of modern HDL research, has two compounds in small clinical trials that would help the body restore its ability to make good cholesterol, a process increasingly undermined by the smog, virii and bad food of mega-cities. Both are peptides — short, protein-like molecules — that target specific gene products activated by chronic inflammation, which can include everything from the flu to sleep apnea to unchecked diabetes. The compounds are being developed by Bruin Pharma, a commercial venture in which Fogelman is a principal and an officer.

    What are his HDL peptide’s chances? “It is so early to try to tell something like that,” he says. “We have no idea where that effort will take us, or whether it will hit the target we hope. We have to wait for the trials.”

    Yet waiting, especially when it requires patience and foresightedness, is something we as a society seem incapable of, especially when dealing with complicated public health issues. But what if there were a faster, cheaper way? Urbo-pharmaceuticals might be one ticket. After all, we are patient and forgiving when it comes to pills and the time, cost and uncertainty that comes with their development.

    Chalk that up to the ease-seeking nature of humans, something for which there is no pill, but which, in itself, might drive us to invest in a poly pill for modern life.

    Greg Critser’s new book is Eternity Soup: Inside the Quest to End Aging (Random/Harmony 2010).

    Photo by ilmungo / Luigi Anzivino, Los Angeles from the top of Temescal Canyon Trail, “…taken not at sunset, but at 11AM… that pretty peach-colored layer in the sky is the famous LA smog.”

  • What’s Behind China’s Big Traffic Jam

    The world press has been fixated on the “Beijing” traffic jam that lasted for nearly two weeks. There is a potential lesson here for the United States, which is that if traffic is allowed to far exceed roadway capacity, unprecedented traffic jams can occur.

    The Inner Mongolia Traffic Jam: First we need to understand that this was not a “Beijing” traffic jam at all,or even on the outskirts of Beijing. The traffic jam came no closer to Beijing than 150 miles (250 kilometers) away, beyond the border of the city/province of Beijing, through the province of Hebei and nearly to the border of Inner Mongolia. The traffic jam then extended for more than 60 miles (100 kilometers) from near the Inner Mongolia border to Jingxi, in the region/city of Ulanqab. In reality this would be like calling a New York City traffic jam something that originated from Springfield, Massachusetts to Boston’s I-495 beltway (Figure 1).

    However, even the New York City example understates the complexity of the Chinese traffic jam. Beijing, China’s national capital, is one of the world’s largest urban areas (with a population of nearly 14 million). The city is situated at the northwestern limit of the densely populated part of China (which is called “China Proper”) that runs from Manchuria in the north to Yunnan in the south.

    Beijing’s urbanization ends at the mountains less than 30 miles from the Forbidden City, Beijing’s core. The area beyond the mountains, through which the Great Wall runs, possesses only intermittent and generally minor urbanization. The area is dominated by grassland, and some rice farming. In this environment, it is not surprising that there were few alternatives for traffic to the G-110 Expressway (freeway), just as there would be few alternatives for traveling between Casper and Cheyenne, Wyoming on Interstate 25.

    Continuing the I-25 comparison, the Inner Mongolian traffic jam more closely resembled traffic destined for Denver, with the congestion stretching from north of Cheyenne for another 60 miles, not far from the south end of the Powder River Basin, America’s largest coal producing region. This is a particularly appropriate comparison, because the type of traffic that caused the Inner Mongolian jam, coal trucks, would similarly jam I-25, were it not for the high-capacity freight rail system that moves most of the coal from the Powder River Basin to the nation’s electricity generation plants in the Midwest, East and South.

    Like Interstate 25, the G-110 Expressway is a high quality divided and grade separated four lane road. As with Wyoming’s I-25, Inner Mongolia has an old 2-lane road (National Route 110) that parallels the G-110 for much of the way. This is not a viable alternative for the truck traffic volumes that are needed to supply the megacity of Beijing with its electric power.

    Beijing’s First World Traffic: The Beijing city commission has announced that traffic flows continue to slow in Beijing. In the first half of 2010, the average speed dropped to 14 miles per hour (24 kilometers per hour). This is despite the fact that the urban area has a world class expressway system, with a fifth ring expressway (beltway) mostly completed (Note 1) and radial expressways feeding the inner areas. The surface arterial system in the inner area consists of a dense network of wide streets, providing capacity that certainly exceeds that of the city of Chicago or the four highly urbanized boroughs of New York, Manhattan, Brooklyn, the Bronx, and Queens (Note 2).

    Beijing’s inner area traffic congestion is like that of New York City. The population density is 30,000 people per square mile (the approximate density also of the four New York boroughs), too high to move the volume of traffic over a freeway and expressway system. Higher population densities are associated with greater traffic congestion, slower speeds, stop and go traffic and more intense pollution. Beijing and New York share all of these conditions.

    There is a perception that the traffic situation could become substantially worse in Beijing, and that could well be the case. However, it is surprising that the Bejing (the city/province) is already well along in private vehicle ownership and use. Beijing has achieved a car ownership rate almost equal to that of New York City’s dense boroughs. In 2008, the dense boroughs of New York City had 0.52 cars per household, while Beijing had achieved a 0.51 rate. One report now places Beijing’s car ownership one third higher than in 2008, which would place Beijing’s car ownership rate 20% above that of New York City.

    By 2008, Beijing already had 1.5 times as many drivers per household as New York City’s dense boroughs (Figure 2). The difference appears to be in commercial drivers licenses, which account for nearly one-half of Beijing’s 9.4 million driver’s licenses. With the coal truck traffic and heavy truck traffic to the port of Tianjin, little more than 100 miles (160 kilometers) away, it is possible that trucks comprise a higher share of the traffic volume in Beijing than in New York City (Note 3).

    Local authorities are seeking to reduce the traffic congestion problem by building one of the world’s largest Metro (subway) systems. By the middle of the decade, nearly 350 miles (561 kilometers) should be open. Some lines will extend to outside of the fifth ring road, where much of the population growth is occurring. The Beijing Metro, like that of Mexico City, has been designed to better serve the contemporary urban area. Both are characterized by a concentration of grid routes and less by radial routes. Beijing also has ring routes. This design is especially appropriate for Beijing, which as is typical for many large Asian urban areas and unlike New York, Chicago or Hong Kong, has a decentralized core. Large office buildings in the center are more sparsely spread around a larger area, larger than these concentrated central business districts. Yet, even with this appropriate route design, the decentralization of retail and office activity necessitates time-consuming transfers that can make cars faster, even in Beijing’s traffic.

    China is also encouraging the use of electric cars, subsidizing buyers willing to switch from cars powered by fossil fuels. This will not ease traffic congestion, but it will reduce air pollution.

    At the same time, a period review of traffic conditions on the Internet will show Beijing’s worst traffic congestion to be concentrated in the high density core while in the much less dense expanding suburbs, traffic conditions are considerably better. Additionally, there is discussion of a seventh ring road and Beijing officials continue to improve their roadway network. As in US urban areas, Beijing’s continued decentralization could allow traffic to eventually be managed. Economists Peter Gordon and Harry W. Richardson have found that “suburbanization has been the dominant and successful mechanism for reducing congestion.”

    Clearing the Traffic: Meanwhile, there are reports that authorities have eased the traffic jam in Inner Mongolia. A longer term solution might be to add a couple of additional lanes in each direction. This should not be too difficult in a nation that by the end of the year will have nearly as many miles of freeway (43,000 or 70,000 kilometers) as the original US interstate system and will probably lead the world early in the next decade. This is a key to improving the competitiveness of Chinese urban areas. Sufficient roadway investment to handle growing travel demand will be just as important to maintain the competitiveness of US urban areas.

    —-

    Note 1: Beijing has six ring roads, however the first is the arterial road surrounding the Forbidden City, which is not an expressway.

    Note 2: Staten Island is excluded because its urban form is principally that of a post-war suburb, with a much lower population density.

    Note 3: This assumes comparability of data, which may not be fully reliable due to incomplete information.

    —-

    Wendell Cox is a Visiting Professor, Conservatoire National des Arts et Metiers, Paris and the author of “War on the Dream: How Anti-Sprawl Policy Threatens the Quality of Life

    Photo of Beijing Fourth Ring Road by archlife

  • Australia 2010: Unstable Politics in a Prosperous Country

    2010 has been something of an annus mirabilis in Australian politics. On 24 June a prime minister was dumped before facing the voters a second time. This was the first time ever for such an early exit. Then the election on 22 August produced a “hung parliament”, an outcome not seen since the 1940s. Having fallen short of enough seats to form government, the major parties are scrambling for the support of four independents and one Green in the House of Representatives.

    If this looks like the politics of a nation mired in economic upheaval, the reality is far different. Australia was one of a handful of advanced countries to avoid recession during the financial crisis. The unemployment rate never rose much above 5 per cent. For some economists, Australia is “the wonder from down under”.

    So why did the Labor government, elected in 2007, fall apart? There was certainly a lack of governing experience after eleven years in opposition. But in a broader sense, the political class is struggling to cope with Australia’s increasingly regionalised economy, and the divergent sources of its new-found prosperity.

    Like many industrialised countries, Australia passed through a seemingly intractable malaise in the 1970s. The country’s predicament appeared worse than that of more diverse and innovative economies like the United States. Relying on agricultural and mineral exports, legacies of a colonial past, Australia’s manufacturing base was inward-looking, outmoded and sclerotic. Disparaging assessments like that of former Singapore Prime Minister Lee Kwan Yew – Australians were destined to be “the poor white trash of Asia” – were common. Some fretted about “the Argentine route”, a country failing to diversify its economy and sliding down world rankings of GDP per capita. As transformed manufactures and high-tech products gobbled up an increasing share of world trade, Australia seemed stuck in the slow lane of commodity exports.

    And then came the 1980s. Protective barriers were slashed, the currency was floated, the financial system was opened up to foreign banks and state-owned agencies were sold off or treated to radical micro-economic reform. By the mid-2000s, the contours of the economy had changed. Activities such as business and property services rose from 10 to almost 15 per cent of GDP over the decade to 2006. Meanwhile manufacturing declined from 15 to 12 per cent. The new economy was dominated by services, now accounting for 68 per cent of GDP. Rather than drag down the economy, however, mining enjoyed parallel growth, from 4.5 to 8 per cent in the same period. China’s explosive arrival on the world scene shifted commodity exports into a very fast lane. These developments set Australia on a growth path that few could have foreseen in the 1970s. A small economy in relative terms to countries like China and the United States, it has evolved into a series of distinct geographic regions.

    The booming commodities export sector, dominated by mining, is concentrated in the northern and western states of Queensland and Western Australia, which account for 74 per cent of onshore mining production. Business and property services are concentrated in the south-eastern states of New South Wales and Victoria, specifically the inner precincts of Sydney and Melbourne, the nation’s emerging global cities. Together, these cities host around 50 per cent of Australia’s finance industry jobs. Public sector services, mostly in health and education, figure prominently in the populous south-east, again skewed towards long-established inner-city localities, where the most prestigious institutions are found. Construction, consumer services, including retail, and light manufacturing, fuelled by demand for household goods and building supplies, thrive in the larger metropolitan regions with high rates of immigration and population growth, like outer Sydney and Melbourne, and increasingly south-east Queensland.

    At the end the true driver of the economy lies with commodities. Today mineral resources make up just under 80 per cent of Australia’s commodity trade and around half of all exports (including services). Australia is the world’s leading exporter of coal and iron ore and ranks high other minerals like zinc and aluminium.

    Reaping the China bounty, former Prime Minister John Howard kept the federal budget in surplus and reduced government debt to zero, while handing out tax cuts and family income supplements. This winning combination delivered Howard eleven years in power. Towards the end of his rule, however, strains in the boom economy began to manifest themselves. Skilled labour shortages and the heated property market began to put pressure on inflation and interest rates, contributing to a sense of policy exhaustion in Howard’s later years.

    By 2007, there was a widespread view that the benefits of the resources boom were not being distributed fairly. The service sector professionals of the south-east, especially in the public sector who dominate the national media, began to shift to Labor as did outer suburban workers, who saw the dream of home ownership slipping beyond their reach. Forced to compete for investment in the open economy, south-eastern state governments, controlled by Labor, were constrained to keep taxes low. An ever larger proportion of their budgets was channelled into health and education services, partly due to close links with powerful public sector unions. There was little left to pay for urban infrastructure on the booming fringes.

    In response, infrastructure costs were shifted onto developers and local government, along with a new set of regulations, and urban consolidation (“smart growth”) was enforced as planning policy, ostensibly to reduce the need for extra resources. These choices reflected the green ideology taking hold in the planning profession, as well as among the professional classes.

    The impact of these measures on housing affordability were disastrous. When the low interest rates of the Howard years began to creep up, the problem turned into a crisis, as the Demographia survey has shown. The property market slowed down, depriving the south-eastern states of even more funds, since property taxes are a significant share of their revenues. This contrasted with conditions in the mining states, prompting the Federal Treasury Secretary to declare Australia a “two speed economy”.

    At the 2007 election, Labor leader Kevin Rudd claimed to have the solutions. Paying lip service to Howard’s fiscal conservatism, he signalled plans to divert mining boom proceeds towards infrastructure and services, including a new deal on health funding and an “education revolution“. Much of this was wrapped up in the rhetoric of climate change, talked up by Rudd as “the greatest moral challenge of our time”. His environmental centrepiece was an Emissions Trading Scheme (cap and trade), a massive revenue raising device for the federal government. In essence it was a mechanism for transferring wealth from the mining states, and their fossil-fuelled economies, to the populous south-east.

    Rudd’s electoral success, and apparent public support for climate action, drove the agenda forward until the crash at Copenhagen. This precipitated a revolt in the opposition Coalition, which replaced ETS supporter Malcolm Turnbull with climate-sceptic Tony Abbott. When Abbott labelled the ETS “a great big new tax on everything“, and blocked its passage in the Senate, public interest in the scheme melted away, particularly in the mining regions. Rudd lost his nerve and shelved it until 2012. For many Australians, he was exposed as a weak leader without the courage of his convictions.

    Rudd refused to give up his dream of redistribution though, turning to Plan B. Having commissioned a review of Australia’s taxation system, he announced a Resource Super Profits Tax, a complex device confiscating up to 40 per cent of mining profits above a threshold. Adopted without consulting the resources industry, it attracted furious opposition from the global mining companies, which launched a powerful advertising campaign against it. Opposition leader Abbott labelled the measure ”a great big new tax on mining”. Opinion polls showed strong opposition to the tax in mining states, and mild support in the south-east. Rudd’s poll ratings fell through the floor. He was soon deposed by his Labor Party colleagues.

    Julia Gillard, the new prime minister, substantially modified the proposal after negotiations with the large miners, but smaller operators remained opposed, along with most of Queensland and Western Australia. Gillard quickly called an election to capitalise on her status as the country’s first female leader. But the legacy of Rudd’s undelivered promises shaped the outcome. Australia’s regional divisions were clearly evident in the voting patterns. Western Australia and Queensland swung to the Coalition, and Queensland proved to be a killing ground, depriving Labor of nine seats. New South Wales also swung to the Coalition, reflecting dissatisfaction with the long-serving state Labor government’s failure to address the infrastructure and housing needs of suburban western Sydney. In contrast, the southern states of Victoria, Tasmania and South Australia swung towards Labor.

    Well over half of Labor’s lost votes moved left to the Greens, who more than doubled their share of the vote, rather than right to the Coalition. Increasing numbers of south-eastern professionals consider the Greens their preferred agent of redistribution. Handing the Greens the balance of power in the Senate, and possibly the House of Representatives (only one seat this time), may prove a better strategy than sticking with a fractured Labor Party. Inevitably though, regional and outer-suburban voters, with their divergent priorities, will react to a green-dominated agenda, which tends to dismiss suburban interests. Over time, and perhaps after the next election, this may mean a shift back to the right and a clear Coalition victory.

    John Muscat is a Sydney lawyer and co-editor of The New City (www.thenewcityjournal.net), a web journal of urban and political affairs.

    Photo by webmink

  • The Housing Bubble: The Economists Should Have Known

    Paul Krugman got it right. But it should not have taken a Nobel Laureate to note that the emperor’s nakedness with respect to the connection between the housing bubble and more restrictive land use regulation.

    A just published piece by the Federal Reserve Bank of Boston, however, shows that much of the economics fraternity still does not “get it.” In Reasonable People Did Disagree: Optimism and Pessimism About the U.S. Housing Market Before the Crash, Kristopher S. Gerardi, Christopher L. Foote and Paul S. Willen conclude that it was reasonable for economists to have missed the bubble.

    Misconstruing Las Vegas and Phoenix: They fault Krugman for making the bubble/land regulation connection by noting that the “places in the United States where the housing market most resembled a bubble were Phoenix and Las Vegas,” noting that both urban areas have “an abundance of surrounding land on which to accommodate new construction” (Note 1).

    An abundance of land is of little use when it cannot be built upon. This is illustrated by Portland, Oregon, which is surrounded by such an “abundance of land.” Yet over a decade planning authorities have been content to preside over a 60 percent increase in house prices relative to incomes, while severely limiting the land that could have been used to maintain housing affordability. The impact is clearly illustrated by the 90 percent drop in unimproved land value that occurs virtually across the street at Portland’s urban growth boundary.

    Building is largely impossible on the “abundance of land” surrounding Las Vegas and Phoenix. Las Vegas and Phoenix have virtual urban growth boundaries, formed by encircling federal and state lands. These are fairly tight boundaries, especially in view of the huge growth these areas have experienced. There are programs to auction off some of this land to developers and the price escalation during the bubble in the two metropolitan areas shows how a scarcity of land from government ownership produces the same higher prices as an urban growth boundary

    Like Paul Krugman, banker Doug French got it right. In a late 2002 article for the Nevada Policy Research Institute, French noted the huge increases auction prices, characterized the federal government as hording its land and suggested that median house prices could reach $280,000 by the end of the decade. Actually, they reached $320,000 well before that (and then collapsed).

    In Las Vegas, house prices escalated approximately 85% relative to incomes between 2002 and 2006. Coincidentally, over the same period, federal government land auctions prices for urban fringe land rose from a modest $50,000 per acre in 2001-2, to $229,000 in 2003-4 and $284,000 at the peak of the housing bubble (2005-6). Similarly, Phoenix house prices rose nearly as much as Las Vegas, while the rate of increase per acre in Phoenix land auctions rose nearly as much as in Las Vegas.

    In both cases, prices per acre rose at approximately the same annual rate as in Beijing, which some consider to have the world’s largest housing bubble. According to Joseph Gyourko of Wharton, along with Jing Wu and Yongheng Deng Beijing prices rose 800 percent from 2003 to 2008 (Figure). This is true even thought we are not experiencing the epochal shift to big urban areas now going on in China.

    The Issue is Land Supply: The escalation of new house prices during the bubble occurred virtually all in non-construction costs such as the costs of land and any additional regulatory costs. It is not sufficient to look at a large supply of new housing (as the Boston Fed researchers do) and conclude that regulation has not taken its toll. The principal damage done by more restrictive land regulation comes from limiting the supply of land, which drives its price up and thereby the price of houses. In some places where there was substantial building, restrictive land use regulations also skewed the market strongly in favor of sellers. This dampening of supply in the face of demand drove land prices up hugely, even before the speculators descended to drive the prices even higher. Florida and interior California metropolitan areas (such as Sacramento and Riverside-San Bernardino) are examples of this.

    Missing Obvious Signs: There are at least two reasons why much of the economics profession missed the bubble.

    (1) Unlike Paul Krugman, many economists failed to look below the national data. As Krugman showed, there were huge variations in house price trends between the nation’s metropolitan areas. National averages mean little unless there is little variation. Yet most of the economists couldn’t be bothered to look below the national averages.

    (2) Most economists failed to note the huge structural imbalances that had occurred in the distorted housing markets relative to historic norms. Since World War II, the Median Multiple, the median house price divided by the median household income, has been 3.0 or less in most US metropolitan markets. Between 1950 and 2000, the Median Multiple reached as high as 6.1 in a single metropolitan area among today’s 50 largest, in a single year (San Jose in 1990, see Note 2). In 2001, however, two metropolitan areas reached that level, a figure that rose to 9 in 2006 and 2007. The Median Multiple reached unprecedented and stratospheric levels in of 10 or more in Los Angeles, San Francisco, San Diego and San Jose- all of which have very restrictive land use and have had relatively little building. This historical anomaly should have been a very large red flag.

    In contrast, the Median Multiple remained at or below 3.0 in a number of high growth markets, such as Atlanta, Dallas-Fort Worth and Houston and other markets throughout the bubble.. Even with strong housing growth, prices remained affordable where there was less restrictive land use regulation.

    Seeing the Signs: Krugman, for his part, takes a well deserved victory lap in a New York Times blog entitled “Wrong to be Right,” deferring to Yves Smith at nakedcapitalism.com who had this to say about the Federal Reserve Bank of Boston research:

    It is truly astonishing to watch how determined the economics orthodoxy is to defend its inexcusable, economy-wrecking performance in the run up to the financial crisis. Most people who preside over disasters, say from a boating accident or the failure of a venture, spend considerable amounts of time in review of what happened and self-recrimination. Yet policy-making economists have not only seemed constitutionally unable to recognize that their programs resulted in widespread damage, but to add insult to injury, they insist that they really didn’t do anything wrong.

    Maybe we should have known better: beware economists bearing the moment’s conventional wisdom.

    ——

    Note 1: The authors cite work by Albert Saiz of Wharton to suggest an association between geographical constraints and house price increases in metropolitan areas. The Saiz constraint, however, looks at a potential development area 50 kilometers from the metropolitan center (7,850 square kilometers). This seems to be a far too large area to have a material price impact in most metropolitan areas. For example, in Portland, the strongly enforced urban growth boundary (which would have a similar theoretical impact on prices) was associated with virtually no increase in house prices until the developable land inside the boundary fell to less than 100 square kilometers (early 1990s). A far more remote geographical barrier, such as the foothills of Mount Hood, can have no meaningful impact in this environment.

    Note 2: William Fischel of Dartmouth has shown how the implementation of land use controls in California metropolitan areas coincided with the rise of house prices beyond historic national levels. As late as 1970, house prices in California were little different than in the rest of the nation.

    Wendell Cox is a Visiting Professor, Conservatoire National des Arts et Metiers, Paris and the author of “War on the Dream: How Anti-Sprawl Policy Threatens the Quality of Life

    Photograph: $575,000 house in Los Angeles (2006), Photograph by author

  • The Disappearance of the Next Middle Class

    Every week we read that yet another major housing project has been turned down by the Courts here in New Zealand because of the need to protect “rural character” or “natural landscapes”. This may well have profound short and long-term consequences for the future of our middle class, as it does for the same class in countries around the advanced world.

    Every week a multitude of smaller developers abandon their projects because Councils’ compliance costs and development contributions make the projects unviable – even if the land were free. And it’s not.

    The New Zealand Institute of Economic Research says the ten-year norm for New Zealand is 26,000 new dwellings built per year. Statistics New Zealand reported only 16,000 dwelling consents issued in 2009. The NZ Property Investors Federation says we are building only 7,000 dwellings a year.

    Some say the Property Investors Federation figures are too low given that Statistics New Zealand’s figures for the year to date suggest we shall issue between 13,000 and 11,000 consents this year, and that the “slippage” between consents and finished dwellings cannot be that great.

    However, this is rather like wondering whether you are driving towards a concrete wall at 100 mph or only 80 mph.

    Any current year estimates confirm we are on a slippery slope to catastrophe.

    Unemployment, especially among young unskilled males is on the rise. Given these dreadful build-rates, should we be surprised, since these workers depend on construction for economic opportunity?

    And why don’t we recognize the cause and do something about it?

    First let’s look at the statistics. A Google search under “construction multipliers” turns up statements such as “building 1,000 houses generates 2,300 permanent full time jobs”. Another will say “Every dollar spent in the sector has a multiplier effect between 2.1 and 2.8.” These “low multiplier” statistics seldom spell out what is meant by “the construction sector”, and most are annual figures, and focus on “permanent full time jobs”. But the construction sector generates a multitude of short-term contracts that presumably slip through the net.

    These low “construction” multipliers are reinforced by a post-modernist ideology that tries to persuade us that housing is an unproductive activity that takes productive rural land out of production and hence undermines the economy. This is the old “primary” industry myth, further reinforced by the quaint animist notion that subdivision causes “death by a thousand cuts”. The surveyors are out there wielding their long knives and watching the Earth Mother bleed to death.

    Smart Growth planners claim the “urban sprawl” that grew around our cities during the post-war decades was the terrible price paid for housing the baby boomers and must be replaced with Smart Growth (or perhaps more accurately, Dense Thinking).

    We have lost sight of the fact that those prosperous decades were actually in large part the result of those large-scale suburban developments.

    US economists generally explain the post-war boom as being driven by the work force switching from weapons to washing machines.

    In New Zealand we used to attribute those golden years to micro-management of the economy, and to import licensing in particular. In reality, our real genius was probably introducing the capitalized family benefit which led to our own “Levittown builders” such as Fletcher Construction and Neil Housing.

    Back in the late sixties, while reading for my thesis in urban development economics, I read a report on the drivers of the post-war boom in America, during the twenty years from 1945 – 1965. Wildavsky’s Oakland Project focused on behavioural analysis rather than econometrics.

    The authors concluded that the suburban development boom laid the foundations for the long-term development of the post-war American middle class.

    An equivalent thought experiment would now read something like this:

    • We begin with a clean greenfields site, presumably being farmed, or just open space of some kind.
    • A developer decides the land is well located for a new 1,000 lot residential development and hires consultants or staff to prepare an application. The process alone takes five to six years and provides unproductive employment for a host of highly paid professionals.
    • The project is then killed off by either the Council or the Courts.

    In a sensible world, as prevailed in the post war years, the project would move on to the next stage:

    • The land development teams move onto the site and start the final surveys, road-building, drainage and stormwater schemes, landscaping, and street-crossings, all required before the builders drive their first profile-pegs into the ground.
    • Then teams of contractors start building the houses, which will have been designed by architects, draughtsmen or architectural designers, and then processed through a simple consenting procedure.
    • The teams of carpenters, glaziers, plumbers, painters, roofers, stoppers, electricians and plumbers all move in to finish the houses ready for occupancy. A gang of maybe ten drain-layers could lay the drains for the 1,000 houses over a five year sales-and-build period – say 20 contracts a year.
    • These teams use products and materials cut from forests, mined from quarries, processed in mills, or produced in factories, or recycled products, all requiring employed labour.

    So after a few years the 1,000 homes may be built and occupied. The analysts in the sixties suggested the 1,000 houses would generate say 5,000 direct contract-jobs over those early years.

    However, they recognized that the real economic activity would continue for another fifteen years or more. The same happens today.

    • As the families move into the houses they buy kitchen equipment, drapes and light fittings, bookshelves, plasma TVs, computers, artworks and wine cellars and so on.
    • The owners lay paving, build decks, plant gardens, and landscape the property.
    • The gardens require lawn mowers, chain saws, hedge trimmers, nursery plants, and barbecues.
    • Then up go the Gazebos, the dog kennels, the play houses, the extra rooms, and so on.
    • And then come the swimming pools, spa pools, home offices, sleep-outs, and solar heaters.

    Many of these improvements are produced by the “sweat-equity” of the DIY owners and are a major means of increasing household wealth and well-being. They arealso a potent form of saving, provided the owners are investing in tangible improvements and not over-priced land.

    These suburban on-site improvements go on forever. Consequently, even today there are about 80,000 certified “alterations” a year in New Zealand – and many more that don’t get near a permit.

    All these activities create jobs for the people who make the spa pools, the plasma TVs, the gardening tools, the cars, and the Gazebos.

    After several years from start up the properties are likely to require a gardener once a week, and maybe a housekeeper one or two days a week, and baby sitters, and whatever else the modern family needs to manage its work-life balance. These are the on-site ‘jobs’, but the families also need teachers, doctors, day-care providers, retail staff and so on and so on.

    The sixties report concluded that every 1000 houses would generate a total of 40,000 contracts and jobs. Which seems outrageous until you divide the 40,000 by the fifteen to twenty years, which comes back to the multipliers of 2.0 to 2.6.

    The sixties thought-experiment reminds us that by driving our residential build-rate from 24,000 a year to a no more than 13,000 a year, and probably much fewer, we are turning off the boiler that regenerates our middle class.

    It also explains why an economy with a low “build-rate” is unlikely to enjoy full employment.
    Those suburbs were not “a sad price to pay for our post war housing” but were the economic driver of “the long summer of content” so well described by Bill Bryson in “The Thunderbird Kid.”

    So why are we allowing our institutions to destroy the ability to regenerate our own suburban middle class?

    Whatever happened to genuine sustainable development? Sustainable for middle class people and families too.

    Owen McShane is Director of the Centre for Resource Management Studies, New Zealand.

    Photo by pie4dan

  • China’s Sliver of a Housing Bubble

    Few finance issues have received such a wide range of opinions among financial experts than the “housing bubble” in China. This is an issue of international importance because what happens in what is now the world’s 2nd largest economy affects the rest of the world.

    Differing Views: There are frequent reports of excessively high purchase prices on new housing, which when compared with measures of average household income make it appear that China has the highest house price to income ratios in history. Andy Xie, a Shanghai economist formerly with Morgan Stanley sees a huge housing bubble, which he expects to burst. Stephen Roach, chairman of Morgan Stanley Asia denies there is a bubble, claiming that there is sufficient demand from the continuing migration to the cities for the housing market to be healthy.

    I have been reluctant to weigh in on the debate, simply because there has been insufficient data available to calculate inferior housing affordability measures (such as average price to average income), much less the data that would permit Median Multiples to be calculated. (The Median Multiple is the “middle” house price divided by the “middle” household income and is optimal for measuring middle income housing affordability).

    The problems in assessing China’s housing affordability have been manifold:

    • There has been virtually no median household income data.
    • There appears to be no data available on the median house price

    This means that it is impossible to calculate the Median Multiple.

    Housing Occupancy in Urban China

    Having visited all but two of China’s 20 largest urban areas and traversed them, east to west and north to south from the countryside to the countryside (as I do in obtaining photos and impressions for my “Rental Car Tours“), however, two things are obvious.

    • New high-rise housing is being built at a furious pace in the largest urban areas.
    • Nonetheless, the volume of this new housing pales by comparison to the lower rise, older housing that was built before the present boom (which appears to have started in the 1990s). It is clear that the vast majority of people do not live in the new high rise buildings.

    Nonetheless the press has been filled with absurd reports to the effect that there are 65 million empty housing units in China. The absurdity of this now discredited number is illustrated by the following.

    (1) All of China’s urban areas with more than 500,000 population, where much of the new high rise housing has been built, have less than 300 million people. At the average household size, this means there are no more than 100 million households. In such an environment, 65 million empty units would stick out like a sore thumb. They do not.

    (3) 65 million vacant units is more houses than have been constructed since 1990.

    The New National Economic Research Institute Data: Finally, however, some clarity may be being brought to the issue. Credit Suisse sponsored groundbreaking research by National Economic Research Institute (NERI) of the China Reform Foundation in Beijing, which was led by Deputy Director Dr. Wang Xiaolu. Dr. Wang’s principal contribution is to show that household incomes are considerably higher in China than official statistics indicate. This “grey income” or “hidden income” includes bonuses paid by local governments, payments to public officials, revenues from land development and other sources of income that are not reported in official data and amounts to 90% more than reported figures (report (Analyzing Chinese Grey Income, published by Credit Suisse). In the top decile (top 90-100% of household incomes), grey income added 200% to reported incomes, while in the second decile (80%-90%), grey income more than doubled reported incomes. Buried in the NERI report is median household income data and average multiple housing affordability indicators that are the best information yet made available.

    China’s Average Multiple: Credit Suisse analyst Jinsong Du takes the NERI further to calculate housing affordability indicators that are far below the claims about the Chinese housing bubble. The average (mean) house price was 4.0 times the average disposable household income in 2008, after accounting for “grey income.” Based upon the national ratio of gross income to disposable income (from the China Yearbook), this would indicate an “average multiple” (average house price divided by gross average household income) of 3.7. This is similar to the US average multiple figure of 3.4 (Figure 1) in the same year (2008).

    China’s Median Multiple? This leaves the question of the Median Multiple. There is still no available median house price data. However, it is clear that the new housing is largely irrelevant to median house prices. According to data in the China Yearbook (Table 5-42), only 13% of the 31 million new houses were affordable to lower and middle income people (Figure 2). The new luxury units, with their widely touted prices, remain a minority of the houses, and, as a result, none of these can be the “middle” or median price

    In fact, the median priced house could be of a design similar to a Danwei (live-work unit) type design built before 1990. This is the type of housing that any walk or drive through a Chinese urban area will demonstrate to be dominant (and which is illustrated in the photograph above). There are huge disparities in both house prices and incomes in China. It would not be surprising for China’s Median Multiple to be similar to its average multiple, as is the case in the United States.

    Further, there is a huge difference between the US bubble and the Chinese bubble. In the United States the bubble drove up prices across all income spectrums in the impacted metropolitan areas. It burst largely because middle income households had taken on debt they could not afford. In China, the bubble may be limited to the top of the income scale, the very households that NERI finds are making two to three times as much as the official reports indicate.

    China’s Sliver of a Bubble: None of this is to suggest that house prices at the top of the market are not high. One of America’s leading housing economists, Joseph Gyourko of Wharton, along with Jing Wu and Yongheng Deng found that residential real estate auction prices rose 800% from 2003 to 2008 in Beijing (Note). Recently the government has taken action to cool the high end of the market and to encourage development of more housing for middle and lower income households. At the same time, the Gyourko research team found that new house prices had fallen relative to household incomes in Chengdu, Wuhan, Tianjin and Xi’an, all urban areas with more than 4,000,000 population.

    To accurately assess housing affordability it is necessary to have complete data. Housing affordability cannot be assessed in London using data from Belgravia, nor will Upper East Side data tell an accurate story about New York. The same is true in China. Stephen Roach said that China has a “sliver of a bubble.” That’s what the data seems to show.

    ——————

    Note: This annual rate of increase is approximately the same as was experienced in per acre government land sales in Las Vegas and Phoenix before the peak of the bubble (both urban areas are tightly ringed by “virtual” urban growth boundaries composed of government owned land).

    Wendell Cox is a Visiting Professor, Conservatoire National des Arts et Metiers, Paris and the author of “War on the Dream: How Anti-Sprawl Policy Threatens the Quality of Life

    Photograph: Median priced (?) flats in Fushun, Liaoning (photograph by the author)