Category: Urban Issues

  • A Summary of the Analysis and Motivators of Growth in the Austin – San Antonio Corridor

    This essay is part of a new report from the Center for Opportunity Urbanism titled “The Texas Way of Urbanism“. Download the entire report here.

    A new economic corridor is emerging in the center of Texas. Hays and Comal Counties are part of the Austin and San Antonio metropolitan areas respectively. But they are not merely suburbs capturing overflow from larger cities. They are becoming part and parcel of an emerging 80-mile long economic corridor between San Antonio and Austin, along the I-35. In the process, this region centered around San Marcos and Hays County, is emerging as a hub in its own right.

    This new corridor is beginning to resemble another Texas style “metroplex” between Dallas and Ft. Worth. It is a development that can also be compared, in some aspects, to other growth corridors, such as the San Jose to San Francisco strip, the Raleigh-Durham area and the Wasatch Front stretching from Ogden through Salt Lake City to Provo.

    Texas State Demographer Lloyd Potter foresees an additional 1.5 million people in the corridor by 2030, a nearly 34 percent jump. In Hays and Comal counties, the state projects between 69 and 44 percent in population growth during that period. “Over the next 50 years, Austin and San Antonio will become a single mega-metro area,” Austin Mayor Steve Adler says. “The corridor in between will be the first reflection of this coming future, providing greater connectivity to serve the increasing interdependence and joint economic potential as the two cities grow together.”

    As occurs in many emerging regions, the Austin-San Antonio can be considered multi-directional, extending to and from both larger cities, but also from the emerging hub around San Marcos.

    The San Marcos segment of the Corridor is already more than a bedroom and retail community. Amazon decided to build an 855,000 square foot fulfillment center in San Marcos (Hays County) that will eventually employ 1,000 people. Sysco Corporation opened a distribution facility in New Braunfels (Comal County) that employs 650 people. More importantly, Texas State University in San Marcos, with nearly 40,000 students and a growing research profile, is anchoring an emerging high tech base for the corridor.

    Something big is starting to happen in this once rural region of Texas. This report is divided into three sections that explore – the what, the why, and the future. The best predictor of the future is usually what has happened in the past, let us begin there.

    Dimensions of Regional Growth

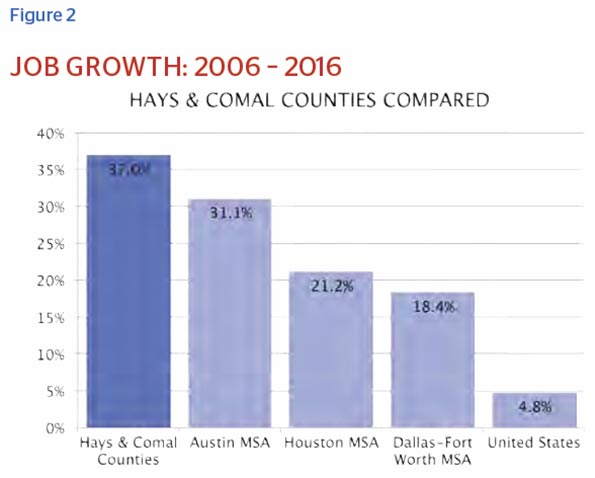
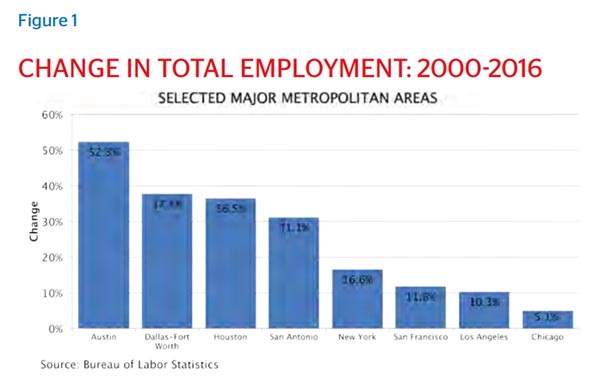
    The rate of growth in Hays and Comal Counties is exceptional, even by the standards of Texas. They are far outpacing the nation in both population and jobs, and growing at twice the rate of Texas as a whole. The two counties exceed even the rest of metro Austin, which has historically been among the leaders in job growth nationally. Three of the 25 fastest growing counties in the country are located in the Austin-San Antonio Corridor.

    The table below highlights the dimensions of this very rapid growth.

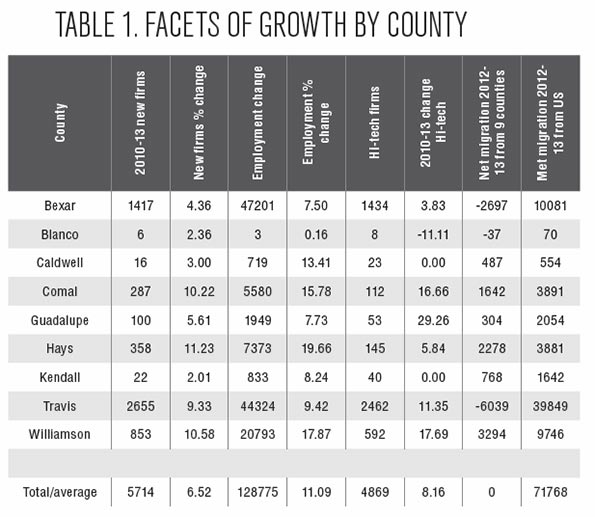
    Employment Growth. There has been a pattern of positive employment growth in all counties, with Hays the leader followed by Williamson then Comal. The entire corridor is among the national leaders in job creation, out-distancing not only the nation but Texas as well.

    New Firms. We see more new firms in all counties, with the highest percentage growth in new firms occurring in Hays, then Williamson and Comal counties. The definition of new firms used here includes opening of new branches or plants by existing firms that operate multiple establishments.

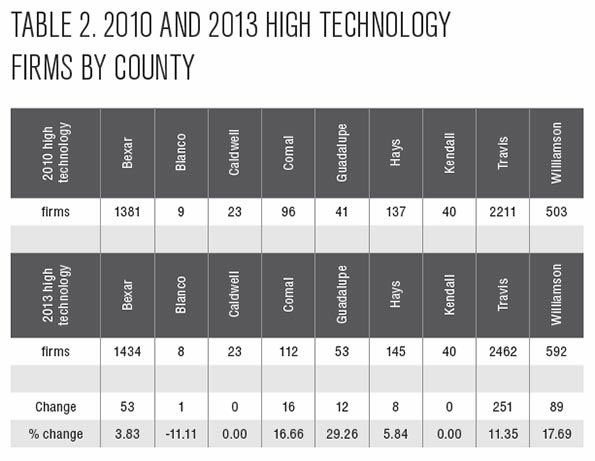
    High-Tech Firms. Growth of high-technology firms occurred in 6 of the 9 counties, with Guadalupe the leader in percentage terms followed by Williamson then Comal and Travis counties.

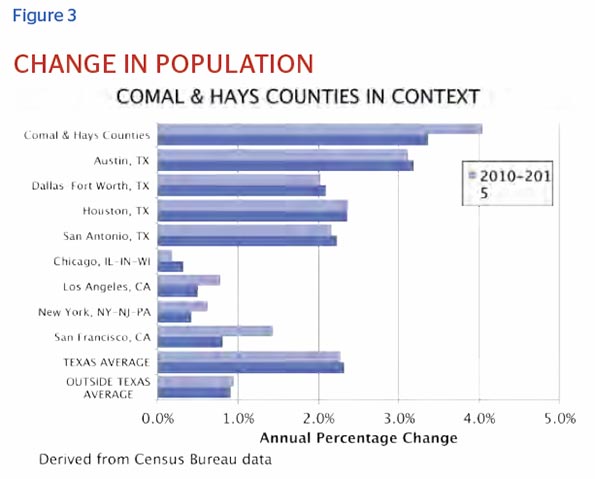
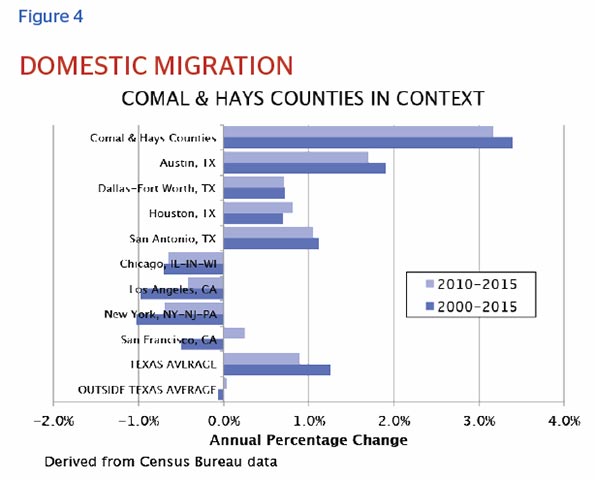
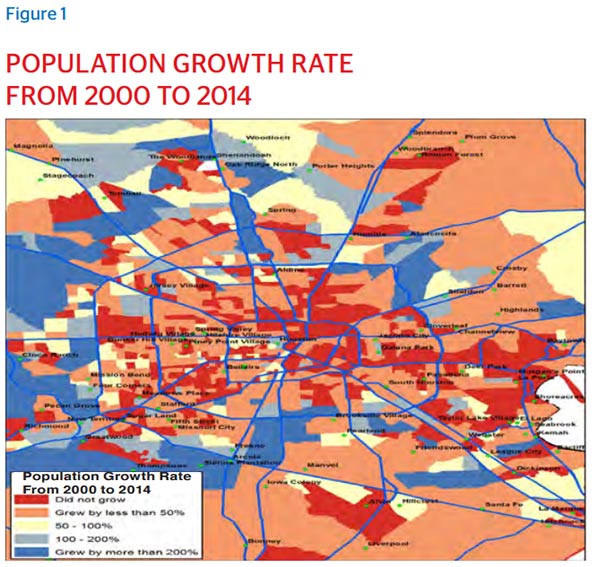
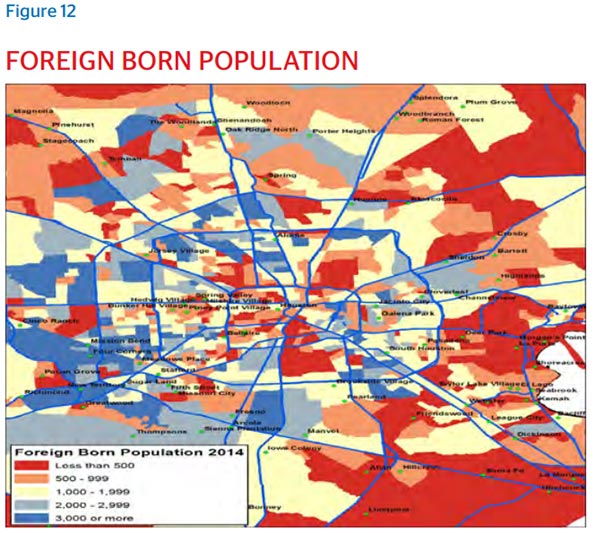
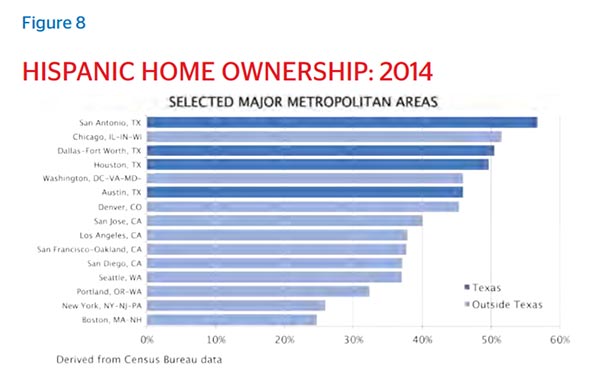
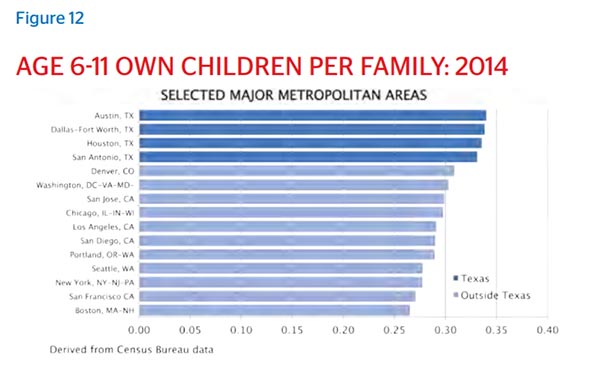
    Population. The entire San Antonio-Austin corridor has some of the most rapid growth in the country, as we can see in the first slide. The region also contains many of the fastest growing counties not only in Texas but the country.

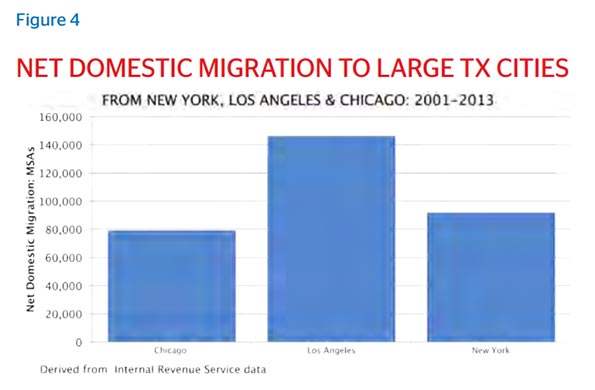
    Migration. Williamson County gained the most population from those living in the nine county region, followed by Hayes and Comal. Overall the entire Corridor has experienced large domestic in-migration, well above Texas averages, and even more so in comparison with large metropolitan areas like New York, Los Angeles and Chicago.

    The following sections provide more detail on this out-sized performance.

    Industries Driving Regional Employment Growth

    Employment growth has been broad across several industries, with the fastest growing industry being Electronic Shopping and Mail-Order Houses. Another cluster of fast growing industries are private (not public) firms involved in education and training (Elementary and Secondary Schools, Other Schools and Instruction, Technical and Trade Schools, Business Schools and Computer and Management Training). This does not include the significant role played by Texas State University in education related to business and computer management and engineering.

    This job growth, of course, has been driven by population growth. In terms of location quotient, the area remains much stronger in lower-end service industries. For example, Hays and Comal counties have 26 and 16 percent of employment in retail industries compared to only 13 percent nationally.

    But this appears to be changing, as evidenced by the growth of key “export” industries — that is goods and services largely consumed elsewhere. This includes key manufacturing fields, such as Industrial Machinery, Motor Vehicle Parts, and Metalworking Machinery. Overall the area is enjoying a manufacturing boom that far exceeds the national average.

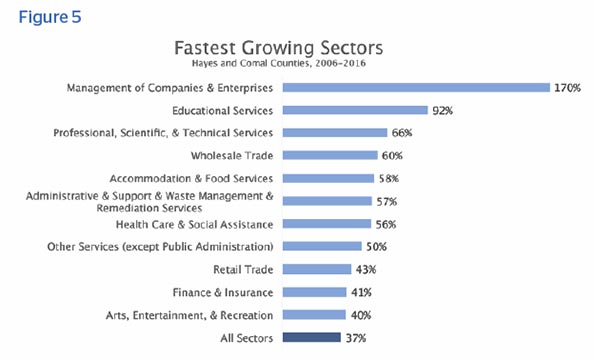
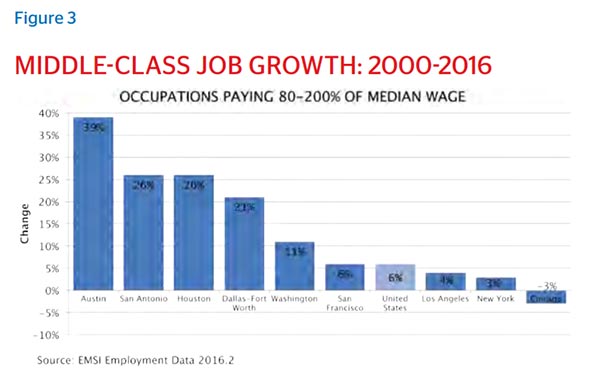
    This growth is also evident in several key service industries such as Management Services, Educational Services, and Professional, Scientific and Technical services. Particularly critical has been the logistics and wholesale industry, which serves not just the local economy but the entire regional and nation, with the massive new Amazon facility representative of this type of growth. Although much of the region’s growth has been in traditionally lower-wage service industries, the fastest growing sectors tend to be higher wage, information fields like management of companies and enterprises, educational, professional, scientific and technical services.

    Is a High Technology Corridor between Austin and San Antonio Emerging?

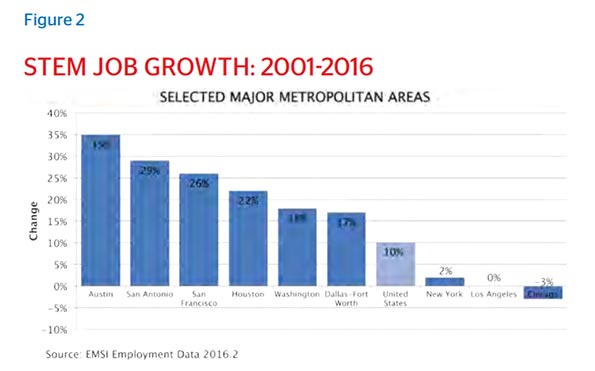
    Located between the high-tech hub of Austin and the emerging one centered in San Antonio, the region between the two is also showing growth in high-tech firms, as show in table 2 below.

    The most rapid growth has been in Basic Chemical Manufacturing, Software Publishers, Computer Systems Design and Related Services, Commercial and Service Industry Machinery Manufacturing, Scientific Research and Development Services, and Pharmaceutical and Medicine Manufacturing.

    The high-technology industry with the largest number of establishments was Computer Systems Design and Related Services, consistent with the reputation of Austin as an emerging leader in this area of economic activity. Architectural, Engineering, and Related Services had the second largest number of establishments, followed by Scientific Research and Development Services, Oil and Gas Extraction, and Software Publishers.

    The total number of firms in Hays and Comal remains much lower than in the far larger Travis and Bexar Counties, but their growth shows that the San Marcos Corridor segment is already participating in the regional high tech cluster, with potential future upside from its growth.

    If the region is to develop into a larger high tech center, Texas State University will play a vital role in powering that transformation as it continues to expand its research reputation and the funding that goes with it. Texas State has already helped launch an important tech industry venture with the establishment of the Science, Technology and Advanced Research (STAR) Park which sits on 58 total acres dedicated by Texas State for future expansion. Executive Director Stephen Frayser describes the park as an accelerator, now helping eitht for-profit companies to market, including three student startups. STAR One, the first building, broke ground with 14,000 square feet, but filled up quickly. Frayser says, “We have had to expand twice since opening in November, 2012 and will have 36,000 square feet operational by September 1, 2016.”

    How the future growth of Texas State, its research funding quest, and initiatives such as STAR Park play out will do much to determine the degree to which San Marcos’ high tech ambitions take off.

    Population Growth and Migration

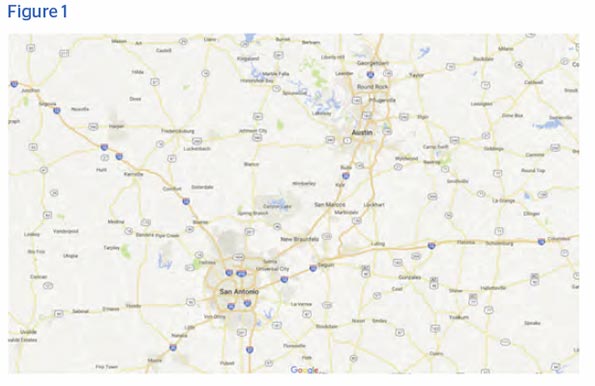
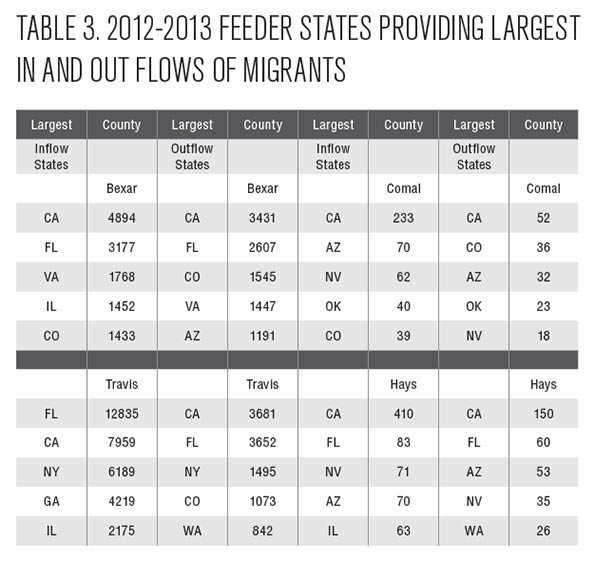
    People are an increasingly critical raw material for economic growth in San Marcos (Hays County) and New Braunfels (Comal County). Overall Hays and Comal have enjoyed among the fastest growth rates of any counties over 100,000 in the nation, easily outpacing even the torrid growth experienced by Austin and other Texas cities. The following map tells us the regions and feeder states from which Hays and Comal Counties have been drawing net migration.

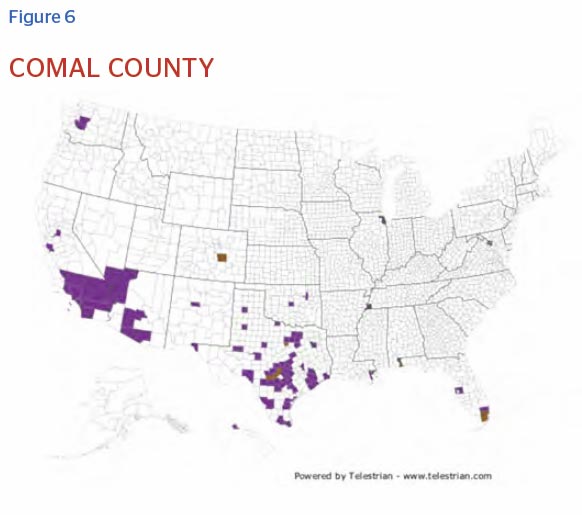
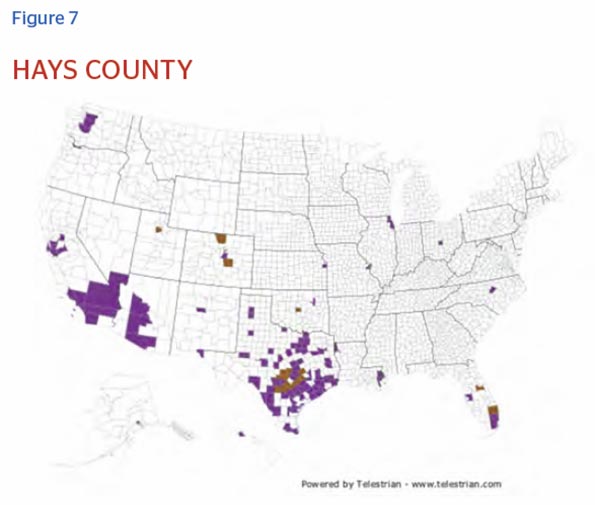
    Outside Texas, California was the largest source of in-migration and also the largest destination for out-migration. (In the case of Travis County, California is the second largest source of in-migration with Florida being first.) Focusing on California and Florida, we see total net gains from California equal to 6,182. In the case of Florida, we see total net gains equal to (9,776 during the 2012-2013 period.

    Explaining Regional Growth: A Geographically Advantaged Region

    What accounts for the growth of the San Marcos Corridor? Three factors loom large: the region’s unique geographic advantages and exceptional quality of life that set it apart from other suburban regions, and the high quality public policy environment of Texas.

    Just as Dallas-Ft. Worth benefitted from being a highly multi-polar “metroplex” that evolved from two formerly distinct urban areas, a similar (if smaller scale and more nascent) effect is taking place between Austin and San Antonio.

    Dallas and Ft. Worth are 33 miles apart. Austin and San Antonio are 80 miles apart. Despite the greater distance, much of the I-35 corridor is already developed between the two. It makes logistical and financial sense to locate some facilities, such as Amazon’s fulfillment center, in the San Marcos Corridor segment to easily serve both markets.

    The same effect applies to people too. Those who live in the corridor have the ability to commute to either major city to work, giving them access to more potential employment opportunities. San Marcos is about 30-45 miles from downtown Austin or San Antonio – a long but doable commute – which is shorter than in many suburban areas. However, in both Austin and San Antonio, there are many jobs located in suburban areas that are closer to San Marcos.

    A look at job growth by occupational category reveals the Hays and Comal advantage. Nationally, the largest 21 broad occupational categories account for one third of all employment. In Austin and San Antonio, 21 broad occupational categories (not necessarily the same) also account for around one-third of all employment.

    Of these 21 categories of jobs, 16 were in common to Austin and San Antonio, and the percentage change in these types of jobs were compared for Austin and San Antonio. Somewhat remarkably, 8 of the 16 job categories show a pattern where either Austin or San Antonio has higher than national employment growth while the other city has lower than national growth.

    This may explain the attraction of Hays and Comal counties where residents can commute to work in either metro area. In the face of jobs requiring specific skills disappearing in one city, workers find new jobs appearing in the other city. They simply need to commute to a new job in the other city, rather than being forced to move.

    This effect is magnified for households with more than one worker. One spouse can work in Austin, the other in San Antonio. Outside of pricey Austin neighborhoods, inexpensive suburban housing can be found throughout the Corridor.

    The Quality of Life Advantage

    Perhaps nothing drives growth in the region more than the quality of life offered by the Corridor. When we asked several business leaders what brought people here it wasn’t too long in the conversation before the discussion turned from the tangible reasons to the intangible, the big intangible being quality of life.

    Dan Stauffer, Vice President of Marketing/Real Estate of McCoy’s Building Supply (which moved its headquarters from Houston to San Marcos decades ago) was quick to bring up the quality of life draw that Austin and San Antonio has for people who move to the area. Again the geographic advantage of the region is key. Austin and San Antonio are culturally very different cities; residents of the San Marcos Corridor visit both and enjoy all they have to offer – then come home and live in the relative peace and tranquility of Central Texas.

    The overpowering quality of life factor in the Corridor is the Texas Hill Country. Bordered west of the Austin/ San Antonio Corridor the Hill Country is immense and very unique. It covers 11,111 square miles, offering plenty of recreational options including tubing opportunities in the Guadalupe River (Comal County), The Blanco (Hays County) and a lot more. Overall the elevation goes from about 510 feet above sea level, just east of San Marcos, to 853 feet in Wimberley to its highest elevation of 2,460 feet further in.

    The Hill Country’s attraction ranges from residents and CEOs who want to move their company to be close to their ranch full time, to city dwellers who have second homes they visit to get away from it all. The Wall Street Journal’s recent article describing a “land rush for the rich” in the Hill Country testifies to its red-hot appeal.

    Near New Braunfels is the Town of Gruene – which features one of America’s oldest Dance halls – Gruene Dance Hall (established 1878). It attracts over 1.2 million guests per year according to Rusty Brockman, Economic Development Director of the Greater New Braunfels Chamber of Commerce. Many artists – legends such as Chubby Checker, Lyle Lovett, and Willie Nelson and relative newcomers like Kevin Costner have performed there according to the Gruene Dance Hall website.

    The Texas Policy Advantage

    Although the region has generally outpaced other Texas cities in terms of the growth, the area’s emergence has much in common with the same things that have driven the growth of other Texas cities.

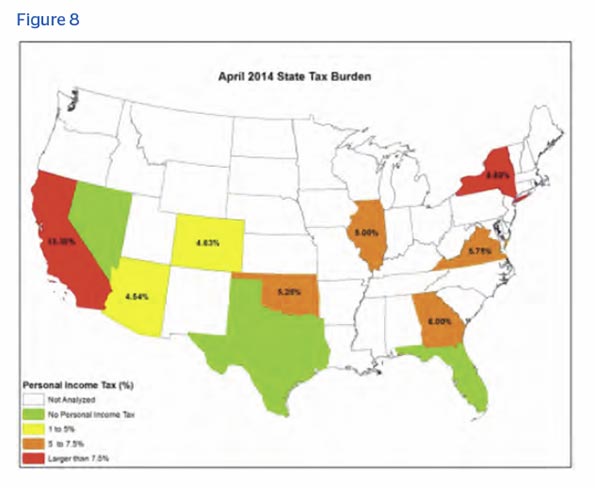
    There are a unique set of conditions that exist in both Texas and the emerging Central Texas Corridor which do not exist in very many other places. We’re not saying that they individually don’t exist throughout the other 49 states, but together this complete set of free market oriented set of rules and tax rates would be hard to find in too many places. These include being a no income tax state, a right to work state, and having biannual legislative sessions that limit the opportunity for regulatory mischief.

    These reasons provide a base of attraction for businesses and people to consider Texas – and the Austin – San Antonio Corridor – to relocate, expand and grow.

    Source: Tax Policy Advantage, 2015

    Texas also does not impose a traditional corporate income tax, though it does impose a modified gross receipts tax, commonly known as the Margin Tax. However, in 2014, this rate was only 0.975%.

    When doing the math, you can see that individuals and businesses coming from the area’s large feeder states can look forward to keeping more of their own money – a worker or investor from California gets a raise of 13.3% for starters, not to mention much lower property prices. The pretax incomes in some feeder states may be higher, but will in most cases be lower once tax burdens are accounted for.

    Overall, Texas’ tax climate is ranked 10th by the Tax Foundation.188 California, the state sending the most people to the area, ranks 48th. Other key feeder states to the region also score lower than Texas, include Colorado (18th), Illinois (23rd), Arizona (24th), Virginia (30th), Oklahoma (33rd), Georgia (39th) and New York (49th).

    Beyond low taxes, Texas also has a regulatory system that’s friendly to business and housing development. In part this comes from a state legislature that meets only once every two years. Only four states still do this (the others are Montana, Nevada, and North Dakota). The legislatures of every other state meet annually.

    A biannual legislative session does not necessarily guarantee less burdensome regulations, though legislators do have fewer opportunities to regulate. But Texas’ biannual legislature is indicative of its business friendly mindset, which we see clearly in the output. This includes a right to work law, which prohibits employees from being forced to join a labor union.

    Even within Texas, the counties at the center of the Corridor maintain distinct advantages. One key advantage can be seen in such things as property taxes, which comprise the bulk of the tax burden in Texas. Hays and Comal counties, and their cities, offer favorable numbers that attract not only feeder states migrants, but feeder Texas cities and county migrants.

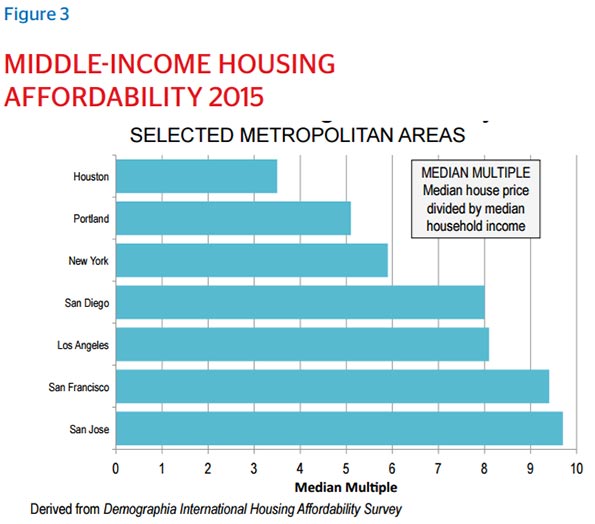
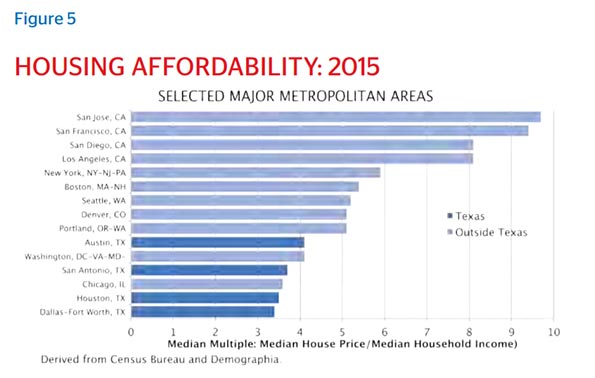
    Home prices constitute an advantage for most Texas cities, but even here, the Hays-Comal hub provides even a higher level of affordability. Low taxes and low housing prices make a very convincing case for companies, and individuals, coupled with strong job growth.

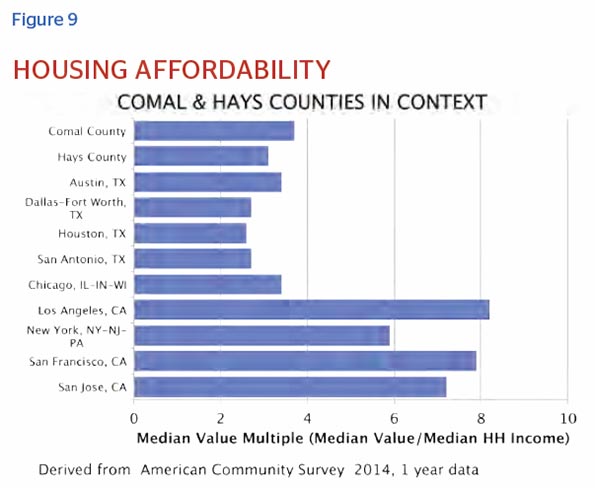
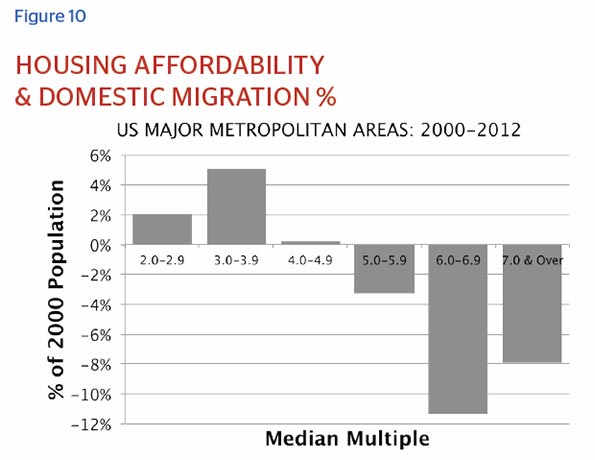
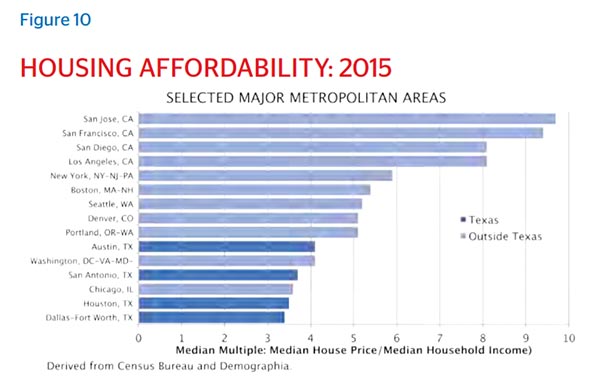
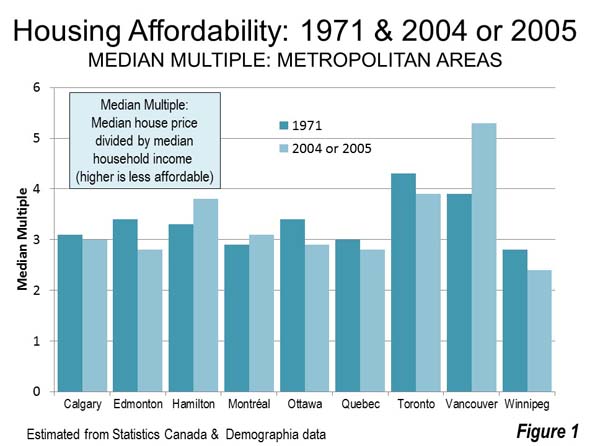
    Housing affordability has become one of the key determinants that attracts new migrants to a region. Those areas with high prices relative to incomes tend to lose migrants while those with lower costs — a median multiple of four or less — tend to attract newcomers.

    The Future of the San Marcos Corridor: A New Start for Texas?

    Lee Graham, President of Mensor LP, a market leader in pressure calibration that moved from Houston in 1978, suggests, “There’s a lot of similarities between what happened with Dallas and Fort Worth 30 years ago with all the communities that filled in between there…. It all developed and filled in.” He went on to say that there is more industry coming on line in the Corridor – even talks about the viability of a future regional airport in Hays or Caldwell County.

    Austin’s Culture Map prognosticated recently with the headline “Could Austin and San Antonio be the Next Dallas-Fort Worth?” They interviewed Austin entrepreneur, author, and speaker Gary Hoover who thinks that by 2050 the US Census Bureau will label Austin and San Antonio as precisely this kind of meg-metro area. He notes: “Just the natural growth of the two cities will cause them to collide”.

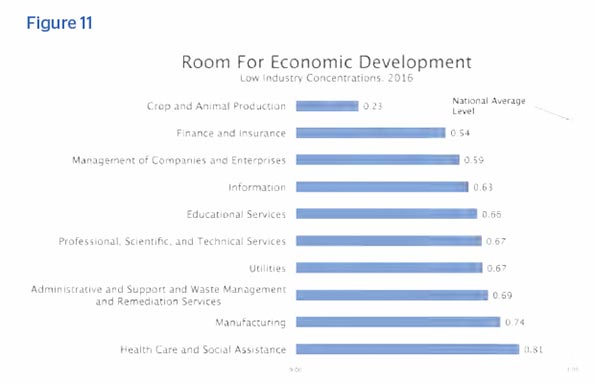
    However, for this vision to become reality, there needs to be greater focus on higher paying jobs in business and professional services, manufacturing and technology. Today Hays and Comal County employment is concentrated in construction (including residential and multifamily), retail trade, accommodation and food services and arts, entertainment and recreation -which has fueled the 37% job growth from 2006-2016. Yet, as we have seen above, the fastest growing sectors are in higher-wage, skilled and technical fields. Despite growth in these fields, the area still lags the national average in many key fields like information, management of enterprises, finance and professional, business and technical services.

    It is critical to note that the Corridor — particularly the Hays-Comal area — has only recently emerged from an essentially rural past. The key is to make sure that this pastto-the-future transition is tilted towards higher wage, high skilled sectors.

    Yet the past does not define the future. Silicon Valley was largely agricultural as late as the 1960s and Raleigh-Durham even later. In contrast Boston’s 128 beltway grew amidst the oldest industrial area in North America, and yet ultimately lost preeminence to the Valley.

    The formula that needs to be applied here is forward looking. An agrarian past is no barrier, and may even, to some extent, be an advantage to a region that wants to capture expanding growth from already strong metropolitan economies. The room to expand, lower cost of living associated with less developed economies, and a commitment to preservation of some open space could prove advantageous over the long term.

    Key Future Challenges

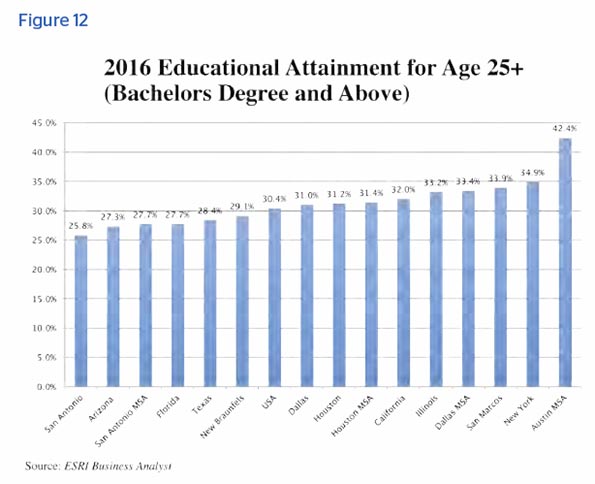
    However, just being at the right place at the right time may not be enough. Hays and Comal Counties face many challenges that must be overcome to achieve long-term success. Education has been a big part of all high-tech corridor successes, and Texas State University is certainly a piece of it. But there is also the challenge of training the existing workforce; although improving, the education level of the counties remains below national standards but competitive to the city and county comparisons nearby (see charts 1 and 2). Efforts to upskill the existing workforce will be critical in the future. Just as important is keeping up with infrastructure needs, particularly transportation.

    Perhaps the greatest vulnerability of the corridor lies with educational attainment. Although the Austin area is very strong, and well above the national average, the San Antonio region is lagging, as is New Braunfels. In contrast, in large part due to Texas State, San Marcos is above the national average in educational attainment. Expanding the area with high concentrations of college educated people seems a critical step to fulfilling the vision of a thriving Corridor between Austin and San Antonio, and the emergence of Hays and Comal as key players in the new regional configuration.

    Fortunately, there are positive efforts and activity in all three areas.

    The Greater San Marcos Partnership, according to President Adriana Cruz, has developed a five-year regional economic development strategy (Vision 2020) aimed at growing the region’s economy to attract the high skilled and wage jobs critical to the region’s future.

    Since 2006, ten new schools have opened in the four Hays County School districts: Hays, San Marcos, Wimberley and Dripping Springs. Three new schools are to open soon in both the Hays and Dripping Springs school districts.

    In Hays County the three workforce development players are Gary Job Corps Center (US Department of Labor), Workforce Solutions Rural Capital Area (multi county community partnership) and Austin Community College (ACC – Hays County falls into their 7,000 square mile service area). Texas State University was recently added to this roster having been named part of the Tech Hire community by the White House. TechHire is designed to train and develop a homegrown information technology workforce that includes ACC, Capital and Rural Capital Workforce Solutions, the City of Austin and the Greater San Marcos Partnership.

    In Comal County, the Central Texas Technology Center in New Braunfels is undergoing a 25,000 square foot expansion (opening for classes in 2016) that will double the size. This is part of the Alamo Community College District. Schools in both Comal school districts have been building new schools at a rapid rate. Comal County has had seven new schools come on line since 2006 with four more due to open within the next few years.

    Then there is the challenge of infrastructure and transportation. Two major highways serve the region. One is I-35, connecting San Antonio to New Braunfels to San Marcos to Kyle to Buda to Austin. The other is State Highway 130, a 90-mile toll way connecting Seguin to Lockhart to North Austin – and boasting an 85 miles per hour speed limit. Capacity is presently adequate, but future growth may put strain on these facilities. Failure to expand infrastructure has already produced traffic problems in Austin.

    There is an ongoing discussion of a commuter rail line connecting Austin to San Antonio that would serve San Marcos. The proposal suffered a serious setback when Union Pacific elected not to support it, and the history of new rail projects is not necessarily encouraging.

    If the area can continuously improve these critical must-haves – work force, education and transportation – the trajectory for the area seems to be very positive indeed. The corridor has many things that are likely to accelerate its growth in the years ahead: the continued growth of Austin and San Antonio, the attraction of the Hill County, Texas State University’s emergence and, the overall business climate of Texas. Of course many things could change but the future looks bright for now.

    When the future becomes the past, we’ll know if we’re right.

    John C. Beddow served as publisher of the Houston Business Journal from 1998 to last year. He successful turned the HBJ fromjust a weekly print product to a 24/7 digital first multi-platform business news channel. He serves on the advisory board of the Houston Technology Center and a recently started his own consulting company – Real Time Consulting, specializing in sales, marketing, media relations and project management. He lives part time in the Hill Country.

    Jim LeSage received his PhD in economics from Boston College and a Master’s degree from University of Toledo, where he was a faculty member from 1988 to 2005. Since 2006 he has been the Jerry and Linda Gregg Fields Endowed Chair in Urban & Regional Economics at Texas State University. He is a Fellow of the Regional Science Association International, Spatial Econometrics Association and Southern Regional Science Association, and a past president of the North American Regional Science Council. He has published over 100 scholarly journal articles, and is co-author with R. Kelley Pace of a 2009 book entitled Introduction to Spatial Econometrics. His research has received past support from the National Science Foundation, and he has given workshops on spatial econometrics in Austria, China, France, Germany, Portugal, Spain and several American universities.

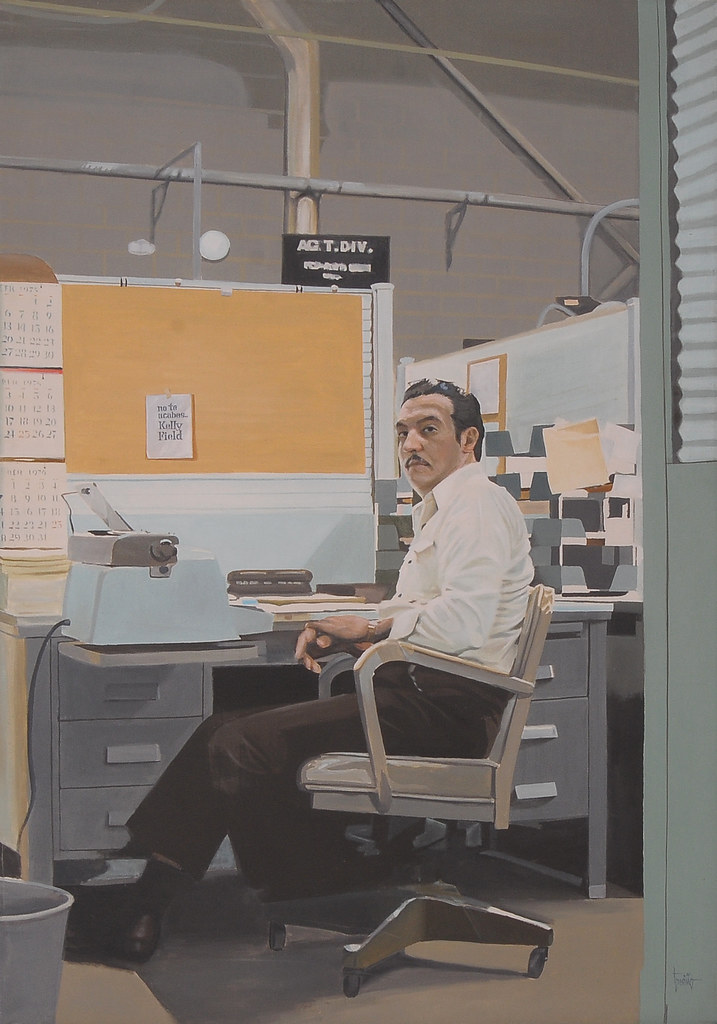
    Top photo: Larry D. Moore [CC BY-SA 3.0 or GFDL], via Wikimedia Commons

  • Military Employment and the Upward Mobility of Latinos in San Antonio

    This essay is part of a new report from the Center for Opportunity Urbanism titled “The Texas Way of Urbanism“. Download the entire report here.

    The long presence of military installations extending back approximately a century has led to the designation of San Antonio as Military City USA. The military continues to be one of the city’s major employers. The area’s six military bases — Fort Sam Houston, Lackland Air Force Base, Randolph Air Force Base, Brooks City-Base, Camp Bullis, and Camp Stanley — together represent one of the largest active and retired military populations in the country. A 2011 study found that the Department of Defense (DoD) had a $27.7 billion impact on the city’s economy; supported 189,148 jobs in the city; granted $4 billion in contracts locally; and provided support for 55,000 DoD retirees in the community.

    The military presence has touched the lives of countless of San Antonians, particularly Latinos in the city. Especially important was the role played by Kelly Air Force Base (AFB) (officially renamed from Kelly Field in 1948)—located in the city’s heavily Latino Westside. Former San Antonio mayor and former secretary of the Department of Housing and Urban Development, Henry Cisneros, who grew up on the Westside, recently recalled with affection that his own father as well as neighbors worked at Kelly.

    Nelson Wolfe, Bexar County judge and former mayor of San Antonio, notes that “For generations of Hispanic families, probably more so than anybody, …it [Kelly AFB] pulled them out of poverty, it gave them hope…. Kelly was the key factor in offering upward mobility for Hispanics.” Kelly provided opportunities for Mexican Americans who for generations had been excluded from opportunities for advancement. Employment at Kelly offered steady work and allowed Mexican American workers—many who were veterans—to buy a home and send their children to college.

    Local artist, Jesse Treviño, himself a veteran of the Vietnam War where he lost his right hand, aptly captures the image of the Latino worker at Kelly in his painting titled “No Te Acabes Kelly Field” meaning “Do Not End Kelly Field.” Sarah Fisch describes the Latino worker featured in the painting: “Here’s a guy with a government desk job, in his cubicle, manning his part of the federal territory, meeting you face to face. You’re forced—challenged—to meet his eyes, to meet this portrait’s subject on his terms. It’s a bracingly powerful image….”

    The 1995 Defense Base Closure and Realignment Commission (BRAC) ordered the closing of Kelly. In 2001, it became part of nearby Lackland AFB, with the majority of operations becoming Port San Antonio, an industrial business park.173 Port San Antonio today is housed on 1,900 acres and is home to 70 private and public organizations along with 12,000 employees working in the aerospace, logistics/ manufacturing, and government/military industries.

    The long-term impact of Kelly on the community and the city’s Latino population remains significant. For example, Arturo V. Perez, who passed away earlier this year, worked for Kelly AFB beginning in the mid-1950s. Perez rose through the ranks from supply clerk to senior engineer. Through his work at Kelly, he was able to make sure that all of his five children graduated from college. While working at Kelly, he earned his GED and completed electronic training, which opened an opportunity for him to work on radios and televisions in the evenings. After he retired from Kelly, Perez opened his own business—Arturo’s Barbacoa (barbacoa is a slowed-cooked version of barbeque), a very popular restaurant that he operated for twenty years.

    Manuel J. Jimenez, who passed away in October 2015, worked at Kelly AFB as an aircraft mechanic after returning from serving in the Philippines during World War II. His work at Kelly helped him provide well for his family. After 36 years, Jimenez retired and opened Pipo’s Lounge, a small bar that grew into a popular family-oriented dancehall.

    A generation of activists, like Luz Medina Escamilla, learned organizing skills at Kelly. Escamilla, who passed away in June 2014, had a successful career spanning four decades at Kelly AFB, rising from key puncher to system analyst. She was a community activist with a deep passion for issues concerning women and education, serving as a delegate at the first United Nations International Conference on Women, held in Mexico City in 1975. Escamilla mentored many local women activists, including María Antonietta Berriozábal, the first Mexican American woman elected to the San Antonio City Council (1981-1991).

    Military employment no longer plays as dominant a role in nurturing upward mobility for Latinos in the city. In their study of Mexican Americans in San Antonio and Los Angeles, Edward Telles and Vilma Ortiz observed a significant drop in military employment in San Antonio from 16 percent among parents in 1970 to 1 percent among their children in 2000. Still, according to the 2010-2014 American Community Survey, Latinos who are U.S. citizens are more likely to hold a federal government job in the San Antonio-New Braunfels Metropolitan Area (4.3%) than in the other three major metropolitan areas of the state (Austin-Round Rock, 2.3%; Dallas-Fort Worth-Arlington, 1.9%; and Houston-The Woodlands-Sugar Land, 1.4%).

    The legacy of military presence in San Antonio remains a critical element for the Latino community. For a generation of Latinos excluded from social and economic opportunities in the private sector, employment in the city’s military bases helped them attain a middle-class life for themselves and their families. Many Latinos in San Antonio today retain a familial link to the military bases in the city. This legacy remains, and constitutes an important part of the success story of this great American city.

    Rogelio Sáenz is Dean of the College of Public Policy and holds the Mark G. Yudof Endowed Chair at the University of Texas at San Antonio. He is also a Policy Fellow of the Carsey School of Public Policy at the University of New Hampshire. Sáenz has written extensively in the areas of demography, Latina/os, race and ethnic relations, inequality, immigration, public policy, social justice, and human rights. He is co-author of Latinos in the United States: Diversity and Change and co-editor of The International Handbook of the Demography of Race and Ethnicity. Sáenz regularly writes op-ed essays on social, demographic, economic, and political issues with his contributions appearing in such newspapers as the Austin American-Statesman, El Paso Times, New York Times, Rio Grande Guardian, and the San Antonio Express-News.

    Top photo: United States Air Force [Public domain], via Wikimedia Commons

  • Houston, City of Opportunity

    This essay is part of a new report from the Center for Opportunity Urbanism titled “The Texas Way of Urbanism“. Download the entire report here.

    Creative friction – unchaperoned and unprescribed – is Houston’s secret sauce.

    At a time when Americans’ confidence in all major U.S. institutions – minus the military and small business – has sunk below the historic average, and only about 20 percent of Americans say they spend time with their neighbors, one would expect pessimism to be universal. But come to the concrete sprawl just north of the Gulf and you’ll find a different vibe, one that other cities would do well to emulate.

    Of course things aren’t perfect in Houston, and the region is taking it a bit on the chin due to the drop in oil prices. But look over the mid- and long-term and the place has consistently lured people from around the country and the world.

    People continue to move to the flat and humid city in higher numbers than any other metropolis. According to the United States Census Bureau, from 2014-2015 metro Houston attracted 159,083 total and 62,000 net domestic migrants, topping the Census list on new metro area residents. Critically, the newcomers represent those population groups most telling of a metro’s future: millennials, immigrants, and families.

    “The American Dream is still alive here,” say those migrants, one after another. 81 percent of Houston residents rate the city as a good or excellent place to live, according to the 2016 Kinder Houston Area Survey. That’s up from 70 percent a decade ago. And despite the recent economic slowdown, 62 percent of Houston-area residents rated the local economy as “excellent” or “good.”

    Even the most conventional of popular figures have begun to figure this out. “Houston will surprise you,” wrote Katie Couric when she stopped here on a nationwide tour of up-and-coming cities. It was a more iconic statement than perhaps she realized. Outsiders often misperceive Houston as politically conservative and totally dependent upon the energy business, but the city consistently busts internal expectations, too. In Houston, you don’t have to drive far to run into unexpected languages, unexpected restaurants, a huge informal economy and just a pervasive – and bracing – sense of random.

    “It’s a cat city,” says Bill Arning, director of Houston’s celebrated Contemporary Arts Museum. He moved here in 2009 from Boston. “If you arrive without a tour guide, without a friend who knows the city, it’s hard to figure out where things are. There are no landmarks. Whereas Austin is a dog city – you know where the beautiful people are – Houston is a cat city. Its charms are there, but you’ve got to come to it. You’ve got to take a little time.”

    What sets Houston apart? What about the city makes so many residents confident they will find their version of the American dream here? If it is indeed a city of opportunity, what lessons might other cities absorb and weave into their own policies and cultural fabric? Through many interviews, data sleuthing and the everyday experience of living here, I found five traits that define Houston: affordable proximity, multipolarity, social deregulation, an active future orientation, and humility. What follows is a tour of the city that knows no limits.

    Affordable Proximity

    “There’s always been a haphazard nature to the city, from the beginning,” says Sanford Criner, a native Houstonian as well as vice chairman at CBRE, the world’s largest real estate firm. “Where Chicago – which was founded the same year [1836] – had an economic reason for being the day it was founded, Houston was a real estate play. These guys came down from the northeast – New York, Pennsylvania – and they bought some land and sent out flyers.

    “I’ve seen some [of the flyers], and they’re hysterical,” Criner continues. “‘Salubrious environment!’ said one. ‘Well-watered!’ said another. They’d have this picture that looks like a little Swiss valley, with chalets up the hill, and there wasn’t a house here! It was a scam. But that’s how we now date the founding of our city.”

    Where others saw only wilderness along the banks of Buffalo Bayou, Augustus Chapman Allen and John Kirby Allen saw promise, and convinced people to take a gamble and move. This rambunctious “come one, come all” attitude continues to define the city’s development, 180 years later.

    The city of Houston is famous for its no zoning policies, the fruits of which are visible in the hodge-podge of commercial and residential hubs evident on a first drive in from one of the two airports. The apparent haphazardness may dizzy outsiders, but for Houston residents it’s a gift that my colleague Tory Gattis calls “affordable proximity”: the ability to live near one’s place of employment while keeping the cost of living affordable. It’s a challenge that has become onerous in many cities, but one that Houston manages to tackle with surprising efficiency.

    “It’s definitely true that it’s easier to build things here than elsewhere,” says Criner. “We’ve been able to build things relatively inexpensively and rapidly that have generally benefited everybody.”

    Since 2010, Houston has expanded its housing stock to issue construction permits for 189,634 new units, paralleling the population growth. This is in sharp contrast to competitor cities such as New York, Los Angeles, Chicago and the Bay Area, where construction tends to lag behind population.

    Houston is uniquely able to create housing to meet demand. The populations in both New York City and Houston have grown significantly in the past six years, but New York, like many big cities, has not come close to meeting demand. A lot of this has to do with sheer land availability and willingness to expand outward, but Houston’s light regulatory touch has crucially allowed developers to be in sync with consumer need and preference, without the red tape that slows other cities’ building and adaptability. A key result has been a greater level of affordability, and of choice.

    In April of 2016, The Wall Street Journal highlighted groundbreaking research by Issi Romem, chief economist at real-estate site BuildZoom, showing that the cities that have expanded geographically have kept their house prices more affordable.

    According to the National Association of Home Builders/Wells Fargo Bank Housing Affordability Index, more than 60 percent of homes in the Houston metro area are now considered affordable for median-income families, compared with only 15 percent in Los Angeles, once ground zero for the dream of homeownership. According to Zillow, renters in New York spent 41.4 percent of their income on housing in 2015, whereas the share for their Houston counterparts was just 31 percent.

    The Demographia International Housing Affordability Survey provides ratings for all major metropolitan areas in the U.S., and Houston consistently ranks as more affordable than cities like Portland, New York, San Francisco and San Jose, all of which have more restrictive regulations.

    Houston’s housing is also diverse. Houston has become the national leader in new multifamily units, helping to preserve and expand access to urban living. At the same time, the Houston metro has led the country in new single-family houses.

    Availability of affordable land and a lighter regulatory environment allowing for outward expansion has made it possible for many to afford a residence near the city’s dispersed job centers. In addition, as City Observatory recently reported, a series of reforms adopted in 1999 shrunk the required residential lot size from 5,000 square feet to 1,400 square feet, enabling town home development in high demand areas proximate to jobs.

    Proximity to work is especially appealing to millennials, who have moved to Houston in droves. The U.S. Census Bureau showed a 25 percent increase in millennial residents between 2000 and 2013, with millennials currently making up 24 percent of Houston’s total population. Many of these new adults want to reduce their commutes, or even ditch their cars for the sake of enjoying a more seamless transition between professional and personal life. Houston offers this possibility across urban and suburban areas, the multipolarity of business centers providing flexibility to carve a nice triad of work, residence, and play.

    Despite the impression of endless freeways, Houston’s commute times are better than those in metros of comparable populations. One-way commutes were 28.4 minutes in 2014, according to the American Community Survey, making Houston the fourth best out of nine comparable cities.

    Houston also does very well on an international scale with respect to traffic congestion, according to TomTom in 2015. The region ranked fifth out of the 38 urban areas that have populations over 5 million.

    None of this suggests Houston lacks room for improvement in mobility, but it’s credit to the city’s decision to dramatically increase roadway capacity and arterial streets that it has managed to improve its ranking in traffic congestion while experiencing a huge increase in population. According to the Texas A&M Transportation Institute, in 1984 and 1985 Houston was ranked with the worst congestion in the country, even worse than Los Angeles. Now Houston is ranked 10th, even as it’s nearly doubled its population, from 3.5 million in the mid-1980s to 6.5 million today. Only Atlanta and Dallas can boast similar mobility improvements.

    Multipolarity and Economic Diversity

    Most Americans think of Houston as an oil and gas town. And while energy still undergirds much of the city’s economy, Houston boasts many other assets as well: the world’s largest medical center, one of the world’s busiest ports, the third largest manufacturing hub in the country, a booming technology sector and a wide range of small to medium-sized businesses, including a thriving informal sector of immigrant-run businesses. This has led to demand for labor at all skill and education levels, unique among the top ten largest cities.

    “Best Online Programs in 2016,” said U.S. News & World Report about the University of Houston. “Top Cities for Competitiveness to Attract Investment in Chemicals & Plastics,” said Conway about Houston in 2015. “Best Hospitals for Adult Cancer – University of Texas MD Anderson Cancer Center” said U.S. News & World Report in 2015. “Top Blue-Collar Hot Spots,” said Forbes in 2014. “Most Favorable Metro for STEM Workers [Nationally],” said WalletHub in 2015.

    Houston is no stranger to “Best Of” lists that today’s mayors scour. But what’s notable is the cross-sector nature of the superlatives. According to a June 2016 report from the Texas Workforce Commission, 20.3 percent of Houston’s workers are in Trade, Transportation and Utilities, 15.5 percent are in Professional and Business Services, 12.8 percent in Government, 12.7 percent in Education and Health Services, 10.2 percent in Leisure and Hospitality, 8 percent in Manufacturing and 7.4 percent in Construction.

    The city has learned from its mistakes. The 1980s, which saw a slump in oil prices much greater than that in 2015, bulged in profligate building and overconfidence. According to the Greater Houston Partnership, from 1982 to 1986, developers built more than 100,000 single-family homes, many of them without a signed contract from a purchaser. Even when the region lost more than 200,000 jobs, office developers continued to build, including adding more than 71.7 million square feet of office space while companies were laying off staff and declaring bankruptcy. Today, the office market is tighter, banking is better regulated and better capitalized, and few homes are built without a signed contract. Most importantly, the region is creating jobs that aren’t in energy, including in health care, business and professional services.

    Social Openness: A City for Everyone

    Houston is deregulated economically, but it’s of greater note that it’s deregulated socially. People come here from many walks of life and culture, and the relative youth of the city combined with its scrappy DNA means that there really isn’t a dominant Establishment, certainly not one that wants to block the efforts of ambitious newcomers.

    “If you talk to [old] Houstonians about social mobility,” says Sanford Criner, “they kind of give you this quizzical look. Like, ‘what do you mean?’ Like, ‘Sure, of course.’ It seems obvious.”

    This city’s always been a mixer; you just have to be willing to share what wakes you up in the morning. Marlon Hall is an African American filmmaker and native Houstonian who started Folklore Films, a documentary production company created to “tell better stories to our city about our city.” He and fellow filmmaker Danielle Fanfair have featured former Mayor Annise Parker, arts patron Judy Nyquist, internationally recognized musical artist DJ Sun and other community figures. As the Folklore Films crew has gotten better acquainted with Houston residents from across the social spectrum, Marlon locates the vocational “why” as central to the city’s currency.

    “Houston isn’t driven by who you know,” he says, “but by how you want to be known. It isn’t about what pedigree you have received, but about the possibilities you want to bring to bear.”

    This kind of invitation has attracted the motivated from all over the world, with the city now pulsating with 145 languages. An international city since the day it was founded, now more than one in five Houstonians are foreign-born, with the 2014 American Community Survey reporting that 63.9 percent of the foreign born population were Latin Americans, 25.2 percent were Asian, 5.1 percent were African and 4.6 percent were European. As of the 2010 Census, Greater Houston does not have a majority racial or ethnic group.

    People come to Houston seeking opportunity, and because they sense in the visible randomness the potential for surprise ingredients to leaven the traditions they’re bringing with them. This is as true for immigrants as well as domestic migrants, with the city’s celebrated restaurant scene born out of the unexpected merging of flavors from cultures that don’t typically mix. Underbelly’s Chris Shepherd, Bistro Menil’s Greg Martin and Lucille’s Chris Williams all cite Houston’s diversity as a major factor behind the city’s flavorful palate, in both story and succulence.

    “This is edible history,” says Chris Williams, the founding chef at Lucille’s, a restaurant that takes a modern approach to Southern classics. “The food that we do here pays homage to my great-grandmother, who was a chef and a pioneer and an American icon.”

    It’s not soul food, but Southern. With a rustic European style, and a multi-generational American story at the heart.

    “Like all chefs in [my great-grandmother’s] time, your style of food was defined by what was available to you. What you could afford to work with. The flavors that I grew up with…married with the techniques and the flair that I picked up working in Europe for four years. Everywhere from London to Lithuania. …I’m influenced by the simple rustic dishes – the ones about the culture, not the flashy ones. The perfect piece of fish fresh caught, served with good potatoes, great olive oil, fresh garlic, and a little bit of parsley.”

    Bistro Menil is another spot that takes a slice from Europe and re-interprets the classic dishes for Houstonians. Its patrons come from Rice University, the Medical Center, the Museum District and beyond, the attraction of the world-renowned Menil Collection standing just across the street. Inspired by the concept of cask wine, which head chef Greg Martin discovered on a trip to Rome, Bistro Menil relies heavily on relationships with cosmopolitan – yet locally centered – Houstonians.

    “I don’t want to compete with that dish that you had in Rome,” Martin says, aware of ingredient limits this side of the Atlantic. “I want to reinterpret it with more of a New American approach, with some fresh eyes on our market, using our ingredients. Our ingredients and produce come from everywhere…I work really closely with a local importer. We’ve been working together for 30 years. He brings in our duck legs from Canada, our jamón Serrano from Spain. He brings all of our cheese in from France, Italy and Spain.”

    It’s not just the food that shows Houstonians willing to work together across silos and lift up the local talent. “We have a very supportive gallery scene,” says Bill Arning, of the Contemporary Arts Museum. “Even the galleries that show a lot of major international and national artists, like the Texas Gallery and McClain Gallery, will not only show local artists, they’ll place them in the top collections in town. That’s unusual.”

    The social egalitarianism combined with a pervasive “show me what you got” curiosity creates something very unique. Hipster cocktail bars seem no more privileged than authentic Vietnamese restaurants than classic barbecue and the iconic Rodeo. The lack of zoning makes thoroughfares like Westheimer Road, which stretches for miles from the city center to the distant suburbs, an avenue of cultural mismatches: The New York Times’-celebrated Underbelly is sandwiched between three tattoo parlors, a Catholic guild clothing store and the latest in coffee-roasted curation. There are so many opportunities to mix with those different from you that only the snobby find themselves bored and excluded. Creative friction – unchaperoned and unprescribed – is Houston’s secret sauce.

    “This is a city that does not believe in censorship,” says Arning.

    Agile, Active, and Future-Orientated

    Houston is not Silicon Valley, but its entrepreneurial DNA is unmistakable, dispersed across many fields. The city emanates a conviction that people should have the freedom to determine their destiny, sometimes to the point of overlooking those that don’t have such clear vision, nor the resources and social networks to make it happen. The city is growth- and future-oriented, embracing change and risk. True to its namesake in Sam Houston – himself a failure before reinventing himself – Houston grants permission to fall hard.

    “Houston is the only town where a person with no prior experience in a particular vocation can get joint venture capital for something they’ve never done before,” says local arts patron Judy Nyquist in one of Marlon’s Folklore Films. “Simply by virtue of their commitment to their idea, and how it can make the city better.”

    This is true across sectors – for-profit, social service, and philanthropic.

    Ella Russell of E-dub-a-licious Treats was an African American single mom working for AT&T when a breakup with her partner caused significant financial hardship. Her two boys, then age 3 and 9, came home from school asking to bring in treats for a holiday party. Russell felt helpless, all disposable income had run dry. But she did find sugar, flour and eggs in her pantry.

    “I scraped up change to buy a bag of chocolate chips,” Russell recalls, “so I could make chocolate chip cookies. The kids took them in, and then I brought the leftovers in to work. My coworkers loved them, saying every future potluck would have to have my cookies.”

    Three years later, her friends urged Russell to turn the sweetness into a business.

    “I had no business experience other than what I knew working in corporate America,” Russell says. “I really winged it; I had no basis but the support of my friends.” In a couple years, she went from serving family and friends to delivering in seven different states.

    In the burgeoning scholarship entrepreneurship of the last decade, the work of Saras D. Sarasvathy of the Darden Business School at the University of Virginia stands out. She’s coined a term called “effectual reasoning” to describe the mindsets of master entrepreneurs, one that pairs well with Houston’s soil:

    Brilliant improvisers, the entrepreneurs don’t start out with concrete goals. Instead, they constantly assess how to use their personal strengths and whatever resources they have at hand to develop goals on the fly, while creatively reacting to contingencies. By contrast, [highly successful] corporate executives use causal reasoning. They set a goal and diligently seek the best ways to achieve it.

    Sarasvathy likes to compare expert entrepreneurs to Iron Chefs: “[They are] at their best when presented with an assortment of motley ingredients and challenged to whip up whatever dish expediency and imagination suggest,” she writes. “Corporate leaders, by contrast, decide they are going to make Swedish meatballs. They then proceed to shop, measure, mix, and cook Swedish meatballs in the most efficient, cost-effective manner possible.”

    If we could take her comparative study and extrapolate from it particular civic traits, you might see Chicago as the sort of personality for corporate leaders, Houston for the entrepreneurial. The city is rife with improvisers, fueled by a deep prioritization of human relationships, an affection for eccentrics and a perennial optimism that loves to build before over-planning. The fact that there are lots of open spaces to create, and fill, encourages new entrants into any kind of market, be it technological, artistic, or consumption-oriented.

    This goes well beyond profit-seeking ventures. The Chronicle of Philanthropy identifies Houston as one of the country’s most generous cities, ranking at #11 for giving as a percentage of adjusted gross income – three stops behind Dallas.

    “As [Dallas-Fort Worth and Houston] have each become centers of gushing economic production, and matured as communities, an energetic competition has grown up in their creation of impressive new parks, museums, hospitals, universities, and arts centers,” wrote Ari Schulman in the Fall 2015 issue of Philanthropy Magazine. “Burgeoning circles of local patriots wielding newly minted fortunes have dramatically changed the quality of life in both cities over the past decade or so.”

    This enhanced quality of life has involved a deeper renaissance in the arts, a proliferation in family-friendly green spaces, advancements in medical facilities and, increasingly, innovative educational ventures. Houston’s acclaimed Museum of Fine Arts is currently undergoing a $450 million redesign, two-thirds of that already raised with the help of giant gifts from pipeline entrepreneur Richard Kinder and money-manager Fayez Sarofim. Kinder and his wife Nancy have also given $30 million to a public-private partnership aimed at reviving a snaking bayou from a stagnant waterway to an attractive waterfront graced by 20 miles of hike-and-bike trails, canoe launches, playgrounds, art installations, and outdoor performance venues.

    “This kind of public-private partnership happens all the time,” says Criner. “In lots of other cities, philanthropic organizations tend to be run by the same group of guys that have been running stuff for a long time, and they treat them like their own turf. You don’t see that here at all. This is way more like, “if you can help, come on! What can you do? We’ll put you to work.”

    “We have a tradition of philanthropy that my colleagues in other cities [envy],” agrees Arning, of the Contemporary Arts Museum. “Privileged young people here feel they need to find their philanthropies early on. That is something uniquely Houston.”

    Humility and Cultural Accessibility

    Long considered the unattractive hothouse of the south, Houston has suffered from a long-running inferiority complex when comparing itself to other cities. Even since rising to the top of dozens of “Best of” lists in the last five years, the residue from generations of modesty remains.

    Before Marlon Hall was running Folklore Films, he and Danielle began something called the Eat Gallery, an incubator for budding chefs around the city that sought to turn food trucks into restaurants. In ramping up for this effort, they went around and asked Houstonians questions about where they found meaning, where they felt they fit, where they felt they made a difference. They discovered that people had low city esteem.

    “They’d go to a great ballet, and they’d be like, wow, this reminds me of Chicago, Hall recalls. “They’d go to a musical performance and be like, oh, this feels like New York. People were telling the worst stories to the city about the city.

    “So we said, what if we told better stories to Houstonians about Houstonians, featuring people that folks know and celebrate? But what if we began their stories with their brokenness, so that people would know that there’s something inherently broken about every beautiful person? So that’s what we did, that’s why we started Folklore Films. To raise the city esteem.”

    Folklore discovered that Houston is a city of new beginnings. When you move here, the past intrigues less than how you intend to exploit the future. Whether you’re an immigrant from overseas or a fellow American that’s left some entrenched failure behind, Houston pulses with a forward-looking frankness grounded in a humility shaped by whatever came before. This drive paired with an individual and corporate self-awareness defines the city’s character – culturally, spiritually and even economically.

    “There’s this at-homeness that people from Houston have,” Hall says. “When I think about people who have left Houston to do other things, like Beyonce, there’s this comfort to be who one is. She walks around with hot sauce in her purse – I mean, who else can say that from where else?”

    “There’s something about Houston that’s like…I’m not afraid to be who I am, even if it’s full of seeming contradictions.”

    “The collective body in Houston is significantly more adventurous than most cities,” Arning of the Contemporary Arts Museum says. “Both in use and collection. In most collection cities, you hear who supported or recommended the collection before going. Houstonians, because of their wildcat nature, [will try anything] they like.”

    Houston’s increasing diversity keeps the city vibrant and ever ready to accept change and innovation. There is no room for insularity because there is no homogeneity. Your ideas are constantly being chiseled and countered by the Other. No one has the luxury of feeling superior because everyone’s in a gem tumbler with folks not like them. It makes the city competitive, but not in a way that produces monopolies.

    “I think that Houston has come to this place where it’s a ‘My Space,’” says Marlon. People want to take ownership of their lives and creations here. “There’s a desire to own who you are in Houston, which is different from owning a business, a house a car.”

    Houston residents tend to be proud of their individual accomplishments, and feel an affection toward the place that allowed those accomplishments to happen. But there’s a recognition that success is the result of many different pieces coming together, usually organically and iteratively. The environment invites people to fulfill their individual destiny, and almost discourages any person or governing body to take credit for Houston’s successes as a whole.

    “I hesitate to say things like ‘I’m proud of Houston,’” Sanford Criner says. “What gives you the right to take pride in a place? Did you build it? Did you do it?”

    Challenges to Sustaining Opportunity

    Houston continues to beat the odds to this day. And while its adventurous impulse is what continues to draw people to Houston and make it the emblem opportunity city for 21st century dynamics and demographics, it must still be said that what you put into the world must survive. Houston is a much better place to live than it was 30 years ago. But will it continue on this trajectory, or even sustain the fruits of its triumphs?

    Houstonians recognize there needs to be a concerted effort to reform and improve Houston’s educational opportunities, its transportation and traffic infrastructure, and a more general care to respect tradition and an intensive effort toward more inclusive mobility. The city’s grown so big, so fast, it could inevitably buckle under its own weight.

    “We are not on track to make headway on a lot of the issues that are facing us,” says James Llamas, of Traffic Engineers, Inc. “We’re growing way faster than we’re adding transportation capacity or options, at the same time there does seem to be recognition that we need to do something and what we’ve been doing isn’t going to continue to work.”

    Despite precedent, massive infrastructure may not be the answer, especially given the shifting preferences of a younger population and the costs of maintenance. New mayor Sylvester Turner is considering expanding to two HOV lanes and providing express bus service. Others advocate for densification of the more traditional gridded neighborhoods that are far from holding their population capacity – but without adding infrastructure, and without pushing anyone out.

    And then there’s the perennial education challenges.

    “We are now in a different economy where education is critical,” says Stephen Klineberg, founding director of the Kinder Institute. “It never used to be critical, especially not in Texas. You made money by land – by exploiting all the natural resources you needed on the land. The great cattle, timber, oil. The source of wealth in the 21st century Houston, is knowledge. …If you don’t have education beyond high school, with the technical skills that allow you to get the jobs of the 21st century, and compete, you’re not going to make it. Texas hasn’t come fully to grips with it.”

    Conclusion

    In the last 20 years, Houston has cultivated a series of signaling mechanisms that continue to draw people into its orbit. It’s a welcoming city, supported by affordability and diversity. Majority opinion says “anything is possible if you’re willing to work hard,” a conviction increasingly on the decline in the rest of the country. And, crucially, it’s cultivated the conditions necessary for entrepreneurs to have a field day. “The assortment of motley ingredients” noted by innovation scholar Sarasvathy describes Houston in a nutshell, and the regulatory instinct has been to stay light, allowing imported imaginations to run experiments without interference.

    The city’s not beautiful upon first blush, nor does it offer the charm of pedestrian fancy that denser cities boast. But in an era of civic unrest, with many up and down the social spectrum feeling disconnected and robbed of agency, Houstonians can still shape their destiny. The city’s the clay; residents the potters. The wide range of home sizes and work-life arrangements makes Houston like the cowboy boot its Rodeo celebrates – adaptable to the needs of each life stage as residents progress through singleness, marriage, family and retirement. Residents are not trapped by the regulatory, financial or even social limits that other cities increasingly impose. The mindset is one of abundance, not scarcity.

    “This is the genius of this place,” wrote Cort McMurray in the Houston Chronicle in January of 2016, in a profile of an Iraqi refugee who had come to Houston with a B.S. in Chemistry, currently cleaning pools. “Houston will always be shambolic and stretched and not quite finished. We will never be the most beautiful city, or the most pedestrian-friendly city, or the most efficiently planned city: The heat and soul-sapping humidity, our adolescent fascination with cars and speed and shiny things, our perpetual craving for something new, all conspire against our best civic aspirations. Houston is a place to start over, and we do starting over better than any other city on the planet.”

    In an age of heightened political frustration, a sclerotic economy and shifting structural tectonics, it could be that the “starting over” ethos that Houston embodies is precisely what the country itself needs, and what other cities should seek to foster in their own policies and cultural climates. Innovation, reinvention and reinterpretation, after all, lie at the heart of the American genius.

    Anne Snyder is a Fellow at the Center for Opportunity Urbanism, a Houston-based think tank that explores how cities can drive opportunity and social mobility for the bulk of their citizens. She is also the Director of The Character Initiative at The Philanthropy Roundtable, a pilot program that seeks to help foundations and wealth creators around the country advance character formation through their giving. She previously worked at The New York Times in Washington, as well as World Affairs Journal and the Ethics and Public Policy Center. She holds a Master’s degree in journalism from Georgetown University and a B.A. in philosophy and international relations from Wheaton College (IL), and has published in The Atlantic MonthlyNational JournalThe Washington PostCity Journal and elsewhere.

    Top photo: Photo by Chris Doelle, Licensed under CC License.

  • The Texas Urban Model

    This essay is part of a new report from the Center for Opportunity Urbanism titled "The Texas Way of Urbanism". Download the entire report here.

    The future of American cities can be summed up in five letters: Texas. The metropolitan areas of the Lone Star state are developing rapidly. These cities are offering residents a broad array of choices — from high density communities to those where the population is spread out — and a wealth of opportunities.

    Historically, Texas was heavily dependent on commodities such as oil, cotton, and cattle, with its cities largely disdained by observers. John Gunther, writing in 1946, described Houston as having “…a residential section mostly ugly and barren, without a single good restaurant and hotels with cockroaches.” The only reasons to live in Houston, he claimed, were economic ones; it was a city “…where few people think about anything but money.” He also predicted that the area would have a million people by now. Actually, the metropolitan area today is well on the way to seven million.

    It would no doubt shock Gunther to learn that Texas now boasts some of the most dynamic urban areas in the high income world. Approximately 80 percent of all population growth since 2000 in the Lone Star state has been in the four largest metropolitan areas. People may wear cowboy boots, drive pickups and attend the big rodeo in Houston, but they are first and foremost part of a great urban experiment.

    The notion of Texas as an urban model still rankles many of those who think of themselves as urbanists. Most urbanists, when thinking of cities of the future, keep an eye on the past, identifying with the already great cities that follow the traditional transit dependent and dense urban form: New York, London, Chicago, Paris, Tokyo. And yet, within these five urban areas, there are large, evolving, dynamic sections that are automobile oriented and have lower density.

    Measuring Employment Success

    Since 2000, Dallas and Houston have increased jobs by 31 percent, growing at three times the rate of increase in New York and five times as rapidly as Los Angeles. Texas’ smaller but up-and-coming metropolitan regions are also thriving, with San Antonio and Austin, for example, boasting some of the most rapid job growth in the country.

    This growth is not all at the low end of the job market, as some suggest. Over the past fifteen years Texas cities have generally experienced faster STEM (Science, Technology, Engineering and Math-related) job growth than their more celebrated rivals. Austin and San Antonio have grown their STEM related jobs even more quickly than the San Francisco Bay Area has grown theirs, while both Houston and Dallas-Fort Worth have increased STEM employment far more rapidly than New York, Los Angeles or Chicago.

    The Texas cities also have enjoyed faster growth in middle class jobs, those paying between 80 percent and 200 percent of the median wage at the national level. Since 2001, these jobs have grown 39 percent in Austin, 26 percent in Houston, and 21 percent in Dallas-Fort Worth, a much more rapid clip than experienced in San Francisco, New York or Los Angeles, while Chicago has actually seen these kinds of job decrease.

    Recent Pew Research Center data illustrates that between 2000 and 2014, out of the 53 metropolitan areas with populations of more than 1,000,000, San Antonio had the second largest gain in percentage of combined middle-income and upper-income households; the percentage of households in the lower-income segment dropped. Houston ranked 6th and Austin ranked 13th, while Dallas-Fort Worth placed 25th, still in the top half.

    Much of the credit for this growth in jobs goes to the state’s reputation for business friendliness. Texas is consistently ranked by business executives as the first or second leading state. Needless to say, New York, California and Illinois do not fare nearly as well. The Texas tax burden ranks 41st in the country. Compare this to New York, which has the highest total state tax burden, Texas rates are also far lower than those in New York, neighbors Connecticut and New Jersey, or in California.

    The Demographic Equation

    No surprise, then, that people are flocking to the Texas cities. Over the last ten years, Dallas-Ft. Worth and Houston have emerged as the fastest growing big cities of more than five million people in the high-income world, growing more than three times faster in population than New York, Chicago, Los Angeles or Boston. Among the 53 US major metropolitan areas, four of the top seven fastest growing from 2010 to 2015 were in Texas.

    Foreign immigration, a key indicator of economic opportunity, is now growing much faster in Texas’ cities than in those of its more established rivals. Between 2000 and 2014 alone, Texas absorbed more than 1.6 million foreign born citizens. In numbers, that’s slightly less than California took in, but in proportion to Texas’ population it is 60 percent more.

    During that same time period the Latino population of Austin grew by 90 percent; Dallas-Fort Worth and Houston each grew by about 75 percent. In contrast, the Latino population in Los Angeles grew only 17 percent.

    Houston now has a far higher percentage of foreign born residents than Chicago does. Dallas-Ft. Worth draws even with Chicago in that measurement, with an immigrant population that has grown three times as fast as that of the Windy City since 2000.

    Economic opportunity explains much of the difference. Texas’ vibrant industrial and construction culture has provided many opportunities for Latino business owners. In a recent measurement of best cities for Latino entrepreneurs, Texas accounted for more than one third of the top 50 cities out of 150. In another measurement, San Antonio and Houston boasted far larger shares of Latino-owned businesses than Los Angeles, which also has a strong Latino presence.

    Texas is not a totally successful environment for minorities. Poverty levels for blacks and Hispanics remain high, and education levels lag in Houston, Dallas-Fort Worth and San Antonio. But the key factor is that Texas cities present superior prospects for upward mobility.

    Domestic Migration Trends

    Since 2000, Dallas-Ft. Worth has gained 570,000 net domestic migrants, and Houston has netted 500,000. In contrast, the New York area has had a net loss of over 2.6 million people, while Los Angeles hemorrhaged a net 1.6 million, and Chicago nearly 900,000. Dallas-Fort Worth, Houston, Austin and San Antonio were all among the top eleven in total net domestic migration gains. The smaller Texas cities have also experienced large gains in migrants.

    Many newcomers come from places — notably, California — where many Texans once migrated. Between 2001 and 2013, more than 145,000 people (net) have moved from greater Los Angeles to the Texas cities, while about 80,000 have come from Chicago and 90,000 from New York.

    As Dallas Morning News columnist Mitchell Schnurman says, “If oil prices don’t go up, Texas can always count on California — and New York, Florida, Illinois and New Jersey.”

    Creating the Next Generation of Urbanites

    Texas urban growth has occurred more or less in conjunction with market demand, without the strict controls and grandiose ‘visions’ that dominate planning in New York and California. Overall housing prices in Texas cities remain, on average, one-half or less than those in coastal California cities such as San Francisco, San Jose, San Diego and Los Angeles. They are a third below those in New York, and have not experienced the huge spikes in housing inflation seen elsewhere in the Northeast Corridor, such as in Boston.

    The lower house prices in Texas facilitate greater aspirations to home ownership, particularly among young people. The financial leap from renting to owning is far less daunting in Texas than it is the Northeast, or in some western US cities.

    These lower prices have been a boon to ethnic minorities, who make up an ever-growing percentage of the population in cities nationwide. Latinos and African-Americans are far more likely to be home owners in Texas cities than in New York, Los Angeles, Boston or San Francisco.

    A review of US Department of Commerce Bureau of Economic Analysis data indicates that housing costs are responsible for virtually all of the cost-of-living differences between the nation’s approximately 380 metropolitan areas. Consequently, it is far cheaper to live in Texas cities — even Austin — than in Boston, New York, Los Angeles, San Diego, Chicago and, most of all, the San Francisco and San Jose metropolitan areas.

    Some observers lament that, due to market forces, the vast majority of Texas metropolitan growth — nearly 100 percent — has taken place in the suburbs and exurbs. Yet the Texas cities mirror nationwide experiences: there is essentially no difference between the share of metropolitan development in the Texas suburbs and the share in most other areas. The average share for all major metropolitan areas is 99.8 percent, including in Portland, Oregon, the much ballyhooed model for densification.

    Ironically, dense housing development has grown more rapidly in Texas cities than it has in California, where the state has tried to mandate dense development. Building permit rates indicate that Texas cities have led the nation in both low density single family housing and in high density multifamily development. Between 2010 and 2015, Texas’ largest cities held three of the top five positions among the 53 major metropolitan areas in the issuance of multifamily building permits. Austin led the nation in these permits, while Houston and Dallas-Fort Worth had higher multifamily building permit rates than San Jose, Denver, Portland, Washington, or Los Angeles. At the same time, these three Texas cities also were in the top 10 in single-family building permits. Who occupies these new residences? Between 2010 and 2014 Texas cities, led by Austin and San Antonio, experienced higher rates of growth among college educated 25 to 34 year olds than did traditional ‘brain centers’ like New York, Boston, Chicago and even San Francisco. During the tech boom of the late 1990s, more people moved from Texas to the Bay Area than vice versa; in the current one, the pattern is reversed. A recent San Jose Mercury poll found that one-third of all Bay Area residents hope to leave the area, primarily citing high housing costs and overall cost of living.

    As young people mature, Texas’ major urban areas provide them with an array of choices. Texas city-dwellers, unlike many New Yorkers or San Franciscans, do not need to choose between living a middle class family lifestyle or staying in a city they love. Texas housing policies that allow organic growth driven by the market are attractive to young people seeking to establish careers or families, and to those who are already newly-established.

    These trends will have a long-term demographic impact, and suggest a continuing Texan ascendency. According to the American Community Survey’s ranking of elementary-age school children per family, Austin, Dallas-Fort Worth, Houston and San Antonio rank in the top six among the 53 major metropolitan areas. By comparison, Chicago ranks twenty-second, Los Angeles twenty-seventh, New York thirty-sixth, and San Francisco 45th.

    The Lone Star State is already home to two of the nation’s five largest metropolitan areas, the first time in history that any state has so dominated the nation’s large urban centers. At its current rate of growth, Dallas-Ft.Worth, could surpass Chicago in the 2040s, as would Houston a decade later. By 2050 the Lone Star state could dominate America’s big urban centers even more than it does now.

    Joel Kotkin is executive editor of NewGeography.com. He is the Roger Hobbs Distinguished Fellow in Urban Studies at Chapman University and executive director of the Houston-based Center for Opportunity Urbanism. His newest book, The Human City: Urbanism for the rest of us, will be published in April by Agate. He is also author of The New Class ConflictThe City: A Global History, and The Next Hundred Million: America in 2050. He lives in Orange County, CA.

    Wendell Cox is principal of Demographia, an international public policy and demographics firm. He is a Senior Fellow of the Center for Opportunity Urbanism (US), Senior Fellow for Housing Affordability and Municipal Policy for the Frontier Centre for Public Policy (Canada), and a member of the Board of Advisors of the Center for Demographics and Policy at Chapman University (California). He is co-author of the “Demographia International Housing Affordability Survey” and author of “Demographia World Urban Areas” and “War on the Dream: How Anti-Sprawl Policy Threatens the Quality of Life.” He was appointed to three terms on the Los Angeles County Transportation Commission, where he served with the leading city and county leadership as the only non-elected member. He served as a visiting professor at the Conservatoire National des Arts et Metiers, a national university in Paris.

    Welcome To Texas” flickr photo by David Herrera is licensed under CC BY 2.0

  • Tearing Down American Dream Boundaries: An Imperative

    Donald Trump’s election victory has been widely credited attracting households who have been “left behind,” by stagnating or declining income and lost jobs. But the left-behind also includes many households whose    standards of living are being reduced by the rising cost of housing. This is not about affordable housing for low-income households, itself very important, but a crisis among  middle-income households  no longer able to afford their own homes in some parts of the nation.

    Indeed, the lack of middle-income housing affordability has been associated with migration from more expensive to less expensive areas. Moreover, more people have been fleeing the states that supported Secretary Clinton, with their inferior housing affordability, and moving to those that supported Donald Trump (a net 1.45 million gain  in just  the last five years), where housing affordability is generally better.

    The differences in house prices are stunning. Between 1969 and 2014, the gap between the highest and lowest cost major metropolitan (over 1,000,000 population) housing markets had expanded 260 percent. This increase has been largely driven by markets that have become more restrictively regulated. In the more lightly regulated rental market the gap between the highest and lowest expanded only 30 percent, just one-ninth the change in the house price gap.

    In some highly regulated markets, notably California, it has become all but impossible to build the consumer-favored detached housing in the suburbs associated with the “American Dream.”

    In recent decades, California house prices have risen to as much as triple the costs relative to household incomes that exist in much of the rest of the country. A dense mesh of environmental regulation has been implemented,   far stronger than EPA regulations. Large parts of metropolitan areas are now off-limits for efficient housing tract construction, prohibited by “urban growth boundaries,” which can be characterized as “American Dream Boundaries.”

    Progressive politicians, dominant in California, talk incessantly about housing affordability, but blindly pursue policies that will make things even worse. It should not be surprising that the housing-cost adjusted poverty rate in California is the worst in union, underperforming even Mississippi. It should also not be surprising that Californians of every age group, including Millennials, are leaving state in larger numbers than they are being attracted.

    The San Francisco Bay Area’s two large metropolitan areas (San Jose and San Francisco) are the most unaffordable in the nation and rank fourth and seventh most unaffordable in the Demographia International Housing Affordability Survey among major metropolitan areas in nine nations. House prices have more than tripled relative to incomes since radical land-use regulation began. The problem is not a shortage of land. The Bay Area has more than enough developable land to accommodate up to four times the population. The shortage is in the amount of land governments allow to be developed. As a result, the Bay Area has become a rigged market that excludes many middle-income households by making housing unaffordable. This may be a boon for older property owners, but the burden falls most heavily on households that are minority or young. California’s housing affordability crisis is a profound public policy failure.

    The problem extends beyond California, especially to places like Oregon, Washington, Hawaii, Colorado, Maryland, and northern Virginia. The net effect is that households pay much more the necessary for housing and have a lower standard of living that is necessitated by government policy. It is no wonder that people think the future is less bright for their children.

    Moreover, no one should be misled by planning fantasies that backyard “Granny flats” or high-rise apartment towers are the answer. They have their market, but it does not include most aspiring households. Government has no business lowering living standards by forcing house prices up.

    A mortgage on a median priced house requires a qualifying income approximately double the median household income in San Diego, Los Angeles, San Francisco and San Jose (10 percent down payment assumption). In much of the country, by contrast, housing remains affordable, as in the past. A median income household can comfortably afford the median priced house in metropolitan areas like Dallas-Fort Worth, Atlanta and Kansas City.

    More Jobs and Economic Growth

    But beyond the lower standards of living attributable to American Dream Boundaries, building fewer detached houses than households demand has an important economic cost.

    Research by Chang-Tai Hseih of the University of Illinois, Chicago and Enrico Moretti at the University of California indicates that the gross domestic product was $2 trillion less than would have been expected in 2009, largely due to housing regulation. Matthew Rognlie of the Massachusetts Institute of Technology found that the widening inequality gap found by French economist Thomas Piketty was largely due to housing and suggested expanding the housing supply and re-examining land-use regulation.

    Jason Furman, President Chairman of President Obama’s Council of Economic Advisors has shown that single family houses make 2.5 times the contribution of apartment units to the gross domestic product. This fact eluded President Obama’s Department of Housing and Urban Development, which has spent years roaming the country inducing local officials to implement the policies like those noted above that make housing less affordable.

    But, as Furman’s data indicates, the detached housing Americans overwhelmingly prefer is better for the economy. This means more good jobs in building homes, economic ripple effects and additional revenues for local governments.

    Yet, seven years after the  Great Recession, California’s detached house construction rate is barely one half the national average.

    Much of this has to do with a planning philosophy called “smart growth,” often accompanied by prohibitions on new housing on the urban fringe. But there is nothing smart about policies that raise the price of houses for struggling families. Nor is there anything smart about reducing people’s standards of living. The more important priorities of facilitating better standards of living and reducing poverty are turned on their head by such myopic policies.

    It is time to restore priorities that put people first. Building the housing that people want would not only improve living standards, but would also boost the economy. The American Dream Boundaries need to be torn down.

    Wendell Cox is principal of Demographia, an international public policy and demographics firm. He is a Senior Fellow of the Center for Opportunity Urbanism (US), Senior Fellow for Housing Affordability and Municipal Policy for the Frontier Centre for Public Policy (Canada), and a member of the Board of Advisors of the Center for Demographics and Policy at Chapman University (California). He is co-author of the "Demographia International Housing Affordability Survey" and author of "Demographia World Urban Areas" and "War on the Dream: How Anti-Sprawl Policy Threatens the Quality of Life." He was appointed to three terms on the Los Angeles County Transportation Commission, where he served with the leading city and county leadership as the only non-elected member. He served as a visiting professor at the Conservatoire National des Arts et Metiers, a national university in Paris.

    Photograph: Suburban Kansas City (by author)

  • It Wasn’t Rural ‘Hicks’ Who Elected Trump: The Suburbs Were — And Will Remain — The Real Battleground

    Much of the New York and Washington press corps has concluded that Donald Trump’s surprising journey to the Oval Office was powered by country bumpkins expressing their inner racist misogyny. However, the real foundations for his victory lie not in the countryside and small towns, but in key suburban counties.

    The popular notion of “city” and “country,” one progressive and “vibrant,” the other regressive and dying, misses the basic geographic point: the largest metropolitan constituency in the country, far larger than the celebrated, and deeply class-divided core cities, is the increasingly diverse suburbs. Trump won suburbia by a significant five percentage point margin nationally, improving on Romney’s two-point edge, and by more   outside the coastal regions.

    Despite the blue urbanist cant that dense metro areas — inevitably labelled “vibrant” — are the future, in fact, core cities are growing at a slower pace than their more spread out suburbs and exurbs, which will make these edge areas even more important politically and economically in the coming decade. The states that voted for Trump enjoyed net domestic migration of 1.45 million from 2010 to 2015, naturally drawn from the states that were won by Hillary Clinton. Democrat-leaning ethnic groups, like Hispanics, are expanding rapidly, but Americans are moving in every greater numbers to the more conservative geographies of the Sun Belt, the suburbs and exurbs.

    Suburbs Drive Swing States

    The future battles between the parties will have to be waged where the people and jobs are: suburbia. Suburban voters particularly put Trump ahead in the crucial Midwestern states of Michigan, Wisconsin, and came close to winning him supposedly deep blue Minnesota. This is where the Democratic falloff from the Obama years was most evident, notes Mike Barone, falling from  dropping from 54 percent for Obama to 2008 to 45 percent this year.

    Clinton did win some suburban counties, especially in the Philadelphia area, but by lower margins than President Obama had in 2012. Clinton’s margin was also lower in some older rustbelt urban counties: Erie (Buffalo), Onondaga (Syracuse), Monroe (Rochester), Albany, and Hamilton (Cincinnati). A number of college towns and state capitals also invariably voted for Clinton, overwhelmingly.

    Overall, though, most suburban counties in the swing states supported Trump. In Michigan, Trump lost Detroit, and surrounding Wayne County, by better than two to one, but captured four of the five surrounding suburban counties. His margin greatly exceeded that of Romney in these counties, which, combined with his strong support in smaller cities and rural areas outside the major metropolitan areas, put him over the top in this critical state.

    A similar pattern can be seen in Pennsylvania. Clinton, of course, won overwhelmingly in the large urban counties — the city of Philadelphia went for her by 82 to 15. She also won some nearby suburban counties around the city, as was expected. But elsewhere Trump did better. He lost Allegheny County (Pittsburgh) but won all the surrounding suburban countries by piling up 54 percent to 74 percent of the votes; he lost the state capital of Harrisburg but made that up by crushing her in the suburban counties. Particularly striking was his victory in historically Democratic Erie County (population 280.000), west of Buffalo; Obama had won the county by 16 points in 2012.

    Much the same can be said about Wisconsin, where Trump was not expected to be too competitive, as well as Ohio, someplace he was expected to win. Clinton’s edge in Ohio’s smaller, blue collar urban constituencies fell well below the levels enjoyed by President Obama while surrounding suburban counties went, almost without exception, heavily for Trump.

    The Political Geography Of The Future

    Ultimately the road to recovery for Democrats does not lie in expanding the urban core vote. As Mike Lind has suggested, progressives embrace a kind of post-national “open borders” ideology that makes sense in denser, global cities — where the demand for low-end service labor is greater — than in suburban or small town and rural areas that tend to be more egalitarian and, for the most part, whiter.

    There may be growing unanimity of Democratic support in core areas, but urban cores are growing more slowly, or not at all, compared to the suburbs. Indeed the urban vote in the cores, although obviously tilted blue, has dropped in recent years, with the exception of the Obama run in 2008. Nor do attempts to call suburban or “countryside” people “deplorable,” racist and even too fat constitute much of a strategy to appeal to these areas.

    In contrast, Trump’s geographic coalition between the deep red countryside and the suburbs demonstrated an alternative that can work, particularly in key swing states. Despite the wishes of many planners, and their Democratic allies, suburbs and small towns are not about to go away in the near future. Areas outside million-plus metropolitan areas accounted for 100 percent of the vote in Iowa, 61 percent in Wisconsin, 47 percent in Michigan and Pennsylvania, and 44 percent in Ohio. They may not be demographically ascendant, but they still carry considerable heft.

    Nor can blue state advocates continue to claim that millennials will not move to suburbia, because that is clearly happening. Urbanist mythology now holds to a fallback position that millennials move to the suburbs simply because they have been priced out. However, they don’t look at other compelling reasons — notably shaped by life stage — for suburban growth. As most millennials will soon be over 30, its seems likely more will head to the periphery, as did earlier generations to gain more space to raise a family, better schools and safety. Even after the Great Recession people continued to move in large numbers from urban core counties to the less dense suburbs and exurbs. Between 2010 and 2015, suburban counties of major metropolitan areas added 825,000 net domestic migrants, while the urban core counties lost nearly 600,000. The real question is whether millennials will turn these red-trending areas bluer, or will their experience as homeowners and parents make them more traditional and conservatively minded suburbanites?

    The basic geographic and demographic conclusion: the balance of political power lies with suburban and exurban counties, particularly in swing states. Republicans need to build on their success by appealing more the minorities and immigrants who are also moving to the periphery. To return to power, the Democrats should   shift their attention from their urban core base and look more to the periphery. In the end, they need to provide compelling reason why these areas should support a party that, at least for now, seems generally favorable  to their exclusion and even ultimate demise.

    This piece originally appeared in Forbes.

    Joel Kotkin is executive editor of NewGeography.com. He is the Roger Hobbs Distinguished Fellow in Urban Studies at Chapman University and executive director of the Houston-based Center for Opportunity Urbanism. His newest book, The Human City: Urbanism for the rest of us, will be published in April by Agate. He is also author of The New Class ConflictThe City: A Global History, and The Next Hundred Million: America in 2050. He lives in Orange County, CA.

    Wendell Cox is principal of Demographia, an international public policy and demographics firm. He is a Senior Fellow of the Center for Opportunity Urbanism (US), Senior Fellow for Housing Affordability and Municipal Policy for the Frontier Centre for Public Policy (Canada), and a member of the Board of Advisors of the Center for Demographics and Policy at Chapman University (California). He is co-author of the “Demographia International Housing Affordability Survey” and author of “Demographia World Urban Areas” and “War on the Dream: How Anti-Sprawl Policy Threatens the Quality of Life.” He was appointed to three terms on the Los Angeles County Transportation Commission, where he served with the leading city and county leadership as the only non-elected member. He served as a visiting professor at the Conservatoire National des Arts et Metiers, a national university in Paris.

    Electoral map by Ali Zifan (This file was derived from:  USA Counties.svg) [CC BY-SA 4.0], via Wikimedia Commons

  • San Francisco Observations

    I made quite a few trips to San Francisco during the late 90s into the early 2000s, but hadn’t been back in a very long time – probably close to 15 years.

    Recently I was there for a conference and a long weekend and got to spend some time exploring the city. I won’t claim a comprehensive review, but I did have a few takeaways to share.

    1. Fewer homeless than expected. Based on the rhetoric you read in the papers, I expected SF to be overrun with aggressive homeless people. This wasn’t the case. There were visible homeless to be sure, but no more than I remember from 15 years ago and no more than I see in New York. And they were not particularly aggressive in any way.

    2. A curiously low energy city. It’s tough to judge any American city’s street energy after living in New York, but San Francisco felt basically dead. Tourist areas around Union Square and the Embarcadero were crowded, and the Mission on a Friday night was hopping, but otherwise the city was very quiet. Haight-Ashbury was nearly deserted and many neighborhoods had the feel of a ghost town. It’s very strange to be walking around a city with such a dense built fabric but so few people.

    3. San Francisco is too small to support a centralized economy. The Financial District has a number of skyscrapers, and SOMA is awash in construction – the biggest changes I observed were in this district – but central San Francisco is too small to serve as a global city business center. And the city as a whole is not big enough to support that kind of a resident base. The bottom line is that San Francisco’s constrained geography renders the construction of a CBD in the style of a Chicago or New York very difficult. Also, at only around 856,000 people – an all time record high – the absorption capacity of the city is limited. Contrast with NYC at 8.5 million, LA with 4 million and Chicago with around 2.7 million in much bigger geographies. Also, the transport geography of San Francisco does not include the type of massive commuter rail system that NYC, London, Chicago, etc. have. In short, I don’t see SF having the capacity for a much greater degree of employment centralization.

    4. Major construction is undesirable in San Francisco. As I’ve written before, San Francisco is one of America’s most achingly beautiful cities with a very unique building stock. It’s also, like Manhattan, mostly fully developed. So new construction in most places would involve demolition of the existing building stock. No surprise SOMA is where the construction is, because there’s room to do it and/or lower quality buildings to replace. To make a serious increase in the quantity of residential or office space would involve significant damage to the character of the city and would not in my view be desirable. Nor, given the point above about its small size, is it likely to make much of a difference anyway. It’s hard to see how the city of San Francisco itself changes its trends without an economic pullback.

    5. San Francisco doesn’t feel like it has the services of a high tax city. Taxes are high in San Francisco, but it many ways it doesn’t feel like it. In New York, our taxes are high, but the level of services is highly visible, at least in Manhattan. Just as one small example, SF’s storm drains were often partially blocked with leaves, and there were pools of standing water even on Market St. In NYC, BID employees or building supers regularly clear storm drains and sweep water into sewers. Our parks are in better shape. I was surprised to see that SF still has curbs with no ADA ramps. In short, while the city is beautiful and such, it doesn’t radiate the feel of high services.

    6. Barrier and POP transit system. I ran into a curious situation while riding transit. Muni, the city’s transit agency, has a light rail system called Muni Metro. It runs as a subway under Market St. Because it runs on street elsewhere, the trainsets are pretty short. I rode the subway portion, which has a barrier system. But then on the train my ticket was checked again by a conductor. Why have barriers if you are running a POP system on top of it? I’m glad I saved my ticket.

    7. San Francisco Opera. I attended my first opera in San Francisco. The San Francisco Opera is a very globally respected company. The opera, Janacek’s The Makropulous Case, was very good. It was well-patronized but there were plenty of empty seats too. It has the feel of the Lyric Opera of Chicago, where the majority of attendees are subscribers. The average age was very high – much higher than the Met Opera, which although suffering a serious attendance problem draws quite a few young people. The SF Opera’s patron base is getting up there. I also took a look through the program. I did not see a single tech company on their list of corporate sponsor, nor did I see any tech names I recognized on their major donor list. Opera in San Francisco appears to be an old money affair, with the emphasis on old. This doesn’t bode well for the future of this flagship cultural organization if it can’t find a way to tap into younger attendees and donors. I’d have to caveat this somewhat given that my investigation is very limited. But this is a trend affecting many similar organizations.

    Aaron M. Renn is a senior fellow at the Manhattan Institute, a contributing editor of City Journal, and an economic development columnist for Governing magazine. He focuses on ways to help America’s cities thrive in an ever more complex, competitive, globalized, and diverse twenty-first century. During Renn’s 15-year career in management and technology consulting, he was a partner at Accenture and held several technology strategy roles and directed multimillion-dollar global technology implementations. He has contributed to The Guardian, Forbes.com, and numerous other publications. Renn holds a B.S. from Indiana University, where he coauthored an early social-networking platform in 1991.

  • Canada’s Middle-Income Housing Affordability Crisis

    The Canadian Mortgage and Housing Corporation (CMHC) has issued a “red warning” for the entire housing market in Canada.” According to CMHC the red warnings are due to “strong evidence of problematic conditions for Canada overall. Home prices have risen ahead of economic fundamentals such as personal disposable income and population growth. This has resulted in overvaluation in many Canadian housing markets.”

    This pattern has been present  in Canada for at least a decade. This was the subject of a policy report authored by Ailin He, a PhD candidate in economics at McGill University (Montréal) and me (Canada’s Middle-Income Housing Affordability Crisis), which was published by the Frontier Centre for Public Policy in Winnipeg. The report covered all census 33 metropolitan areas and two smaller census agglomerations.

    The Executive Summary (adapted) and selected charts from Canada’s Middle-Income Housing Affordability Crisis are reproduced below.

    Canada has a serious middle-income housing affordability crisis. Canada’s house prices have grown nearly three times that of household income since 2000. This contrasts with the stability between growth in house prices and household income during the previous three decades. These house-price increases have raised serious concerns at the Bank of Canada and at international financial organizations such as the Organisation for Economic Co-operation and Development (OECD) and the International Monetary Fund (IMF).

    This public policy report examines overall housing affordability in 35 housing markets, including all 33 CMAs and two census agglomerations (Section 1).

    Higher house prices reduce the standard of living and constrain economic growth. Housing affordability is analyzed using indicators with comparisons between housing markets and within individual housing markets over time. Price-to-income multiples are used. Higher house prices mean less home buyer discretionary income (the amount left over after paying for necessities such as housing, food, clothing and transportation). Households have less income available for purchasing other goods and services, which can constrain economic growth and job creation. Moreover, less discretionary income translates into lower standards of living (Sections 1.1 and 1.2).

    There was serious deterioration in middle-income housing between 2000 and 2015. This analysis shows that house prices rose faster than income in each of the 35 markets. The largest losses in housing affordability occurred in the six markets with a population of more than one million (Calgary, Edmonton, Montréal, Ottawa-Gatineau, Toronto and Vancouver), where house prices rose on average 3.3 times that of household income. More alarmingly, house prices rose more than four times household income in Vancouver and Toronto. In the five metropolitan areas with between 500,000 and one million residents (Hamilton, Kitchener-Waterloo, London, Québec and Winnipeg), house prices rose 3.2 times that of household income. Even in the smaller markets, house prices rose on average by at least double that of household income (Section 2).

    Substantial mortgage affordability losses could occur with the expected interest increases. Should mortgage interest rates rise by 2020 as projected by The Conference Board of Canada, approximately 800,000 fewer households will be able to qualify for a mortgage on an average-priced house, all else being equal. This could have an impact sooner than expected, since many Canadian mortgages require renewing every five years (Section 3).

    Higher house prices have made it more difficult for middle-income households to afford the housing that Canadians have preferred for decades. Higher house prices appear to have been a principal factor in a trend toward smaller houses and condominiums across Canada between 2001 and 2011. This shift is most evident in Vancouver and Toronto, where housing markets also have the most-restrictive land-use regulation (Section 4).

    Restrictive land-use policy is associated with housing affordability losses. International economic literature associates more-restrictive land-use regulation with diminished housing affordability. The largest housing affordability losses have occurred in metropolitan areas (markets) that have adopted urban containment land-use strategies, which severely limit the land that can be used for building houses on and beyond the urban fringe. Consistent with basic economics, this reduction of land supply is associated with rising land prices, which lead to higher house prices. Without the substantial reform of restrictive land-use policies, housing affordability is likely to continue deteriorating (Section 5).

    Higher house prices impose adverse social and economic consequences. Higher house prices are associated with increased rates of internal migration out of higher-cost markets, increased inequality, overcrowding, the greater public expenditure that is required to support low-income housing and losses to the economy (Section 6).

    Solving the middle-income housing affordability crisis will require policy reforms. There is considerable evidence that restrictive land-use policies are associated with significant losses in housing affordability in Canada as is the case elsewhere. Metropolitan areas with restrictive land-use policy should undertake reforms aimed at improving housing affordability. There should be a moratorium on the adoption of urban containment policy where it is not yet in place. Concerns have been expressed about the potential for high house prices and high household debt to complicate the ability of central banks (such as the Bank of Canada) to perform their monetary policy responsibilities.  Conclusion:  that middle-income housing affordability in Canada is a profound social and economic crisis that warrants serious and concentrated public policy attention (Section 7).

    Wendell Cox is principal of Demographia, an international public policy and demographics firm. He is a Senior Fellow of the Center for Opportunity Urbanism (US), Senior Fellow for Housing Affordability and Municipal Policy for the Frontier Centre for Public Policy (Canada), and a member of the Board of Advisors of the Center for Demographics and Policy at Chapman University (California). He is co-author of the “Demographia International Housing Affordability Survey” and author of “Demographia World Urban Areas” and “War on the Dream: How Anti-Sprawl Policy Threatens the Quality of Life.” He was appointed to three terms on the Los Angeles County Transportation Commission, where he served with the leading city and county leadership as the only non-elected member. He served as a visiting professor at the Conservatoire National des Arts et Metiers, a national university in Paris.

    Photograph: Calgary (by author)

  • The Cities Where Your Salary Will Stretch The Furthest 2016

    When Americans consider a move to another part of the country, they sometimes are forced to make a tough choice: should they go to a city with the best job opportunities, or a less economically vital area that offers a better standard of living, particularly more affordable housing? However,  there are still plenty of metropolitan areas in the U.S. where you can get the best of both worlds.

    Center for Opportunity Urbanism senior fellow Wendell Cox has developed a set of rankings that identify metropolitan areas where salaries are relatively high relative to costs, and you get more for your paycheck. Our list is geographically and demographically diverse, both in terms of the top 20 and the places closest to the bottom.

    The COU Standard of Living Index takes the 2015 mean pay per job in the 106 metropolitan statistical areas with more than 500,000 population and adjusts it by cost of living. Metro areas that have a large proportion of high-wage jobs tend to do best, such as San Jose, Calif., and Houston. The biggest differences in terms of cost of living generally have to do with housing; costs for goods varied by 23 percent and for services by 35 percent in 2014 across the metropolitan data, but for rents the differential between the most and least expensive metro areas is 194 percent and, for housing purchased in 2014, a remarkable 775 percent. The composite cost of living index underlying the COU Standard of Living Index is developed from a blend of annual rent as well as home ownership costs for prospective home buyers.

    I have divided the top and bottom rankings into four basic groups: expensive but worth it; moderately priced but still high income; expensive but so costly as to  be economically barely worth it; and, finally, areas that are cheap, but not for the right reasons.

    Expensive, But Worth It

    There are several high-cost areas that do very well in this ranking, largely because they offer high incomes to match. The metro area with the highest annual wage when adjusted for cost of living is San Jose, the center of Silicon Valley. The cost of living there is 63 percent higher than the national average, the highest in the nation, but with the highest nominal pay per job at $112,300 ($27,000 above the next best), the metro area still ends up with the highest adjusted paycheck of $68,850.

    Four other high-cost areas also make our top 10. Two are in Connecticut: No. 4 Bridgeport-Stamford, where the cost of living is 45 percent above the national average, and No. 5 Hartford, where costs are 15 percent above the national average. But higher wages — $85,400 for Bridgeport and $62,600 for Hartford — give residents the buying power to absorb those costs, and places these metros areas high on the list.The other two are No. 6 Boston and 10th-ranked Seattle.

    One common thread that helps these metro areas overcome high costs is a high concentration of jobs in better paying fields such as technology and business and professional services.

    Opportunity Cities: Less Expensive And Economically Vital

    The other five top cities in our Standard of Living index fit a very different mold. These are what may be seen “opportunity cities,” where there are relatively high wages and somewhat low costs. If the successful blue cities can be seen as something of “gated communities” for well-educated, largely white and Asian residents, these cities offer a higher standard for a broader and often more diverse population.

    The epitome of opportunity cities, Houston, takes second place. Like San Jose, Houston has a strong concentration of engineering talent and STEM jobs, many of them related to the energy industry. The average annual paycheck in America’s Energy Capital is $65,000, well above the national average, and with a cost of living barely 5 percent above the usual, it’s only eroded slightly to an adjusted worth of $62,300.

    The other cities in our top 10 tend to feature high growth in STEM employment but moderate to low costs. They include No. 3 Durham, N.C., located in the tech-rich Research Triangle area, No. 7 Atlanta and No. 8 Detroit. In all these areas the cost of living is around the national average, but salaries are higher. You may be surprised by Detroit, but this ranking looks at the total metro area, which is in much better shape than the core city. With good-paying jobs, many connected to the revived auto industry, the Detroit metro area is in far better shape than is commonly suggested.

    Of course, the Motor City may lack the glamour and stratospheric wages of Silicon Valley, but its far lower costs offer a surprising high standard of living. Nor is it the only Rust Belt city that ranks highly. Consider No. 13 Cincinnati, No. 15 Pittsburgh, No. 16 Cleveland and No. 19 St. Louis. In the future it may make sense for more individuals and companies to take a second look at these areas.

    Expensive, And Not Producing Enough Good Jobs To Make Up For It

    Not all expensive cities are worth the cost, particularly if you are considering a move. Take 89thplace San Diego and 97th place Los Angeles, two California cities with idyllic climates and dynamic histories, but that now have become too expensive to offer a high standard of living for anyone not making far more than the local average salary.

    The tragedy for these Southern California metro areas is that, while they have seen a rapid escalation in housing prices and rents, they have not been able to take a meaningful part in the tech boom that has driven up wages in San Jose and the Bay Area. San Diego’s mean wage of $58,000 might seem more than respectable, but with a cost of living 36 percent above the national average, it reduces the real pay in this attractive coastal city to a more modest $42,700.

    Most critical, however, is the clear downshift in the standard of living in my adopted home region, greater Los Angeles. Once L.A. was full of high-wage jobs, many of them tied to aerospace and manufacturing, as well as high-end business services. Those industries have been eroding for well over a decade, replaced, in large part, by lower-wage positions in hospitality, retail and health. Now it is one of the poorest big cities in America, yet one with extraordinarily high costs, particularly for housing. The cost of living in LA is 46 percent above the national average, driving real wage from a respectable nominal average $59,000 to a dismal adjusted $40,400.

    Left Behind

    Most of the metro areas at the bottom half of our list are smaller, with barely a million people or less. Many of these are in high-cost regions, notably our last-place finisher, Honolulu. In the Hawaiian capital, the average paycheck is $48,800 but when you factor in our cost of living modifier, the real income falls to $33,900. That’s partly due to a lack of developable land that drives up property prices and also due to the high proportion of necessities that are imported, including food and oil.

    This pattern is repeated by many areas in our bottom 10, including the California cites Stockton (94th), Fresno (98th), Riverside-San Bernardino (102nd) and Santa Rosa (105th). In all these cases, incomes tend to be  modest, but costs, particularly for housing, are higher than their economies would logically warrant. Much of the “credit” here may well belong to California’s restrictive land use and housing policies, and generally poor climate for manufacturing, agriculture and other blue-collar businesses.

    What does this tell us? Metro areas that want  to improve in these rankings need to focus not just on developing their economies, but also policies that keep costs competitive with other regions.

    Center for Opportunity Urbanism
    Standard of Living Index: 2015
    Rank (of 106) Metropolitan Area Annual Pay Per Job, Adjusted by COU CoL Index
    1 San Jose, CA $68,855
    2 Houston, TX $62,305
    3 Durham, NC $59,526
    4 Bridgeport-Stamford, CT $58,704
    5 Hartford, CT $57,050
    6 Boston, MA-NH $56,979
    7 Atlanta, GA $56,647
    8 Detroit,  MI $56,421
    9 Dallas-Fort Worth, TX $55,529
    10 Seattle, WA $55,123
    11 Charlotte, NC-SC $55,122
    12 Washington, DC-VA-MD-WV $54,525
    13 Cincinnati, OH-KY-IN $54,265
    14 Birmingham, AL $54,256
    15 Pittsburgh, PA $54,168
    16 Cleveland, OH $54,059
    17 Minneapolis-St. Paul, MN-WI $53,668
    18 Denver, CO $53,526
    19 St. Louis,, MO-IL $53,519
    20 Nashville, TN $53,144
    21 Des Moines, IA $53,115
    22 Kansas City, MO-KS $53,009
    23 Austin, TX $53,002
    24 Memphis, TN-MS-AR $52,911
    25 Columbus, OH $52,319
    26 Philadelphia, PA-NJ-DE-MD $51,912
    27 Fayetteville (Bentonville), AR-M $51,876
    28 San Francisco, CA $51,723
    29 Baton Rouge, LA $51,492
    30 Chicago, IL-IN-WI $51,425
    31 Raleigh, NC $50,980
    32 Tulsa, OK $50,798
    33 Indianapolis. IN $50,781
    34 Akron, OH $50,578
    35 Harrisburg, PA $50,483
    36 Louisville, KY-IN $50,390
    37 Richmond, VA $50,053
    38 Oklahoma City, OK $50,018
    39 New York, NY-NJ-PA $49,760
    40 New Orleans. LA $49,739
    41 Albany, NY $49,578
    42 Phoenix, AZ $49,403
    43 Sacramento, CA $49,323
    44 Portland, OR-WA $49,262
    45 Dayton, OH $49,203
    46 Winston-Salem, NC $49,079
    47 Knoxville, TN $49,060
    48 Milwaukee,WI $49,022
    49 Baltimore, MD $48,771
    50 Toledo, OH $48,705
    51 Wichita, KS $48,608
    52 Melbourne (Palm Bay), FL $48,230
    53 Augusta, GA-SC $48,065
    54 Omaha, NE-IA $47,956
    55 San Antonio, TX $47,910
    56 Little Rock, AR $47,900
    57 Chattanooga, TN-GA $47,877
    58 Jacksonville, FL $47,810
    59 Madison, WI $47,510
    60 Rochester, NY $47,486
    61 Grand Rapids, MI $47,459
    62 Salt Lake City, UT $47,368
    63 Syracuse, NY $47,239
    64 Greensboro, NC $47,013
    65 Greenville, SC $46,762
    66 Buffalo, NY $46,500
    67 Columbia, SC $46,437
    68 Tampa-St. Petersburg, FL $46,410
    69 Allentown, PA-NJ $46,141
    70 Springfield, MA $45,585
    71 Providence, RI-MA $45,323
    72 Worcester, MA-CT $45,236
    73 Jackson, MS $45,196
    74 Colorado Springs, CO $45,017
    75 New Haven CT $44,848
    76 Charleston, SC $44,613
    77 Miami, FL $44,589
    78 Orlando, FL $44,527
    79 Virginia Beach-Norfolk, VA-NC $44,290
    80 Las Vegas, NV $44,265
    81 Spokane, WA $43,770
    82 Albuquerque, NM $43,486
    83 Tucson, AZ $43,484
    84 Bakersfield, CA $43,464
    85 Boise, ID $43,103
    86 Scranton, PA $43,082
    87 Lakeland, FL $42,907
    88 Youngstown, OH-PA $42,766
    89 San Diego, CA $42,716
    90 Lancaster, PA $42,227
    91 Modesto, CA $42,034
    92 Portland, ME $41,902
    93 Cape Coral-Fort Myers, FL $41,547
    94 Stockton, CA $40,512
    95 Provo, UT $40,473
    96 Sarasota (North Port), FL $40,434
    97 Los Angeles, CA $40,432
    98 Fresno, CA $40,226
    99 El Paso, TX $40,074
    100 Oxnard, CA $40,049
    101 Ogden, UT $39,966
    102 Riverside-San Bernardino, CA $38,598
    103 Daytona Beach (Deltona), FL $38,242
    104 McAllen, TX $38,182
    105 Santa Rosa, CA $35,370
    106 Honolulu, HI $33,903

    Joel Kotkin is executive editor of NewGeography.com. He is the Roger Hobbs Distinguished Fellow in Urban Studies at Chapman University and executive director of the Houston-based Center for Opportunity Urbanism. His newest book, The Human City: Urbanism for the rest of us, will be published in April by Agate. He is also author of The New Class ConflictThe City: A Global History, and The Next Hundred Million: America in 2050. He lives in Orange County, CA.

    Photo by w:Flickr user Bill Jacobus [CC-BY-2.0], via Wikimedia Commons

  • Real Estate Doesn’t Make an Economy

    From Southern California to Shanghai and London, inflated real estate prices have evolved into a simulacrum for broader prosperity. In an era of limited income gains, growing inequality, political dysfunction and fading productivity, the conjunction of low interest rates and essentially free money for the rich and well-placed has sparked the construction of often expensive, high-density residential housing.

    This heady period of rapid real estate asset inflation could soon be coming to an end, followed by a potentially nasty correction in high-density, high-cost, more urban core locations. Since the 2008 crash, centered in overpriced single-family housing, density has been the new mantra, a trend largely echoed in the media, academia and among the planning professions.

    The notion that dense, expensive urban real estate would dominate the future rested on two assumptions. First, it was widely explained to developers that millennials would prefer to rent small apartments for the foreseeable future, padding the profits of the investor class. Second, it was assumed that money would continue to pour into elite Western cities from the newly rich of China, Russia, Latin America and the Middle East.

    Today, both trends are diminishing. Millennials are getting older, and by 2018 more will be in their 30s — when most people seek out single-family homes — than in their 20s. We are already reaching “peak urban millennials,” as University of Southern California demographer Dowell Myers suggests, while the replacement generation, known as the “Z” or “plurals,” will be somewhat less numerous.

    At the same time, high-end residential investors from the once booming BRICS countries — Brazil, Russia, India, China and South Africa — are, with the exception of India, now experiencing slower or negative growth. They are likely to be a far less reliable source of funds for high-end luxury housing.

    Read the entire piece at the Orange County Register.

    Joel Kotkin is executive editor of NewGeography.com. He is the Roger Hobbs Distinguished Fellow in Urban Studies at Chapman University and executive director of the Houston-based Center for Opportunity Urbanism. His newest book, The Human City: Urbanism for the rest of us, will be published in April by Agate. He is also author of The New Class ConflictThe City: A Global History, and The Next Hundred Million: America in 2050. He lives in Orange County, CA.

    Photo by Mark Lyon — Full Floor For Rent.