Category: Urban Issues

  • Welcome to Ecotopia

    In this era of tea-partying revolutionary-era dress-ups, one usually associates secessionism with the far right. But if things turn sour for the present majority in Washington, you should expect a whole new wave of separatism to emerge on the greenish left coast.

    In 1975 Ernest Callenbach, an author based in Berkeley, Calif., published a sci-fi novel about enviro-secessionists called Ecotopia; a prequel, Ecotopia Rising, came out in 1981. These two books, which have acquired something of a cult following, chronicle–largely approvingly–the emergence of a future green nation along the country’s northwest coast.

    Aptly described by Callenbach as “an empire apart,” this region is, in real life, among the world’s most scenic and blessed by nature. Many in this part of America have long been more enthusiastic about their ties to Asia than those with the rest of the country. It is also home to many fervent ecological, cultural and political activists, who often feel at odds with the less enlightened country that lies beyond their soaring mountains.

    Until the election of Barack Obama, the Pacific Northwest certainly was separating from the rest of America–at least in attitude. After George W. Bush’s victory the 2004 presidential election, the Seattle weekly The Stranger published an angry editorial about how coastal urbanites needed to reject “heartland values like xenophobia, sexism, racism and homophobia” and places where “people are fatter and dumber and slower.”

    Such a narrow, cynical view of the rest of the country is in line with Callenbach’s Ecotopia novels, in which the bad guys–representatives of American government and corporations–are almost always male, overweight and clueless about everything from technology to tending to the earth.

    Of course, would-be Ecotopians have much of which to be proud. The three great cities of the region–San Francisco, Portland and Seattle–easily rank among the most attractive on the continent. They all boast higher-than-average levels of education and–at least around San Francisco and Seattle–some of the world’s deepest concentrations of high-tech companies.

    Yet for all their promise, the Ecotopian regions cannot claim to have missed the current recession. Downtown Seattle currently suffers a vacancy rate in excess of 20%, the highest in decades; last year apartment rental rates dropped 13.8%, the steepest decline among American metros. Meanwhile vacancies in the Silicon Valley area south of San Francisco have soared to above 20%. By early this year, there was enough unoccupied office space in the Valley to fill 15 Empire State Buildings.

    This may seem a bit counter-intuitive for a region that boasts the headquarters of Microsoft, Costco, Amazon, Intel and Apple. But while such companies provide lots of high-wage employment, they are no longer enough to spark much growth across the region’s economy. The San Francisco area has actually lost jobs over the past decade and shows little sign of recovering its once prodigious growth rates.

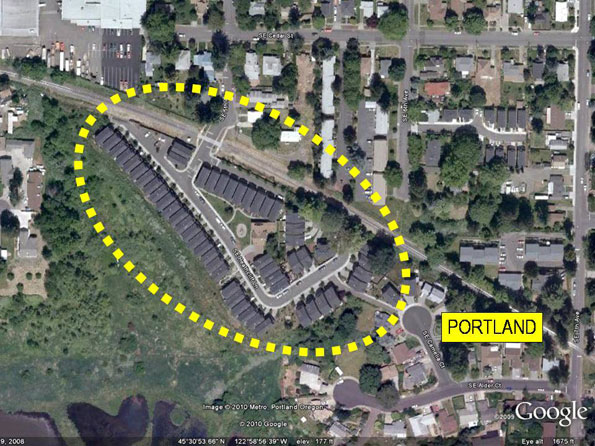
    But easily the weakest of the economies has been Portland, which lacks the presence of major anchor firms like those in greater Seattle or the Bay Area. Portland’s unemployment rate has been well over 10% since late last year.

    A wave of youthful migration has made the city a slacker haven for the past decade and, in turn, exacerbated unemployment figures. Homeless kids now crowd the downtown area, which, although far from destitute, does appear pretty grungy in places.

    Yet, like the Ecotopians in the Callenbach novels, Portland residents and politicians seem nonplussed about their anemic economic performance. After all, the city voted heavily–despite solid opposition from the rest of the state–to raise Oregon’s taxes on wealthy individuals and corporations, a move likely to deter new in-bound investment.

    “You don’t have a big focus here on economic development,” observes Stephen B. Braun, dean of the School of Management at Portland’s Concordia University. “There’s much more emphasis on quality of life than on making a living.”

    The proof: Portland may have high unemployment, but the big idea around city hall is not how to promote jobs but about investing an additional $600 million in bike lanes.

    All these places, of course, avidly endorse green jobs even if there’s little prospect they could replace the jobs being lost in the fading blue-collar sectors. A growing green job sector needs a vibrant economy that produces things and builds new buildings, notions that have little currency across much of the region.

    This anti-growth attitude reflects that of Callenbach’s Ecotopia, which favors a “stable state” economy over job or wealth creation. Ecotopian politics explicitly ban both population increases and the private automobile.

    While the mayors of Portland, San Francisco and Seattle are hardly that extreme, they could propose policies that would make driving more burdensome. And they certainly seem to do wonders in chasing would-be baby-makers out of the city. All three cities have among the lowest percentages of children of any in the U.S.

    Perhaps the toughest issue facing the Ecotopian political economy lies with the issue of class. Callenbach’s Ecotopia adopts something of an anarchic socialism; the cities of the real ecotopia have tended toward ever greater class bifurcation.

    San Francisco, for example, boasts one of the highest per capita incomes in the nation and remains a favorite destination for inherited wealth, whether among individuals or nested in nonprofits. Yet according to the Public Policy Institute of California, if the cost of living is applied, San Francisco ranks high among urban counties in terms of its concentration of poverty.

    It doesn’t help that the city’s economy has been hemorrhaging corporate headquarters and mid-range middle-class jobs for decades. High-end workers commute to Google and other Valley companies, and others work in the financial or media sectors, but many mid-range jobs have been lost, many of them to more affordable business-friendly locales in places like Colorado.

    As middle-class jobs disappear, Ecotopia’s cities increasingly resemble restrictive communities that are anything but diverse. As analyst Aaron Renn has pointed out, Portland and Seattle stand as among the whitest big cities in the nation. And San Francisco’s once vibrant African-American population has been dropping for decades.

    In the coming years this pattern will likely become more pronounced in Seattle and Portland as well. These cities continue to attract many well-educated people, particularly from California, who in turn bring with them both significant accumulated wealth and anti-growth attitudes.

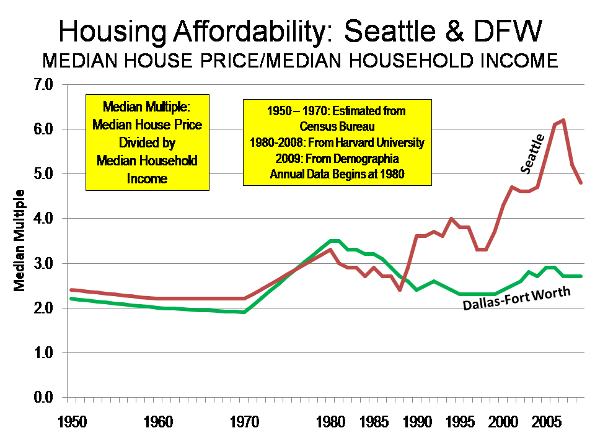
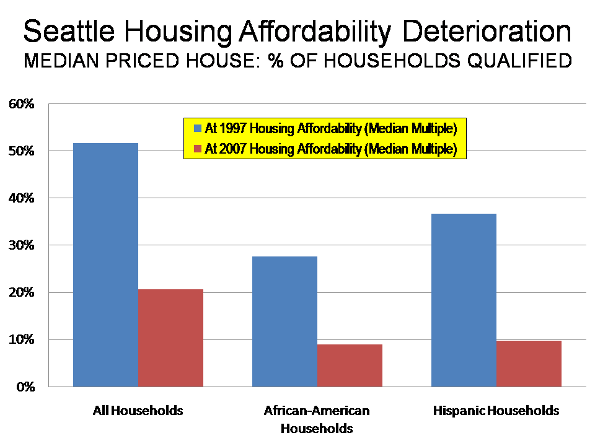
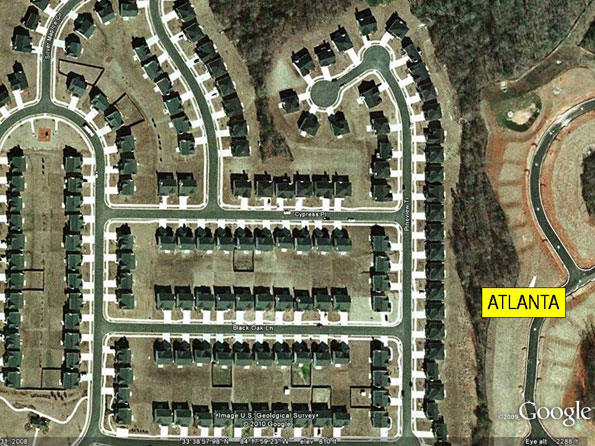
    Strict “green” planning regimes are also accelerating the decline of the local middle class by driving housing prices up, greatly diminishing the once wide affordability for the middle class. Seattle’s regulatory environment, according to one recent study, has bolstered housing prices in the region by $200,000 since 1989. The percentage of families who could afford a median price home in the area has fallen by more than half.

    Many observers see a similar outcome from Portland’s widely ballyhooed planning regime. Despite the massive acceptance by planners as something of a model for the restored city, the vast majority of all job and population growth in the region has occurred at the less pricey fringes, including across the river in Vancouver, Wash., which lies outside the fearsome Portland planning regime.

    So what is the future for the region, and particularly the eco-cities? If the country starts moving toward the center, and even the right, you can expect Ecotopian sentiment to rise again, perhaps not to the point of secession but expressed in attitude.

    But this may not be all bad. As America’s population grows and other regions rise, perhaps it’s helpful for the various parts of the country to experiment with different systems. Short of civil war, there’s something to be said for relentless, even if sometimes daft, experimentation at the local level. The rest of country may not follow all their strictures, but our would-be Ecotopians could produce some interesting and even usable ideas.

    This article originally appeared at Forbes.com.

    Joel Kotkin is executive editor of NewGeography.com and is a distinguished presidential fellow in urban futures at Chapman University. He is author of The City: A Global History. His newest book is The Next Hundred Million: America in 2050, released in Febuary, 2010.

  • The Nile Flows North

    “How can a river flow north?” the real estate lady asked me. “I mean, it’s impossible.” The offending river, within whose watershed I proposed to buy a house, is the Wallkill. It rises in Northern New Jersey – near Sparta – and passes by Middletown, NY, and through Montgomery, Walden, the eponymous town of Wallkill, New Paltz, Rosendale, and finally (with a complication) drains into the Hudson River at Kingston, NY – approximately 100 miles north of its source.

    In defense of the American public school system, I add that my realtor was born and educated in Europe.

    A colleague of mine (I work at a university) said at least semi-seriously that, except for the Nile, the Wallkill is the only river in the world that flows north.

    Now where have I heard that before? I used to live in DeKalb, Illinois. It was common wisdom in those parts (indeed, if memory serves, even stated in the student newspaper), that – except for the Nile – the Kishwaukee River is the only river in the world that flows north.

    You’ve all heard of that, of course: the famous, north-flowing Kishwaukee? The only problem is that only the South Branch (sort of) flows north. The main course, if anything, heads south.

    I grew up in Eugene, OR, at the headwaters of the Willamette, which really does flow north. But I don’t recall any of my high school chums telling me about the Willamette and the Nile. Maybe they knew me too well. Or perhaps that’s because so many other rivers in Oregon flow north: the Deschutes, the John Day, and the Hood. Even the Oregon portion of the Snake flows north.

    I do understand that in Cairo the word on the street is that, except for the Willamette, the Nile is the only river in the world that flows north. Odd, since in Sudan for about 200 miles, the Nile River actually flows south.

    So what accounts for this urban legend that (fill in the blank) river and the Nile are the only two rivers that flow north? I can think of three reasons.

    First, had I pressed her, the reason that my Realtor likely would have given: Rivers flow down, south is down on the map, and therefore rivers must flow south. OK, so that one is silly. My European Realtor should consider the Rhine, Elbe, Neisse, Vistula, and (arguably) the Seine or the Havel.

    My colleague, on the other hand, is smarter. He asked for an example of another north-flowing river, and I (pulling his chain) mentioned the St. Lawrence.

    “But that doesn’t really flow north.”

    And it is true, it flows only northerly. But that begs the question: how true to the compass does a river actually have to flow before it counts with the Nile? Clearly, if you define “north” narrowly enough, then very few rivers flow north – not even the Nile.

    I gave him better examples: The Mackenzie, Churchill, Red (ND), Fox (WI), San Joaquin, Bitterroot, Yellowstone, Madison, Jefferson, Lualaba.

    The Lualaba? That, my friend could argue, surely shouldn’t be on the list, though it flows nearly due north for almost 1000 miles. After all, it is just a different name for the Congo, upstream from Kisangani Falls. But nobody really knew that: for at least two centuries it was thought that the Lualaba drained into the Nile, surely establishing its northward credential. It was only in 1877 that Henry Morgan Stanley (of “Dr. Livingstone, I presume” fame) took a boat down the Lualaba all the way to its mouth at the Atlantic Ocean.

    Lest you think that multi-named rivers exist only in uncharted Africa, think again. Our very own Niagara River flows due north, from Lake Erie to Lake Ontario, and is just an extension of the St. Lawrence.

    The Lena, the Ob, and the Don flow north, all of which drain into the Russian arctic.

    But that brings us to the third reason for this persistent legend: that it’s true. No, I am not wearing a tinfoil hat, but even the most improbable urban legends have a grain of truth. I’ll argue this one does, and here is why.

    Most of the world’s continents are in the northern hemisphere, and conversely, oceans are disproportionately in the southern. Thus, to reach the ocean, rivers must on average flow south.

    We are all subject to the Mercator fallacy, and assume that the northern coast is as long as the southern. But it isn’t. The northern shores of Russia, Alaska and Canada are much, much shorter than the southern coasts of Asia, Europe and North America. Thus, just by the odds, there have to be many fewer rivers flowing north than flowing south. I do believe this is true.

    How could one prove that? I don’t know. It would be a lot of work – counting rivers, controlling for south-heading-north-flowing ones, etc., etc. Not worth the candle. So I’ll just accept my hypothesis as both reasonable and true.

    I’m not willing to give my real estate agent much credit. But my university colleague is not quite as far off the mark as you might have originally thought. North-flowing rivers are, indeed, relatively rare.

    The Richelieu, Monongahela, Shenandoah, and the St. Mary’s (FL).

    I’ve listed all the ones I can think of. Can you think of more? Creeks, brooks, streams and canals don’t count. And neither does the St. Lawrence. But other than that, I’m curious what you’ll come up with.

    Except for the Nile.

    Daniel Jelski is Dean of Science & Engineering State University of New York at New Paltz.

  • The Heavy Price of Growth Management in Seattle

    The University of Washington Study: Economist Theo Eicher of the University of Washington has published research indicating that regulation has added $200,000 to house prices in Seattle between 1989 and 2006. Eicher told the Seattle Times that “Seattle is one of the most regulated cities and a city whose housing prices are profoundly influenced by regulations.”

    Not surprisingly, this caused consternation in the planning community, which would prefer to minimize or dismiss any negative consequences of planning regulations on housing affordability.

    The Washington Chapter of the American Planning Association (W-APA) published a response. Admitting that “land use regulations do add costs to housing”, it criticizes the Eicher study for focusing “solely on cost” and ignoring how land use regulations add to the quality of life. (Note 1). A recent Washington Policy Center report provides a detailed critique of the W-APA report. This article evaluates Seattle housing affordability trends using basic price and income data and the Median Multiple (median house price divided by median household income), a standard affordability measure that has been recommended by both the World Bank and the United Nations.

    How Growth Management Raises House Prices: It has been established that overly prescriptive land use regulation (called growth management or smart growth) raises house prices. As the former governor of the Reserve Bank of New Zealand Donald Brash has pointed out the affordability of housing is overwhelmingly a function of just one thing, the extent to which governments place artificial restrictions on the supply of residential land.

    However, the mere adoption of growth management or smart growth polices does not increase housing costs. Where, for example, an urban growth boundary (a favored strategy of growth management) is drawn far enough from the urban area, there may be little interference with developable land values. This was the case in Portland, for example, in its early growth management days. However, as land was developed and the urban growth boundary was not moved sufficiently outward in response, land became more scarce and land prices were driven up, leading to Portland’s severe housing unaffordability.

    How Growth Management Drives Up House Prices: Land prices are driven up as market participants perceive scarcity. When government policies constrict the supply of land, developers purchase “land banks” to ensure that they have access to land inventory. Without growth management, developers and builders can purchase land when they need it, because governments have not placed artificial restrictions on its supply.

    In the more prescriptive environment, property appraisals rise and sellers are able to obtain higher prices because development is prohibited on most land. In short, sellers face less competition and can command much higher prices.

    Sometimes growth management proponents claim that their communities have sufficient land available for building. However, the interplay between land buyers and sellers creates a rigged game that leads to higher land prices. This is obvious in everywhere from Seattle and Portland to California and Florida. In these markets, there is not a sufficient supply of “affordable land” for building. A New Zealand government’s “2025 Taskforce” found the price of comparable land to be about 10 times as high if it is inside an urban growth boundary rather than outside (essentially across the road).

    Seattle’s Lost Housing Affordability Decade: During the decade of the housing bubble (1997 to 2007), the median house price increased from $169,000 to $395,000 in Seattle. In 1997, Seattle’s housing affordability was rated “moderately affordable,” with a Median Multiple of 3.3 (median house price divided by median household income). By 2007, the Median Multiple had escalated to 6.2, indicating housing unaffordability worse than any major metropolitan area between World War II and 1997. (Figure 1). Of course, other markets, particularly in California, became even more unaffordable after 1997.

    In Seattle and other more prescriptive markets, house prices exploded during the housing bubble. At the same time, many other markets experienced only modest house price increases. The easier money and profligate lending practices thus produced very different results. In more prescriptive markets, like Seattle, both underlying and speculative demand drove prices to unprecedented heights. In the more responsive markets, the generally higher underlying demand was accommodated by planning systems that permitted sufficient new housing to be built on affordable land and price escalation was far more modest (as were subsequent price losses).

    New House Example: The role of Seattle’s growth management in driving up land and house prices is obvious. According to W-APA, approximately 62% of the cost of a new house in 1999-2000 was in construction costs. A new house in 1997 costing the same as a median house price would have involved approximately $105,000 in construction costs. Based upon subsequent house cost increases and the decline in house construction costs relative to the rest of the nation in Seattle, construction costs on the same house should have risen $40,000 from 1997 to 2007 (Note 2). At the same time, the median house price in Seattle increased $225,000. Less ss than 20% of the cost escalation could be attributed to construction cost inflation. Nearly $185,000 was due to other factors, principally higher land prices.

    Comparing Seattle to Dallas-Fort Worth: Things were very different in more responsive markets, as is illustrated by Dallas-Fort Worth (Figure 2). Dallas-Fort Worth, now the nation’s fourth largest metropolitan area, trailing only New York, Los Angeles and Chicago has grown more than twice as fast as Seattle (21.2% from 2000 to 2008, compared to 9.6%). Dallas-Fort Worth’s underlying demand has been even greater relative to Seattle, as indicated by its net domestic migration. Dallas-Fort Worth has added more than 10 times as many domestic migrants (260,000 versus 23,000) and more than 5 times its 2000 population (5.0% v. 0.8%). Moreover, and perhaps surprisingly, the Dallas-Fort Worth urban area (along with Houston) is more compact (read “sprawls” less) than Seattle (Note 3). Finally, the share of sub-prime mortgages was higher in Dallas-Fort Worth than in Seattle.

    Yet, despite this huge demand, housing affordability has remained below the historic Median Multiple norm of 3.0. In 2007, the Dallas-Fort Worth Median Multiple was 2.7. The median house price increased $32,000 from 1997 to 2007 and more than 70% of the change was due to construction costs.

    In 1997, the Seattle median house price was $54,000 higher than in Dallas-Fort Worth. By 2007, the price of a median house in Seattle had escalated to nearly $250,000 more than its counterpart in Dallas-Fort Worth (Since 2007, house prices have dropped $90,000 in Seattle and $5,000 in Dallas-Fort Worth, illustrating the more intense price volatility of tightly regulated markets. Even so, Seattle housing affordability remains materially worse than before).

    Driving Households out of the Home Ownership Market: If 1997 housing affordability (using the Median Multiple) had been retained, 50% of Seattle households would have been able to qualify for a mortgage on the median priced house. However, by 2007 only about 20% of Seattle households could have qualified for a mortgage on the median priced house in 2007 at present FHA underwriting standards (Note 4).

    Impact on Minority Households: The highest price, however is being paid by Seattle’s minority households (Figure 2).

    • The share of African-American households able to qualify for a mortgage on the median priced house declined nearly 70% compared to 1997 affordability (Median Multiple). At 1997 housing affordability, more than 25% of African American households would have been able to qualify for a mortgage on the median priced house in 2007. In reality, by 2007, less than 10% of African-American households could have qualified for a mortgage on the median priced house.
    • The share of Hispanic households able to qualify for a mortgage on the median priced house declined more than 70% compared to 1997 affordability (Median Multiple). At 1997 housing affordability, more than 35% of Hispanic households would have been able to qualify for a mortgage on the median priced house in 2007; by 2007 than number had plunged to less than 10%.

    The High Price of Growth Management in Seattle: The 10-year trend of house prices increases in the Seattle metropolitan area supports Eicher’s analysis. We readily admit to the charge of evaluating housing affordability “solely on price.” There is still the dubious W-APA claim that land regulation adds to the quality of life. But whose quality of life? As housing affordability declines, the quality of life may be raised for some, but only by keeping others down.


    Notes:

    (1) The W-APA report makes the common error of presuming that land use restraints were not a factor in the house price escalation of Phoenix and Las Vegas. In fact, the Brookings Institution ranks both metropolitan areas as toward the more restrictive end of the regulatory spectrum. These overly prescriptive regulatory environments are exacerbated by the fact that in both metropolitan areas much of the developable suburban land is owned by government, and is being auctioned, though at a rate less than demand. These factors combined to drive auction prices per acre up nearly 500% in Phoenix and nearly 400% in Las Vegas during the housing bubble. Despite their high building rates, these land restrictions denied sufficient affordable land for development to keep house prices from rising rapidly. Further, W-APA refers to Phoenix and Las Vegas as having “relatively unfettered sprawl,” yet both are more compact than Seattle. In 2000, the Las Vegas urban area (area of continuous urban development) was 62% more dense than Seattle and the Phoenix urban area was 28% more dense than Seattle (calculated from US Bureau of the Census data).

    (2) There are no reliable sources for median new house prices at the metropolitan area level. Generally, however, US Bureau of the Census data indicates that in the West, the median priced new house costs have averaged 6% more than the median priced house in the 2000s. Construction cost escalation (national and Seattle) is calculated from R.S. Means Residential Square Foot Costs (1997 and 2007 editions).

    (3) In 2000, the Seattle urban area had a density of 2,844 persons per square mile. Dallas-Fort Worth had a density of 2,946 and Houston had a density of 2,951. All three were relatively close to Portland (3,340), but well behind Los Angeles (7,069), which is the most dense major urban area in the nation.

    (4) Estimated assuming a FHA “front end ratio” of 29%, (mortgage, property tax and homeowners insurance divided by gross annual income) and a 10% down payment. Calculated using 2007 American Community Survey income data for the Seattle metropolitan area.


    Wendell Cox is a Visiting Professor, Conservatoire National des Arts et Metiers, Paris. He was born in Los Angeles and was appointed to three terms on the Los Angeles County Transportation Commission by Mayor Tom Bradley. He is the author of “War on the Dream: How Anti-Sprawl Policy Threatens the Quality of Life.

  • Creating a Pearl River Delta Megapolis, The Growth Story of the 21st Century

    In Southern China, the Pearl River Delta is giving rise to an urban super-power in the first rank.

    In 2005, the wealthiest metropolises were still led by the thriving urban agglomerations of the leading advanced economies in North America, Western Europe and Japan; that is, Tokyo, New York City, Los Angeles, Chicago, Paris and London. The scale economies of these metropolises are as significant as those of many national economies. For instance, the estimated GDP of Tokyo and New York City, respectively, was not that different from the total GDP of Canada or Spain, whereas London’s estimated GDP was higher than that of Sweden or Switzerland.

    In contrast with 2005, when most of the top-100 wealthiest cities were in the G-7 economies, by 2020 a third of these wealthy cities will be in the large emerging economies. However, such rankings are based on linear extrapolations, which tend to downplay growth differences and the impact of rapid urbanization. One of such rapid-growth regions is the Pearl River Delta (PRD), or Zhusanjiao – Southern China’s low-lying area where the Pearl River flows into the South China Sea.

    This area includes Metropolitan Guangzhou, a city of 10 million, capital of the Guangdong Province, which has more than 110 million people; Shenzhen, one of the fastest-growing cities in the world; and Hong Kong, one of the most competitive cities worldwide. In this region, urban planners are joining forces to create a massive Pearl River Delta Megapolis – which includes half a dozen cities of more than 4 million people each (Guangzhou, Shenzhen, Hong Kong, Dongguan, Foshan, and Jiangmen).

    Since the economic liberalization in the late 1970s, the PRD has become one of the leading economic regions and a major manufacturing center of China. It is an ideal place for foreign investment. Hong Kong provides a world-class financial, logistics and service center, while Guangdong has first-rate electronics and manufacturing capabilities. It is these complementarities that are expected to drive the rise of the PRD region.

    Two Cities, Two Systems: Hong Kong and Shenzhen

    In 1997, Hong Kong reverted to Chinese sovereignty as a Special Administrative Region (SAR). China promised Hong Kong a 50-year autonomy; “one-country, two systems”, as Deng Xiaoping put it.

    Measured by purchasing power parity, Hong Kong’s GDP per capita today is about $42,600 (the U.S. average is $46,600). With its seven million people, it is almost as prosperous as Switzerland in terms of GDP per capita.

    This success is linked to China’s soaring economic growth, Hong Kong’s tax incentives, financial services, and its role in global trade. Despite Asia’s 1997 crisis, the technology sector slowdown, and SARS, Hong Kong’s economic engine has continued to hum. Today, the resilient city-state remains a globally important trade, shipping and the financial hub for the Greater Pearl River Delta.

    In the past, Hong Kong was the main gateway to mainland China. As the mainland has given rise to rapidly-growing and increasingly prosperous 1st tier metropolises, there are now almost 110 cities with more than 1 million people in China (by 2025 there will be more than 150 such cities in China). As a result, the role of gateway cities is becoming redundant.

    In 2008, Hong Kong International Airport handled almost 48 million people. However, since the opening of the Baiyun International Airport in Guangzhou, just one hour away from Hong Kong via a high-speed ferry, the region has been growing as an air transportation hub for the region. In 2008, it handled more than 33 million people and was the 2nd busiest airport in mainland China in terms of passenger traffic. Currently, Guangzhou is preparing for the Asian Games in late fall 2010, which will attract millions of visitors.

    Despite 30 million tourists in Hong Kong last year, the growth levels are highest in nearby Macau, China’s Las Vegas, where half of the $22 billion GDP is attributed to gaming, tourism and hospitality industries. It was shipping that initially made Hong Kong, still one of the world’s biggest container ports by output. Ever since Yangshan, a massive deepwater port off the southern coast off Pudong, opened its first phase in 2004, Shanghai’s role has risen rapidly. In 2008, the list of the world’s busiest container seaports – measured by total mass of shipping containers – was led by Singapore, followed by Shanghai, Hong Kong, Shenzhen and Guangzhou.

    Since Shenzhen was established as China’s first economic zone in 1979, the former fishing village has exploded into a prosperous city of 9 million; if, floating migrant population is included, the population base probably exceeds 14 million. Today, Shenzhen has been rated the fifth most crowded city in the world, following Mumbai, Calcutta, Karachi and Lagos – and the first in population density in China, according to Forbes magazine.

    The urban density of population in Shenzhen is 17,150 people per square kilometer, followed by Shanghai at 13,400 people. For a comparison, urban density in metropolitan Los Angeles and New York is 2,750 and 2,050 people, respectively. Unlike the U.S. cities, however, Chinese cities continue to grow – rapidly.

    Shenzhen lacks Hong Kong’s financial sophistication and global mindset. Hong Kong would like to take advantage of Shenzhen IT capabilities and manufacturing cost-efficiencies. Together, the two could evolve into the mainland’s technology hub and IPO venue.

    In 2008, Shenzhen’s GDP per capita was already $13,200 (almost approximate with Taiwan or South Korea). Combined, the total GDP of Hong Kong ($215 billion) and Shenzhen ($120 billion) would be about the same as that of Argentina or Iran.

    “Front Shop, Back Factory” Is No Longer Enough

    As the United States was swept by the global recession in late 2007, the Guangdong and Hong Kong governments intensified their high-level strategies for cooperation. The leaders of the province and the city-state see the next 20 years as a golden age in the acceleration of economic integration between the two territories, and in the creation of a world-class Pearl River Delta Megapolis.

    The proponents of the integration tend to use the term ‘metropolis.’ In fact, the PRD agglomeration would simply dwarf existing metropolises worldwide. Accordingly, the term ‘megalopolis’ may be more appropriate.

    The basic goal of this massive integration would be to enhance quality of life and status of the Greater Pearl River Delta agglomeration. Accordingly, the proponents of the GPRD seek to speed up the upgrading and restructuring of industries in the region. They hope to ensure Hong Kong’s continued prosperity and stability and increase the integrated competitiveness of the region. They also hope to develop an important engine for the development of China and the Pan-Pearl River Delta Region.

    Naturally, such objectives require substantial industrial restructuring and upgrading. In the course of 30 years of China’s reform and opening up, Hong Kong and the Pearl River Delta region jointly created an economic miracle based on the model of “Front Shop, Back Factory”. In this model, the PRD region served as the factory of the world, while Hong Kong exploited its service capabilities.

    The growth model is no longer sustainable. It has been continuously weakened. At the same time, signs of change have already become apparent in Guangzhou.

    The Pearl River Delta manufacturing industry has entered an era of restructuring, consolidation, and upgrading in three major sectors; that is, the region’s key industries, the high-tech industry and industry supporting systems. Overall, future prospects for the manufacturing industry look bright.

    Megapolis-in-Progress

    In Guangdong, Party Secretary Wang Yang has called for new thinking on Guangdong-Hong Kong economic integration, while Hong Kong’s Chief Executive Donald Tsang has stressed the need to strengthen Guangdong-Hong Kong economic cooperation. Nearly 80 percent of the residents in the two territories surveyed express confidence in accelerated cooperation between the two territories.

    Still, the plan also poses monumental problems and obstacles, including differences between Guangdong and Hong Kong in their legal, economic, public administration and social services systems. In addition to these differences, the region’s rapidly-growing urban centers have strategic objectives of their own. Competitive strains also exist between the different cities in the region.

    Yet, the incentives for agglomeration are more powerful. The development of the PRD Megapolis would spur growth in the region’s GDP, trade and investment. Some think-tanks expect the GDP of the PRD Metropolis to exceed $2.7 trillion on the basis of the current exchange rates in the next 30 years. For all practical purposes, this would mean that, by 2038, the PRD GDP would be comparable to that of the New York or London metropolitan areas. It will no longer be and up-and-comer; like Tokyo, it will stand as an urban super-power in the first rank – but more than three times bigger.

    Dr. Dan Steinbock is research director of international business at the India, China and America Institute (USA). He currently also serves as senior fellow at the Shanghai Institute for International Studies (SIIS), and visiting professor at the Shanghai Foreign Trade Institute. Dr Steinbock divides his time between New York City, Shanghai and Guangzhou, and occasionally Helsinki, Finland. His new book is Winning Across Borders: How Nokia Creates Strategic Advantage in a Fast-Changing World (Jossey-Bass/Wiley, April 2010) and his most recent policy brief is “Legacy and Globalization: Shanghai and Hong Kong as China’s Emerging Global Financial Hubs” (SIIS).

  • The Compelling Case For The Cable Car

    Say the words “cable car” and most people think of trolleys being towed up and down San Francisco’s hilly terrain. Most view them as a charmingly antiquated heritage system for the tourists, not as modern mass transit. But cable cars are making a comeback.

    Today, cable cars are one of a family of technologies collectively called Cable Propelled Transit (CPT). New generations of CPT not only include cable cars, but aerial trams, gondolas and funiculars as well.

    San Francisco cable cars, it should be noted, bare virtually no resemblance to these contemporary CPT systems, save for their basic method of propulsion. The technology used in San Francisco is roughly 120 years old, with little modernization. Wooden blocks pressed against the street are still used as brakes, and vehicles are manually operated.

    San Francisco cable cars are not so much cable transit as they are a living history of cable transit’s past. So why, then, is cable re-emerging as a technology of choice — preferred to buses, streetcars and light rail — to many public transit agencies around the world? Cities are discovering that cable’s inherent flexibility and adaptability gives it capabilities that no other transit technology shares. Adaptability, safety, reliability, price, environmental impact, speed, capacity, and a successful track record all contribute to these newfound positive impressions.

    The Innsbruck Hungerburgbahn, one of the world’s only Hybrid Funiculars. Image: Steven Dale.

    Yet despite cable’s growth in the last 10 years, the US transit industry is still largely ignorant about the technology. Ironic, considering the technology has a uniquely American history.
    Around 1890 there were roughly 500 miles of US cable car lines. While cable had been invented primarily as a means to ascend steep hills, the simple technology spread. Chicago, for instance, moved 27 million passengers per year. The system was a tremendous money-maker and the poster-boy for cable because – against all conventional wisdom – engineers had the chutzpah to install lines in one of the coldest, flattest cities in the country. A line in St. Paul, Minnesota was soon to follow.

    But by the turn-of-the-century, virtually all cable car systems had been converted to electrified streetcars, which at the time were more cost-effective and safer. Perhaps as a result of that legacy, more often than not today’s planners assume cable is a slow, expensive and dangerous technology, only useful in mountain regions for carrying a few skiers from one chalet to another. A 1989 study from the University of West Virginia confirmed this perspective, and it seems that perceptions haven’t changed much in the last 20 years.

    The Mandalay Bay Cable Liner is one of a new generation of cable cars that operate on light-weight elevated steel guideways. This system was installed in less than a year. Image: amitP at Flickr.com

    Here’s the real record:

    Popularity and Reliability: With the exception of San Francisco’s system, modern cable transit is not manually operated; it’s fully automated, which eliminates the cost of drivers and increases safety levels. This full automation offers the promise of unmatched reliability and efficiency levels; current systems boast reliable less-than-one-minute (LT1M) wait times between vehicles.

    This potential is key to the ridership level of any public transit system. According to the Transportation Research Board, wait times are 2.0 – 2.5 times more onerous to riders than actual in-vehicle time, and the reliability of those wait times is equally important. While most rail-based transit lines experience ridership that is half what was forecasted, cable tends to experience ridership above forecasts.

    The Perugia MiniMetro, every minute a 50 person vehicle arrives in the station. Vehicles travel above ground, below ground and at grade. Image: Steven Dale.

    Cost: CPT is cheap to build and maintain. The vehicles operate without engines, which drives down construction and maintenance costs. Cable transit systems can be built and maintained for a fraction of the cost of typical light rail systems.

    Safety: With the exception of elevators (which utilize the same basic technology), there are few public transit technologies with as good a safety record as cable. Over 10,000 cable installations operate worldwide, transporting billions of people per year, yet accidents are rare and fatalities are almost unheard of. The last known death associated with modern cable transit occurred in 2008 when a man fell from a gondola due to drunken horseplay.

    The Parque das Nações gondola in Lisbon demonstrates that cable isn’t just for mountains. Image: ricardo-pereira at Flickr.com

    Energy Efficiency: From an environmental standpoint, cable is in a class of its own. Due to its use of gravity and counter-balancing, it is not uncommon for maintenance workers to witness a cable system’s energy consumption drop below zero during peak loads. That is, the system itself can generate power.

    Speed: Cable transit can operate at speeds of up to 45 km/hr, well in excess of the average speeds of most traditional transit technologies. According to the American Public Transit Association, buses average approximately 20 km/hr; subways 33 km/hr; and light rail 24 km/hr. Average speed in urban public transit is dependent upon station spacing and right of way, not technology choice.

    The Portland Aerial Tram connects the Oregon Health Sciences University to the local transit grid. Image: dane brian at Flickr.com

    Capacity: Aerial cable transit systems can move up to 4,000 persons per hour per direction (pphpd) and ground-based systems can move up to10,000 pphpd. There is no single light rail line in all of North America that offers capacity greater than 3,700 pphpd and the average is less than 1,700.

    Adaptability / Flexibility: While it’s true that most cable installations cater to tourists, there is no reason to assume that they must. Similarly, just because most cable transit uses short line lengths, does not mean that the technology cannot be implemented over great distances. The technology is highly adaptable: while crossing rivers and climbing mountains are obvious applications, a system in Slovakia, for example, transports cars instead of people.

    The Vinpearl Island Gondola. The US$6 million dollar system links the Vietnamese mainland with the Vinpearl Island resort across 3 km of sea. The system is designed to withstand monsoons and earthquakes. Image: Jame at Flickr.com

    The Track Record: CPT is proven, unlike imagined but not-yet full-scale technologies like Personal Rapid Transit (PRT). Public transit systems in New York, Medellin, Caracas, Portland and Constantine, Algeria have all implemented aerial cable systems as fully-integrated components of their transit system. In addition, bottom-supported cable cars have found increased usage in airports, hotels and as full-scale public transit in Innsbruck and Perugia.

    A track record like that deserves attention.

    Steven Dale is the founder of Creative Urban Projects (CUP Projects), a boutique planning shop in Toronto, Canada. He is an expert on Cable-Propelled Transit with several years experience researching and consulting in the field. He recently launched The Gondola Project, an advocacy campaign in support of CPT. For more information, also visit Creative Urban Projects.

    Lead image: The Medellin MetroCable. The world’s first gondola system fully-integrated into a transit system. The initial line has been so successful, it has spawned an additional two lines in Medellin, Columbia. Image: il Castigliano at Flickr.com

  • “A” is for Avenue

    Pity poor Matamoras, PA, population 2,600, located on the Delaware River where Pennsylvania, New York and New Jersey all come together. The town has only two named streets: Delaware Drive (parallel to the river), and Pennsylvania Ave. (perpendicular).

    Other streets parallel to the river are numbered: 1st, 2nd, 3rd, and so on, up to 10th. The avenues, perpendicular to the river, start with Avenue A in the north, and continue to Avenue S, in the south. Pennsylvania Ave., the main drag, is between “K” and “L”.

    What a boring little town!

    For another egregious example, consider Springfield, OR. The main street, imaginatively named Main Street, runs E-W, between South A Street and A Street. The other names are predictable: B Street, C Street, and…well, you get the idea. And, surprise, surprise, the N-S streets are numbered, from 1st all the way up to 75th Street (it seems there are no avenues in Springfield). Now Springfield, with nearly 60,000 people, does have a few more named streets than Matamoras (K Street has been renamed Centennial Blvd.), but not many.

    Where does this sad state of affairs come from? I will guess it started in Washington, DC, where Pierre Charles L’Enfant was imported from France to design the city. He brought with him the malign influence of the French Revolution: an irrational belief in hyper-rationality. And so Washington is on a strict grid, with lettered streets running E-W, and numbered streets N-S.

    Superimposed on this grid are streets named for states, most famously Pennsylvania Ave. To a very crude approximation, the States form a separate, looser grid offset by 30 degrees, though in reality they go every which way. Allegedly they provide grand vistas, and I guess they do. You’d have to tear down the Treasury Department to get the full effect.

    In my view, the lettered grid streets are boring, and the state streets are unpredictable. Thus Washington is simultaneously hyper-rational and nearly unnavigable – the worst of both worlds. Beyond the federal triangle it isn’t a very attractive city, either.

    So now consider New York City, or specifically, Manhattan. This appears even worse than Washington, what with all roads numbered. N-S roads (parallel to the primary axis of the island) are called Avenues, and are numbered from 1st Avenue in the east, the 12th Avenue along the Hudson. The E-W roads (along the island’s minor axis) are also numbered, designated Streets, starting with 1st Street (just north of Houston), and ending at 220th Street, at the northern tip of the island. Thus the corner of 33rd St. and 3rd Ave. is a perfectly legitimate address, as could be 8th Ave. and 88th St.

    But it is even worse than this. The widest point of the island is on the Lower East Side, and hence there is a chunk of real estate east of First Avenue. Not wanting to give tenement houses imaginative addresses, the Avenues are lettered: Avenue A, Avenue B, Avenue C and Avenue D. (When I first visited New York as an adult in the 1970’s, this area was too dangerous to walk around even during the day. In recent years I’ve explored the Lower East Side on foot with no problems and great enjoyment.)

    But unlike Matamoras, or Springfield, or even Washington, New York City works. Why?

    The Commissioners’ Plan of 1811 that platted the city of New York turns out to be a work of great genius. The key insight is asymmetry, or more accurately, anisotropy. Or, in colloquial terms that any New Yorker will understand, the difference between long blocks and short blocks.

    For in Matamoras, Springfield, or Washington (or Chicago, or almost any other city you can name), the blocks are square. But not in New York – there the blocks are rectangular at a ratio of approximately 3 to 1. The long blocks, between the Avenues, are approximately 6 blocks to the mile. The short blocks, between streets, are approximately 20 blocks to the mile. Note the word “approximate.” The Commissioners were smart enough to build in slight variations based on circumstance – no hyper-rationality here.

    It is impossible to exaggerate the importance of this fact. To pick a modest example, consider the Empire State Building. That building occupies half a city block between 33rd and 34th Streets on the west side of 5th Avenue (extending half way to 6th Avenue). This half block lends the building its unique aspect ratio – approximately 1.5:1 (close to the Golden Ratio). Think how much more interesting the architecture is than a building (e.g., the Sears Tower) forced into a square block. A square Empire State Building wouldn’t look the same at all.

    The Avenues, few and far between, are all broad boulevards with magnificent views. Consider 5th Avenue, looking downtown to the Washington Square Arch, or uptown toward Rockefeller Center. Indeed, every Avenue, from First through at least Ninth, rewards the pedestrian with a fantastic view. On this, New York beats Washington. (West of 9th Avenue, the wag might argue, just gets too close to New Jersey to be nice.)

    Instead, do you want a little side street? Pick a number – almost any number will do – between 1 and 220, and walk cross town. Pleasant, quiet and interesting neighborhoods await. There are a few numbers – 14th St., 23rd St., 34th St., 42nd St. – which, by the Commissioners’ design, are wider traffic thoroughfares, and impressive in their own right.

    New York has two other features worthy of note. One is Central Park, between 5th Avenue and 8th Avenue, from 59th Street to 110th Street. The facetious address I listed above (8th Avenue at 88th St.) doesn’t quite exist, for the Avenue along that stretch is known as Central Park West. But allowing for that difference, at 88th St. it would be a very elegant address indeed.

    The second feature is the country road along the Hudson that the Commissioners rechristened as a fantastic parade route. Today we know it as Broadway. It does not follow the grid, but instead starts at Battery Park and meanders its way north and west the entire length of the island. It intersects the grid at memorable locations: Union Square, Herald Square, Times Square, Columbus Circle, and more. Please don’t forget the Flatiron Building at 23rd St. (Madison Square).

    There’s more: I haven’t talked about Lower Manhattan at all, nor any of the wonderful things you can do, see and eat. But I’m out of space, so I’ll leave it here for now. I’ve never lived in New York City. Now that I live nearby, I take the train and walk the Commissioners’ streets as often as I can. Hope you can do that, too: New York is the greatest city in the world.

    Daniel Jelski is Dean of Science & Engineering State University of New York at New Paltz.

  • The Transportation Community Braces for Continued Uncertainty

    Recent game changing events — notably, the Massachusetts election depriving the Senate Democrats of a filibuster-proof 60-vote majority, and the projected record breaking $1.6 trillion deficit in the FY 2011 budget proposal — have introduced serious uncertainties into the President’s domestic agenda. The federal surface transportation program is no exception.
    Even though this program traditionally has enjoyed bipartisan support it, too, is being buffeted by the shifting political winds. What follows is an assessment of the status and prospects of four legislative initiatives that bear directly on the future of the federal transportation program.

    The National Infrastructure Bank
    The National Infrastructure Bank (NIB) has been receiving a lot of attention lately. It was the subject of a January 20 press conference sponsored by the Building America’s Future coalition. It was endorsed in a Wall Street Journal op-ed by three members of the president’s Economic Recovery Advisory Board. And it was discussed by a panel of experts at a January 25 seminar on “Financing Public Works in Turbulent Times” sponsored by New York University. Responding to the multiple pleas, the White House included a modest $4 billion for the bank in its FY2011 budget request.

    The press conference featured a group of prominent long-time NIB advocates — Pennsylvania Gov. Ed Rendell, Senator Chris Dodd (D-CT), Rep. Rosa DeLauro (D-CT), former House Majority Leader Dick Gephardt and Ambassador Felix Rohatyn. Representatives of some 20 interest groups and trade associations provided a supporting cast. The speakers spoke eloquently about the need for greater infrastructure investment in America and how the National Infrastructure Bank could effectively serve that purpose. The Bank, they said, would fulfill three policy objectives: finance projects of regional and national importance, and create jobs and long-term economic growth. It also would serve as a vehicle for making better resource allocation decisions — based on merit rather than on pork barrel politics.

    The press conference failed to do, however, was to clarify some of the questions posed by critics of the NIB concept. Reason’s Robert has noted that if the NIB were set up “as a genuine bank, operated on commercial principles“, it would not able to fund a broad range of public infrastructure projects, some of which, such as schools, public housing and mass transit facilities which do not generate a revenue stream that could be used to repay the bank loans. Hence, the NIB would require periodic federal appropriations to cover grants for non-revenue producing projects. In that sense, it might turn out to be more like a foundation than a bank.

    There is little likelihood that Congress would be willing to turn the power of decision over large-scale capital projects to a new bureaucratic organization lodged in the Executive Branch. Many lawmakers, including the powerful chairman of the Senate Finance Committee, Sen. Max Baucus (D-MT), believe that Congress must not abdicate its authority over the spending of public capital. As one Senate aide remarked, one cannot “depoliticize” the project selection process, as NIB advocates would urge, because major public infrastructure investment decisions are inherently and fundamentally political in nature.

    The High Speed Rail Program
    The White House decision (announced on January 28) allocates the $8 billion in high-speed rail grants authorized in the Recovery Act to a total of 30 separate projects in 13 different rail corridors. Principal beneficiaries are the California High-Speed Rail Authority ($2.25 billion), the Florida Rail Enterprise and its 84-mile Tampa-Orlando high-speed line ($1.25 billion) and the Chicago-St. Louis rail corridor ($1.10 billion). The remainder of the money is spread around in amounts ranging from half a billion to as little as a few million dollars among 26 rail improvement projects in 31 states.

    Generally, high-speed rail advocates have been disappointed by the Administration’s selections because few of the projects offer the promise of true high-speed service — even the Florida project is not expected to attain European-like average high speeds. In contrast, the Administration’s decision to fund upgrades of rail infrastructure in as many as 13 different rail corridors makes good sense both in terms of politics and cost-effectiveness.

    True “high speed” service (as that term is used in Europe and the Far East, i.e. top speeds of 150 mph and higher) would require separating freight and passenger traffic. It would require building entirely new rail infrastructure in dedicated rights-of-way — something that is clearly not within the scope of a $8 billion program. The final price tag for California’s complete high-speed rail system could reach $60 to $80 billion and a recent Government Accountability Office report cites a range of construction costs for high-speed rail between $22 million/mile to $132 million/mile. From that perspective, the $8 billion looks like a drop in the bucket.

    In the meantime, with railroads expected to assume an ever growing share of intercity freight transport, upgrading infrastructure in existing rail corridors has become an urgent necessity. Since nearly all of Amtrak’s passenger trains run on rail lines owned by freight railroads, such improvements will also benefit passenger traffic. In most corridors, track and signaling upgrades on existing shared passenger/freight lines would permit raising speeds from today’s 60-80 mph to (0-100 mph, according to railroad experts.

    To be sure, a strong case can be made that true high-speed rail service will eventually be necessary between major city-pairs separated by less than 300 miles to relieve unacceptable levels of highway and air traffic congestion. But building a national network of dedicated high-speed rail lines from scratch will require decades of a sustained national commitment, spanning many administrations. There is no assurance that future presidents and future Congresses will share President Obama’s and Transportation Secretary LaHood’s enthusiasm for high-speed rail.

    Climate change legislation
    Chances of enacting tough greenhouse gas (GHG) emission reductions during this session of congress are remote. Senator Byron L. Dorgan (D-ND), Chairman of the Senate Energy Appropriations Subcommittee, has made it clear that a cap-and-trade bill, such as the giant House-passed Waxman-Markey bill, is “probably dead on arrival.” The prospects for a Senate compromise bill authored by Sens. John Kerry (D-MA), Joseph Lieberman (I-CT) and Lindsey Graham (R-SC) are also dubious at best.

    There are many factors that have contributed to the fading prospects for climate change legislation including disappointment over the inability of the Copenhagen Summit to reach a binding agreement to reduce carbon emissions. The revelations of ClimateGate, casting doubts on the integrity of some climate scientists’ objectivity as well as more recent disclosures about false claims of melting Himalayan glaciers have undermined the credibility of the UN Intergovernmental Panel on Climate Change (IPCC). Add to this the opposition of 14 Senate Democrats from coal-dependent states who fear that a cap on GHG emissions would raise energy costs and utility rates and growing public skepticism about the “consensus” over global warming and the future for any strong legislation seems murky. Indeed when the President in his the State of the Union address mentioned “the overwhelming scientific evidence” about global warming, it provoked muffled but clearly audible laughter among the assembled lawmakers.

    With the hopes of enacting a comprehensive cap-and-trade bill fading, attention is turning to energy initiatives that could launch the nation on the road to energy self-sufficiency and greener energy sources. Those prospects have brightened considerably since President Obama spoke of “building a new generation of safe, clean nuclear power plants” and “opening new offshore areas for oil and gas development” during his State of the Union address. However, the prospects for a more sweeping energy bill during this session of Congress remain in doubt.

    The Surface Transportation Reauthorization
    Finally, what of the oft-delayed multi-year surface transportation authorization? The responsibility for enacting this measure will very likely fall upon the shoulders of the next Congress. In the meantime, during the remainder of this year, the U.S. Department of Transportation may be expected to continue its series of “listening sessions” on how to reform the program and develop a vision that would merit broad stakeholder and congressional support. The Senate, for its part, is expected to launch its own process of legislative development. Sen. Barbara Boxer, Chairman of the Environment and Public Works Committee, has announced that her committee will begin drafting a multi-year authorization bill in March and will hold hearings later this year.

    Finding the revenue to support an ambitious multi-year bill will remain the overarching challenge facing reauthorization drafters in 2011. That new Congress may well be more tax-averse; the state of the economy and the price of oil will determine whether a hefty increase in the price of gas will be feasible. Until the question of funding is resolved, the transportation community will continue to live in a state of uncertainty, improvisation and a limited ability to plan ahead.

    Ken Orski has worked professionally in the field of transportation for over 30 years and is publisher of Innovation Briefs

    Photo: Center for Neighborhood Technology

  • Atlanta: Ground Zero for the American Dream

    The Atlanta area has much to be proud of, though it might not be obvious from the attitudes exhibited by many of its most prominent citizens. For years, local planners and business leaders have regularly trekked to planning’s Holy City (Portland) in hopes of replicating its principles in Atlanta. They would be better saving their air fares.

    Money Better Spent by Government than People? Most recently, Jay Bookman of the Atlanta Journal Constitution wonders whether taxes are high enough in Georgia and seems envious of the fact that Oregon’s voters approved tax increases in a recession, despite months of having one of the highest unemployment rates in the nation. Perhaps they were naïve enough to believe that the higher taxes would not stand in the way of attracting new business to the state. Or, perhaps the voters believed that, as a neighbor to basket case California, Golden State businesses might still flee to Oregon as an expensive but less congested environment (Note 1).

    Portland Transit: Nothing to Emulate: Bookman is also envious of Portland’s transit system with its light rail and commuter rail. Perhaps he is unaware of the “pecking order” of transit. Atlanta’s MARTA is superior to Portland’s MAX light rail in virtually every respect. MARTA a world class Metro. It is fully grade separated and averages about 70% faster than MAX, which is a revival of abandoned streetcar technology. It is thus not surprising that MARTA carries three times as much passenger demand as MAX, despite a total route length approximately the same as in Portland. Despite MARTA’s superiority to MAX, both the Atlanta and Portland transit systems share the transit curse of excessive costs. Atlantans are paying far less to subsidize their transit system than if they had unwisely, like Portland, extended it and taxed residents throughout the suburbs.

    Portland’s Embarrassing Commuter Rail Line: And, commuter rail does not appear to be a matter of pride in Portland at this point. Portland’s one commuter rail line celebrated its first year anniversary recently. Before the line opened, Tri-Met transit officials estimated that the line would “have 2,400 riders a day as soon as service begins.” The Wilsonville to Beaverton WES commuter rail line, however, never came close to that number. Daily ridership has been under 1,200. But the relative paucity of riders did not interfere with the transit agency’s spin and the media’s general sheepish agreement. At the one year anniversary a Tri-Met spokeswoman commented that “When you think about having 55,000 jobs lost in the region, that translates into fewer transit riders throughout the system and particularly during rush hour.” However, nowhere near the half of riders that failed to show for WES cannot be blamed on Portland’s high unemployment rate. If Portland were to return to unemployment levels of a year ago, WES would likely add no more than 50 daily riders.

    So, recession-ravaged Portland has built a commuter rail line that carries, at best, 0.5% of the capacity of adjacent freeways when it operates. Moreover, it has been costly. The line costs about $60 per passenger, only $2.50 of which is collected in fares. This means that the annual subsidy per passenger is nearly $15,000, almost enough to pay the annual mortgage cost on two median priced Atlanta homes.

    Portland Traffic Congestion Worse than Atlanta: Atlanta is renowned for its traffic congestion, which is a direct result of its failure to invest in the type of arterial grid that could provide substantial relief for its less than robust freeway system. Yet, based upon the latest Inrix National Traffic Scorecard, (GPS collected data for 2009), there is less peak period travel delay (as measured by the Travel Time Index) in Atlanta than in Portland, which is a reversal from data earlier in the decade (see note).

    Atlanta: Adding a New Zealand: Atlanta has no reason to look to Portland as a model, or anywhere else, for that matter. Coming out of World War II, the Portland metropolitan area was larger than the Atlanta metropolitan area (1950). Since that time, Portland has grown strongly, adding 1.5 million people. Atlanta has added more than three times as many people. The result is an economy that produces at least $150 billion more in wealth every year than Portland. Thus, the difference between Atlanta and Portland is more than the gross domestic product of New Zealand. For at least the last two decades, Atlanta has been the fastest growing large metropolitan area in the high-income world.

    Atlanta: Land of Opportunity: But perhaps the biggest draw about Portland for Atlanta leaders is its “growth management” (so-called “smart growth”) land use policies. Portland has drawn an urban growth boundary around its urbanization. Its land regulators commission “sun rises in the West” studies to deny the fact that this rationing of land increases house prices. There is, however, no question of the impact of more restrictive land use policies, from the World Bank to members of central bank boards to decorated economists such as Kat Barker of the Bank of England and Donald Brash, former governor of the Reserve Bank of New Zealand.

    The result is superior housing affordability. Late in the year, the median house price in Atlanta was 2.1 times median household incomes (the Median Multiple). By comparison, the Median Multiple in Portland was 4.2, indicating that house prices are twice as high relatively speaking in Portland. In 1990, before Portland implemented its more stringent smart growth policies, housing affordability in Portland was about equal to Atlanta.

    But there is more to the story. Portland’s heavy handed planning policies are distorting product offerings so much that only the richest can afford more than a miniature back yard. This is illustrated by the images of new housing developments below in the suburbs of Portland and Atlanta (below). Both pictures are taken from approximately 1,500 feet above the ground.

    In the Portland example, virtually on the fringe of the urban area (the next urbanization is at least 10 miles away); houses are stacked in at more than 15 to the acre, with just a few feet between the roof-lines – vaguely reminiscent of third world shantytowns (Note 2). The more traditional suburban development that characterizes most of Portland is also shown on three sides of the overly dense new development.

    In the Atlanta example, houses have been recently built at about 4 to the acre, which has been the American suburban norm (except where land use regulations have required larger lots). The emerging sameness of Portland’s housing gives new meaning to the “ticky tack” criticism of suburbanization.

    Our 6th Annual Demographia International Housing Affordability Survey found Atlanta to be the second most affordable metropolitan area with more than 1,000,000 residents and the 17th most affordable metropolitan area out of 272 markets in six nations. Portland ranked 180th. Atlanta is truly a land of opportunity for young households and lower middle income households that can never hope of owning their own home in Portland’s pricey, growth management driven market.

    Rather than being a shameful example of metropolitan disaster, Atlanta remains one of the diminishing number of American urban areas where the American Dream can still be offered at a price that middle income households can afford. Atlanta has also emerged as one of the world’s best examples of ethnic diversity, not only in the core but also in the suburbs. More than half of the new residents in the suburbs have been non-Anglo since 1990 in Atlanta, about which it can proud. Atlanta is inferior only in the quality of is public relations and self-understanding. It should be a required stop for planners from Portland and beyond, for remedial education on injecting humanity and aspiration back into urbanization.


    Note 1: Bookman also notes in his column that Portland’s traffic congestion has not worsened at the rate I predicted in a 1999 Atlanta Constitution oped. I had not anticipated the huge gasoline price increases, which have materially reduced the rate of traffic growth virtually everywhere and made previous congestion increase rates unreliable as predictors of future growth.

    Note 2: For example, see the similar rooflines in a Dhaka shantytown near Gulshan at 23:47 North and 90:24 East in Google Earth. The principal difference in roof lines is the Dhaka slum’s lack of streets and cars, both of which seem consistent with the anti-mobility stance of “smart growth” planning.

    Wendell Cox is a Visiting Professor, Conservatoire National des Arts et Metiers, Paris. He was born in Los Angeles and was appointed to three terms on the Los Angeles County Transportation Commission by Mayor Tom Bradley. He is the author of “War on the Dream: How Anti-Sprawl Policy Threatens the Quality of Life.

    Photo: hyku

  • Who’s Dependent on Cars? Try Mass Transit

    The Smart Growth movement has long demonstrated a keen understanding of the importance of rhetoric. Terms like livability, transportation choice, and even “smart growth” enable advocates to argue by assertion rather than by evidence. Smart Growth rhetoric thrives in a political culture that rewards the clever catchphrase over drab data analysis, but often fails to identify the risks for cities inherent in their war against “auto-dependency” and promotion of large-scale mass transit to boost the “sustainability” of communities.

    Yet in pursuing this transit-friendly future political leaders rarely confront this inescapable reality: public transportation is fiscally unsustainable and utterly dependent on the very car-drivers transit boosters so often excoriate. For example, a major source of funding for transit comes from taxes paid by motorists, which include principally fuel taxes but also sales taxes, registration fees and transportation grants. The amount of tax diversion varies from place to place, but whether the metro region is small or large the subsidies are significant. In Gainesville, Florida – a college town of 120,000 – the regional transit system received 80 percent of the city’s local option gas tax in 2008. In New York City, the Triborough Bridge and Tunnel Authority diverts 68 percent of its toll revenues to subways and buses.

    In addition to local subsidies, state and federal agencies fund transit operations with revenue from gas taxes and other motorist user fees. In 2007 transit agencies received $10.7 billion from the federal Highway Trust Fund, and that is a conservative figure since another $11.7 billion was diverted for vaguely phrased “non-highway purposes.”

    In contrast, fare box recovery doesn’t come close to covering operating expenses. Nor can transit pay for its own capital outlay. Last year the Metropolitan Washington Airports Authority moved to dedicate toll revenue and toll bonds to cover half the cost of the $5.26 billion Dulles Metrorail project.

    The implications of transit’s auto-dependency are serious. Americans drove 11 billion fewer miles between 2008 and 2009, and for each mile not traveled local, state, and federal taxes were not collected. Without these anticipated revenues, transit systems across the country have suffered and, ironically, those hit hardest are the people who are dependent on public transportation ,that is in most cities, the poor and the young.

    In D.C., transit riders are being warned by Metro officials to expect half-hour waits for buses and trains and more crowded rides as they cut services and lay off positions to close a $40 million budget shortfall. Santa Clara County’s Valley Transit Authority has announced plans to reduce bus service by 8 percent and light rail service by 6.5 percent. In Arizona, both Tempe and Phoenix face major cuts that will lengthen wait times and eliminate routes. Even as demand for transit increases in states like Minnesota, the decline in funding is leading to major readjustments in service.

    The situation is so dire in New York City – with by far the most extensive transit system in the country – that advocates used students as props to protest service cuts caused by a $400 million budget shortfall. Though transit receives funding from other sources, there can be no mistaking the key role played by motorists.

    The decline in driving can be attributed largely to the economic downturn and increased unemployment, but even when the recession ends transit agencies will face an uncertain funding future. New technologies are making automobiles cleaner and more fuel efficient, which will allow people to drive more while paying and polluting less. If auto makers meet new federal standards, cars will soon be achieving 35.5 miles per gallon instead of today’s 27.5 mpg average. Economic growth continues to disperse and there has been a strong uptick in telecommuting.

    But perhaps the biggest threat to the future of auto-dependent transit is the very “cause” that seeks to establish it as the preferred travel mode. The planning doctrine called Smart Growth with its rationale of sustainable development is growing in popularity in urban areas across the country. Local officials are enamored with visions of auto-light cities where the buses are full, sidewalks are crowded and there are more bicycles on the road than cars.

    Beneath the appealing rhetoric of Smart Growth rests the assumption that automobiles are intrinsically bad and that public policy should be directed at restricting their use. Rarely do policymakers weigh the automobile’s many benefits and the improving technologies that are mitigating its negative environmental impact. Even rarer is discussion of whether transit can realistically match the convenience and flexibility of the automobile for both individuals and families.

    Distracted perhaps by pictures of ornate transit hubs and shiny rail cars, many policy makers fail to focus on developing a fiscally sustainable plan for public transportation. They miss the fundamental problem that anything heavily subsidized –particularly in a budget constrained atmosphere – is, by definition, unsustainable. (To the extent roads are subsidized, it breaks down to about a half-penny per passenger mile; transit subsidies are 100 times more than driving subsidies.) Ideally, user fees would cover all expenses of all transportation modes, including driving.

    A responsible policy goal should be for transit users to put their fair share in the fare box. However, given the current tax diversion imbalance, local officials should at least target a near-term goal for fare box recovery of 85 percent of costs instead of its current one-third average. This will reduce both their fatal auto-dependency and the instability that comes when external revenue sources are impacted by external factors like an economic downturn.

    Transit agencies should also right-size their bus fleets. Despite visions of large 55-passenger vehicles filled to capacity with contented commuters, only a small portion of routes in any urban area can fill these big box buses even during certain peak times. A smaller sized fleet would be not only less expensive but also more flexible, allowing cities to adjust routes and increase headways for greater service. It would also have a smaller carbon footprint.

    Finally, responsible policymakers should suspend most of their plans to build rail transit. In addition to routinely running over-budget, rail transit- outside of a few cities such as Washington DC and New York- simply does not carry many passengers relative to automobiles to justify its enormous operating expenses . The Santa Clara Valley Transportation Authority, for example, spent $55.5 million in operating expenses in 2008, recovering just $8.6 million from passenger fares and costing taxpayers an average of $5.88 per trip.

    Rubber tire transit is more efficient compared to rail as a service to those needing public transportation. Santa Clara’s operating expenses per vehicle revenue mile were 25 percent less for bus than for light rail. Additionally, bus transit is far more flexible, easier to expand and less disruptive in the construction phase.

    Essentially, policymakers need to see transit as a service with an important but limited role to play in most urban regions. With jobs and more activities spreading to the suburbs and exurbs – a process often accelerated by economically disruptive urban policies, cities should focus transit on a limited number of central core commuters as well as those people who cannot drive. Unfortunately, such goals are too modest for planners who envision transit as the catalyst for large scale social engineering and who have little concern for their regions’ economic bottom line.

    The dirty little secret remains that public transportation would collapse without the automobile. It will remain unsustainable as long as it remains dependent on that which public policy is trying to discourage. Smart Growth rhetoric makes for great campaign literature but not for smart decision-making. Responsible officials should question the underlying assumptions about automobiles and begin reconsidering the fiscal calculus that underlies transit policy.

    Ed Braddy is the executive director of the American Dream Coalition, a non-profit public policy organization that examines transportation and land-use policies at the local level. The ADC’s annual conference will be held this year on June 10-12 in Orlando, Florida.

    Photo: ahockley

  • Reforming Anti-Urban Bias in Transportation Spending

    State governments have to stop treating transportation like yet another welfare program.

    Among urban and rural areas, who subsidizes whom?

    It’s methodologically difficult to measure net taxation, but the studies that have been done suggest that, contrary to the belief of some, urban areas are big time net tax donors. For example, a recent Indiana Fiscal Policy Institute study found that Indiana’s urban and suburban counties generally subsidize rural ones.

    Just the consolidated city-county of Indianapolis-Marion County sends $420 million more to the state annually than it receives every year. That’s equal to the entire public safety budget of the city. The rest of the metro area sends another $340 million to the state annually.

    Similarly, a 2009 Georgia State University study found that the Atlanta metro area accounted for 61% of state tax collections but only but only 47% of expenditures. A 2004 University of Louisville study found that the state’s three major urban regions – Louisville, Lexington, and Northern Kentucky (south suburban Cincinnati) – generate over half the state’s tax revenues but only receive back about one third in state expenditures, an annual net outflow of $1.4 billion per year.

    The Atlanta and Indianapolis examples are particularly instructive, since both are the capital and by far the largest city of their state. They are sometimes presumed to benefit from disproportionate state spending as a result, but the reality is quite different.

    That’s not to say that this is necessarily bad. The fundamental basis of any government is a commonwealth, a body of citizens who see themselves as fellows, who believe each other’s fates are linked. Thus, generally spreading the burdens on some type of a progressive basis is broadly considered equitable, and assistance to the less fortunate constitutes a core function of government. To the extent that cities generate the most wealth in today’s economy, and have the highest incomes, it is no surprise they pay more in taxes. This doesn’t per se mean there’s an anti-urban bias in policy.

    Indeed, income redistribution is one of the key functions of state government. Actual welfare and safety net programs, including things like health care for the poor, are a major budget item in every state. But it goes beyond that. K-12 education could be treated as a purely local service, but every state spends large amounts on it. One could argue this is strictly to ensure a minimum level of funding equity between rich and poor districts. That is, it’s purely redistributive. Indeed, states sadly spend more time fiddling with funding formulas than in actual education reform and improvement. Even corrections disproportionately and unfortunately affects the poor. We are, in effect, a collection of 50 welfare states.

    The fact that so many of the functions of state government have taken on a redistributive cast also comes with downsides. Most importantly, even functions that should have little to do with welfare or equity have come to be seen through that lens.

    Exhibit A is transportation. Two-thirds of Americans live in large metro areas, yet less than half the federal transportation stimulus funds are going to the top 100 metro areas. Missouri is spending half its stimulus money on 89 small counties that account for only a quarter of the state’s population. In Ohio, the state cancelled plans to spend $100 million in stimulus funds on the crumbling Cleveland Inner Belt bridge in order to divert them to paying for a $150 million bypass around Nelsonville – a town of only 5,000 people. This is part of a plan to construct a four lane divided highway into sparsely populated southeast Ohio as part of a “build it and they will come” economic development plan. Mecklenburg County, NC, the state’s largest and home to Charlotte, received only $7.8 million out of the first $423 million in projects in that state. The Atlantic Monthly described this as a contest between a “mayor’s stimulus” and a “governor’s stimulus” – and the governor won.

    State after state has rural “roads to nowhere.” Without any legitimate economic development strategy on offer for depressed rural areas and small industrial cities, salvation is said to lie in access to four lane highways. The logic is that until every county in America is crisscrossed with these things, somehow residents are deprived of their due. This plays well to rural resentment, allowing people who are by nature proud believers in self-reliance and dismissive of welfare to claim instead that they’ve been cheated out of their “fair share” of transportation money. One suspects at least some deep inside understand the fiscal reality, which accounts for the self-righteous rhetoric designed as much perhaps to convince themselves as others.

    Regardless, a lack of transportation investment is crippling our cities, many of which have congested, crumbling roads and shaky bridges. Earmark reform would help at the federal level. Earmarked projects and “high priority corridors” are too often, as with “strategic” corporate programs, projects for which no traditional justification can be found.

    But beyond this, governance reform at the state level is critical to bring transportation funding allocations in line with real population and economic development measures. That’s not to say that rural areas should get no funding. There are many areas where legitimate state funding is warranted, such as replacing substandard bridges or correcting roads with dangerous geometry. But that doesn’t mean states should spend huge amounts of money on large rural expansion projects of dubious value that rob urban areas of the funds needed for projects with genuine transportation merit and real economic development potential.

    If states won’t act to reform this, then, despite legitimate governance concerns in our system of federalism, the federal government may need to step in to take a more direct role in funding formulas to ensure that a proper share of the money gets sub-allocated to metro areas. The federal government simply can’t allow states to continue diverting critical and limited transport money to boondoggles.

    With metro areas as the economic locus of the 21st century, failing to take action to make sure our cities get the transportation investment they need puts both the state treasury and national economic competitiveness at risk. Cities can only continue to play their role as wealth generators and sources of transfer funds for their states if they themselves are economically healthy, which requires infrastructure investment. As the Indiana, Georgia, and Kentucky examples show, state treasuries and rural funding are dependent on urban economic health. You can’t redistribute money from urban to rural areas if there’s nothing to distribute.

    Aaron M. Renn is an independent writer on urban affairs based in the Midwest. His writings appear at The Urbanophile.

    Photo: Pete Zarria