Category: Urban Issues

  • Origins and Growth of Al Capone’s Outfit: Chicago’s First Ward Democratic Organization and its Aftermath

    Barack Obama ran for President with his headquarters in downtown Chicago. Obama’s election night victory speech was just blocks away in Chicago’s Grant Park. To historians of organized crime both locations are located in a significant place: Chicago’s old First Ward. This valuable plot of land is where Chicago’s Democratic Machine and Al Capone’s criminal organization both began. The connection between the two is of great historical significance. Why? Because the Chicago Mob is nothing but an outgrowth of Chicago’s old First Ward Democratic Organization.

    The First Ward contained not only the big office buildings of downtown Chicago but also the near south side which contained the Levee (which was America’s premier vice district for prostitution and gambling) in the early part of the twentieth century. Crime researcher Ovid Demaris explains the origins of the First Ward in the first decade of the Twentieth Century:

    The chain of command on the levee started at the top with committeeman Michael “Hinky Dink” Kenna and Alderman Bathouse John Coughlin, bosses of the First Ward, the wealthiest plot of real estate (it contains the Loop) in the Midwest. Their bagman was Ike Bloom, a ward heeler and proprietor of a busy dance hall. The next in command was Big Jim Colosimo, an Italian pimp and restaurateur, who started out as a street cleaner. When he married a madam with a pair of dollar houses, Hinky Dink made him a precinct captain in charge of getting out the Italian vote.

    By 1912, Jim Colosimo owned 200 brothels, many located in the First Ward. Colosimo is considered by the FBI to be the first head of the Chicago Mob. His base – organizing street sweepers – presaged the powerful role of public unions in Chicago nearly a century later.

    Another important First Ward Democratic precinct captain with connections to Kenna and Coughlin was Harry Guzik. Guzik, like Colosimo, was a pimp who passed his political connections on to his son, Jake. Jake Guzik, also a pimp, became the Chicago Mob’s accountant until his death in 1956. Guzik (note 1) was considered the number two man in the Chicago Mob and the financial brains behind the operation until his death in 1956.

    In 1909, Colosimo reached out for help in running his expanding empire. New York street gang leader John Torrio came to Chicago to help manage Colosimo’s empire from Colosimo’s Cafe at 2126 South Wabash Avenue at the south end of the First Ward.

    In 1919, on the eve of Prohibition, Torrio wanted the operation to expand into bootlegging. Colosimo was content with the money he was making from the existing rackets. So, Torrio had Colosimo executed. Before Colosimo was executed, Torrio had brought to Chicago a street thug he mentored in New York: Al Capone. With Colosimo, out of the way, Torrio moved the operation headquarters a few blocks away to the 2222 S. Wabash. Capone acted as the underboss of the operation.

    Torrio and Capone no longer needed to take orders from Kenna and Coughlin of the First Ward. Over time, as the Chicago Mob became wealthy, they began to tell Kenna and Coughlin how to operate. Jake Guzik became the de facto political boss of the First Ward issuing orders to Kenna and Coughlin.

    By 1925, Torrio stepped down as boss after an assassination attempt and left Chicago. Al Capone took over. The mob extended its political influence into other Chicago wards, to the surrounding suburbs of Chicago and even downstate.

    Capone’s reign only lasted until 1932, but his legacy and organization were just beginning. Robert Cooley and Hillel Levin in their monumental book When Corruption Was King explain:

    Oddly enough, far less is known about his successors and their grip on the city during the last half of the twentieth century. But that is when Chicago’s Mafia became the single most powerful organized crime family in American history. While Mob bosses knocked each other off on the East Coast, in Chicago they united into a monolithic force called the Outfit…By the Seventies, the FBI reported that Chicago’s Mob controlled all organized criminal activity west of the Mississippi – including and especially Las Vegas. Millions were skimmed from casinos like the Tropicana and the Stardust, and bundles of cash, stuffed in green army duffel bags, found their way back to the Outfit’s bosses.

    By the 1950s, the Chicago Mob realized it would be more efficient to send one of their own “made members” to City Council (Note 2). John D’Arco was a high ranking made member elected to City Council in 1951. D’Arco also became the First Ward Democratic Committeman, the boss of the precinct captains. He got caught by the FBI meeting with Sam Gianciana near Chicago’s O’Hare Airport, in 1962, and stepped down from City Council but kept his ward committeemanship until the 1990s. He was a regular visitor to Mayor Jane Byrne’s office in the late 1970s and early 1980s.

    In 1968, the Chicago Mob sent Fred Roti, one of their most effective high ranking made members, to the City Council. Roti grew up in the First Ward just blocks away from Capone headquarters. He was a precinct captain for John D’ Arco. Roti’s success on City Council surpassed John D’Arco. By 1982, the Chicago Tribune reported that Roti was Chicago’s most powerful City Council member:

    Roti’s name is always called first during council roll calls, and he revels in that privilege. His initial response gives other administration aldermen their cue as to what Roti – and, therefore, the mayor – wants. It’s often said that roll calls could stop after Roti votes – the outcome is already known. Roti, an affable fellow, controls the Chicago City Council with an iron fist.

    According to the Justice Department, Roti was an important co-conspirator in turning a large segment of Chicago’s organized labor movement into a racketeering enterprise.

    In the 1980s, criminal defense lawyer Robert Cooley wore a wire on Alderman Roti and his boss Pat Marcy. Cooley became the star witness in a series of sensational trials from an investigation titled Operation Gambat. Roti was indicted in 1990 and “was convicted of RICO conspiracy, bribery and extortion regarding the fixing of criminal cases in the Circuit Court of Cook County, including murder cases involving organized crime members or associates, and was sentenced to 48 months’ imprisonment.” John D’Arco’s son was also indicted and convicted of taking bribes. John D’Arco Jr. was the Chicago Mob’s man in Springfield, rising to the position of Assistant Majority Leader of the Illinois Senate.

    The Chicago Mob was never the same. Without Roti and Marcy, the judges could no longer be bribed into allowing the mob hitmen back on the street. The regular killings, to get people in line, stopped. The First Ward got mapped out of existence in the early 1990s. Senior FBI agent William Roemer explained the devastation to the Chicago Mob by Robert Cooley’s “Operation Gambat”:

    As a result of Gambat, Tony Accardo’s people were deeply wounded. For decades Pat Marcy and John D’Arco, Sr., has been to Accardo what Hinky Dink and Bathhouse John were to Colosimo, Capone, and Nitti. Since 1950 – some forty years – John D’ Arco had been there. They were themselves a great one-two punch for Accardo and for Greasy Thumb…

    So, the Chicago Mob has been in retreat. But, it still exists and has great access to power.

    In 1999, at Fred Roti’s funeral, his best friend on City Council Alderman Bernard Stone spoke. Alderman Stone, set the record straight in case there was any illusion of how important Fred Roti was in the history of Chicago:

    “Our skyline should say ‘Roti’ on it,” Stone said at the funeral. “If not for Fred Roti, half the buildings in the Loop would never have been built.”

    At the time of his indictment in 1990, Roti was Chairman of the City Council Buildings Committee. This is the key committee in Chicago that determines the height of buildings.

    After Fred Roti’s funeral, his body was laid to rest at the Mount Carmel Cemetery in the Chicago suburb of Hillside. Roti was buried in Section 34 of the Cemetery. Just a short walk from Roti’s casket in Section 35 of the Cemetery is Al Capone’s grave.

    The man who brought down the First Ward, FBI informant Robert Cooley, is back in the news. Days after Governor Rod Blagojevich was arrested, WLS TV reported that according to Cooley, Blagojevich was bookmaker for the Chicago Mob. WLS TV did a follow up report in which a former senior FBI agent confirmed that Cooley made bookmaking allegations about Blagovich in the 1980s. This isn’t the only mob tie concerning Blagojevich. His wife is related to the recently deceased Chicago Mob Consiglerie Alphonse Tornabene.

    Lurking in the background of the Blagojevich criminal case is a casino license that was to be auctioned off. The license was by far the most valuable asset Blagojevich had control over. Blagojevich wanted the casino built in the Chicago Mob dominated suburb of Rosemont. The Chicago Mob also wanted the casino built there. In November of 2005, Blagojevich brought in Eric Holder to give Rosemont a clean bill of health. Holder and Blagojevich had a news conference outside the Thompson Building, which is in the old First Ward.

    The mob connection extends beyond the Blagojevich case. In their drive to retain President Obama’s U.S. Senate seat, the frontrunner is Obama’s friend, Alexi Giannoulis. He is so tainted by Chicago Mob allegations that Illinois Democratic Party Chairman Mike Madigan refused to endorse him in a past race for State Treasurer.

    As the Senate race heats up, these connections between the Chicago machine and the mob could prove embarrassing at least for the man the machine has helped elevate to the White House.


    Note 1: Jake “Greasy Thumb” Guzik earned his nickname from counting stacks of money and bribing public officials.

    Note 2: In preparation for this article, a former FBI agent identified John D’ Arco Sr. as a high ranking made member of the Chicago Mob. His status was at the level of a capo in which he was allowed to run a political crew.

    Steve Bartin is a resident of Cook County and native who blogs regularly about urban affairs at http://nalert.blogspot.com. He works in Internet sales.

  • Confronting Street Art

    By Richard Reep

    Street art has been around since ancient times, with the triple theme of craft, sabotage, and branding. Paris’ “Blec le rat” and New York’s Taki 183 were early pioneers in street art. Today, street art has spread into nearly every city with artists, media, and collectors. Skateboards, tattoos, stickers, and spray paint are but a few examples of the craft of the street. The adrenalin rush an artist feels in executing his work is augmented by the urban thrill of working at night, rushing to leave behind a signature before the police come. The chief aim of most street art is branding, as the artist’s main form of expression is to create a recognizable personal logotype.

    On the street, the city’s public space in general has slowly been eviscerated by our culture of consumption, for it provides an antiquated, nearly obsolete physical format for civic discourse. Long ago proclaimed dead by noted architect Daniel Liebeskind, physical public space has precipitously declined in value to most of the citizens of the city. In its place has risen virtual public space – first television, which was a one-way path, and then the internet, which provides a two-way path.

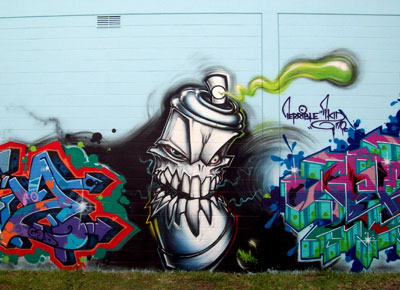
    Yet physical public space continues to serve as medium of the new Street Art form. Stickers, tags, skateboards, and tattoos are all viewed on the street, offering a means to carry this new art form into the next century. The so-called “cutting edge” artists have retreated into their private studios to conceive their next moves in video or computers, but the street artists have taken over the city.

    The elite artists may inhabit the galleries but street artists proclaim their brand of art as supreme. Globalism is achieved by hard work: Artists like Barry McGee or Banksy are no longer confined to one city; Space Invader, having successfully placed his own particular brand across the face of Paris, now has spread to London and New York, making his own global art tour as a form of civic art.

    Viewing a piece of graffiti at once causes a reaction of fear and a perception of danger. Can anyone claim the same immediate, visceral reaction to anything seen in a gallery or museum? This art form reaches people at such a gut level that it trumps most of the work of other artists being exhibited and discussed in the art world. Street artists use this to their own advantage, and their craft reinforces what McLuhan described so well in his epigram “the medium is the message.” The content of the piece is almost irrelevant; the viewer’s reaction is the same regardless of the tag’s content or author.

    Street art is tied into a larger urban culture, and expresses the visual aspect of this larger milieu. As Western mainstream culture retreats from the street into the air-conditioned, connected bubbles of the suburbs, street art and its culture expands to fill the empty space. The zone emptied by the suburbanites does indeed reek of death, more so today, as public investment in the city dwindles or becomes remarkably predictable or prosaic. Budget cuts in schools, government facilities, and even basic street maintenance presage an ever higher level of decay and disrepair, of neglect and abandonment of our shared space, and those who inhabit this space are simply documenting what they see and returning it back to us. We cannot escape the messages of street art, for they are everywhere, embedded into the context. Some are more overt, and some are covert – only noticed, for example, when waiting for a red light – but they are there, reminding us that there is life amidst the emptiness.

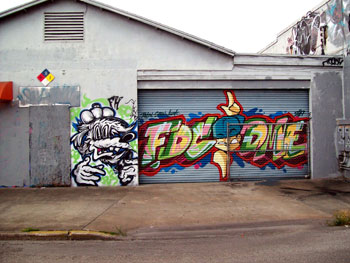
    Graffiti’s barrage of skulls, vacant-eyed cartoon children, and other signs of death and destruction are easy to ignore, but they are telling us something important about the urban environment. The sooner we stop and examine this evidence, the sooner we can begin a process to find common ground, and to seek out a shared vision that does not divide the urban world into an us-and-them mentality. Street art simply puts visual form to the voices we have so long shut out of the urban conversation.

    In Orlando, the trend of giving street artists “permission walls,” or walls where they have permission to paint their work, has tamed and channeled some of the sabotage. By allowing graffiti artists to work with permission, they are free to develop their craft without fear of getting caught before completion, and the artwork becomes a colorful, mural-sized effort to which the artists can point with pride. These permission walls encourage friendly competition between teams, or crews, and there is a sense of pride among them for having created something with great exposure.

    Two permission walls exist to the east of downtown Orlando, but it is the cluster of warehouses at 630 E. Central that showcase graffiti artwork at its best. Artist Robin Van Arsdol owns part of this cluster and has been sponsoring an international graffiti conference for several years, bringing in artists from Europe, the Caribbean, and North America for a weekend of painting at his studios. Driving by his property offers a study in converting urban form into art, and perhaps suggests the visual future of more than one city.

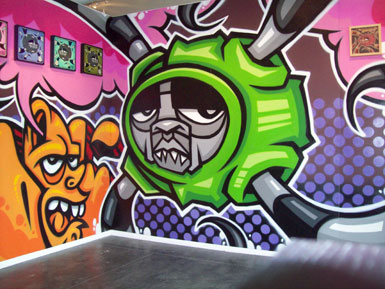
    The graffiti artists have offered a philosophical change-up that should not be overlooked. The conversation about postmodern art seemed to have reached a dead end some time ago; artists
    first threw out figure, then form, then color, then the frame, and then wandered into their process itself as an art form. Graffiti artists begin with the end: their signature, or tag, becomes the art,
    and by using this as the starting point, and the city as their canvas, they unconsciously offer a new beginning to think about the relationship between art and the city.

    We must accept the challenge that graffiti artists offer us. We need to confront this takeover of the physical urban form and push back. Street art constitutes a fresh, interesting language. It is the language of a city that is weak and divided. We must hear what graffiti says to us as a society, and retake our physical urban character as a common, broad place that offers secure, sacred, and special places for all citizens. By ignoring graffiti art, we postpone our treatment of the urban malaise. By confronting it and bringing it into the mainstream, we can better treat our urban condition and improve the city as a dwelling place for the benefit of all.

    Richard Reep is an Architect and artist living in Winter Park, Florida. His practice has centered around hospitality-driven mixed use, and has contributed in various capacities to urban mixed-use projects, both nationally and internationally, for the last 25 years.

  • New York City Closes Shop

    Mayor Michael Bloomberg owes 200,000 small business owners an apology.

    When Michael Bloomberg was first elected Mayor of New York City in 2001, the city’s small business owners were hopeful and confident that finally a successful businessman would be creating the city’s economic policy. They hoped to see an end to powerful special interests that, through political donations, had gained control over the economic policy of the city.

    New York’s small business community had been in a state of crisis ever since former Mayor Ed Koch gave the keys to the city and opened all the city’s government doors to real estate speculators and developers. His economic policy of favoring only a handful of developers and real estate speculators resulted in tens of thousands of long established small businesses being forced to close. New York City had the worst anti-small business environment in the nation, and the July, 1986 Inc. magazine headline said it all, “New York, New York the Worst Place in America to Start a Business.” This anti small business environment continued under two more Mayors, David Dinkins and Rudy Giuliani. It would be up to Bloomberg to change course and save the city’s small businesses from the “death grip” that landlords had on them.

    The small business community anticipated that Bloomberg’s first change would be to appoint a small business owner as Commissioner of Small Businesses. The best choice would be a Hispanic business person with no ties to the real estate industry. This would be a major change in policy because previous policy makers were closely tied to the real estate industry, and none had ever owned a small business. A Hispanic Commissioner would be justified because Hispanics owned between 42 and 45% of all the city’s small businesses.

    To the disappointment of the city’s desperate small business owners, Bloomberg appointed Robert Walsh Commissioner of Small Businesses. Walsh had never owned or operated a small business. He was in North Carolina at the time of his selection, managing the Charlotte Center City Partners, a property owners/banks organization promoting a business district in that city. His background included working for the property owners as director of a Business Improvement District, the Union Square Partnership, in New York City. Walsh’s selection would create the worst anti-small business environment of any city in the nation.

    A reliable way to evaluate the stability of New York City’s small business community is to examine the number of Commercial Warrants for Eviction. The majority of these warrants are issued to “holdover commercial tenants” whose leases have expired, and who can’t afford to pay the new, higher rent. The consensus of business organizations is that these warrants represent about one third of small businesses; the ones that stay and fight in court. The other two-thirds walk away without a fight. During what many consider the reign of terror for small businesses — 1986-1989, the last 4 years of Koch’s term — 17,433 warrants were issued to evict small businesses, out of approximately 53,000 total small business failures. During the last full four years under Bloomberg, 2005-2008, 27,809 warrants were issued to evict, with about 83,000 small businesses forced to close. Since the successful businessman Bloomberg took office, around 152,964 small businesses have been forced to go out of business.

    The circus is not the greatest show on earth; Walsh’s Small Business Services department is. For the past seven years, on paper, the department has had numerous programs to assist small businesses. If you did not see for yourself the long established neighborhood small businesses that have been forced to close every month, and the empty stores on every block in every neighborhood, you might believe that the SBS was actually helpful. The testimony by Walsh and Bloomberg on the state of the city’s small businesses before the city council is a long list of SBS programs and their successes.

    Two things happened to highlight the true state of NYC’s small businesses. The first was the decline of tax dollars generated by Wall Street. This caused a shift in the focus to NYC’s 200,000 small businesses, which were now called upon to carry more of the tax burden and job creation.

    The second was a survey of Hispanic small businesses (see PDF, below). A new Hispanic chamber, the USA Latin Chamber of Commerce, was recently formed in New York City and conducted a citywide survey of 938 Hispanic business owners in early 2009. Over half of the businesspeople believed they were at risk to close due to high rents. Seventy percent had been forced to lay off workers due to high rents. When they first opened their businesses in NYC, 91% believed it was the best city in the nation to invest in the American Dream. Today, 84% believe New York City is no longer a good place for immigrants to open their businesses. The main reason given, again, high rents and unreasonable lease terms. Of those surveyed, 82% would not recommend to a friend or family to open a business in the city.

    One of the survey’s biggest surprises concerned demands by landlords or agents for “cash money” under the table to negotiate a new lease; 31% answered yes, and business organizations have come forward to predict that the real figure is between 45-55% of mostly immigrant small businesses. The results confirmed another survey (see PDF, below), this one by the USA Bodegas Assoc., that the city’s small businesses were in a “Crisis” and in peril of disappearing completely without government protection.

    Bloomberg did not follow the leadership of President Obama, who called for quick actions to save small businesses. Walsh expanded his “dog and pony show” with a citywide PR campaign which claimed that the city’s small business problems resulted from the recent decline in the economy, and by offering a series of government programs: business conferences, business forums, loan programs, initiatives, all intended to stimulate start-ups and expansions. But at a recent city council hearing, Councilman Robert Jackson asked “Does the SBS have a single program to save or keep a single small business from going out of business in New York City?” Walsh reluctantly had to answer “no”.

    In March, 2009 a coalition of 67 citywide business/union/tenant organizations was formed; The Coalition to Save Hispanic Small Businesses released a final report recommending that the best solutions could be found in Jackson’s Small Business Survival Act. The bill is based upon a simple system of regulating the commercial lease renewal process. It would give tenants the right to renewal, and encourage bargaining in good faith between the landlord and tenant.

    A city council hearing was finally held this past June before the city council’s small business committee. The three SBS representatives took the side of the property owners against the city’s small businesses. They testified that Bloomberg would not support the bill because it would be too costly to administer at a time when funds were scarce. When asked how costly, they admitted they did not do any actual accounting, but thought it would be costly. An attorney for the Small Business Coalition explained that there was no costs associated with administering the bill since it would be a contractual process where costs would be shared equally between the tenant and the landlord.

    SBS also objected that there was no need for the bill since the rental market was weakened by the recession, and landlords were negotiating with tenants to keep them. Supporters explained that the timing was ideal because it would have no impact on those landlords negotiating in good faith.

    During the recent impasse, the SBS spokespeople made clear that they did not wish to seek a compromise or alternative solution. And the apology that Mayor Bloomberg owes to New York City’s hard working small business people is also nowhere to be found on the table.

    Stephen Null was the owner of three small businesses in New York City during the 1970s and ’80s. In 1984 he founded the Coalition for Fair Business Rents, and in 1991 he co-founded the New York Small Business Congress. He is currently Director of the Lead Free Children Foundation.

  • Reducing Vehicle Miles Traveled Produces Meager Greenhouse Gas Emission Reduction Returns

    Senators Jay Rockefeller (D-West Virginia) and Frank Lautenberg (D-New Jersey) have introduced legislation that would require annual per capita reductions in driving each year. Another bill, the National Transportation Objectives Act, introduced by Representative Rush Holt (D-Indiana), Representative Russ Carnahan (D-Missouri) and Representative Jay Inslee (D-Washington.) would require a 16 percent reduction in driving in 20 years.

    Last week, a highly publicized report by the Urban Land Institute (Moving Cooler) also called for policies that would reduce the vehicle miles traveled (VMT) by people in their cars. This report was analyzed here by Alan Pisarski). The reductions in driving would be achieved by highly intrusive land use policies that would make it impossible for most Americans to live where they want, allow for only minor expansion of roadway capacity and force almost all new development to be within existing urban footprints. It would employ such radical strategies as forcing people to pay $400 per year to park their cars in front of their own homes.

    The assumption behind these initiatives is that reducing driving will produce substantial reductions in greenhouse gas emissions. It sounds like a simple enough proposition, since cars emit greenhouse gases in direct proportion to the gasoline they consume. It would seem logical that reducing their use would lower their emissions by a similar percentage. Moving Cooler assumes that for every 10 percent reduction in driving miles, there will be a 9 percent reduction in greenhouse gas emissions.

    Meager GHG Emission Reductions from Reducing Driving: But things are not nearly so simple. It appears that reducing vehicle miles would not produce a similar reduction in greenhouse gases from cars.

    It is well known that at the slower speeds of vehicle operation in cities, fuel economy tends to decline with speed. Further, as congestion increases, so does fuel consumption, due to longer idling periods (such as at signals or in stopped traffic), more acceleration and more deceleration. Thus, not only does fuel economy drop when average speeds drop, but it drops even further when traffic congestion intensifies. The extent to which any reduction in urban driving would reduce greenhouse gas emissions is not at all well known, simply because there has been insufficient research on the subject.

    Perhaps the best indication is a comparison of Environmental Protection Agency (EPA) “driving cycles,” which are tests used to estimate some emissions (although not greenhouse gases) and fuel economy. There is considerable data for the normal urban cycle, which replicates driving conditions in most of the nation’s urban areas. There is much less information available for the “New York City Cycle,” which replicates the congested traffic conditions in New York City, which is far more congested than any of the nation’s urban areas (Note).

    Under the New York City Cycle average speeds are two-thirds less than under the average urban cycle. This reduction in speed and increase in congestion results in a 50 percent loss in fuel economy, according to an Argonne National Laboratory Study. Thus, between New York City and the average urban area, fuel efficiency drops at a rate 80 percent of the lower driving rate in New York City.

    On average, vehicle travel in New York City is approximately 8 miles per capita daily. In the average large urban area outside New York City (such as the Phoenix urban area, or for that matter the suburbs of New York City), vehicle travel is approximately 24 miles per day per capita. Thus, per capita driving in New York City is 67 percent less than in Phoenix. However, because of the loss in fuel consumption, the greenhouse gas emissions from cars per capita is only 31 percent less (Figure 1). Thus, the limited data indicates that nearly one-half of the greenhouse gas emissions difference between New York City driving rates and Phoenix driving rates are cancelled out by the impacts of slower speeds and increased congestion.

    Shortcomings of Policies to Reduce Driving: UCLA’s Lewis Center for Regional Policy Studies Program on Local Government Climate Action Policies raised concerns about relying on VMT reduction policies in a submittal to the California Air Resources Board:

    Especially in congested areas of California, VMT is an inadequate proxy for vehicle greenhouse gas emissions.

    Yet it is precisely more intense traffic congestion that we can expect if federal laws and policies should force most development into present urban footprints. Between 2010 and 2030, nearly 70,000,000 residents will be added to US urban areas, an increase of more than 25 percent. This increase would mean that the legislation introduced by Congressmen Hold, Carnahan and Inslee would require a one-third reduction in per capita driving to achieve its overall 16 percent reduction. Per capita driving declines such as those envisioned by the Congressmen or Moving Cooler have never occurred before in any American (or international) urban area. By comparison, charging people $400 to park their cars in front of their houses seems utterly reasonable.

    Further, higher population densities are associated with more intense traffic, both at the national and international level. Policies such as recommended by Moving Cooler would produce little additional highway capacity to handle the far higher levels of driving produced by a larger population. We could expect traffic congestion to increase markedly. It would take longer to get to work and local air pollution would be more intense (a health impact largely ignored by proponents of higher densities).

    The Economic Cost: A serious economic toll would be produced by more grid-locked urban areas, because of the positive relationship between personal mobility and economic performance. Remy Prud’homme and Chang-Woon Lee of the University of Paris have shown that greater economic mobility is associated with greater economic growth. Greater personal mobility also alleviates poverty, according to a Progressive Policy Institute study):

    In most cases, the shortest distance between a poor person and a job is along a line driven in a car. Prosperity in America has always been strongly related to mobility and poor people work hard for access to opportunities. For both the rural and inner-city poor, access means being able to reach the prosperous suburbs of our booming metropolitan economies, and mobility means having the private automobile necessary for the trip. The most important response to the policy challenge of job access for those leaving welfare is the continued and expanded use of cars by low-income workers.

    The UCLA submission further notes that policies aimed at reducing driving could damage the economy:

    … policies which seek to reduce VMT may hinder economic growth without reducing emissions.

    The relationship between greater mobility and economic prosperity is also demonstrated at the national level. This is vividly illustrated in the chart from the United States Department of Energy (Figure 2).

    The significant improvements in fuel economy from higher mileage cars and less carbon intensive fuels will do far more to reduce greenhouse gas emissions from cars than the meager results that can be achieved by heavy handed policies to “coerce” people out of their cars (as Secretary of Transportation Ray LaHood put it). And, critically, it would do so with far less impact on both economic and physical mobility.

    Both the Economy and Greenhouse Gas Emissions at Stake: With the economic challenges facing the nation, policy makers need to steer clear of strategies that hobble the economy, like forcing people to drive less (or pay $400 to park in front of their houses) and make only minor improvements in reducing emissions. Indeed, a society with less money will have less to spend on reducing emissions through the adoption of new technologies that offer greater hope for creating a more prosperous as well as more environmentally sustainable society.


    Note: The New York City refers to the City of New York, not the metropolitan area or the urban area.


    Wendell Cox is a Visiting Professor, Conservatoire National des Arts et Metiers, Paris. He was born in Los Angeles and was appointed to three terms on the Los Angeles County Transportation Commission by Mayor Tom Bradley. He is the author of “War on the Dream: How Anti-Sprawl Policy Threatens the Quality of Life.

  • Downtown Central-Cities as Hubs of Civic Connection

    There’s been a torrent of spirited banter lately about the reemergence of downtown central-cities. Much of this raucous debate is between advocates of urban revitalization, who offer an assortment of anti-sprawl messages as justification for this movement, and those who see suburban growth options as essential to quality of life in America. Adding to the fray are environmentalists who see housing density and alternative forms of transportation as the panacea for confronting our carbon-choked world. Downtown central-cities, they say, will incentivize citizens to relinquish their cars in favor of bikes and walking paths.

    These discussions largely ignore a greater significance to the reemergence of central-cities; namely, the recognition of downtowns as the epicenter of civic and cultural activity. This represents a shift away from the traditional concept – barely a century old and now antiquated – of downtown as predominately an economic and job center hub.

    This primary role for downtowns has been declining since the 1950s. According to Robert Fogelson, professor of urban studies and history at MIT and author of Downtown: Its Rise and Fall, 1880-1950, after World War II, downtowns lost their prominence as places where people “work, shop, do business, and amuse themselves.” As he states in the book, “Downtowns were once thought to be as vital to the well-being of a city as a strong heart was to the well-being of a person.”

    Increasingly the word “downtown” has become associated exclusively with large urban centers, fostering images of traffic, crime, homelessness and other forms of unsavoriness. A closer look, however, reveals a wide range of downtown genres – small and large, central-city and suburban, safe and sketchy, chaotic and peaceful, established and emergent. Some downtowns are situated in major urban regions while others are nestled in small-town communities. The senior demographic is prominent in some, college crowd in others.

    This new assessment of downtown as primarily a center for civic opportunities makes sense and revives the ancient role of the plaza “forum” or “agora” concept–places that H.G. Wells affectionately referred to as ideal for “concourse and rendezvous.” This redefinition may bother some who wish to return to the downtown apex of the 1950s, yet the idea is both viable and sustainable.

    With the traditional town-center model serving as the hub of civic activities, residents and visitors alike are frequenting dining establishments, arts and music venues, and coffeehouses in the spirit of civic connection and community. No longer a phenomenon exclusively associated with young artists, bohemians, and intellectuals, the downtown experience is also drawing unprecedented numbers of older folks who appreciate the history, cultural significance, ambiance and architecture of the old core.

    Downtown planning efforts in many locales are responding to this surge of interest by creating a brand identity for their cities – Austin, Texas, has developed a vibrant music scene, with a number of entertainment venues tucked along its 6th street corridor; Indianapolis promotes itself as a spectator-sports mecca, with its downtown activity infused by a robust fan base frequenting college basketball tournaments, pro and minor league baseball games, and the nation’s largest sporting event: the Indianapolis 500; Chicago touts itself as a tourist destination replete with world-class museums, city and architectural tours, and fine dining in its vast downtown core. Smaller downtowns in cities like Davis, California, Evanston, Illinois, and Iowa City, Iowa, tap into a bustling college crowd from area universities.

    Traverse City, Michigan, with a population of over 15,000 (142,075 in the surrounding metro area) offers another model: the quintessential small-city downtown. Quaintly situated along the Grand Traverse Bay on Lake Michigan, the area is primarily known for boating, kayaking, and sailing, except in July, when the city hosts its annual, week-long Cherry Festival that attracts swarms of people to its historic downtown area.

    According to Rob Bacigalupi, Acting Executive Director of the Traverse City Downtown Development Association, downtown traffic is driven by the office population and events. “Downtown Traverse City has somewhere in the neighborhood of 3,500 office workers. Certainly that’s a small number by any measure, but for a town of 15,000, these workers provide a good base for retailers who otherwise have to rely exclusively on seasonal visitor traffic,” he says.

    In terms of a niche identity for downtown Traverse City, tourism seems to be front and center. The calendar is jammed with events, many of which are designed specifically to attract locals downtown. Other cultural activities, such as the Cherry Festival, Traverse City Film Festival and Horses by the Bay, draw visitors by the tens of thousands. Bacigalupi cites a recent convention and visitor’s bureau survey indicating downtown shopping as one of the main regional attractions. “There’s no doubt,” he says, “that regional tourist traffic is perhaps the largest driver of foot traffic downtown. This says a lot for a region that has a number of other attractions and activities to offer.”

    For many city leaders the potential impact of downtown on regional economics and culture is what’s creating the most buzz. Kansas City (Missouri), Roanoke (Virginia), and Asheville (North Carolina) are among a growing number of cities seeking to capitalize on their unique brand of cultural connection to generate badly needed tax revenues for their downtown areas. Some experts say this is a sound move amid tepid economic times as city and local governments look to draw customers from closer to home.

    This message rings true for economically ravaged Rust Belt cities like Cleveland, Ohio. For years, downtown Cleveland has struggled to survive – beginning in 1960 when manufacturing and heavy industries began their decline and the flight to the suburbs gained momentum. In 1978, Cleveland had the dubious distinction of becoming the first American city to enter into default since the Great Depression. Despite small glimmers of promise, downtown Cleveland has been stuck in neutral, unable to build a cohesive identity and direction.

    There are some successes though: Redevelopment efforts have transformed a downtown corridor along E. Fourth Street into a bustling fine dining and nightlife mecca, demonstrating the appeal that well-constituted areas have on the local populaces and tourists. And the area’s rich ethnic and cultural heritage shows promise as a catalyst for change in the central core. While all of this points to some progress for downtown Cleveland, it still must overcome a heavy stigma associated with crime, poverty, and a declining population base to truly achieve civic vibrancy.

    Many of our nation’s suburban communities are setting the pace for downtown civic connection. Naperville, a Chicago suburb and the fifth largest city in Illinois, has established itself as a model for suburban downtowns. This city of 142,000 residents features a cornucopia of sophisticated shops, restaurants and entertainment venues that attract foot traffic to the town center-oriented central district. Open space has been integrated into the cityscape through well-maintained walking paths along the DuPage River, which flows through downtown. Thoughtful planning for the provision of abundant, free parking, train accessibility, and bike lockups enables convenient accessibility to the area both day and night.

    Folsom, California, is indicative of a suburban community that fosters civic ties and activities through its historic downtown district. With a population of 70,000 this city located in the eastern portion of rapidly growing Sacramento County draws an eclectic crowd to its old town boardwalk setting replete with saloons, outdoor restaurants, and antique stores. The downtown core also serves as a gathering post for legions of bicyclists who have helped shape Folsom into one of the top bicycling communities in the nation.

    During summer, downtown Folsom hums with activity generated by two weekly events: Thursday Night Market, featuring live music, food and shopping, and the Sunday Farmers Market, where frequenters can purchase fresh, locally grown food from area farmers. Plans are afoot for a street-scape improvement and a storefront restoration – projects that are designed to preserve historic elements while enhancing the city’s tourism desirability. Also in the works are mixed-use housing units and a restaurant that incorporates a railroad roundabout. All of this comes on the heels of a new parking structure and ice-skating rink, which debuted last year.

    In the end, downtown central-cities seem poised to reclaim some of their prominence as magnets of culture and social connection. We may not be witnessing the rebirth of the great economic centers of the 1950s, but a revival of our central space represents a positive development for communities both large and small.

    Michael Scott is a researcher and writer focusing on the growth and sustainability of downtown central-cities. He can be reached at michael@vdowntownamerica.com.

  • Rating World Metropolitan Areas: When Money is an Object

    American metropolitan areas have been the subject of considerable derision. Often characterized as inferior to those of Australia, Canada, Europe and even of Japan by planners and politicians who travel abroad, there has long been a desire to reshape American cities along the lines of foreign models. Yet, despite this, American metropolitan areas generally provide a standard of living to their residents unmatched anywhere in the world. This is based upon the latest comparative economic data for the world’s most affluent metropolitan areas.

    International Rankings: American metropolitan areas never seem to place near the top of “quality of living” or “livability” indexes, such as those published by The Economist and the Mercer consulting group. On the other hand European, Australian and Canadian metropolitan areas usually grab the honors, frequently led by the likes of Vancouver, Melbourne, Zurich or Vienna.

    The media routinely reports these rankings without serious analytical analysis, which can lead to misunderstanding or even misrepresentation in comparing metropolitan areas on issues of living standards (Note 1). As Owen McShane pointed out on this site before, these ratings serve their purpose, which is to rank metropolitan areas based upon their “attractiveness to expatriate executives”. Not only do these lists fail to consider housing affordability, as McShane indicates, they also do not consider the overall economic performance of metropolitan areas in regard to their residents, which is not an insignificant matter. These highly publicized international listings might be thought of as “money is no object” ratings.

    When Money is an Object: The problem here: money is an object for the great majority of people living in the world’s metropolitan areas. This is true in Kinshasa, Seattle, Vancouver or Vienna.

    When the available measures of affluence or the standard of living are considered, the picture for US cities drastically improves. Here the US metropolitan areas dominate the list. The best available data is gross domestic product (GDP) per capita, adjusted for national level purchasing power (Note 2). Metropolitan area GDP data is now produced by the Bureau of the Census in the United States and regional data generally conforming to most metropolitan areas is available for the European Union by Eurostat (Note 3). Data for other metropolitan areas can be estimated from other national and regional sources.

    In 2005 (the latest available data), The Economist top ten averaged 57th in GDP per capita in the world. Mercer’s top ten did even worse, averaging 62nd. None of The Economist or Mercer top 10 ranked was among the 25 metropolitan areas with the highest GDP per capita. Vienna ranked best, at 27th. Perennial favorites Vancouver and Melbourne ranked 71st and 72nd (Table 1). Zurich, another rating champion, ranks 74th, just ahead of Oklahoma City. In contrast, only 5 of the 51 large metropolitan areas in the United States ranked behind Vancouver, Melbourne and Zurich.

    Table 1
    Top 10 Economist & Mercer "Cities"
    Ranked by Affluence
    (GDP per Capita, Purchasing Power Parity)
    Metropolitan Areas over 1,000,000 Population
    City or Metropolitan Area GDP per Capita: Rank among Top 100 World Metropolitan Areas The Economist Mercer
    Vienna 27 2 1
    Perth 28 5
    Munich 40 7
    Calgary 46 6
    Frankfurt 51 8
    Sydney 62 9 10
    Toronto 67 4
    Vancouver 71 1 4
    Melbourne 72 3
    Zurich 74 10 2
    Helsinki 84 7
    Auckland 84 5
    Dusseldorf 99 6

    100 Most Affluent World Metropolitan Areas: GDP per capita estimates for 2005 are provided for the 100 most affluent metropolitan areas in the world with more than 1,000,000 residents (Table 2).

    Dominance of the United States: It is perhaps not surprising that San Jose, California ranks as the richest major metropolitan area in the world, with a 2005 GDP per capita of $78,700. Number 2, however, is a surprise: Charlotte, NC-SC, which not only pirated away San Francisco’s largest bank some years ago and has now displaced the tony city by the Bay in the runner-up position. San Francisco and Washington, DC rank third and fourth most affluent in the world. Brussels, grown fat on the largesse of its European Union taxpayers, ranks 5th.

    The dominance of the United States is illustrated below.

    • The US has 8 of the 10 richest metropolitan areas in the world. Only Stockholm, at number 9, joins Brussels in the top 10 from outside the United States.
    • The US has 22 of the top 25 metropolitan areas (Figure)
    • 37 of the most affluent 50 metropolitan areas are in the United States. By contrast, Mercer ranks only seven US “cities” in the top 50.
    • 46 of the 70 richest metropolitan areas are in the United States

    Only one of the 51 US metropolitan areas with more than 1,000,000 fails to make the top 100 in the world, Riverside-San Bernardino ($25,800), which could just as easily be considered a part of the Los Angeles metropolitan area, just as San Jose could be considered a part of the San Francisco metropolitan area.

    Outside the United States: Outside the United States, the metropolitan areas of Australia and Canada perform best relative to their size. All five of Australia’s largest metropolitan areas placed in the top 100, with one in the top 50. Five of Canada’s six top metropolitan areas made the top 100, with one in the top 50. Europe placed 33 of its metropolitan areas in the top 100, with 11 in the top 50 and 22 in the second 50.

    The top 100 list provides some surprises.

    • One eastern European metropolitan area has already entered the top 100. Prague ranks 48th, with a GDP per capita of $42,400, which is more than Frankfurt or Phoenix.
    • London, arguably the world’s financial capital, ranks 44th, at $42,700. Some listings show London much higher, however such rankings exclude the outer portion of the metropolitan area, which these estimates include.
    • Tokyo-Yokohama ranks 79th, at $35,700. This ranking is lower than others, which either ignore purchasing power or exclude most of the metropolitan area by focusing only on the high income core (the prefecture of Tokyo).
    • The world’s two large “city-states,” Singapore and Hong Kong also make the list. Singapore ties Louisville and Sacramento at 53rd, with a GDP per capita of $41,500. Hong Kong ranks 79th, at $35,700. Moreover, it would not be surprising if other Chinese metropolitan areas begin to break into the top 100 over the next decade.

    Ranking Metropolitan Areas for People: American metropolitan areas provide their residents a superior standard of living. True enough, the mountains and water features of Vancouver or Zurich are superior to those of Oklahoma City or Charlotte. However, the average resident does not have enough money to spend much time boating in Vancouver or Zurich or taking in what may be a better cultural life. The standard of living may well be better for those with money in Vancouver, Vienna, Melbourne or Zurich than it is in an American metropolitan area. However, most people cannot afford to live like financiers and other “jet-setters.” For everyday people, the American metropolitan area remains the best place in the world to live.

    Table 2
    Top 100 World Metropolitan Regions 
    Gross Domestic Product per Capita: 2005 Estimates
    Purchasing Power Parity
    Metropolitan Areas over 1,000,000 Population
           
    Rank Nation Metropolitan Area GDP per Capita
    1 United States San Jose $78,700
    2 United States Charlotte $67,900
    3 United States San Francisco $65,400
    4 United States Washington $65,300
    5 Belgium Brussels $63,700
    6 United States Boston $59,000
    7 United States Seattle $57,600
    8 United States New York $56,200
    9 Sweden Stockholm $55,100
    10 United States Hartford $55,000
    11 United States Denver $54,700
    12 United States Minneapolis-St. Paul $54,600
    13 Germany Hamburg $53,500
    14 United States Dallas-Fort Worth $53,000
    15 United States Houston $51,900
    16 United States Indianapolis $51,800
    17 United States Philadelphia $50,100
    18 United States San Diego $50,000
    19 United States Atlanta $49,600
    20 United States Los Angeles $49,100
    21 United States Chicago $48,400
    22 United States Salt Lake City $48,200
    23 United States Milwaukee $47,800
    24 United States Nashville $47,700
    24 United States Columbus (Ohio) $47,700
    26 United States Las Vegas $47,400
    27 Austria Vienna $47,000
    28 Australia Perth $46,700
    29 United States Portland (Oregon) $46,600
    30 United States Kansas City $46,400
    31 United States Richmond $46,200
    32 United States Orlando $45,900
    32 United States Cleveland $45,900
    34 France Paris $45,700
    35 United States Memphis $45,500
    35 United States Detroit $45,500
    37 United States Austin $45,300
    37 United States Raleigh $45,300
    39 Ireland Dublin $44,300
    40 Germany Munich $43,800
    40 United States Baltimore $43,800
    42 United States Birmingham $43,500
    43 United States Miami $42,900
    44 United Kingdom London $42,700
    44 Denmark Copenhagen $42,700
    46 Canada Calgary $42,600
    46 United States Cincinnati $42,600
    48 Czech Republic Prague $42,400
    48 United States Phoenix $42,400
    50 Netherlands Utrecht $41,900
    51 Germany Frankfurt $41,800
    52 United States New Orleans $41,600
    53 United States Sacramento $41,500
    53 United States Louisville $41,500
    53 Singapore Singapore $41,500
    56 United States Pittsburgh $41,400
    57 Canada Ottawa $41,200
    57 United States Jacksonville $41,200
    59 Netherlands Amsterdam $41,000
    60 United States St. Louis $40,900
    61 France Lyon $40,400
    62 Australia Sydney $40,100
    63 Norway Oslo $40,000
    64 United States Rochester $39,900
    65 Italy Milan  $39,100
    66 United States Virginia Beach $39,000
    67 Canada Toronto $38,200
    68 Belgium Antwerp $37,900
    68 United States Tampa-St. Petersburg $37,900
    68 Australia Brisbane $37,900
    71 Canada Vancouver $37,600
    72 Australia Melbourne $37,100
    73 Japan Nagoya $37,000
    74 Switzerland Zurich $36,900
    75 United States Oklahoma City $36,800
    76 Germany Stuttgart $36,700
    77 United States Providence $36,100
    78 Germany Nuremburg $35,900
    79 Japan Tokyo-Yokohama $35,700
    79 China Hong Kong $35,700
    81 Netherlands Rotterdam-Hague $35,600
    82 Spain Madrid $35,500
    83 Italy Rome $35,400
    84 New Zealand Auckland $35,300
    84 Finland Helsinki $35,300
    86 Canada Edmonton $35,200
    87 Greece Athens $34,700
    88 Spain Bilbao $34,600
    89 France Toulouse $34,500
    90 Italy Turin $34,200
    90 United States San Antonio $34,200
    92 Australia Adelaide $33,500
    93 United States Buffalo $33,400
    94 Japan Shizuoka-Hamamatsu $32,500
    95 Spain Barcelona $32,300
    96 Japan Fukuoka-Kitakyushu $31,300
    97 Germany Cologne $31,000
    98 France Marseille $30,400
    99 Germany Essen-Dusseldorf $30,200
    100 Germany Hannover $29,900
    (1) Purchasing power parity. Metropolitan areas over 1,000,000 population for which data is available. Based upon data from Eurostat, US Bureau of Economic Analysis and Japan Statistics Bureau. 
    (2) US data for metropolitan areas from Bureau of Economic Analysis. Scaled to World Bank 2005 GDP PPP figure.
    (3) European data for metropolitan regions from Eurostat regional data. There is no generally accepted metropolitan area definition in Europe. Scaled to World Bank 2005 GDP PPP figure.
    (4) Japan data from Japan Statistics Bureau Scaled to World Bank 2005 GDP PPP figure.
    (5) London metropolitan area is Greater London plus the historic counties of Berkshire, Buckinghamshire, Essex, Herfordshire, Kent and Sussex (including unitary authorities), which are adjacent to the London green belt. Some London metropolitan region GDP estimates exclude suburban areas outside the Greater London Authority. This analysis includes these suburban areas, using GVA scaling from UK National Statistics to estimate non-metropolitan contribution included in Eurostat data (Bedfordshire, Oxfordshire, East Sussex and West Sussex).
    (6) Estimates for the following metropolitan areas scaled to 2005 from 2002 estimates using the closest available change estimate (metropolitan, state/provincial or nation) of the change in GDP per capita (http://www.demographia.com/db-gdp-metro.pdf): Metropolitan areas in Australia and Italy as well as Essen-Dusseldorf, Lyon, Marseille, Dublin, Auckland, Oslo, Zurich, Vancouver, Toronto and Ottawa.
    (7) Metropolitan area data for Calgary and Edmonton estimated from local sources.

    Note 1: Another problem with these kinds of rankings is that can be misleadingly unrepresentative. For example, Mercer ranks more than 200 “cities,” which sounds like a significant number. By cities, Mercer appears to mean municipalities (the website is unclear and Mercer has not responded to our request for clarification of what they mean by “city”), of which there are many in all first world metropolitan areas. Some have as few as 50,000 to 100,000 residents. Mercer ranks White Plains, New York (population: 57,000), in the New York metropolitan area, but has no ranking for the many larger cities in the metropolitan area, except for New York itself. Considering that the United States alone has nearly 275 municipalities of more than 100,000 population, the Mercer list appears to be far from comprehensive.

    Note 2: The national purchasing power parity conversion factor does not permit comparison of standards of living within nations. For example, anecdotal data would indicate that the cost of living is considerably higher in the San Jose, San Francisco and New York metropolitan areas than in the rest of the country. While not generally available, a purchasing power parity analysis within the United States could show metropolitan areas with lower GDPs per capita to have superior standards of living.

    Note 3: The European Union does not formally delineate metropolitan areas, however provides regional data that in most cases is a rough approximation of metropolitan areas.


    Wendell Cox is a Visiting Professor, Conservatoire National des Arts et Metiers, Paris. He was born in Los Angeles and was appointed to three terms on the Los Angeles County Transportation Commission by Mayor Tom Bradley. He is the author of “War on the Dream: How Anti-Sprawl Policy Threatens the Quality of Life.

  • ULI Moving Cooler Report: Greenhouse Gases, Exaggerations and Misdirections

    Yesterday a group of environmental advocacy groups, foundations and other organizations released a report, Moving Cooler, amid much fanfare, seeking to have us believe that it is a serious study of GHG reduction options in the transportation sector. It is immensely disappointing. The world could use a dispassionate, objective and broad-based assessment of petroleum reduction options as well as their positive and negative consequences. This is not it.

    As one reads one can’t help but feel that you are being hit with a sales pitch, or a legal brief from advocacy groups and those who would benefit financially from the derived policy options. The main point, amidst all the array of statistics, confirms the dogma of the already convinced that the only solution to greenhouse gases is major re-structuring of society.

    These notions, critically, were already on the front burner of these same groups long before the climate change issue came to prominence. “Progressive” foundations, new urbanists, planners and urban landowners long have advocated the re-assembly of urban living into high density transit-oriented bikeable/walkable communities. Even though their numbers as reported in the text don’t bear it out, the rhetoric is all focused towards that end and the pricing out of existence the automobile and all the evils it represents: suburban living and long trips.

    This is a report meant to be waved rather than read as the Congress goes about its fulminations in the coming months. It understates the prospect of gaining the full potential of greater energy efficiency from the vehicle fleet – the only way to justify the wholesale reorganization of society. In fact, if the vehicle/fuel assumptions had been as comparably optimistic as the land use assumptions, with a robust and honest assessment of fuel and vehicle technological development opportunities, one wonders whether this report would be worth doing at all.

    We have been here before. In the struggle to improve air quality, it turned out that the solution was not so much changing people’s behavior as it was technological – largely the improvement of fuel and vehicle technology. In the 1970s we were told we could not have cleaner air and automobiles; yet in fact that’s exactly what happened, without having to heed a sermon about our need to repent and change our suburban, car-driving ways. Some people just have a penchant for telling others how to live.

    Maybe the saddest part of it all, the authors appear not to take global warming or energy security very seriously at all. Rather these public concerns are just a convenient hook, the cause du jour, on which to hang their favorite solutions. If global warming matters – and it does; if energy security matters – and it does; then early action is clearly called for, particularly given the cumulative nature of GHG gases. But somehow the things easily done and carrying with them little in the way of disruption or public costs – carpooling, telecommuting, dispersed work – are largely written off. Such immediate, low-cost actions as highway operations strategies including better traffic signalization, improved traveler information and accident response systems receive little emphasis.

    Overall, the treatment of costs and benefits will leave readers gasping:

    • Travel times don’t get counted – so shifting from a 15 minute car trip to an hour on transit or walking has no penalty.
    • Transit subsidies don’t get counted – so doubling subsidies to increase ridership has only benefits.
    • Every possible pricing strategy is invoked – congestion pricing, cordon pricing, on-street parking fees, extreme fuel prices – in order to get people out of cars, and then the loss of their cars is counted as a benefit.

    At the same time the benefits and the costs involved are so corrupted to be meaningless. It will take weeks for analysts to tease out what really was done in the way of assumptions to create winners and losers. And there is no effort to tally all the costs exacted on the average household, or the typical business or even governments for that matter. The costs would add up to a permanent recession.

    I am sure the millions affected by these policies, particularly the middle and working class people who can now just barely afford a car, who would be priced out of the system by these policies, will say thank you for this “benefit”.

    As we work our way through the recession, workers will be willing to travel farther and farther to find the right job – or any job. With continuing increased specialization in our society larger and larger market sheds for jobs and for workers, quality transportation will be critical to our national productivity. This is the work that transportation does and it is totally dismissed by this report. It can not be addressed adequately by rail or transit even with a complete radical reorganization of work and society.

    In order to further bolster their ineffective case the proponents use a tool called “bundles” in which packages of actions are assembled for their “synergistic” qualities and either given a boost or cut based on the assertion that some things work well together. How this was done is not explained. So land use plans, which will take 30 years to come to fruition, are coupled with carbon pricing policies in a sort of horse and rabbit stew, that help make density solutions seem effective.

    Those who see the solution of so many of our present ills by cramming people into ever higher densities miss the point. Residential density is one of the most fundamental choices households make. Changing residential densities to make transit work better is the smallest tail wagging the biggest dog I can think of. It puts planning dogma ahead of the most basic human needs and rights.

    It is clear that most people, excepting a small but often very loud minority, opt for lower density living when income permits. As the society changes and choice patterns evolve, the marketplace must be ready to respond with development that is both responsive to household choices and to the demands of environmental needs. Any public policies that inhibit a market trend toward higher densities must be addressed. But the market place must be the final arbiter in a free society. People do not live “efficiently” in order to optimize some imposed societal goal, certainly not commuting.

    The serious work that needs to be done in this area still awaits an independent and credible group to undertake this work. It can’t come soon enough.

    For almost 40 years Alan E. Pisarski has been involved in the national transportation policy scene, from vantage points at the original Tri-State Transportation Commission in New York, the Metropolitan Washington COG, the Office of the Secretary, U.S. DOT, or in a personal consulting capacity. In his work he has measured the transportation activities of our nation from the metropolitan, state, national and international levels. In the U.S. DOT he organized the major travel surveys of the nation and designed and managed the U.S. transportation statistical system under the Assistant Secretary for Policy, establishing programs that are still the basis of much of the U.S. transportation statistical system today.

  • Salinas Dispatch: A Silver Lining in the Golden State

    From a distance, a crisis often takes on ideological colorings. This is true in California, where the ongoing fiscal meltdown has devolved into a struggle between anti-tax conservatives and free-spending green leftist liberals.

    Yet more nuances surface when you approach a crisis from the context of a specific place. Over the past two years my North Dakota-based consulting partner, Delore Zimmerman, and I have been working in Salinas, a farm community of 150,000, 10 miles inland from the Monterey coast and an hour’s drive south of San Jose. Our work has been funded by a variety of sources, including the city, local business interests and the Chamber of Commerce.

    Our goal has been to find ways to promote upward mobility in the town, which is almost two-thirds Hispanic. Poverty is widespread, and gang problems rank among the worst in California. Unemployment, devastated by the recent recession, hangs at around 15%.

    These conditions are not at all unusual for inland California, and they are particularly prevalent in farm regions. In the Central Valley, over the next range of mountains, conditions are far worse, with some communities losing thousands of acres in production and unemployment rushing upward of 40%.

    One liberal journalist, Rick Wartzman, recently described the vast agricultural region around Fresno as “California’s Detroit.” As environmentalists push to cut back on water supplies and protect fish populations in the San Francisco Bay Delta, Wartzman notes, its local workers and businesspeople “are fast becoming a more endangered species than Chinook salmon or delta smelt.”

    In Salinas, where water comes from local aquifers, wells and the Salinas River, death seems less imminent, but there is a profound sense that things may be deteriorating. Local growers worry about regulatory constraints that will drive up costs to meet new state greenhouse gas standards. They also fear a possible county initiative, promoted by the well-funded local greens, to ban the growing of genetically modified foods.

    The growers’ response to the pressure – as with other businesses in California – is not to quit but to scale down operations. Some are cutting back thousands of acres of lettuce and other green crops that have been the prime business for the area for nearly a century.

    Yet we also see many reasons for hope. Salinas remains a unique place with an amazing richness in what the French call terroir, a combination of climate and soil. The city’s most famous son, John Steinbeck, wrote of the Valley’s unique topography:

    “The high gray-flannel fog of winter closed off the Salinas Valley from the sky and the rest of the world. On every side it sat like a lid on the mountains and made of the great valley a closed pot.”

    Growing conditions in Salinas cannot be easily duplicated elsewhere. Its richness has created a cornucopia responsible for the predominant part of the area’s private-sector employment.

    But it’s not just physical factors that make Salinas – and California – so productive. People matter too. The area is populated by scores of hard-driving agricultural families, people whose forebears transformed the place into the “salad bowl” of a nation. By 1952, when Steinbeck published East of Eden, Salinas produced 70% of the nation’s lettuce and much of its fresh vegetables.

    Salinas’ growers are not hereditary gentry; talk to local farmers and you find people whose roots lay in Italy, Portugal, Ireland, Japan and, increasingly, Mexico. “People, if given opportunity, can accomplish anything,” notes Lorri Kester, CEO of Mann Packing, a leading broccoli producer. “Many of the firms that lead us now were started by ‘Okies’ who worked the land. Now we see the same things with Latinos who started out as hands and now are foremen or managers.”

    What the Salinas growers do best – like their high-tech counterparts up in the Santa Clara Valley – is innovate. Working with the USDA and University of California-Davis scientists, they have led the way in creating new strains of vegetables and new ways of marketing, including the notion of “salad in a bag.”

    But not all the knowledge that makes Salinas such an economic powerhouse comes from entrepreneurs or PhDs. Like many agricultural communities, Salinas has had a sometime brutal labor history, particularly in the 1930s. The worst of this is now thankfully over, but farm labor remains a tough and often unrewarding profession.

    Yet even the hardest-edged growers acknowledge the importance of their labor force. Although education levels remain relatively low, our research revealed an extraordinarily high concentration of people with practical skills that can be applied to growing the agricultural economy. Future mechanization may reduce the overall employee counts but will make growers even more dependent on skilled workers in the fields.

    This proficiency, acquired in the fields and the processing sheds, has helped create another product for the Valley: expertise. Salinas growers, foreman, irrigation workers and marketers now sell their knowledge in other parts of California, as well as to Arizona, Mexico and, increasingly, East Asia. “I am seeing a lot of product and technical products from Salinas go to China and elsewhere,” notes Frank Pierce, a local agricultural consultant.

    Salinas also teaches you to avoid the great distinction made by many pundits between the “knowledge” industry and the productive type that focuses on tangible goods. A successful economy draws on information but also creates real products. There is a relationship between the two that is dynamic and has long been a critical component of California’s economic vitality.

    This is not just true of Salinas. I learned long ago from the founding fathers of Silicon Valley – people like Intel founder Bob Noyce and venture capitalist Don Valentine – that the practical knowledge from making circuits and chips helped create the Valley’s unique engineering terroir. Similarly, the “magic” of Hollywood does not emerge full-blown from the brain storms of stars and moguls. The entertainment complex’s unique abilities grow from the interplay of practical knowledge of less glamorous camera people, grips, editors, caterers and prop-managers servicing what Angelenos invariably refer to as “the industry.”

    Sadly, this insight largely has been lost on California’s political and business leadership. Among the so-called “progressive” community, production of any kind, outside of small artisanal farms or funky software shops, is disdained.

    This anti-development ethos has gained extra traction by claims that large farms and factories might add to the “carbon footprint” of a given place. Among well-funded foundations and some corporate leaders there remains an implicit sense that California can still mine enough riches in cyberspace to support the vast hoi polloi.

    Yet in reality, Californians need hard jobs, even mundane ones. The farm, sound stage or electronics factory provide the employment essential to broad-based prosperity. And when those jobs leave California they usually migrate to a place – whether over the border or abroad – where wages are lower and environmental controls are far weaker.

    This is not to argue that California’s right has the answers either. Lower taxes are generally preferable to higher ones. But in Salinas – and California – sometimes higher taxes might be preferable to cutting services, like the critical training offered by community colleges, which make the economy work and offer hope to the younger generation.

    In Salinas, Mayor Dennis Donahue, a Democrat of the Pat Brown variety, has embraced a call to raise the sales tax in order to maintain basic services. It’s not an ideal solution, but in the real world of running a city, particularly one with a big gang problem, you don’t want to cut back on police and libraries or add to already surging unemployment.

    What California needs most now is what it’s most missing: common sense and a sense of balance. This is what we learned in Salinas. California cannot be saved by ideologies – it needs to be saved from them.

    To be sure, preserving the land and air quality should remain a priority; it is the basis of California’s riches and unique appeal. But sustainability – the great buzzword of our time – needs to apply not only to the environment but also the economy and society. The right-wing solution of lower taxes even at the price of eviscerating the public sector and letting the infrastructure deteriorate does not constitute a program for long-term prosperity.

    We prefer an approach that focuses on practical steps for private and public sectors to collaborate on restoring economic growth. In Salinas, this means establishing – through cooperation with Hartnell, the local community college – a center for the development of agricultural technology. Salinas could use its combination of intellectual and grassroots knowledge to become the Silicon Valley of the “fresh” economy. It would also serve as a center of practical research on E. coli and other diseases that threaten the entire agricultural industry.

    Another step would be to expand the area’s thriving wine corridor to promote the region’s vintages. And there needs to be a plan to restore the historic central core into a bustling business district and to attract the predominately Latino shoppers, now lured to malls and outlet centers outside the city, back into town.

    These steps will take effort and money, but neither free market ideology nor green zealotry alone will get it done. California’s greatness was created not just by entrepreneurs or through its public sector, but in a clever, pragmatic melding of the two. Blessed with resources of topography, climate and human skill, our state should not allow dueling extremes to turn a global paragon into a planetary laughingstock.

    This article originally appeared at Forbes.

    Joel Kotkin is executive editor of NewGeography.com and is a presidential fellow in urban futures at Chapman University. He is author of The City: A Global History. His next book, The Next Hundred Million: America in 2050, will be published by Penguin early next year.

  • UK Green Path leads to Deindustrialization and Worsening Housing Shortage

    The First Secretary of State, Secretary of State for Business, Innovation and Skills, and Lord President of the Council, Peter Mandelson, together with Ed Miliband, the Secretary of State for Energy and Climate Change, have published The UK Low Carbon Industrial Strategy. They are claiming it promises an “economic revolution” but is in fact an environmentalist retreat from industrial production It is a disastrous strategy that will result in further de-industrialisation, supposedly with the aim of addressing a rather vague threat of climate change.

    Mandelson and Miliband insist The UK Low Carbon Industrial Strategy “can ensure that our economy emerges from the global downturn at the forefront of the technological and social shift that will define the next century.” Yet this is typical establishment “greenwash”, which many institutional and corporate leaders of the construction industry will sadly rush to endorse. It will shift us towards the laborious construction of new eco-homes, and the laborious refurbishment of the stock of mostly draughty, poorly insulated, and badly serviced housing. All this is aimed to achieve, at least on paper, a contribution to a national carbon reduction target by 2020.

    Government thinks that it will be building 240,000 “zero carbon” homes every year by 2106. In fact at least 500,000 homes are needed every year to meet household growth and replace the oldest of the stock at a rate of 1% a year. Yet in reality this year new house building is down to 100,000 a year, and there is no reason why that level of production will increase even when, as is starting to happen, house price inflation returns. Instead of promoting mass production, most house builders are quite likely to follow The UK Low Carbon Industrial Strategy to become luxury eco-home builders. They will be content to build around 100,000 “green” homes a year to get through the planning system. They will build homes that show their environmental credentials by the thickness of walls and roofs – full of sheep’s wool or hemp, packed with straw bales, or made from low-fired clay blocks.

    This, of course, is the approach to new house building promoted by Prince Charles and the other would be green gentry. He advocates “the use of local materials to create local identity which, when combined with cutting-edge developments in building technology, can enhance a sense of place and real community.” Just as Mandelson and Miliband claim theirs is an industrial strategy, Charles promotes green building technology.

    Charles talks of building walls and roofs thickly in “volume”, but what does his royal greenness know of the market? Government also imagines it can use renewable insulation materials to produce “affordable” housing. Walls and roofs will get thicker, but housing will not be built in sufficient quantity for a growing population, and will not be affordable on most British household incomes.

    The green tendency will be to use greater thicknesses of less processed, more laborious-to-install insulation materials, cut-to-fit on site. This will make the walls and roofs on new eco-homes around half a metre thick, but that might be fashionable. Having more material in the walls and roof will show how little energy is used in the new and expensive eco-home.

    Thick insulation is an immediate problem in the refurbishment of the stock of 26 million existing houses and flats. It is not always possible to cover the outside with great thicknesses of natural materials that, contrary to the Prince’s claim, have a low capacity to insulate. Even industrially produced fibres and foams, which green purists think are too processed, must be used thickly. It is less possible to apply thicknesses of insulation inside the existing home, when most British homes are so small. A lot of filling of masonry cavity walls has been carried out under energy efficiency schemes, with little regard for why the drained air cavity was there in the first place. But no existing housing has walls with cavities of up to the 300mm that would be required for insulants that satisfy greens.

    The architectural fact is that only made-to-fit insulation, prefabricated as an industrially processed product, can achieve the thermal performance being discussed with a minimal thickness.

    Sheep’s wool and hemp, straw bales, and low-fired clay blocks are positioned increasingly off the scale to the right on thickness. Foam glass as an industrial product is poor as an insulant, as is cellulose fibre. The sorts of glass and mineral fibre insulation that can be bought in any builder’s merchant require substantial thicknesses. Foams have better performance, and are familiar as cut-to-fit insulation. However only the use of processed vacuum insulation, as a made-to-fit industrial product reduces insulation thicknesses to the architectural dimensions required.

    On behalf of New Labour Miliband boasts that Britain has produced a carbon reduction plan to 2020 that should inspire other industrial and industrialising nations. “Having been the first country in the world to set legally binding carbon budgets, we are now the first country in the world to assign every department a carbon budget alongside its financial budget,” he told the House of Commons. We seem to be the first country in the world to ignore the space- and time-saving potential of construction technologies that require energy in their production processes, but save energy in the long term operation of well serviced buildings.

    Britain is retreating from industry and makes an environmental fetish out of bulky “natural” materials that don’t work well. Why favour materials that are lightly processed as agricultural crops, or are low-fired but need rendering? Why not accept processing, as all timber is processed, and welcome the durability of fully fired bricks? This carbon obsessed idiocy in construction works against other great materials like concrete, glass, steel and aluminium.

    For their part government is insisting that insulation must be renewable and crop-based rather than an industrially processed product. This means that small British houses and flats will be thickly walled and roofed and will be built in too few numbers to accommodate British household growth. Every existing home must be refurbished indefinitely. That is truly pitiful for an old industrial democracy like Britain.

    Government abuses the words Industrial and Strategy, sharing the Prince’s low aspirations for twenty-first century construction and architecture. An industrial strategy worthy of the name would promote the development of highly processed vacuum insulation, and would expect skills in design, manufacture, installation, and maintenance.

    An attempt to make “green jobs” rather than raise productivity and wages, The UK Low Carbon Industrial Strategy should be seen and criticised as an environmentalist strategy of de-industrialisation, because that is precisely what it is.

    Ian Abley, Project Manager for audacity, an experienced site Architect, and a Research Engineer at the Centre for Innovative and Collaborative Engineering, Loughborough University. He is co-author of Why is construction so backward? (2004) and co-editor of Manmade Modular Megastructures. (2006) He is planning 250 new British towns.

  • Globalization Leads to Civic Leadership Culture Dominated by Real Estate Interests

    Cleveland’s leadership has no apparent theory of change. Overwhelmingly, the strategy is now driven by individual projects. These projects, pushed by the real estate interests that dominate the board of the Greater Cleveland Partnership, confuse real estate development with economic development. This leads to the ‘Big Thing Theory’ of economic development: Prosperity results from building one more big thing.

    Ed Morrison wrote the above about Cleveland, but he could have been describing any number of other cities. Why is it that so many cities have turned to large real estate projects to attempt to restart growth, turning away from strategies that previously made them successful?

    The answer possibly lies in structural economic changes resulting from the nationalization and globalization of industry. Up until the 1990s, many businesses – including retail, utilities, some manufacturing, and especially banking – operated on a regional or local basis. This meant that the civic leadership of a community was heavily dominated by businessmen, again, especially bankers, whose success was dependent on the overall macroeconomic health of the particular city or region they were located in.

    But with banking deregulation, we saw large numbers of hometown banks merged out of existence. Industry after industry was subjected to national or international level roll-ups as changes in the economy and regulatory environment gave increasing returns to scale.

    Why is it that “real estate interests” dominate in a local economy like Cleveland? Because, to a great extent, they are among the only ones left. Consider the local industries that were not as subject to roll-ups. Principal among these are real estate development, construction, and law. This means the local leadership of a community is now made up of executives in those industries, and they bring a very different world view versus the previous generation.

    Consider the difference between a banker and a lawyer. Banks make money on the spread between what they pay for deposits or wholesale funding, and what they charge for loans. This means the CEO of a bank is making money while he plays golf at 3. He’s got a cash register back at the office that never stops ringing.

    By contrast, lawyers get paid by the hour for work on specific matters and transactions. The law partner is only making money on the golf course if he is closing a deal. It’s similar between many other “operational” businesses that were previously prominent in communities, and the “transactional” businesses that are now often dominant.

    Additionally, even where the hometown bank or company did not get bought out, it likely escaped that fate by getting big itself and making large numbers of acquisitions or otherwise expanding. This means those institutions are less dependent on the health of the particular local market they happen to be headquartered in than they are overall macroeconomic conditions. While no doubt they want the headquarters town to be successful, not least of which so they can effectively recruit talent, they can afford to take a portfolio view of local markets.

    Not only has the drying up of local and regional operating businesses led to a business leadership community unbalanced in favor of transactionally oriented firms, the loss of those local and regional operating businesses robbed many of the transactional companies such as law and architecture firms of their principal local client base. Large national businesses employ national firms for advertising, law, architecture, etc. If they use local firms, it is in a subsidiary role. (Or, if a smaller firm is fortunate enough to land a contract, it is servicing a client on a national, not local basis).

    Richard Florida described this in his Atlantic Monthly article on the financial crash. “As the manufacturing industry has shrunk, the local high-end services—finance, law, consulting—that it once supported have diminished as well, absorbed by bigger regional hubs and globally connected cities. In Chicago, for instance, the country’s 50 biggest law firms grew by 2,130 lawyers from 1984 to 2006, according to William Henderson and Arthur Alderson of Indiana University. Throughout the rest of the Midwest, these firms added a total of just 169 attorneys. Jones Day, founded in 1893 and today one of the country’s largest law firms, no longer considers its Cleveland office ‘headquarters’—that’s in Washington, D.C.—but rather its ‘founding office.’”

    Where then is the source of transactions these firms can turn to in order to sustain their business? The public sector, of course.

    I would hypothesize that many local transactionally oriented services companies have seen the public sector take on a greater share of billings than in the past. With the old school bankers and industrialists mostly out of the picture, the leadership in our communities consists increasingly of the political class and a business community dominated by transactional interests.

    When you look at the composition of this group, it should come as no surprise that the publicly subsidized real estate development is the preferred civic strategy. Politicians get to cut ribbons. Cranes always look good on the skyline. Local architects, engineers, developers, and construction companies love it. And there is plenty of legal work to go around.

    This is not to say these people are acting nefariously. And nor were old school bankers and industrialists always acting purely altruistically. Rather, the difference comes from the world view and “theory of change” that people steeped in transactionally oriented businesses bring with them.

    With the current financial crisis, bigness, as a strategy, is out of favor for the moment. Also, the gimmicky financial transactions that underlie much of the crisis are calling the entire transactional model into question. There’s an increasing alarm at the precipitous decline of manufacturing, particularly the auto sector. And people are questioning whether we as a country can survive simply through services, or whether we need to revitalize the concept of the operational business and actually making things. Plus, real estate deals are tougher to get done because of tight credit, and it seems unlikely that the go-go days of recent years are coming back soon.

    We’ll see where this leads. But if we see more local and regional scale operating businesses start to emerge again, then perhaps the urban development pendulum will start swinging the other direction again. In the meantime, large scale real estate development will likely continue to be preferred.

    Aaron M. Renn is an independent writer on urban affairs based in the Midwest. His writings appear at The Urbanophile.