Category: Urban Issues

  • The Incompatibility of Forced Density and Housing Affordability

    New research supports the conclusion that anti-sprawl policy (urban containment policy) is incompatible with housing affordability. Build-zoom.com economist Issi Romem finds that: “Cities that have curbed their expansion have – with limited exception – failed to compensate with densification. As a result they have produced far less housing than they would otherwise, with severe national implications for housing affordability, geographic mobility and access to opportunity, all of which are keenly felt today as we approach the top of housing cycle.”

    Romem had previously produced stunningly innovative research, estimating the extent of urbanization in US cities every decade from 1940 to 2010. He provides maps that show the changing urban expanses in each census. Romem uses the larger metropolitan areas, the currently defined Combined Statistical Areas (CSAs). This combines metropolitan areas that are adjacent and significantly economically connected, such as San Francisco and San Jose, New York , southeastern Connecticut and Allentown, and Los Angeles and Riverside-San Bernardino.

    The new research is a similarly important addition to urban policy. Like most in urban planners, Romem strongly believes that the "ills of the urban sprawl must be curbed." However, importantly, Romem’s research is driven by data, rather than urban planning principles often disconnected from the aspirations of households. This article examines Romem’s most recent research in the context of middle-income housing affordability.

    Middle-Income Housing Affordability

    Housing affordability is much broader than “affordable housing” for lower income households. In markets regulated by urban containment, middle-income housing usually becomes too expensive for many middle-income households. In such markets, there is considerable discussion of housing affordability, but little that gets to the heart of the matter.

    Housing affordability is appropriately compared both between housing markets and  within markets over time. Perhaps the most effective tools are price-to-income ratios, such as the median multiple (median house price divided by median household income) used in the Demographia International Housing Affordability Survey. Now in its 12th edition, the Survey shows virtually all major metropolitan areas with seriously unaffordable housing to have urban containment policy.

    Development Limits: More Politics than Mountains or Water

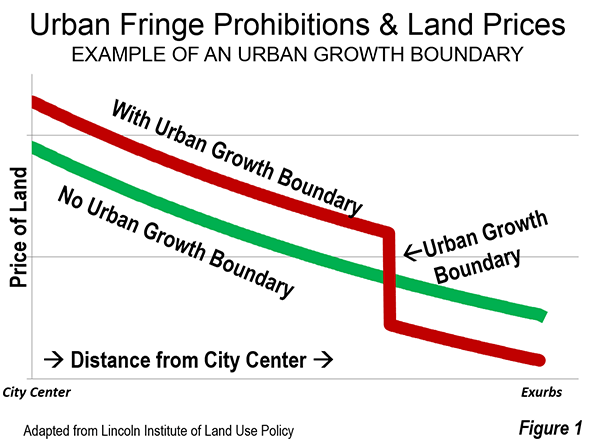
    In covering Romem’s research, Richard Florida acknowledges describes the crucial role of role of land markets in maintaining housing affordability. Of course, housing affordability is a casualty of urban containment policy because it destroys the competitive market for land on the urban fringe. As a result house prices rise substantially relative to incomes (Figure 1).

    Romem and Florida, to their credit, have proposed means they think can preserve housing affordability within a framework of urban containment, such as by land use regulation that permits higher densities, including redevelopment of lower density areas. While wishing them luck, there is little cause for optimism. Near 50 years ago, legendary urbanologist Sir Peter Hall suggested that “soaring land prices …. certainly represent the biggest single failure of the system of planning introduced with the 1947 [Town and Country Planning] Act” (see: The Costs of Smart Growth Revisited: A 40 Year Perspective). Urban containment policy, the principal strategy of forced densification, cannot repeal the law of supply and demand. Seventy years of experience prove that.

    Florida and others have noted the challenges of cities running up against their development limits. However, in the United States, only the artificial political limits of regulation have been approached, rather than the natural barriers of topography or geography (see: A Question of Values: Middle-Income Housing Affordability and Urban Containment Policy). Where a binding urban growth boundary is imposed between the city and an impassible mountain range, the scarcity induced price increases result from the boundary, not the mountain.

    Politics, Topography & Geography in the San Francisco Bay Area

    Take, for example, the San Francisco Bay Area, which has often been cited as a place where natural barriers have left little land for development. This is an impression easily obtained observing the fairly narrow strips of urbanization on both sides of San Francisco Bay, hemmed in by hills.

    However the Bay Area’s urbanization long ago leapt over the most important water bodies and then the Berkeley Hills to the east. Not only is the San Francisco Bay Area CSA high density, but it is also spatially small. In 2016, the San Francisco built-up urban area was only the 23rd largest in land area in the world. New York, the world’s largest built-up urban area in geographical expanse is more than four times as large.

    There is plenty of developable land in the San Francisco Bay Area. Data in a 1997 state analysis indicated that another 1,500 to 4,300 square miles (3,900 to 11,000 square kilometers) could be developed in the Bay Area CSA. The lower bound assumed no farmland conversion and stringent environmental regulation. The report also found that in recent years, residential development had become marginally denser, yet not incompatible with the detached housing remains the preference in California (Figure 2). The state has more than enough developable land for future housing needs.

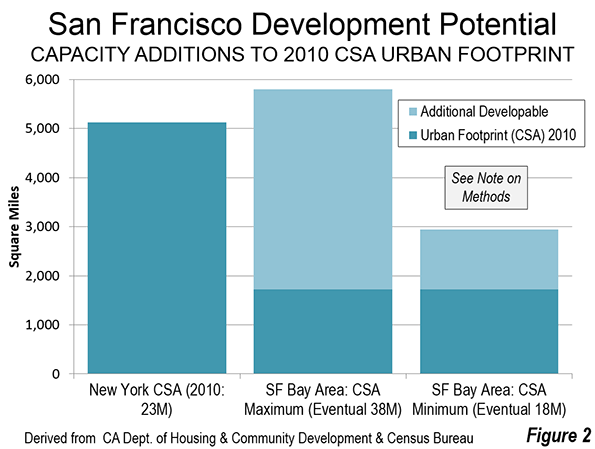
    Updating the data to account for the development that occurred through 2010, the developable land supply could support an urbanization of between 18 million and 37 million population, well above the 2010 urban population (Note on Method). At the most, there is capacity to accommodate the population of Tokyo – Yokohama, the world’s largest urban area. At a minimum, use of the available land would catapult the Bay Area CSA ahead of the Los Angeles-Riverside CSA, more than double its present population.

    Of course, the Bay Area is simply not growing fast enough to reach even the lower population figure any time soon. Even with its slower growth, however, the competitive market for land no longer works, in large measure because of land use regulation. The San Jose metropolitan area has the fourth worst housing affordability in the Demographia International Housing Affordability Survey and the San Francisco metropolitan area is 7th worst (both metropolitan areas are in the CSA).

    The decades old Bay Area housing affordability crisis, and that of other metropolitan areas seeking to force higher densities, is more the result of policy than nature.

    Urban Containment: Negative Externalities

    Moreover, planning authoritarianism cannot tell everyone where and how to live. For many, high density apartments (owned or rented) are not a substitute for the detached house. Indeed the substitute for the detached housing the Bay Area for many is often a detached house in Nashville or Kansas City or any of many other major metropolitan areas where housing is much less expensive. Last year’s (2014) IRS migration data shows that California is losing both younger households and middle income households.

    Higher than necessary house prices are, of course, an even greater problem for low-income households, who not only are excluded from homeownership but most pay unaffordable rents. The latest data shows that California again has the worst housing cost adjusted poverty rate among the 50 states. Even Mississippi, with its reputation for poverty, cannot compete with that.

    Romem expressed concern to The Wall Street Journal: “What you’ll get there is an exacerbation of the problems we already have in expensive cities. The distinction between homeowners and renters will become less and less a stage of life and more and more if your parents can help you.”

    The Economist came to a similar conclusion: “Suburbs rarely cease growing of their own accord. The only reliable way to stop them, it turns out, is to stop them forcefully. But the consequences of doing that are severe" (See: Cities: Better for the Great Suburbanization).

    Note on Method: Some of the CSA urban population is not in the continuous urbanization of San Francisco-San Jose built-up urban area, such as in the Santa Rosa, Stockton and Santa Cruz urban areas. This analysis is based on data from the California Department of Housing and Community Development and the U.S. Census Bureau. It is based on an estimate of additional development occurring from 1996 to 2010 and the land remaining after deduction of recently developed land. The population capacity assumes the “marginally higher” densities used by the California Department of Housing and Community Development, which it notes would not require substantial changes in the “current form of housing development” (1997).

    Wendell Cox is principal of Demographia, an international public policy and demographics firm. He is a Senior Fellow of the Center for Opportunity Urbanism (US), Senior Fellow for Housing Affordability and Municipal Policy for the Frontier Centre for Public Policy (Canada), and a member of the Board of Advisors of the Center for Demographics and Policy at Chapman University (California). He is co-author of the "Demographia International Housing Affordability Survey" and author of "Demographia World Urban Areas" and "War on the Dream: How Anti-Sprawl Policy Threatens the Quality of Life." He was appointed to three terms on the Los Angeles County Transportation Commission, where he served with the leading city and county leadership as the only non-elected member. He served as a visiting professor at the Conservatoire National des Arts et Metiers, a national university in Paris.

    Photo: San Mateo County on the San Francisco Peninsula (by author)

  • Lone Star Quartet

    Texas’s spectacular growth is largely a story of its cities—especially of Austin, Dallas–Fort Worth, Houston, and San Antonio. These Big Four metropolitan areas, arranged in a layout known as the “Texas Triangle,” contain two-thirds of the state’s population and an even higher share of its jobs. Nationally, the four metros, which combined make up less than 6 percent of the American population, posted job growth equivalent to 30 percent of the United States’ total since the financial crash in 2007. Within Texas, they’ve accounted for almost 80 percent of the state’s population growth since 2000 and over 75 percent of its job growth. Meantime, a third of Texas counties, mostly rural, have actually been losing population.

    Texas is sometimes described as the new California, an apt parallel in terms of the states’ respective urban geographies. Neither state is dominated by a single large city; each has four urban areas of more than 1 million people, with two of these among the largest regions in the United States. In both states, these major regions are demographically and economically distinct.

    But unlike California, whose cities have refocused on elite priorities at the expense of middle-class occupations, Texas offers a complete spectrum of economic activities in its metros. Another key difference is that Texas cities have mostly embraced pro-development policies that have kept them affordable by allowing housing supply to expand with population, while California’s housing prices blasted into the stratosphere due to severe development restrictions. Texas cities also benefit from favorable state policies, such as the absence of a state income tax and a reasonable regulatory and litigation environment. These factors make Texas cities today what California’s used to be: places to go in search of the American dream.

    In Texas, the major metros also have the advantage of being in a fairly compact region. San Antonio and Austin are separated by an 80-mile drive, almost entirely filled in with development along the I-35 corridor, with significant future opportunities in towns near enough to serve both markets, such as San Marcos. The other regions are all within a three- to three-and-a-half-hour drive of one another—not much different from the Acela train connections linking New York, Boston, and Washington.

    This proximity makes the Texas Triangle one of the premier emerging American mega-regions. All four cities rank in the top ten for percentage population growth since 2000 among major metro areas (those with more than 1 million people). Three of the four rank in the top ten for percentage job growth during that time. (Dallas just misses, with a rank of 11th.) Houston, San Antonio, and Austin are in the top ten metro areas for growth in residents with college degrees and in the top five for growth in millennials (ages 25–34) with degrees since 2000. But while these successful cities have much in common, they’ve each done it their own way.

    Dallas–Fort Worth doesn’t usually come to mind when one thinks about America’s largest cities. But with a population topping 7 million, Dallas is now the fourth-largest metropolitan area in the country. If current growth rates continue, Dallas would pass Chicago and move into third place in regional population before 2050.

    Chicago and Dallas have much in common. Both lie within the central time zone, with large airports that serve as ideal hubs for air travel around the United States. Both cities boast large, diversified corporate centers not reliant on a single industry, with deep talent pools and thick labor markets. Both are key national logistics hubs. Both are home to diverse populations, with Dallas now exceeding Chicago in its share of foreign-born residents. Chicago retains some advantages: the Loop remains America’s second-largest business district and is currently booming. And the Windy City’s downtown beat out Dallas in a competition to lure Boeing’s headquarters back in 2001.

    But while Chicago remains dominant in urbanity and global-city functions, Dallas increasingly prevails in everything else. If Chicago is downtown-dominated, Dallas is perhaps the most multipolar urban region in America, with two distinct cities in Dallas and Fort Worth, as well as premier suburban business centers in Plano and Richardson. Firms can choose from a range of environments. While America’s elite urban centers increasingly attract niche, if high-value, employers, Dallas remains a place where companies can afford to hire thousands of people—or relocate them, as Toyota decided to do in 2014, when it announced that it would move 5,000 employees and contractors from Southern California to the Dallas area, settling them into a new campus in Plano. The Japanese automaker joins other large-scale employers in the area, including American Airlines (25,000 employees), Lockheed Martin (13,700), and Texas Instruments (13,000).

    Dallas strives to be not only a welcoming place for commerce but also a high-quality place to live. The city is spending big to fulfill that goal. Fort Worth’s cultural district was already home to the renowned Kimbell Art Museum and the Modern Art Museum. Dallas, which has seen a boom in its urban core, particularly its Uptown district, recently invested in a $1 billion downtown performing-arts district that includes a concert hall, opera house, and other buildings designed by prominent architects.

    Generous philanthropic communities are Texas’s secret weapon. Donations—including 134 separate donations of $1 million or more—provided almost all the performing-arts center’s financing and also helped pay for the new Klyde Warren Park, built on a deck over a freeway, and a signature bridge design by Santiago Calatrava. Like northern capitalists of the great industrial age, wealthy Texans are willing to spend big to put their hometowns on the map. High-quality urban amenities cost money, and a robust Texas private sector made these kinds of investments possible. But it was the philanthropic culture of the Texas money men that led them to put their cash to work to expand the area’s cultural offerings.

    Not all the money has been well spent. Dallas built the longest light-rail system in the United States, at 90 miles, but the DART rail system carries only about 100,000 passengers per day, a drop in the bucket for the region. DART cost billions to build and requires about $75 million per year in subsidies to operate, and unlike the cost of the performing-arts center, these costs are financed by tax dollars.

    With a population of 6.5 million, Houston is the fifth-largest metro area in the United States, giving Texas two of the five largest regions in the country. Unlike diversified Dallas, Houston is known for being the global center of the energy industry.

    Houston is such an energy magnet that even companies with headquarters elsewhere have a huge presence there. Headquartered in Dallas, ExxonMobil is building a new Houston campus that will employ 10,000. Chevron is based in the Bay Area but has more employees (8,000) in Houston and has been shifting more jobs there. International energy firms with a Houston presence include Total, BP, Shell, Repsol, and Petrobras. Houston dominates oil services, with firms like Schlumberger and Halliburton.

    Powered by the energy sector, Houston has added more than 700,000 jobs since 2000, despite two recessions. Recent declines in oil prices will no doubt be a drag on Houston’s economy in the near term, just as federal retrenchment has affected Washington, D.C. But like Washington’s, Houston’s long-term fundamentals remain strong. Economically, the city is not a one-horse town. It boasts one of America’s largest ports. It has the nation’s largest petrochemical manufacturing complex (which benefits from low oil prices). Houston is home to NASA’s Johnson Space Center and the Texas Medical Center, the world’s largest, serving thousands of international patients each year. Philanthropy has played a substantial role in supporting the medical center.

    Houston famously has no zoning inside city limits, though the city’s building code imposes some zoning-like restrictions, and many private developments utilize deed restrictions that mimic zoning. Houston’s physical development pattern is not unlike that of most other sprawling American cities. But the lack of use-based zoning illustrates the city’s pro-development and pro-business mind-set. For example, the city of Houston issued permits for more apartment construction in the year ending May 2015 than anywhere else except New York City.

    Coastal dwellers portray Texas as culturally retrograde, but Houston, where one of America’s best opera companies performs, was the first of America’s biggest cities to elect an openly homosexual mayor, pro-market Democrat Annise Parker. The area is 23.1 percent foreign-born, ranking seventh in the country among major metros in its share of such residents; and 91 consulates, trade offices, or other foreign missions operate there. The Houston area’s Asian population, half a million strong, has more than doubled since 2000. The city also famously opened its doors to thousands of mostly black New Orleans residents displaced by Hurricane Katrina. Many chose to stay in Houston, attracted by its economic opportunities.

    Like Dallas, Houston built a dubious light-rail system. More astutely, it recently reengineered its bus service to focus on high-frequency routes, without adding costs. It’s also investing substantially in parks, such as the ten-mile-long Buffalo Bayou Park. So Houston, too, is focusing on getting better, not just bigger.

    The oldest major city in Texas, San Antonio was for decades its largest city. Demographically, it is a Latino stronghold. It has the highest share of its population of Hispanic origin of any region over 1 million people in the U.S.—even more than Miami—and it’s the only one where over half the population is Hispanic. San Antonio’s Hispanics have long-standing roots in the community, however: only 12 percent of the metro area is foreign-born, simultaneously the smallest foreign-born and smallest Anglo population among major Texas cities.

    With its long history, San Antonio enjoys a thriving tourism industry. More than 30 million visitors each year come to see the city’s historic sites, such as old Spanish missions, including the famed Alamo. San Antonio’s Riverwalk is widely known around the country, with many cities trying to replicate it.

    The real engine driving the city’s economy, though, is a strong military presence, including such installations as Fort Sam Houston and Lackland Air Force Base. Though the military has downsized, San Antonio has benefited from consolidation. Much of its military presence is high-value, such as its Medical Education and Training Campus. Home to the Air Force’s Cyber Command and a National Security Agency cryptography center, among other related operations, San Antonio has also become an unlikely center for cyber-security, with the city’s University of Texas campus offering the nation’s top-rated program in that discipline. The military presence has also spawned related private-sector businesses, such as financial-services giant USAA, which serves military members, veterans, and their families.

    Military life has lured many permanent residents to the area. Every year, 4,200 people get discharged from the service in San Antonio, and many decide to stay in the city. This high-quality, reasonably priced labor force has attracted firms like Accenture, which employs 1,200 at a service center in the region.

    The military has also served as a vehicle for integrating Hispanics into the city’s middle class. City leaders boast of excellent relations between ethnic groups. For example, though not known as a black population center, San Antonio has one of the nation’s largest Martin Luther King Day parades. These ethnic connections go back a long way. A stronghold of Latinos and German immigrants, San Antonio was a pro-Union city during the Civil War.

    While San Antonio excels in middle- and working-class job growth—Toyota recently built a truck plant there—its educational attainment rates rank third from the bottom among major metros. Only 26.3 percent of its adults hold college degrees. Unlike elite coastal cities, San Antonio continues to attract the less educated, though the region is growing its number of people with degrees at one of the fastest rates in the country.

    If one Texas city can boast “street cred” among coastal elites, it’s Austin, the state capital and home to the flagship campus of the University of Texas, giving it many attributes of a college town. This includes its live music scene, nationally known thanks to PBS’s Austin City Limits, the longest-running music program in television history, which has developed into one of the country’s largest annual music festivals and a permanent music venue in downtown Austin. The city also hosts the global SXSW festival, originally a music event and now arguably the hippest technology conference in the country, drawing talent from around the globe.

    Austin is a city of distinct neighborhoods and districts. A campaign to preserve local small businesses spawned the slogan “Keep Austin Weird,” now copied by cities like Portland and Louisville. Austin ranks as the sixth-most educated region in the country, with 41.5 percent of its adults having college degrees. It’s regularly listed as among America’s most physically fit cities.

    Austin’s technology industry has roots in the city going back to the 1960s, when IBM and Texas Instruments opened up shop. Motorola arrived in the 1970s, while the 1980s saw the arrival of chip-industry consortium Sematech and the founding of Dell Computer. Today, Austin has one of the country’s fastest-growing tech sectors, with a flurry of start-ups as well as offices from a who’s who of Silicon Valley firms, including Apple (approaching 7,000 local employees), Oracle, Facebook, Google (which is bringing its Google Fiber product to the city), and Intel.

    With its big-government and university heritage, Austin unsurprisingly has the blue politics amenable to coastal dwellers and its many public employees—and it shows some signs of emulating the negatives of California and Silicon

    Valley. Its median home-price multiple—the price of the median home divided by the regional median income—has crept up to 4.0, the highest of the Texas urban quartet. The city of Austin’s share of children is declining. Already the least diverse major Texas metro, Austin is seeing its share of blacks decrease. And the city has failed to invest in infrastructure to keep up with its rapid growth. As Ryan Streeter at the University of Texas put it: “Austin thought that if the city didn’t build it, they wouldn’t come—but they came anyway.”

    While all four Texas metro areas rank among the most booming cities in America, they face threats to future prosperity. When their growth cycles inevitably come to an end, they will have to prove themselves again, as Chicago, Detroit, Los Angeles, and New York once did. Time will tell whether they can renew themselves across economic cycles, as New York has done—or fall, like Detroit. The Texas metros also must demonstrate that they can grow their per-capita incomes over time, not just add lots of jobs. Their record here is mixed, with only the Houston region significantly outperforming the national average. Austin and Dallas have lost ground versus the country as a whole since 2000. San Antonio did better but still trails the U.S. average.

    The cities face short-term risks, too, especially poor municipal balance sheets. The Hoover Institution ranked Dallas and Houston among the worst cities for their unfunded pension liabilities as a percent of government revenues. Houston’s unfunded pension liability, including pension obligation bonds, stands at $5.9 billion, and the city faces a budget crunch. Dallas’s estimated pension shortfall is between $3 billion and $5 billion, depending on how one calculates it. Last fall, S&P and Moody’s downgraded the city’s credit rating. Other risks include failing to expand infrastructure in line with growth—as may have happened in Austin already—and potentially unsustainable development patterns in Dallas and Houston.

    But perhaps the most serious near-term concern is that these cities might forget what made them successful. Dallas passed a plastic-bag fee (since repealed), and Austin banned plastic bags altogether. Denton, in north suburban Dallas, banned fracking within city limits, though the state overturned the ban. Texas already faces an external threat from environmental activists who would destroy its energy business and suburban-oriented development model if they could. As the fracking ban shows, a regulatory mind-set has begun to creep in, one that could eventually undermine the Texas economy.

    Antidevelopment advocates have also targeted highway construction. Houston’s new mayor, Sylvester Turner, has said, “We need a paradigm shift [away from roads and single-occupancy vehicles] in order to achieve the kind of mobility outcomes we desire. . . . We need greater focus on intercity rail, regional rail, High Occupancy Vehicle facilities, Park and Rides, Transit Centers, and robust local transit.” But in regions adding more than 1 million new residents per decade, roadway expansion is critical. If Los Angeles can’t increase transit ridership with billions of dollars’ worth of new rail lines, there’s no prospect that Texas cities can do so. Investment in buses, cycling, and sidewalks is important but no substitute for core highway infrastructure. Yes, the urban cores of these cities should become more dense and walkable, but that shouldn’t mean becoming hostile to suburbs.

    Texas isn’t California. Many people are willing to pay a lot to live in gorgeous, transit-friendly San Francisco or Southern California’s perfect climate. But no one will pay a premium to live in flat, sweltering Texas. To continue succeeding, Texas cities need to become the best possible version of what they already are—not a poor man’s substitute for something that they can never be.

    This piece is part of The City Journal’s special Texas issue. Check it out here. Top graphic courtesy of The City Journal.

    Aaron M. Renn is a senior fellow at the Manhattan Institute, a contributing editor of City Journal, and an economic development columnist for Governing magazine. He focuses on ways to help America’s cities thrive in an ever more complex, competitive, globalized, and diverse twenty-first century. During Renn’s 15-year career in management and technology consulting, he was a partner at Accenture and held several technology strategy roles and directed multimillion-dollar global technology implementations. He has contributed to The Guardian, Forbes.com, and numerous other publications. Renn holds a B.S. from Indiana University, where he coauthored an early social-networking platform in 1991.

  • Local Govt. Control: The Ignored Campaign Issue

    In an election cycle full of spittle and bile, arguably the greatest issue — the nature of governance and the role of citizens — has been all but ignored. Neither candidate for president has much feel for the old American notion of dispersed power. Instead each has his or her own plans for ever greater centralization: Trump by the force of his enormous narcissistic self-regard; Hillary Clintonthrough the expansion of the powers increasingly invested in the federal regulatory apparatus.

    This profound disregard for the restraints of federalism comes at a time when our economy is undergoing profound centralization. Regulatory and monetary policy has benefited those with access to the most capital, making this economy more concentrated than at any time in recent history. This is particularly true in the information sector, which is now dominated by a handful of firms able to devour any competitor without  fear of anti-trust objections from Washington.

    Ultimately the very things James Madison and the other Founders worried about — the concentration of wealth in a few hands, the devolution of republican institutions and the rise of a central imperium — are becoming increasingly evident, with precious little debate about what this means or how it could be reversed.

    Is This What People Want?

    This centralization is not occurring by popular demand. By a wide margin — 64 percent to 26 percent, according to a 2015 poll — Americans say they feel “more progress” comes from the local level than the federal level. Majorities of all political affiliations and all demographic groups hold this same opinion.

    The preference for localism also extends to attitudes toward state governments, many of which have grown more powerful and intrusive in recent years. Seventy-two percent of Americans, according to Gallup, trust their local governments more than they do their state institutions; even in California, the mecca for ever-expanding government, large majorities favor transferring tax dollars from Sacramento to the localities.

    This also applies to millennials. Though liberal on issues like immigration and gay marriage, they are not generally fans of centralization. Fewer than one-third of them favor federal solutions over locally based ones.  “Millennials are on a completely different page than most politicians in Washington, D.C.,” notes pollsterJohn Della Volpe.  

    The federal government, a source of pride in the days of the New Deal, the Second World War, the Cold War and the civil rights struggle, is now regarded by  half of all Americans, according to Gallup, as “an immediate threat to the rights and freedoms of ordinary citizens.” In 2003 only 30 percent of Americans felt that way. A recent survey conducted by Chapman University  found that more Americans now have a greater fear of their own government than they do of outside threats.

    Has Centralization Reached Its Peak?

    Although he is hardly the originator of this trend, President Obama has become one of the most prolific authors of executive power in U.S. history. Critically, this has occurred in a time of relative peace and no compelling national emergency.

    The conservative Heritage Foundation estimates that by 2015 the Obama administration had passed at least 184 “major rules” (regulations with at least a $100 million economic impact) and thousands of smaller ones. During its first six years, the administration promulgated more than twice as many major rules as during the first six years of the predecessor George W. Bush administration.

    Many  directives  have been implemented as a way around legislative approval, a marked shift from earlier eras of legislative-executive cooperation during both the Reagan and Clinton  administrations. Some of this stems from the antics of an often obstructionist Congress but much of the long-term damage to federalism largely rests with the president. As Obama prepared for his last year in office, his agendawas defined primarily by new executive orders and regulatory edicts.

    Once executive power has been validated, the road back to a more balanced federalism may prove difficult. The tools of dictatorship grow ever more comfortable in the hands of those of wield it, whatever their politics, something that occurred in the decades before the collapse of Roman Republic.

    Not a Partisan Issue

    In a new paper, “Our Town: Restoring Localism,” my colleague Wendell Cox and I argue that centralization should not be regarded as a partisan issue. Some progressives, particularly in academia, assert that support for localized decision-making rests “not in facts but rather in ideology and politics.” Some also link any devolutionary agenda to the crimes committed in the name of “states’ rights,” most notably slavery and the post-Reconstruction Jim Crow laws.

    Yet, historically, many on the progressive left, including Justice Louis Brandeis, favored decentralization. As governor of Arkansas, Bill Clinton supported the view that local governments were often better suited to address civic problems. In his forward to David Osborne’s book “Laboratories of Democracy,” Clinton praised “pragmatic responses” to key social and economic issues by both liberal and conservative governors. Such state-level responses, Clinton noted, were critical in “a country as complex and diverse as ours.”  

    Nor are centralized solutions as efficient as some claim. After a half-century of massive federal investment, poverty rates are now worse than before the advent of the Great Society. Similarly, educational outcomes continue to deteriorate even as federal officials seek to intrude ever more into the minutiae of public schools.

    Nor have attempts to consolidate local areas enhanced efficiency or reduced spending, as is commonly suggested. Overall, large consolidations have proven inefficient, with higher costs  and levels of indebtedness than smaller ones.

    More important still is the critical role of localism in maintaining the traditions of American democracy. This is understood by many self-described progressives who express support for Main Street businesses and local farms and as a reaction against globalization and domination by large corporations.  Progressive author Heather Gerken has argued that social causes such as gay marriage and marijuana legalization tend to be adopted first at a local level before spreading to other areas.

    Sadly, the closer one gets to the Washington honey pot, the more that progressive passion for localism tends to fade. Some liberals embrace nothing short of an administrative dictatorship in pursuit of their policy agendas. Last year, a writer in the Atlantic actually called for the creation of a “technocracy” to determine energy, economic and land-use policies throughout the world. This regime would impose such unpopular notions as energy austerity on an already fading middle class, limiting mundane pleasures like cheap air travel, cars, freeways, suburbs and single-family housing.

    Such top-down approaches may gain much favor under Hillary Clinton, a centralizer by nature. Federal regulators would almost certainly nest ever deeper into what was once the realm of local governments in matters of zoning, housing, education and control of neighborhood demographics in ways that will hamper local initiatives and sap grassroots democracy.

    Over time, these efforts may elicit resistance not only among conservatives or libertarians, but also left-leaning professionals who won’t want to cede all control over their local communities to the federal super-state. The next generation of hipster merchants may share an affinity for social liberalism, but they will chafe at increasing regulatory burdens already hampering entrepreneurial growth.

    Despite the powerful economic and political forces behind it, the triumph of Leviathan is not inevitable. There is no compelling reason why the emerging Information Age needs to become an electronic dictatorship controlled by a few players, concentrated overwhelmingly on the coasts. Internet technology,  a gift originally funded by taxpayers, could instead be harnessed to effectively distribute power and authority downward across this vast country to states, regions, towns, neighborhoods and families.

    We need to forge a new path that empowers the grassroots economy and polity, and respects the diversity of contemporary America. We can’t expect that this movement will draw much interest from Washington institutions, which gorge on centralization, but it could be propelled by local communities and people who still believe in the decentralized democracy envisioned by the Founders.

    This piece first appeared in Real Clear Politics.

    Joel Kotkin is executive editor of NewGeography.com. He is the Roger Hobbs Distinguished Fellow in Urban Studies at Chapman University and executive director of the Houston-based Center for Opportunity Urbanism. His newest book, The Human City: Urbanism for the rest of us, will be published in April by Agate. He is also author of The New Class ConflictThe City: A Global History, and The Next Hundred Million: America in 2050. He lives in Orange County, CA.

    City Hall photo by Flickr user OZinOH.

  • California’s Boom Is Poised To Go Bust — And Liberals’ Dream Of Scandinavia On The Pacific

    As its economy started to recover in 2010, progressives began to hail California as a kind of Scandinavia on the Pacific — a place where liberal programs also produce prosperity. The state’s recovery has won plaudits from such respected figures as The American Prospect’s Harold Meyerson and the New York Times’ Paul Krugman.

    Gov. Jerry Brown, in Bill Maher’s assessment, “took a broken state and fixed it.” There’s a political lesson being injected here, as well, as blue organs like The New Yorker describe California as doing far better economically than nasty red-state Texas.

    But if you take a look at long-term economic trends, or drive around the state with your eyes open, the picture is far less convincing. To be sure, since 2010 California’s job growth has outperformed the national average, propelled largely by the tech-driven Bay Area; its 14% employment expansion over the past six years is just a shade below Texas’. But dial back to 2001, and California’s job growth rate is 12%, less than half that of Texas’ 27%. With roughly 10 million fewer residents, Texas has created almost 2.8 million jobs since the turn of the millennium, compared to 2.0 million in California.

    Even in the Bay Area, the picture is less than ideal. Since 2001, total employment in the San Francisco area has grown barely 12% compared to 52% in Austin, 37.8% in Dallas-Ft. Worth, 36.5% in Houston and 31.1% in San Antonio. Los Angeles, by far California’s largest metro area, scratched out pedestrian job growth of 10.3%, slightly above the national increase of 9.3% over that time span.

    Remarkably, despite the recent tech boom, California’s employment growth in science, technology, engineering and mathematics-related fields (aka STEM) since 2001 is just 11%, compared to 25% in Texas. Both Austin and San Antonio have increased their STEM employment faster than the Bay Area while Los Angeles, California’s dominant urban region and one-time tech powerhouse, has achieved virtually no growth. This pattern also holds for the largest high-wage sector in the U.S., business and professional services.

    Geographic Disparity: Relying On Facebook

    “It’s not a California miracle, but really should be called a Silicon Valley miracle,” says Chapman University forecaster Jim Doti. “The rest of the state really isn’t doing well.”

    This dependence on one region has its dangers. Silicon Valley has only recently topped its pre-dot-com boom jobs total, confirming the fundamental volatility of the tech sector. And there are clear signs of slowing, with layoffs increasing earlier in the year and more companies looking for space in less expensive, highly regulated areas.

    Consolidation and dominance by a few giants like Google, Facebook, Apple threaten to make Silicon Valley less competitive and innovative, as promising start-ups are swallowed at an alarming rate. Even Sergei Brin, a co-founder of Google, recently suggested that start-ups would be better off launching somewhere else.

    Housing poses perhaps the most existential threat to the Bay Area, particularly among millennials entering their 30s. Only 13% of San Franciscans could purchase the county’s median home at standard rates and term. For San Mateo, the number is 16%. No surprise that as many as one in three Bay Area residents are now contemplating an exit, according to an opinion poll this past spring.

    Outside the Bay Area, where tech is weaker, the situation is much grimmer. In Orange County, the strongest Southern California economy, tech and information employment is lower today than in 2000. In Los Angeles, employment has declined in higher-wage sectors like tech, durable goods manufacturing and construction, to be replaced by lower-wage jobs in hospitality, health and education. A recent analysis by the Los Angeles Economic Development Corp. predicts this trend will continue for the foreseeable future.

    Expanding Inequality

    Perhaps nothing undermines the narrative of the California “comeback” more than the state’s rising inequality. A recent Pew study found California’s urban areas over-represented among the metro area where the middle class is shrinking most rapidly. California now is home of over 30%  of United States’ welfare recipients, and almost 25% of Californians are in poverty when the cost of living is factored in, the highest rate in the country.

    Even in Silicon Valley, the share of the population in the middle class has dropped from 56% of all households to 45.7%, according to a recent report by the California Budget Center. Both the lower and upper income portions grew significantly; today lower-income residents represent 34.8% of the population compared to 19.5% affluent.

    Such disparities are, if anything, greater in Los Angeles, where high rents and home prices, coupled with meager income growth, is deepening a potentially disastrous social divide. Renters in the L.A. metro area are paying 48% of their monthly income to keep a roof above their heads, one reason why the Los Angeles area is now the poorest big metro area in the country, according to American Community Survey data. Overall California is home to a remarkable 77 of the country’s 297 most “economically challenged” cities, based on levels of poverty and employment, according to a recent study; altogether these cities have a population of more than 12 million.

    One critical sign of failure: As the “boom” has matured, the number of homeless has risen to 115,000, roughly 20% of the national total. They are found not only in infamous encampments such as downtown Los Angeles “skid row” or San Jose’s “the Jungle” but also more traditionally middle class areas as Pacific Palisades and through central parts of Orange County.

    The Fiscal Crisis

    California’s “comeback” has been bolstered by assertions that the state has returned fiscal health. True, California’s short-term budgetary issues have been somewhat relieved, largely due to soaring capital gains from the tech and high end real estate booms; just 5,745 taxpayers earning $5 million or more generated more than $10 billion of income taxes in 2013, or about 19% of the state’s total, according to state officials.

    Most likely this state deficit will balloon once asset inflation deflates. Brown is already forecasting budget deficits as high as $4 billion by the time he leaves office in 2019. The Mercatus Center ranks California 44th out of the 50 states in terms of fiscal condition, 46th in long-run solvency and 47th in terms of cash needed to cover short-run liabilities.

    Despite this, the public employee-dominated state government continues to increase spending, with outlays having grown dramatically since the 2011-12 fiscal year, averaging 7.8% per year growth. No surprise that Moody’s ranked California second from the bottom among the states in its preparedness to withstand the next recession. Brown’s own Department of Finance predicts that a recession of “average magnitude” would cut revenues by $55 billion.

    The Cost Of The Climate Jihad

    Relieved over concerns in the short run budget, the rise in revenues has provided a pretext for Brown to push his campaign to fight climate change to extremes. New legislation backed by the governor would impose more stringent regulations on greenhouse gas emissions, mandating a 40% cut from 1990 levels by 2030.

    Brown has no qualms about the economic impact of his policies since he tends to prioritize one sin — greenhouse gas emissions — even above such things as alleviating poverty. Brown’s moves will, by themselves, have no demonstrable impact on climate change given California’s size, temperate climate and loss of industry, as one recent study found. Brown knows this: he’s counting on setting an example that other states and countries will follow. Perhaps less recognized, California’s efforts to reduce emissions may account for naught, since the industry and people who have moved elsewhere have simply taken their carbon footprint elsewhere, usually to places where climate and less stringent regulation allow for greater emissions.

    California’s climate policies, however, are succeeding in further damaging the middle and working class. Environmental regulations, particularly a virtual ban on suburban homes, are driving housing prices up; mandates for renewables are doing the same for energy prices. This hits hardest at traditionally higher-paying blue-collar employment in housing, manufacturing, warehousing and even agriculture.

    California’s climate agenda has accelerated the state’s continued bifurcation — by region, by race and ethnicity, and even by age. Of course the green non-profit advocacy groups and the media will celebrate California’s comeback as proof that strict regulations and high taxes work. They seem not to recognize that that human societies also need to be sustainable, something that California’s trajectory certainly seems unlikely to accomplish.

    This piece first appeared in Forbes.

    Joel Kotkin is executive editor of NewGeography.com. He is the Roger Hobbs Distinguished Fellow in Urban Studies at Chapman University and executive director of the Houston-based Center for Opportunity Urbanism. His newest book, The Human City: Urbanism for the rest of us, will be published in April by Agate. He is also author of The New Class ConflictThe City: A Global History, and The Next Hundred Million: America in 2050. He lives in Orange County, CA.

    Photo: Troy Holden

  • Cities Need Connectivity in the Global Economy

    My latest column is now online in the September issue of Governing magazine. It’s about the criticality of connectivity to success in the global economy.

    One of the most important ways for cities to get connected is through migration. Jim Russell and his collaborator Richey Piiparinen at Cleveland State University’s Center for Population Dynamics have been documenting how Cleveland has been getting more connected to the global world through this process. This includes foreign immigration but isn’t limited to that. A key part of it is the influx into places like Cleveland of people who have lived in major global cities like New York, then cycled out.

    There are many reasons for this kind of migration, but living costs are certainly one of them. America’s major global urban centers have become extraordinarily expensive to live in. Life in a “microapartment” in New York is less attractive when you are in your 30s and married with kids than it is when you are 22, single and fresh out of college.

    What Rust Belt cities like Cleveland can offer is an authentic urban experience in a genuinely historic place at a price that can’t be beat. No one will mistake it for life in Brooklyn, but these cities’ price/performance ratio has a growing appeal, as their downtown population growth shows.

    Click through to read the whole thing.

    Aaron M. Renn is a senior fellow at the Manhattan Institute, a contributing editor of City Journal, and an economic development columnist for Governing magazine. He focuses on ways to help America’s cities thrive in an ever more complex, competitive, globalized, and diverse twenty-first century. During Renn’s 15-year career in management and technology consulting, he was a partner at Accenture and held several technology strategy roles and directed multimillion-dollar global technology implementations. He has contributed to The Guardian, Forbes.com, and numerous other publications. Renn holds a B.S. from Indiana University, where he coauthored an early social-networking platform in 1991.

    Photo by wzefri

  • Our Town: Restoring Localism

    This is an introduction to a new report from the Center for Opportunity Urbanism, "Our Town: Restoring Localism." Download the full report here.

    America is facing a critical moment in its evolution, one that threatens both its future prosperity and the integrity of its institutions. Over the past several decades, government has become increasingly centralized, with power shifting from local communities to the federal level. This has been accompanied by a decline in non-governmental institutions, a matter of concern to thinkers on both the right and the left.

    The issue here is not the irrelevance or intrinsic evil of government itself, nor is it a debate of liberalism vs conservatism. Rather, it is a question of how to meet society’s primary challenges. Is it most effective to try and solve our myriad problems from a central federal, state or regional authority, or from a more local one?

    We believe the right answer, in many cases, is to make a shift back towards local governing agencies, to neighborhoods, and to families. This change in direction would be a return to the roots of our current federal system, which allows different levels of government to make their own decisions, providing a market- place for various ideas and approaches.

    To be sure, local governments also make mistakes, and they can be authoritarian, corrupt, and short-sighted in meeting the needs of residents. But for the most part, locally generated negatives remain contained to local jurisdictions, and can be fixed through the democratic process at the more accessible local level.

    Download the full report here.

  • The Evolving American Central Business District

    After decades of serious economic decline, the inner cores in many of America’s largest metropolitan areas have experienced much improvement in recent years. This is indicated by the “City Sector Model,” (Image 9) which we developed to analyze the largest cities (metropolitan areas) using small functional areas, ZIP Code calculation areas (ZCTAs). The 2015 update to the City Sector Model added a fifth broad category of urbanization, when the Urban Core was divided into the Urban Core: CBD, and the Urban Core: Inner Ring (hereinafter referred to as CBD and Inner Ring).

    The CBDs have far higher densities of employment and population than the surrounding Inner Rings that surround them. The largest CBDs are nearly all products of the pre-World War II period, when metropolitan employment was more concentrated. Overall both the CBD and the Inner Ring are more similar than not, with higher densities than the suburban and exurban sectors and with greater use of transit, walking and bicycles in commuting. In contrast, the suburban and exurban areas have near universal use of automobiles.

    This article includes analysis of the Urban Core: CBD (CBD) using the latest data from the American Community Survey for 2010 to 2014 (Note 1), with a middle year of 2012. The defining feature of the CBD is high employment densities. The City Sector Model uses employment densities of 20,000 and greater for designation of the CBDs. There are other dense employment centers in metropolitan areas, such as the “edge cities,” but they tend to be characterized by less concentrated development with their buildings, including high-rises, separated by green spaces and parking lots (Image 1). CBDs, on the other hand, typically have their high-rise buildings adjacent to street oriented sidewalks, with less space between the buildings (Image 2).


    Population Trends

    Since 2000, the CBDs have added approximately nine percent to their population. The CBD population growth rate largely tracked the overall metropolitan area growth rate. Critically, these remain a very small part of the urban population. Some 1.3 percent of the metropolitan population lived in the CBD in 2000, a figure that remained virtually the same in 2012.

    This growth rate, however, was not sustained throughout the Urban Core, which includes the much larger Inner Ring. The Inner Ring, which includes 91 percent of the Urban Core population, grew only 0.3 percent. The much larger Inner Ring drops the Urban Core growth rate down to only 0.9 percent, far below the 9 percent in the CBD component.  The other functional sectors grew faster, from two percent in the Earlier Suburbs to 39 percent in the Later Suburbs.

    Becoming More Residential

    Historically largely business districts, CBDs are becoming much more residential. Old, largely abandoned commercial buildings have been converted to new apartments and condominiums. In some places, there is new residential construction. There are new restaurants and other amenities that are associated with vibrant residential areas. There is more of a look of prosperity.

    Indeed, it may be surprising, given these developments that CBDs have not grown more. The net effect is that of the nearly 20 million new major metropolitan area residents added since 2000, less than 0.1 percent have been in the CBDs. However, as some people have moved in, others have moved out (Note 2).

    The growth in CBD population has been dominated by higher income ethnicities (Image 3). While the CBDs were adding 175,000 residents, the growth in Asian and White-Non-Hispanic residents was 215,000. African-American population declined more than 50,000, while Hispanic population edged up less than 10,000.

    Astoundingly, the CBDs, with barely one percent of the population, have attracted 32 percent of the major metropolitan White-Non-Hispanic growth. The 135,000 growth in White-Non-Hispanics compared to their slow, overall growth of 435,000. The share of the population growth among African-Americans, Asians and Hispanics in the CBDs has been far less (Image 4).

    Trends in the Inner Ring have been much different. There has been an exodus of approximately 600,000 of both white non-Hispanics and African-Americans. This has been somewhat more than offset by increases in the Asian and Hispanic population. Since 2000, Inner Ring has gained approximately 150,000 residents, somewhat less than the 175,000 gain in the CBDs (Image 5).

    The CBD Employment Market

    Another defining feature of CBDs is a huge imbalance between employed residents and jobs. The most recent data indicates that the CBD boasts  nearly six jobs for every employed resident. Elsewhere in the metropolitan areas there was a much closer balance between jobs and resident workers (Image 6).

    This huge excess of jobs provides a rich employment market for residents. This and the growth in higher income ethnicities have combined to make the CBDs the most affluent sector in the major metropolitan areas by 2012, at nearly $77.300. This compares to the overall median household income of $64,800, the second ranking $74,900 in the Later Suburbs and the $51,600 in the Inner Ring. The median household income in the Inner Ring was by far the lowest (Image 7).

    Overall, as we speak about the core, the lower incomes of the Inner Ring dwarf the higher incomes in the CBD. Overall, the Urban Core (including the CBD and Inner Ring) median household income is $54,400, approximately 30 percent below that of the CBD (Image 8), and well below incomes in the suburbs, exurbs and metropolitan area as a whole.

    Assessing CBD Progress

    The CBDs have made significant progress. This is an important development because they, like other sectors of the city, best play their part as vibrant and healthy areas, rather than the depressed places that they used to be. They have attracted many younger people (Millennial age).

    In context, however, the progress in the CBD has been more symbolic than substantive. The CBD is not a model for what the rest of the metropolitan area. It cannot be. Metropolitan areas are labor markets. This means that they have a jobs to resident worker ratio of approximately 1.0. By definition, labor markets cannot have six times as many jobs as employees. Even with their impressive attraction of younger people, more than 97 percent of Millennial population growth since 2000 has been outside the CBDs.

    CBD population growth has been impressive, but small in relation to the metropolitan area. When combined with the much larger urban core component, the Inner Ring, its income advantage and demographic dynamism fades. Reviving the CBDs is a good thing. But the much larger Inner Ring needs revival as well.

    The bottom line:  the city is better off when all of its component parts are healthy, from the core to the exurbs.

    Note 1: This is the latest available data for small areas and was collected from 2010 to 2014. Thus, approximately one-fifth of the data was collected in each of the five years. For convenience, this article refers to the data as being reflective of 2012 (the middle year).

    Note 2: The ethnic analysis is based on one-race and Hispanic data. This represents 98 percent of the major metropolitan area population.

    Wendell Cox is principal of Demographia, an international public policy and demographics firm. He is a Senior Fellow of the Center for Opportunity Urbanism (US), Senior Fellow for Housing Affordability and Municipal Policy for the Frontier Centre for Public Policy (Canada), and a member of the Board of Advisors of the Center for Demographics and Policy at Chapman University (California). He is co-author of the "Demographia International Housing Affordability Survey" and author of "Demographia World Urban Areas" and "War on the Dream: How Anti-Sprawl Policy Threatens the Quality of Life." He was appointed to three terms on the Los Angeles County Transportation Commission, where he served with the leading city and county leadership as the only non-elected member. He served as a visiting professor at the Conservatoire National des Arts et Metiers, a national university in Paris.

    Photo: Kansas City CBD (by author)

  • What the Blues Brothers and Ferris Bueller’s Day Off Tell Us About Gentrification

    The Blues Brothers and Ferris Bueller’s Day Off are two of the seminal films set in Chicago. Indeed, Chicago itself is a character in both films.

    The films are radically different even though released only six years apart. There are many ways to slice this. Some have said that one is the South Side movie (The Blues Brothers) and the other the North Side movie (Ferris Bueller). Some see one as more urban, one more suburban.

    One other way to look at it is to see how the films portray an urban transition in progress. The Blues Brothers is a look backward at a fading industrial, working class metropolis.  Ferris Bueller looks forward to an upscale, gentrified city.

    I explore the parallels and contrasts in my new article in the Summer issue of City Journal, “Gentrification on the Big Screen“:

    Florida might regard some of Ferris Bueller’s traditional settings for diversion—the Art Institute and Chez Quis, a fictional fancy French restaurant—as stodgy relics from the city’s older, pre–knowledge economy era. But the scene in which Ferris bluffs his way into Chez Quis for lunch, claiming to be Abe Froman, “Sausage King of Chicago,” is perhaps the most revealing one in the film—and it marks another contrast with The Blues Brothers, in which a French restaurant also figures prominently. In the earlier movie, when Jake and Elwood show up at the legendary Chez Paul, they behave boorishly on purpose, to compel a former bandmate now working a legit job as the maître d’ to quit and rejoin them. By contrast, when Ferris and friends crash Chez Quis, they foreshadow a changing of the social guard. The hip young friends are destined to become Chicago’s new proprietors. They will soon be remolding the city, and its restaurants, in their own image. Chez Paul closed in 1995. Today, the city’s highest-end restaurants—like Alinea, a sleek, uber-hip purveyor of innovative cuisine—represent the culmination of this transition. A 48-year-old Ferris might well be eating at Alinea today.

    Watching these films today, viewers under the age of, say, 45 would be struck by how alien Jake and Elwood’s Chicago seems and how familiar Ferris’s Chicago has become. The vibrant working-class culture, tough old nuns, SROs, and Maxwell Street Market of The Blues Brothers have all either disappeared or survive only as shadows of what they once were. With a bit of cultural updating to cars, hairstyles, fashion, music, and phones, however,Ferris Bueller’s Day Off could be remade today, virtually shot for shot. Modern proto-hipsters might well still skip school to visit Wrigley Field, the lakefront, the Sears Tower Skydeck, or the Art Institute. Three decades after Ferris Bueller played hooky from the suburbs, the triumph of the gentrified city is complete.

    Click through to read the whole thing.

    Aaron M. Renn is a senior fellow at the Manhattan Institute, a contributing editor of City Journal, and an economic development columnist for Governing magazine. He focuses on ways to help America’s cities thrive in an ever more complex, competitive, globalized, and diverse twenty-first century. During Renn’s 15-year career in management and technology consulting, he was a partner at Accenture and held several technology strategy roles and directed multimillion-dollar global technology implementations. He has contributed to The Guardian, Forbes.com, and numerous other publications. Renn holds a B.S. from Indiana University, where he coauthored an early social-networking platform in 1991.

    Photo: Aretha Franklin singing in a diner in The Blues Brothers. Image via City Journal

  • Is it Time for MagLev?

    Maryland officials have announced that a proposal to build a maglev line from Washington to Baltimore has received a commitment for the feasibility study of $2 million from Japanese government. This is in addition to a much larger involvement by the Japanese government, which would include a $5 billion commitment from the government Japan Bank for International Cooperation. The private Central Japan Railway Company has also agreed to waive any licensing fees for using its maglev technology.

    The loan would finance one-half of the “somewhat north of “$10 billion cost, as characterized by Northeast Maglev, the developer of the proposed system.

    Surely that is a far better alternative than digging deeper into U.S. taxpayer pockets if combined with sufficient private investment. Otherwise any such system could require huge federal grants, or low interest loans through the Federal Railroad Administration Railroad Rehabilitation and Improvement (RRIF) loan guarantee program.  An RRIF loan could potentially expose taxpayers to a 100% loss, should the maglev system fail to pay for its capital and operating costs, as occurred with what the Washington Post characterized as the “Solyndra Scandal,” which cost taxpayers more than half a billion dollars due to a federal loan guarantee.

    The history of private investment in high speed rail around the world is considerably less than encouraging in this regard.

    What is Maglev?

    Maglev is magnetic levitation, a process by which magnetic forces are used to elevate and propel trains, without friction, at very high speed. The technology has long been favored by futurists and some transport professionals, but there is only one high-speed system in operation (Shanghai). That line has only been partially completed and the rest of the line has been suspended.

    “North of” Cost Estimates

    The evidence seems to be that the costs of maglev are “north of” high speed rail costs. This is of particular concern for taxpayers, since only two high speed rail lines of the many built in the world have “broken even.” There are recent reports that a third, Shanghai to Beijing is now making a profit Generally large rail project costs have been notoriously underestimated, as the Oxford University work led by Professor Bent Flyvbjerg has shown.

    As a result, there is always the risk that a venture proposed as commercial could run out of money during the construction phase, or generate insufficient revenues to its operating and capital costs. In either case, government subsidies would likely be sought by the operator.

     “North of” cost projections, such as suggested by Northeast Maglev, seem to be the rule in high speed rail, given that original cost projections for similar projects have been so routinely unreliable.

    The current $10 billion estimate for the Washington to Baltimore line is already well north of an earlier $8 billion estimate.

    The currently under construction Tokyo to Nagoya and later Osaka (Chuo Shinkansen maglev) has a construction cost in excess of ¥9 trillion (approximately $90 million). With 90 percent of the Tokyo to Nagoya section underground or in tunnels, cost escalation seems likely.

    Similarly, the cost of the California high-speed rail line, in its original full he high-speed configuration from Los Angeles San Francisco tripled (inflation adjusted)  to well “north of” its 1999 cost projection made. Officials cut the system back from full high-speed rail operation in the Los Angeles and San Francisco areas to reduce costs to a more politically acceptable level.

    High Speed Maglev: The One Partial Line

    Currently, the only partial high-speed maglev line in the world takes passengers only two-thirds of the way from its Pudong International Airport terminus to central Shanghai.

    It was planned to extend the Shanghai maglev line to the center and eventually to Hangzhou, an urban area of 7.6 million residents approximately 180 kilometers (110 miles) to the southwest. However, those extensions have been suspended and high-speed rail service is now available to Hangzhou.

    The developers of the Shanghai maglev hoped that China would adopt the technology for its high-speed intercity rail system. China, however, opted for conventional high-speed rail technology and will soon be operating at speeds of up to 350 kilometers per hour (220 miles per hour), the fastest in the world. The train sets are already operating in Manchuria.

    A Real Head Scratcher

    Significantly, the long and disappointing startup pains of maglev may be coming to an end.

    The Central Japan Railway has begun building the Tokyo to Nagoya and eventually Osaka Chuo Shinkansen maglev line. The currently planned completion date for the Nagoya section is 2027, with a package of financial incentives worth and a ¥3 trillion loan from the Japanese government intended to advance the completion date for the new going to Osaka section from 2045 to 2037. Thus, Japanese taxpayers are already potentially “on the hook” financially.

    There’s an element of the bizarre here.  How much additional transport infrastructure is required in the nation that is losing population at a faster rate than anywhere else in the world? By the earliest date the Osaka extension opens (2037), Japan’s population will have fallen 14 million (more than 10 percent) from today, according to projections of the National Institute for Population and Social Security Research. A quarter of a century later (2062), the population will have dropped another 27 million, to 85 million. That is 10 million fewer people than the 95 million who lived in Japan when the first high speed rail line opened just before the 1964 Olympics. In 2089, Japan is projected to have only 58 million people, fewer than almost 170 years (Figure).

    One economic development report noted that the line would “help alleviate the population overcrowding concentration in the Tokyo metropolitan area. Yet, by 2110, the entire country is projected to have not many more people than the Tokyo metropolitan region today.  

    The Chuo Shinkansen maglev is a part of Prime Minister Abe’s financial stimulus program, which has both supporters and critics. The government talks of the economic development the line will induce. Others, such as Edwin Merner of Atlantis Investment Research called the maglev line a misallocation of resources and that passenger demand will be limited.

    The line has also been justified as a means to promote tourism. Yet, the average tourist may find the scenery — much of it very appealing — from the above ground 1 hour 40 minute ride to Nagoya or the 2 hour 30 minute to Osaka on the conventional high speed rail line more satisfying  (such as Mount Fuji) than the hundreds of miles of tunnel on the faster maglev line (Photo).


    By Alpsdake (Own work) [CC BY-SA 3.0], via Wikimedia Commons

    Protecting US and Northeastern Taxpayers

    But, back to the Washington to Baltimore maglev line. A privately financed and commercially viable maglev line would improve transportation in both the Washington to Baltimore corridor and the extension to New York. However, taxpayers need guarantees to ensure that they are not left “holding the bag.”

    For example, before any permits for proceeding are issued, the investors should be required to post a bond to ensure that the private funding will be sufficient to complete the system, thus avoiding public subsidy. Further, a performance bond should guarantee that no operating subsidies are required for at least a minimum number of years (perhaps 10 or 25).

    A Chance for Success?

    With sufficient taxpayer safeguards, there may be a chance for it to succeed. And surely, we wish Japan, the Japan Bank for International Development, the Central of Japan Railway and Northeast Maglev the best, hoping that they can provide a fully commercial venture. On the other hand, like Ford’s “Nucleon” nuclear powered automobile (proposed in the 1950s), the time for maglev may never come.

    Wendell Cox is principal of Demographia, an international public policy and demographics firm. He is a Senior Fellow of the Center for Opportunity Urbanism (US), Senior Fellow for Housing Affordability and Municipal Policy for the Frontier Centre for Public Policy (Canada), and a member of the Board of Advisors of the Center for Demographics and Policy at Chapman University (California). He is co-author of the "Demographia International Housing Affordability Survey" and author of "Demographia World Urban Areas" and "War on the Dream: How Anti-Sprawl Policy Threatens the Quality of Life." He was appointed to three terms on the Los Angeles County Transportation Commission, where he served with the leading city and county leadership as the only non-elected member. He served as a visiting professor at the Conservatoire National des Arts et Metiers, a national university in Paris.

    Lead photo: Chuo Shinkansen maglev by Saruno HirobanoOwn work, CC BY-SA 3.0, https://commons.wikimedia.org/w/index.php?curid=30917648

  • The Future of Mobility

    I was walking home from downtown San Francisco and passed through the South of Market neighborhood. The area is full of tech company offices like Twitter, Uber, and Airbnb. I saw this minivan advertising, “Low Cost Commuting” and “Ride Share” with the Enterprise Rent-A-Car logo and thought hmmmmm.


    Screen Shot 2016-08-10 at 12.04.43 PM

    Screen Shot 2016-08-10 at 12.03.43 PM

    As I got closer to home in the Mission District I saw this guy signing people up with coupons for free introductory rides. Evidently Enterprise is diversifying its business model. I asked Jim Kumon of the Incremental Development Alliance  about ride share programs and he had this to say.

    “Enterprise has neighborhood locations. Because those locations are not in airports, they don’t get hit with all the extra fees that go with ports, so its dirt cheap. Since they have the room to store extra vehicles and they are geographically dispersed in the right places a shared driver carpool can work. Definitely a major tool to make good-enough-urbanism work for post 1970s neighborhoods or hyper dense places where you can functionally have a pickup game in a car every day.”

    Screen Shot 2016-08-13 at 6.49.32 PMScreen Shot 2016-08-13 at 6.48.12 PM

    Back in June I was in Detroit at a strongtowns.org event where I was asked to debate the impact of autonomous vehicles. I predicted that rather than each driver being chauffeured around in a private computer controlled car this new technology would be pressed into service as a form of hybrid mass transit similar to UberPool. Here’s a more complete explanation from a previous blog post.

    unnamed-17UTA

    I started asking around and was informed by transportation engineer Jon Larsen in Salt Lake City that the Utah Transit Authority has been providing precisely this kind of commuter service for the past fifteen years as part of UTA’s Vanpool program. “[The vans] are owned by UTA, who pays for fuel, maintenance, repairs, etc, and the riders split a per-mile cost. The driver keeps the van at their house. I’ve got a neighbor with a long commute who’s a driver, and he loves it.” There is no central authority that determines the routes or times. The UTA simply provides the equipment and lets riders form their own agendas.
    .

    Salt Lake is a predominantly suburban city where traditional rail and bus transit simply doesn’t work well in many peripheral locations. Self organizing commuter vans achieve all the goals of transit (reduction of highway traffic, cost savings for passengers, minimized fuel consumption, environmental benefits, etc,) in a way that works in a suburban region. The graph above shows that Salt Lake is gradually evolving into a city of resurgent urban neighborhoods that enjoy an excellent light rail system while suburban areas are increasingly accommodated by shared commuter vans. In contrast, city buses are losing market share on both fronts.
    .

    Tech companies may eventually refine this kind of operation with all sorts of bells and whistles, but the folks in Utah demonstrate that nothing more complex than a fleet of existing vehicles, plain vanilla drivers, and a bit of pragmatic self selecting bottom up organization can do all the heavy lifting.

    Over the last sixty years we’ve built so much dispersed horizontal development that we’re going to have to continue inhabiting it for a very long time – come what may. Expensive and unwieldy mass transit systems have never worked outside of well established urban centers and their nearby satellite towns. Decentralized, flexible, low tech, and affordable work-arounds just make more sense even if they aren’t as sexy as an Elon Musk electric autonomous vehicle or a bullet train.

    Screen Shot 2016-08-14 at 3.06.48 AM

    Screen Shot 2016-08-14 at 3.04.56 AM

    Screen Shot 2016-08-14 at 3.07.52 AM

    Screen Shot 2016-08-14 at 3.04.41 AM

    Screen Shot 2016-08-14 at 3.05.15 AM

    Screen Shot 2016-08-14 at 3.09.40 AM

    Screen Shot 2016-08-14 at 3.06.37 AM

    Screen Shot 2016-08-14 at 3.07.24 AM

    One more thing… You will recall that I walked from downtown back home on my journey that uncovered the Enterprise Ride Share plan. My route was just over three miles. In a place like San Francisco it’s actually a pleasure to be on foot and get around with no more advanced technology than shoe leather. We could just build more places like this. Just sayin’.

    John Sanphillippo lives in San Francisco and blogs about urbanism, adaptation, and resilience at granolashotgun.com. He’s a member of the Congress for New Urbanism, films videos for faircompanies.com, and is a regular contributor to Strongtowns.org. He earns his living by buying, renovating, and renting undervalued properties in places that have good long term prospects. He is a graduate of Rutgers University.