Category: Urban Issues

  • The Evolving Urban Form: Detroit

    Probably no city in the high income world evokes impressions of urban decline more than Detroit — and for good reason. The core city of Detroit has lost more of its population than any developed world city of more than 500,000 since 1950. The city’s population peaked at 1,850,000 residents in 1950 and at its decline rate since 2010 could drop below 650,000 residents by 2020 census.

    It was not always this way. During the first half of the 20th century Detroit was one of the fastest-growing core cities in the United States. Among the 20 largest core cities in 1950, only Los Angeles grew faster, percentage wise, than Detroit. The city of Los Angeles grew from 102,000 in 1900 to 1,970,000 in 1950. The city of Detroit almost matched that, growing from 286,000 to 1,850,000.

    The city’s nearly 1.6 million population increase exceeded that of all other US municipalities except Los Angeles, Chicago and New York, which grew at an unprecedented pace over the period, adding more than 4.5 million residents.

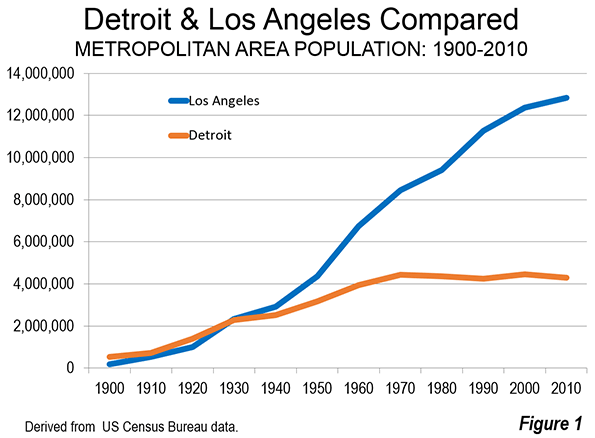
    The current defined area of the Detroit metropolitan area grew by 1950 to nearly 6 times its 1900 population, to 3,170,000 from 530,000. The growth of the metropolitan area from 1900 to 1940 closely tracked that of the fast growing Los Angeles metropolitan area, which widened its lead substantially through the end of the century (Figure 1). The Los Angeles area, which was only slightly larger than the Detroit area in 1940 reached a population of more than three times that of Detroit by 2010

    The city of Detroit began to lose population after 1950. It lost 180,000 people between 1950 and 1960 and   approximately 155,000 between 1960 and 1970. The 1970s were a particularly bad time for the many large core cities, and Detroit lost more than 300,000 people, or 20% of its population by 1980. But if Detroit was exceptional, it was not alone; virtually all large US core cities that did not annex territory between 1950 and 1980 lost population.

    In fact, Detroit’s loss was not even the worst. During the 1970s, the city of St. Louis lost 27% of its population, dropping to little more than half its 1950 size, from 857,000 to 452,000. At this point and through 2010, St. Louis had the less than enviable record of the largest population loss for a major high income world municipality. As of 2010, the city of St. Louis had lost 62.8% of its population, more than the city of Detroit’s 61.6% (Figure 2).

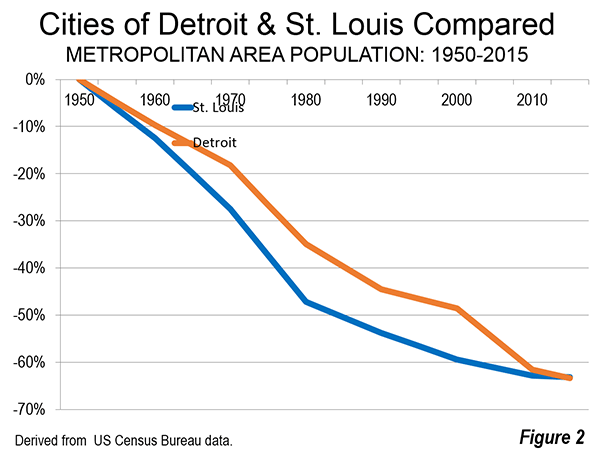
    But things were about to change. Between 2010 and 2015 the decline rate in both cities was moderated. But city of Detroit’s loss was large enough to wrest away the title for the largest decline from the city of St. Louis. According to the US Census Bureau’s 2015 estimates, Detroit has lost 63.3% of its population since 1950 while St. Louis lost somewhat less, at 63.1%.

    Having spent considerable time in both cities, however, one does not get the same sense of urban devastation in St. Louis as in Detroit. The urban decline of city of St. Louis has been far more graceful than the city of Detroit. A long-time Detroit and St. Louis resident and commentator writing in the St. Louis Beaconcalled the differences “quite striking,” noting that Detroit’s devastation was far wider spread and that neighborhoods continue to thrive in large parts of the city of St. Louis.

    Obviously, Detroit has faced huge challenges and probably greater challenges than St. Louis or the Rust Belt cities of Pittsburgh, Cleveland and Buffalo. Indeed, one of Pittsburgh’s strengths is its strong civic community downtown, with its large banks, its still strong neighborhoods and striking physical location. One of Detroit’s banks moved its headquarters to Dallas.

    Figure 3 graphically illustrates the population trends in the Detroit metropolitan area since 1950. The city of Detroit’s massive loss is indicated by the first bar for each year. But despite the city’s losses between 1950 and 1970, totaling more than 340,000 residents, the balance of Wayne county (of which Detroit is the county seat) nearly doubled in population, from 585,000 to 1,150,000. However, since that time, suburban Wayne County (outside the city of Detroit) has stagnated downward to 1,088,000 residents (Figure 3).

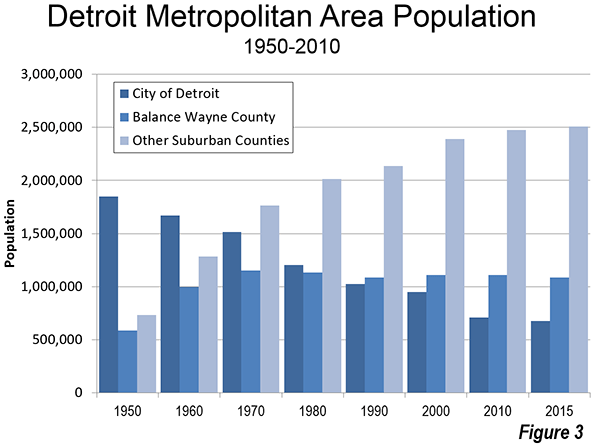
    The other suburban counties have done far better. The largest of these are Oakland County to the northwest of the city and Macomb County, which is straight north from downtown. Since 1950, Oakland County has grown from 400,000 residents to nearly 1.25 million in 2015. Macomb County, famous for the “Reagan Democrat” blue-collar worker vote, grew from 190,000 in 1950 to 860,000 in 2015. The smaller counties of Lapeer, Livingston and St. Clair also expanded strongly. Overall, the suburbs outside Wayne County grew by 240%, from 735,000 in 1950 to more than 2.5 million in 2015.

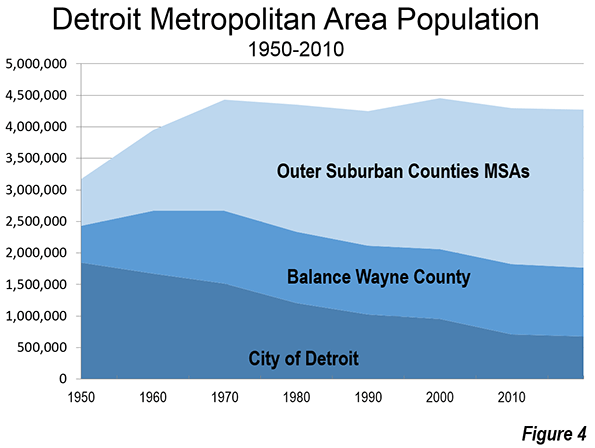
    Early on, the metropolitan area continued to add people strongly. Between 1950 and 1970, the metropolitan population rose by 40%, to more than 4.3 million. The population dropped in both the 1980 and 1990 censuses. But in 2000, a new peak of 4.45 million was reached. The metropolitan area losses resumed with lower figures indicated for the 2010 census and in the 2015 estimates (4.275 million). The "ups and downs" of the metropolitan population are illustrated in Figure 4.

    Given my own experience, the decline of Detroit is particularly surprising. As a consultant to Oakland County Executive Daniel T. Murphy between 1985 and 1990, I had the pleasure of witnessing firsthand cooperative efforts between the suburban leadership and the city of Detroit (under then Mayor Coleman Young) on transportation issues. Murphy and Young had established a regional cooperative process referred to as the "Big Four" along with Wayne County Executive Bill Lucas and then Wayne County Executive Edward H McNamara (and current Detroit mayor Mike Duggan, who was Deputy County Executive), along with the leadership of the Macomb County Commission. It was clear to me that there was a very real commitment on the part of all four to deal with the pressing problems of the area.

    The good news is that there are signs of a turnaround in Detroit. I doubt we will ever see Detroit return to a its peak population of 1.85 million or even 1 million. Even the lower figure would require a reversal unprecedented in developed world urban history, made far more unlikely by the slow population growth of the Upper Midwest and laggard fertility rates nationally. (Note). But, for the first time in decades, there are signs of hope out of the city and its leadership. Good luck, city of Detroit and Mayor Duggan.

    Note: See Wendell Cox, “International Shrinking Cities, Analysis, Classification and Prospects,” in Harry W. Richardson and Chang Woon Nam, Shrinking Cities: A Global PerspectiveRoutledge, 2014.

    Wendell Cox is principal of Demographia, an international pubilc policy and demographics firm. He is a Senior Fellow of the Center for Opportunity Urbanism (US), Senior Fellow for Housing Affordability and Municipal Policy for the Frontier Centre for Public Policy (Canada), and a member of the Board of Advisors of the Center for Demographics and Policy at Chapman University (California). He is co-author of the “Demographia International Housing Affordability Survey” and author of “Demographia World Urban Areas” and “War on the Dream: How Anti-Sprawl Policy Threatens the Quality of Life.” He was appointed to three terms on the Los Angeles County Transportation Commission, where he served with the leading city and county leadership as the only non-elected member. He served as a visiting professor at the Conservatoire National des Arts et Metiers, a national university in Paris.

    Photo: downtown Detroit

  • The Cruel Information Economy: The U.S. Cities Winning In This Critical Sector

    Arguably the most critical industry in the new economy, information is also often the cruelest. It is the ultimate disruptor of jobs and growth, blessing some regional economies but leaving most in the dust. Overall, the sector accounts for almost 3 million jobs, but it has only added a paltry net 70,000 jobs over the last five years. The overall numbers mask a loss of about 200,000 jobs in newspapers, book publishing, broadcasting and telecommunications, while employment in software publishing, data processing and other tech-driven information jobs has expanded by a modest 240,000 jobs (manufacturing, by comparison, has produced three times that amount in the same period).

    Our rankings for the best cities for information jobs are perhaps the most skewed of any occupational category. With more traditional industries like business services, hospitality and construction, employment tends to rise across all the country’s metropolitan areas, if not at the same pace everywhere. In the case of the information sector, the vast majority of the metropolitan statistical areas for which we have data have lost information jobs since 2010 (204 out of 336 MSAs).

    Yet there are clear winners in the information sweepstakes, with a handful of metro areas that have seized the initiative in the field and run with it.

    Information, particularly its media segment, has shown a strong proclivity to concentrate in a handful of places. Whether it’s a matter of where venture funds are concentrated, or that cross-fertilization and creative flair are driving this, it’s hard to say. But in the emerging digital economy, notes a recent Neiman study, clusters industries in the places where creators of content live. For the most part, as of yet, blue collar metro areas need not apply.

    Info-Age Winners

    Our rankings are based on employment growth in the sector over the short-, medium- and long-term, going back to 2005, and factor in momentum — whether growth is slowing or accelerating. (For a detailed description of our methodology, click here.)

    At the top of our list of the largest metropolitan statistical areas, not surprisingly, is San Francisco-Redwood City-South San Francisco. Since 2010, led by the growth of such companies as TwitterFacebook and Salesforce.com, the metro area’s information employment has expanded 62% to 61,000 jobs. The pace of growth is slowing, to 6.85% last year, but still very healthy.

    Right behind San Francisco is the larger information-based economy of its neighbor Silicon Valley. The San Jose metro area, home to such information economy titans as Google and Netflix, has 76,000 information jobs, up a none-too-shabby 57.4% since 2010; last year its 9.3% job growth rate outstripped even San Francisco. Together these two areas have emerged as the superstars of the information age, and no other large metro is really close in terms of growth.

    Yet the information boom has other epicenters that have emerged over the past decade. Among the large metro areas, Seattle-Bellevue-Everett ranks seventh on our list. It boasts 98,000 information jobs, third most in the country behind much larger New York and Los Angeles. Since 2010 the Puget Sound powerhouse, home to Microsoft, Amazon and a host of start-ups, has seen its information employment expand a healthy 15.3%.

    Seattle’s little brother, Portland-Vancouver-Hillsboro, Ore., ranks eighth. Since 2010 Portland’s information employment has grown over 12% to 25,500 workers.

    Among the very largest of our metro areas, New York has managed fairly impressive growth in its media-dominated information sector, with employment expanding 12.1% since 2010 to 191,000 workers, second in total numbers, and with no sign of growth flagging.

    It’s doing much better than the Big Apple’s two traditional rivals, Chicago and Los Angeles. The Windy City and its environs have expanded information employment by 5% since 2010 to with 73,100 jobs, placing it 19th. Los Angeles follows in 20th place. L.A. is home to the largest information sector in the U.S., with 203,800 workers, but despite its well-established base, much of it in entertainment, it has managed only 3.5% growth since 2010.

    Will Information Jobs Head To The Sun Belt?

    The growth of information employment in large, dense and expensive urban areas, notably New York and San Francisco, has been widely celebrated by advocates of traditional cities. Yet this same pattern also developed in the last tech bubble in the late 1990s, and then reversed as companies collapsed, and many of the survivors moved operations to less expensive regions.

    Could we see a repeat now? High housing costs are putting homeownership out of reach even for fairly affluent families in San Francisco and New York. Already some tech workers are relocating to lower-cost areas. Many more may do so in the future, suggests a recent Beacon Economics study, or resign themselves to being permanent renters.

    This year’s list may show some of the places both tech and information jobs may be headed in the next few years. The clear rising star is Phoenix, which ranks third. The desert city’s information workforce has expanded by 39.29% since 2010, the third highest increase of any metropolitan area, just behind the Bay Area twins. In recent years a growing list of Bay Area firms have expanded into the Valley of the Sun, including DoubleDutch, Gainsight, Uber, Prosper Marketplace, Yelp, Weebly, BoomTown and Shutterfly. Silicon Valley Bank set up shop there five years ago as well.

    Other lower-cost locales are also doing well on our big metro list, including No. 4 Raleigh, N.C., No. 5 Austin-Round Rock, Texas,  and No. 10 Ft. Lauderdale, Fla. All have enjoyed double-digit information job growth since 2010.

    Although information jobs tend to concentrate in bigger metros, there are several smaller metro areas that appear to be on the cusp of becoming key hubs for the industry. The fastest growth over the past five years has been in Provo-Orem, Utah, where information employment has expanded 43.8% to 11,400 jobs. Other fast-rising smaller stars include Flagstaff, Ariz.,  Durham-Chapel Hill, N.C.,  Madison, Wisc., Bend-Redmond, Ore., and Portsmouth, N.H. All these metro areas have enjoyed information job growth of 20% or more since 2010, albeit off small bases.

    The Likely Future of Information Growth

    Clearly information jobs cluster, although they do so in varied kinds of environments. To be sure, the biggest players likely will continue to be in the largest cities, notably in the Bay Area, New York, Seattle and, as long as Hollywood stays strong, Southern California as well. But the high prices in these areas seem to be leading to growth in a host of second-tier cities spread from Florida to Arizona, where tech workers can enjoy a combination of lower home costs and at least some urban amenities.

    Similarly, while most smaller cities may never become information hubs, some clearly will. For the most part these will be either university towns such as Chapel Hill (home to the University of North Carolina), Provo-Orem (Brigham Young) and Madison (University of Wisconsin). Other will be located in amenity-rich, scenic areas like Flagstaff and Bend, Ore., where outdoor-oriented tech workers may find a way to work remotely from the big city hubs.

    But under any foreseeable future, it’s unlikely that information job growth will be strong enough to help in a measurable way the fortunes of most communities. Traditional advantages in terms of taxes, location on rivers or the ocean, or access to cheap energy is simply not enough to lure these jobs to a wide array of locales. Information may be a stellar force in some areas, but it has very picky tastes that preclude it from being as transformative in job creation as it is in our daily lives.

    This piece first appeared at Forbes.

    Joel Kotkin is executive editor of NewGeography.com. He is the Roger Hobbs Distinguished Fellow in Urban Studies at Chapman University and executive director of the Houston-based Center for Opportunity Urbanism. His newest book, The Human City: Urbanism for the rest of us, will be published in April by Agate. He is also author of The New Class ConflictThe City: A Global History, and The Next Hundred Million: America in 2050. He lives in Orange County, CA.

    Michael Shires, Ph.D. is a professor at Pepperdine University School of Public Policy.

  • Cars or Trains: Which Will Win the Commuting Future?

    Infrastructure investment is a hot topic and the focus of that discussion tends to lean towards transport infrastructure over other categories (like energy or water for example). When it comes to transport, trains seem to feature prominently on the wish lists of big investment or ‘nation building’ projects. But how far could billions of dollars in new rail infrastructure actually go in improving congestion across our cities?  Will cars inevitably win? If so, why?

    ‘We need more public transport’ is the silver bullet catch cry often heard in conjunction with debates about congestion in major cities. It has become so common that its validity is rarely tested. Even large scale commuter rail projects like Brisbane’s proposed $5billion (or $8billion – what a few billion amongst friends?) cross river rail can still maintain preferred project status – despite no business case after several years of discussion and now being in the hands of the project’s third state government.

    As technology reshapes the nature of work – and with it where we work – and as Australia faces cities policy with renewed national interest – led primarily by our Prime Minister – it is timely to ask how infrastructure priorities might be shaped by evolving metropolitan form and the fast changing habits of urban inhabitants. Will old ways serve new days? Do we need more passenger rail, or will cars find a new purpose in decongesting our cities and serving a new economic model?

    Some recent figures through Macroplan serve to highlight the role played by rail in urban life. In 2013–14, there were 178.5 billion passenger kilometres travelled on capital city roads in Australia and 12.6 billion passenger kilometres travelled on urban rail networks. I’ve written before that this share is unlikely to change for the simple fact that only around 10% of metropolitan wide jobs are based in central business districts of our major cities. Agreed, it’s an important 10% for public transport because PT best serves a highly centralized workforce as you find in CBDs. Commuter rail in particular relies on a ‘hub and spoke’ model, mainly designed to ferry people from into and out of CBDs.

    For people who work in CBDs, a high proportion will use public transport – rail included. But that’s a high proportion of the 10% minority of people in a metro wide area. Even if every single person who worked in a CBD caught PT, the mode share can never rise very high because around 90% of the workforce work in suburban areas, for which rail is not well suited. There has been a lot of talk about Transit Oriented Development (TODs) particularly around suburban rail nodes but despite decades of discussion, we are yet to see many (any?) genuine examples.

    And the reality is that the economy is fast suburbanizing. New employment engines in sectors like personal services or health and caring are not beneficiaries of industry proximity. Being close to others in the same industry might have been good for finance, property and business service industries in traditional CBDs but the fastest growing sector of our economy at present is health care related, where being close to the people being served is important. This is not the CBD. There is even evidence that technology startups in the US have tended to prefer suburban or high street locations, offering high amenity, ample low cost or free parking, and cheap (or free) premises. Steve Jobs and Steve Wozniak of Apple fame started in a suburban garage after all. And Mark Zuckerberg got started at a desk in his college dorm.

    As this shift of the economy moves from centralized to increasingly decentralized models – aided by new and fast evolving digital technology which makes connectivity over larger geographic areas so much easier – do the foundations of commuter rail feasibility begin to crumble?

    This graph, which shows the dramatic long term decline of the CBD as the dominant employer region in Sydney, could apply equally to other capitals:

    Source: The Polycentric Metropolis – Sydney’s Centres Policy in 2051, Bob Meyer, Director of Planning, COX Richardson Architects and Planners

    This shift is directly related to how public transport versus private has fared over a similar long term scale, as evidenced by this chart:


    Source: Mode share of motorised travel (passenger kms) 1945-2014 for five largest Australian cities, public transport vs private transport (source data: BITRE), taken from Alan Davies writing in Crikey.

    Adding to this shift has been the enabling factor of falling car prices. According to COMMSEC, in 1976 the cost of a new Holden sedan (back then it was Holden or Ford and that was about it) was $4,336 and the average male full time wage was $182 a week – meaning it took 24 weeks income to pay for a new car. Today, the average full time weekly wage is around $1,440 and there are plenty of good quality brand new sedans you can buy for $19,000 on road. In just over three months, you can own one. New cars are fuel efficient, emissions efficient, reliable, technologically enabled and comfortable.

    Rubbing salt into the commuter rail wound is that travel by car – even across larger distances – tends to be quicker than rail. Here’s the picture in Melbourne:


    Source: Average journey to work trip duration by mode and ring, Melbourne (source data: VISTA 2012-13). Taken from Alan Davies in Crikey.

    In Sydney, according to their Household Travel Survey 2013-14, only 13% of car drivers took longer than 45 minutes to get to work, while 79% of train passengers took more than 45 minutes. 

    So, given that commuter rail is best designed to serve an increasing minority of the workforce with jobs in traditional CBDs, how will spending extra billions on commuter rail infrastructure expansion solve congestion? How will it translate into more rail passengers, given the way the economy is changing?

    Is there an alternative?

    For me it’s actually not a case of one or the other. Sensible investment in commuter rail, given the existing investment in rail networks, makes sense provided there’s a valid business case and the alternative options for that investment have been measured.

    It also strikes me that we may have a forgotten the massive sunken investment in metropolitan road networks which do most of the transport work in our cities. Some (not all) of these roads are congested for maybe 4 to 6 hours out of every 24. Our cars which move us around our cities spend maybe only 3 or 4 hours a day going anywhere. For more than 20 out of 24 hours, they are parked.

    Talk about driverless cars is not just about a fictional scene from ‘Total Recall’ – it’s also about computer aided traffic management on a city wide scale. Squeezing more efficiency from the road network and from motor vehicles seems to make a lot of sense. Ride sharing apps like Uber provide an early insight into how disruptive technologies can impact on traditional, cumbersome and market protected transport thinking. There are also car sharing Apps like Goget and more are on their way. Technology is changing the way we do everything, from entertainment to where we work and how we get around. Would it not make sense for cities to be exploring how this wide scale urban economic shift can best served, rather than stubbornly sticking to mantras about public transport systems designed for traditional urban employment models?

    And what about buses? Their great virtue is that they can use the metrowide road networks. It is easy to change a bus route to adapt to demand. You can’t do that with rail. Think how technology might soon morph public transport buses and private transport cars into a hybrid of some sort? Driverless buses are not new. Perth is already about to trial them. This is just a baby step. Think about where this could lead.

    There’s no such thing, in my view, as a bad infrastructure investment. But there’s only so much money to go around. The decisions on infrastructure investment, when it comes to issues like urban economic productivity and reducing congestion, should focus on how to get the best bang for the buck. That can mean thinking more about the future and how patterns of work will shape what we need from transit systems, and working back from that to identify the best solutions.

    Ross Elliott has more than 20 years experience in property and public policy. His past roles have included stints in urban economics, national and state roles with the Property Council, and in destination marketing. He has written extensively on a range of public policy issues centering around urban issues, and continues to maintain his recreational interest in public policy through ongoing contributions such as this or via his monthly blog The Pulse.

    Flickr photo by Curtis Perry: Another perfect day for highway drivers in LA.

  • Luxury Urban Housing, Built on a Myth, Is About to Take a Big Hit

    From steamy Miami to the thriving cores of cities from New York, San Francisco, Houston and Chicago, swank towers, some of them pencil thin and all richly appointed. This surge in the luxury apartment construction has often been seen as validation of the purported massive shift of population, notably of the retired wealthy, to the inner cities. Indeed with the exception of a brief period right after the Great Recession, there was slightly greater growth in core cities than the suburbs and exurbs. It was said that we were in the midst of a massive “return to the city.”

    Yet in reality the movement to the inner core has been much less spectacular than that. Indeed by 2014, growth once again was faster not only in traditional suburbs but also in the exurban areas that were broadly predicted to be the most doomed. At the same time, the fastest city growth, notes economist Jed Kolko, occurred largely in the most “suburbanized” cities, like Phoenix, San Antonio, and San Diego.

    One major meme for the luxury developers had to do with well-off retirees—the one domestic population with the money to afford such housing. Newspapers have been crammed with anecdotal stories about this “trend.” Yet analysis of Census trends among seniors shows that the senior percentage share in both the inner core and older suburbs dropped between 2000 and 2010 while growing substantially in the newer suburbs and exurbs. The most recent data show these patterns continue. Since 2010 the senior population in core cities has risen by 621,000 while the numbers in suburbia have surged by 2.6 million.

    So who’s buying them? It’s wealthy foreign nationals, largely as investments. In many cases these units are not really residences but pieds-a-terres for the world’s wealthy; in some markets, as many as 60 percent of units are not primary residences. But such sales are susceptible to changes in foreign economies. And today, many of these buyers must contend with slowing economies at home.     

    Perhaps most damaging has been the decline in many countries, such as Russia, Brazil, Argentina, Canada and some countries of the Middle East, that have been hit hard by the commodity slowdown. Most critical in many markets, particularly in California, has been the economic slow-down in China, now the largest foreign investor in U.S. real estate. In some markets, like Irvine and in Bay Area suburbs, Chinese investors have accounted for upwards of 30 percent of all buyers.

    Realtors in Southern California, long a favored destination for Asian investors, report a significant slowdown in investment , particularly along the coast. In some developments, roughly half the Chinese buyers paid cash, often well over $1 million per unit. This in markets where barely 10 to 20 percent of the houses are affordable to the median income family.

    Perhaps nowhere in urban America better epitomizes the relationship between foreign capital and high-end real estate than Miami. From 2004 to 2008, Miami enjoyed a massive luxury housing boom, with over 20,000 new units constructed—only to see many go them vacant for years.

    The last five years have seen a resurgence once again. As  fortunes were being minted, foreign money tended to end up invested in Miami’s luxury towers.

    Now this dependence on foreign investment may wreak havoc. Some sources of investment, such as  Russia, are drying up as low oil prices dissipate the wealth of that country’s free-spending oligarchs, and now must cope with sanctions over the annexation of the Crimea. In 2013, Russian buyers accounted for 23 percent of Miami luxury condo buyers; in 2014 they accounted for just 7 percent.

    But in Miami, the big story has been the Latin Americans. Like the Russians, the major Latin American investors have been hard hit by declining oil and other commodity prices. In 2014, luxury developer Gil Gezer thanked Brazilians, for turning around the Miami high-end condo market; now they seem to be driving the market down.  In the fourth quarter of 2015 the number of Miami Beach condo transactions declined nearly 20 percent from a year earlier, while inventory jumped by nearly a third, according to a report from appraisal firm Miller Samuel Inc. The median sales price slipped 6.6 percent. As prices drop and sales slow, more than half a dozen projects have been cancelled.

    South Florida may be the ultimate mecca for luxury developers, but it’s hardly alone in facing a high-end property crash. Over the past decade, New York has been inundated with ultra-expensive high-rise real estate. The new towers have affirmed the city’s fundamental attraction to the ultra rich. In Lower Manhattan, 31 towers with over 5,000 apartments are sprouting up, with a median price for condos of $2.43 million, a 70 per cent increase since 2013. The overall Manhattan condo market has shot up “only” 54% to $1.84 million.

    As in Florida, some of the problem stems from the retreat of foreign investors. Analyst Sami Karan suggests that rather than a massive demographic evidence of a “return to the city” by the ultra-rich, the luxury surge  seems to be mostly a matter of investment strategies that can change more quickly than shifting one’s long-time domicile.

    Not surprising then that some developments are being stalled across Manhattan. Property Markets Group and JDS Development Group, developers of the 111 West 57th Street, a 60-unit tower have announced that the once-imminent sales launch at the 60-unit tower would be pushed back for at least a year. In other cases, once ballyhooed  conversions of office towers to condos—notably the famous “Chippendale” Sony/ATT building located at 550 Madison Avenue—have been shelved, signaling that some well-fed rats may be deserting the luxury yacht before the fall. The city faces what new analysis by the consultancy Miller Samuel could be a glutted luxury market for the next five years.

    But over the past few years, no luxury market has been more over-heated than San Francisco. As occurred in the 1990s, the city’s luxury market has ridden the current tech bubble to unprecedented heights—in the process creating what may be one of the most severe real estate bubbles in the country. In the city proper, the median value of homes has skyrocketed, from $670,000 at the beginning of 2012 to $1.12 million today, a gain of more than 67 percent, according to Zillow.com.

    Now there  are signs that this boom is about to slow. This stems from two factors—the inability of consumers to afford this housing and the gradual slowdown of the tech bubble. The 87 tech IPOs over the past two years are trading 80 percent below their IPO price, and not surprisingly, venture capitalists are become more wary. Many key firms—Twitter, Hewlett Packard, Yahoo—are all laying workers off.

    All this suggests that, as in Miami and New York, San Francisco property owners face stagnant or even declining prices. The market could be further weakened as  tech workers and  companies head to more affordable markets  elsewhere. 

    Right now the decline in the luxury market has not yet turned into a full-on crash in multi-family housing. But there are some worrisome warning signs, such as rising apartment vacancy rates. Already some markets, such as Houston, seem to be overbuilt, particulary given weakness in the area’s critical energy sector. Other urban cores  threatened by overbuilding include such disparate cities as Indianapolis, Raleigh-Durham, Denver and Atlanta. According to the consultancy firm Costar, vacancies in downtown areas are  reaching double digits in such attractive markets as Boston, Charlotte and Philadelphia.

    In some areas like San Francisco and New York, a rollback of multi-family prices could be beneficial, because high prices are driving young, educated people out to other regions. Since 2010 educated millennials have been headed increasingly to more affordable regions such as Nashville, Orlando, New Orleans, Houston, Dallas-Fort Worth, Pittsburgh, and Columbus. Even Cleveland and California’s exurban Inland Empire, which still has relatively reasonable housing prices, at least by California standards, aregrowing their millennial workforces faster than places like New York or San Francisco.

    Young people may also benefit as units shift  from condo to rental.  Of course, the weakening market won’t be too good for the investors, developers and landlords, many of whom embraced the “back to the city” mantra with religious zeal and now will have to confront demographic reality.

    But other trends suggest that this decline may be more painful than many suspect. We may be entering a phase where we have reached  “peak urban millennials” as they head into their 30s, get  married and move  to the suburbs.  The idea that investing in the urban core, and in luxurious density, guarantees a happy result has now lapsed into mythology. It needs to be replaced with something that more accurately effects not what developers hope (or planners decree) but what people need, and can afford.

    This piece originally appeared at The Daily Beast.

    Joel Kotkin is executive editor of NewGeography.com. He is the Roger Hobbs Distinguished Fellow in Urban Studies at Chapman University and executive director of the Houston-based Center for Opportunity Urbanism. His newest book, The Human City: Urbanism for the rest of us, will be published in April by Agate. He is also author of The New Class ConflictThe City: A Global History, and The Next Hundred Million: America in 2050. He lives in Orange County, CA.

    Wendell Cox is principal of Demographia, an international pubilc policy and demographics firm. He is a Senior Fellow of the Center for Opportunity Urbanism (US), Senior Fellow for Housing Affordability and Municipal Policy for the Frontier Centre for Public Policy (Canada), and a member of the Board of Advisors of the Center for Demographics and Policy at Chapman University (California). He is co-author of the “Demographia International Housing Affordability Survey” and author of “Demographia World Urban Areas” and “War on the Dream: How Anti-Sprawl Policy Threatens the Quality of Life.” He was appointed to three terms on the Los Angeles County Transportation Commission, where he served with the leading city and county leadership as the only non-elected member. He served as a visiting professor at the Conservatoire National des Arts et Metiers, a national university in Paris.

    Photo by Marc Averette (Own work) [CC BY 3.0], via Wikimedia Commons

  • Finally! Great New Affordable Bay Area Housing!

    These are highly educated well paid workers at a San Francisco tech company. They’re mostly young. Some are single. Some are newly coupled. Some are married with young children. There are exceptions, but they tend to want to live in a vibrant urban neighborhood with a short commute rather than a distant suburb.


    Screen Shot 2016-05-27 at 11.08.39 PM

    Screen Shot 2016-05-27 at 11.07.30 PM

    Screen Shot 2016-05-27 at 11.08.07 PM

    Screen Shot 2016-05-27 at 10.51.05 PM

    Screen Shot 2016-05-28 at 1.45.52 AM

    Screen Shot 2016-05-28 at 1.46.17 AM

    Screen Shot 2016-05-28 at 12.17.05 AM

    Some enjoy living in a rented apartment above a trendy wine bar right on the edge of the downtown core. They can effortlessly pop down for a drink or a bite to eat with friends. When the weather is good they can ride a bicycle to work and skip the traffic congestion for a healthy commute.

    Screen Shot 2016-05-28 at 1.42.07 AM

    Screen Shot 2016-05-27 at 10.51.21 PM

    Screen Shot 2016-05-28 at 12.01.20 AM

    Screen Shot 2016-05-28 at 12.15.42 AM

    Others choose to own a loft style condo above shops. They can step outside their door and immediately find good food, good company, clothes, groceries, a hairdresser… most daily needs are close at hand.

    Screen Shot 2016-05-27 at 11.47.16 PM

    Screen Shot 2016-05-27 at 11.49.00 PM

    Screen Shot 2016-05-27 at 11.48.28 PM

    Screen Shot 2016-05-27 at 11.48.44 PM

    Screen Shot 2016-05-27 at 11.51.15 PM

    Still others love a little detached cottage in a courtyard with shared garden space. This arrangement provides all the benefits of a traditional home on a smaller scale.

    Screen Shot 2016-05-27 at 11.47.41 PM

    Screen Shot 2016-05-27 at 10.58.08 PM

    Screen Shot 2016-05-27 at 10.58.38 PM

    Screen Shot 2016-05-27 at 10.58.24 PM

    Then there are those who gravitate toward a regular stand alone single family home – of various styles, sizes, and price points.

    IMG_0794 (1024x694)

    Screen Shot 2016-05-27 at 10.59.59 PM

    Screen Shot 2016-05-28 at 1.44.50 AM

    Screen Shot 2016-05-28 at 12.06.05 AM

    Screen Shot 2016-05-27 at 10.56.40 PM

    Screen Shot 2016-05-27 at 10.52.34 PM

    In this new development all of these options are available on a single block just a ten minute bike ride from downtown. This is exactly what San Franciscans desperately want and someone has finally figured out how to build it at a price people can afford…

    Screen Shot 2016-05-28 at 12.16.10 AM

    Screen Shot 2016-05-28 at 2.17.00 AM

    Screen Shot 2016-05-28 at 2.21.31 AM

    Screen Shot 2016-05-28 at 2.21.04 AM

    Screen Shot 2016-05-28 at 2.20.38 AM

    Screen Shot 2016-05-28 at 2.20.21 AM

    …in Nashville. Uber, Lyft, Eventbright, and many other tech companies that began in San Francisco have all opened branch offices in Nashville. The standard offer is simple. Relocate to Tennessee, take a 30% pay cut, and enjoy a much higher quality of life with much more cash left over at the end of each month. Go ahead. Soak up the complimentary affordable home ownership.

    John Sanphillippo lives in San Francisco and blogs about urbanism, adaptation, and resilience at granolashotgun.com. He’s a member of the Congress for New Urbanism, films videos for faircompanies.com, and is a regular contributor to Strongtowns.org. He earns his living by buying, renovating, and renting undervalued properties in places that have good long term prospects. He is a graduate of Rutgers University.

  • Best World Cities for Traffic: Dallas-Fort Worth, Kansas City, Indianapolis and Richmond

    The 2015 Tom Tom Traffic Index shows that Dallas-Fort Worth has the least overall congestion among world (urban areas) with more than 5,000,000 population. The Tom Tom Traffic Index for Dallas-Fort Worth is 17, which means that, on average, it takes 17 percent longer to travel in the urban area because of traffic congestion.

    The Tom Tom Traffic Index rates traffic congestion in nearly 300 world cities. This article examines overall traffic congestion levels in two categories of cities, those with more than 5,000,000 population and those with between 1,000,000 and 5,000,000 population.

    Over 5,000,000 Population

    Tom Tom rated traffic congestion in 38 urban areas with more than 5,000,000 population. Five of the 10 least congested cities are in the United States, including five of the top seven. China placed two cities in the top 10 (Figure 1).

    With its Tom Tom Traffic Index of 17, Dallas-Fort Worth was far ahead of Philadelphia and Madrid, which tied for second at 23. This gap of six points is the largest among the 38 cities except for the seven that separate number 36 Istanbul and number 37 Bangkok.

    Atlanta ranked fourth, with a Traffic Index of 24, followed by Houston at 25. Suzhou achieved China’s best traffic congestion, with a Traffic Index of 26 and was tied for sixth best with Chicago. There was a three way tie for eighth.

    Because of a four way tie for 10th place, the bottom 10 in traffic congestion among the more than 5 million population included 13 cities (Figure 2). The greatest traffic congestion was in Mexico City, with a Travel Index of 59. This means that a 30 minute trip can generally be expected to take 48 minutes, 18 minutes more than without congestion. Bangkok, which is often suggested as one of the most congested cities in the world, ranked second worst with a Traffic Index of 57.

    Rio de Janeiro had the fifth worst traffic congestion with a Traffic Index of 47, while Moscow’s legendary traffic congestion rated a 44. Los Angeles, long the most congested city in the United States, had a Traffic Index of 41, and ranked seventh worst. Chengdu in China tied Los Angeles. The eighth and ninth most congested cities were St. Petersburg, at 40 and Tianjin at 39. London and three cities in China, Beijing, Chongqing, and Hangzhou tied for 10th worst traffic, at 38.

    1,000,000 to 5,000,000

    Generally traffic congestion is less severe in smaller cities, all things being equal. This is illustrated among the cities with between 1 million and 5 million population (Figure 3). Three United States cities tied for the best traffic congestion, Kansas City, Indianapolis and Richmond, Virginia, each possessed  a Traffic Index of 10. Because of a four way tie for 10th place, 13 cities are included in the top 10 and only one of these 13 cities is outside the United States.

    Cleveland ranks fourth, with a Traffic Index of 13, followed by St. Louis, Milwaukee, which are tied at fifth with a traffic index of 14. The conurbation (urban areas that have grown together, in this case Katowice, Gliwice and Tychy) Katowice, Poland had a Traffic Index of 14 and   Salt Lake City and Cincinnati for the seventh best traffic congestion.

    The three cities tying for 10th best traffic congestion all had a Traffic Index of 15 and were Minneapolis-St. Paul, Phoenix, Detroit and Columbus.

    Four other cities ranked above much larger Dallas-Fort Worth, with a Traffic Index of 16. These included Charlotte, Jacksonville, Memphis and Raleigh. Louisville tied Dallas-Fort Worth, at 17. Dallas-Fort Worth is approximately twice the population of the largest cities in the 1 million to 5 million classification, Detroit and Minneapolis-St. Paul and more than three times the population of Katowice.

    Three cities were tied for the worst traffic congestion in the 1 million to 5 million category with a Traffic Index of 43, Recife and Salvador in Brazil and Bucharest in Romania. Five of the bottom ten cities were in Europe, with Dublin, one of the smaller cities having a particularly high Traffic Index 40, nearly as bad as much larger Los Angeles (Figure 4).

    Overall Rankings

    Confirming the ratings above, the United States had the overall best traffic conditions (Figure 5), in all three population categories (under 1 million, 1 million to 5 million and over 5 million), though South Africa tied the United States in the over 5 million category.

    Progress

    Every year, it seems like more cities are added to the international traffic comparisons. This year’s addition of Bangkok, with its dreadful reputation for traffic was a huge step in the right direction. Bangkok, of course has bad traffic for decades, but was edged out by Mexico City. I still wonder whether the prize does not belong to Jakarta (as it did for the “start-stop” index a few years ago), and I hope that data on India’s huge cities and the cities of Japan will soon be available.

    Wendell Cox is principal of Demographia, an international pubilc policy and demographics firm. He is a Senior Fellow of the Center for Opportunity Urbanism (US), Senior Fellow for Housing Affordability and Municipal Policy for the Frontier Centre for Public Policy (Canada), and a member of the Board of Advisors of the Center for Demographics and Policy at Chapman University (California). He is co-author of the “Demographia International Housing Affordability Survey” and author of “Demographia World Urban Areas” and “War on the Dream: How Anti-Sprawl Policy Threatens the Quality of Life.” He was appointed to three terms on the Los Angeles County Transportation Commission, where he served with the leading city and county leadership as the only non-elected member. He served as a visiting professor at the Conservatoire National des Arts et Metiers, a national university in Paris.

    Photo: Bangkok: not the worst traffic congestion (photo by author)

  • A ‘Diet’ to Give California Drivers Indigestion

    In the past, it was other people’s governments that would seek to make your life more difficult. But increasingly in California, the most effective war being waged is one the state has aimed at ourselves.

    The Jerry Brown administration’s obsession with becoming a global model for reducing greenhouse gases is leading to an unprecedented drive to completely reshape how Californians live. Rather than focus on more pragmatic, affordable steps to reduce greenhouse gases – more efficient cars, rooftop solar systems and promoting home-based work – the goal increasingly seems like social engineering designed to force Californians to adopt the high-density, transit-oriented future preferred by Brown’s green priesthood.

    The newest outrage comes from the Governor’s Office of Planning and Research in the form of a proposed “road diet.” This would essentially halt attempts to expand or improve our roads, even when improvements have been approved by voters. This strategy can only make life worse for most Californians, since nearly 85 percent of us use a car to get to work. This in a state that already has among the worst-maintained roads in the country, with two-thirds of them in poor or mediocre condition.

    The OPR move reflects the increasingly self-righteous extremism animating the former Jesuit’s underlings. Ironically, the governor’s proposals to impose this road diet rest partly on expanding the California Environmental Quality Act, which Brown, in a more insightful moment, described as a “vampire” that needs a “stake through the heart.” Now, instead, the inquisitors seize on vague legislative language and push it to what the Southern California Leadership Council has dubbed “an undesirable and unmanageable extreme.”

    In essence, the notion animating the “road diet” is to make congestion so terrible that people will be forced out of their cars and onto transit. It’s not planning for how to make the ways people live today more sustainable. It has, in fact, more in common with Soviet-style social engineering, which was based similarly on a particular notion of “science” and progressive values.

    Read the entire piece at The Orange County Register.

    Joel Kotkin is executive editor of NewGeography.com. He is the Roger Hobbs Distinguished Fellow in Urban Studies at Chapman University and executive director of the Houston-based Center for Opportunity Urbanism. His newest book, The Human City: Urbanism for the rest of us, will be published in April by Agate. He is also author of The New Class ConflictThe City: A Global History, and The Next Hundred Million: America in 2050. He lives in Orange County, CA.

  • Chicago Is the Duck-Billed Platypus of American Cities

    Census results last week show Chicago as the only one of the twenty largest cities in America to lose population. The freaking out over a tiny loss isn’t really warranted. The comparison to Houston is bogus. Etc, etc. Yet Chicago’s leaders have refused to grapple with the real and severe structural and cultural challenges that face the city. That’s something they need to do if they want it to succeed over the longer term.

    I wrote about this in my latest City Journal web piece, “The Duck-Billed Platypus of Cities“:

    When it comes to population estimates, municipal-level data is largely irrelevant, especially when comparing cities with one another. That Houston may soon outpace Chicago in municipal population doesn’t mean that much—the city of Houston includes vast tracts of suburbia, making for an apples-to-oranges comparison. Chicago’s metro area is much larger than Houston’s and will remain the third-largest in the country for years to come. Similarly, while Chicago has the most murders in America, its murder rate is lower than other major cities like St. Louis, Baltimore, and Detroit. Comparisons with Detroit, with its hollowed-out economy, particularly infuriate Chicagoans, who reside in what remains a major economic center. And Detroit’s population loss far exceeds Chicago’s.

    But just because Chicago shouldn’t be compared to Detroit doesn’t mean that it should be compared with San Francisco.

    Click through to read the whole thing.

    Aaron M. Renn is a senior fellow at the Manhattan Institute, a contributing editor of City Journal, and an economic development columnist for Governing magazine. He focuses on ways to help America’s cities thrive in an ever more complex, competitive, globalized, and diverse twenty-first century. During Renn’s 15-year career in management and technology consulting, he was a partner at Accenture and held several technology strategy roles and directed multimillion-dollar global technology implementations. He has contributed to The Guardian, Forbes.com, and numerous other publications. Renn holds a B.S. from Indiana University, where he coauthored an early social-networking platform in 1991.

    Chicago photo by Bigstock.

  • Can Southland be a ‘New York by the Pacific’?

    Throughout the recession and the decidedly uneven recovery, Southern California has tended to lag behind, particularly in comparison to the Bay Area and other booming regions outside the state. Once the creator of a dispersed, multipolar urban model – “the original in the Xerox machine” as one observer suggested – this region seems to have lost confidence in itself, and its sense of direction.

    In response, some people, notably Los Angeles Mayor Eric Garcetti, favor creating a future in historical reverse, marching back toward becoming a more conventional, central core and transit-dominated region – a kind of New York by the Pacific. Eastern media breathlessly envision our region transforming itself from “car-addicted, polluted and lacking in public transit” into a model of new-urbanist excellence.

    Here’s a basic problem. Their L.A. of the future – the one that wins plaudits from places like GQ magazine – essentially negates the region’s traditional appeal, offering the middle and even working classes, a suburban-like lifestyle in one of the world’s great global cities.

    Vive la difference

    UCLA’s Michael Storper correctly notes how far the Southland has fallen behind its traditional in-state rival, the San Francisco Bay Area. Storper correctly traces much of this gap to the domination of the Los Angeles tech sector by aerospace firms and the fact that this area also had a broad base of nontech-oriented manufacturing.

    Can we become a second San Francisco? Regions, like people, do not easily transform themselves into something else. For one thing, the Los Angeles area’s diverse industrial legacy tended to attract a larger share of historically poorer blacks and Hispanics than the Bay Area, whose population is 33 percent black and Hispanic. In contrast, 55 percent of the five-county Southland area’s population has either Hispanic or African American backgrounds, according to data from the 2014 American Community Survey.

    Read the entire piece at The Orange County Register.

    Joel Kotkin is executive editor of NewGeography.com. He is the Roger Hobbs Distinguished Fellow in Urban Studies at Chapman University and executive director of the Houston-based Center for Opportunity Urbanism. His newest book, The Human City: Urbanism for the rest of us, will be published in April by Agate. He is also author of The New Class ConflictThe City: A Global History, and The Next Hundred Million: America in 2050. He lives in Orange County, CA.

  • The Cost of NOT Housing: A New Report

    This is the introduction to an new report "The Cost of NOT Housing" authored by Joel Kotkin for the National CORE Symposium on Affordability of Housing. Download the entire report (pdf) here.

    It is a commonplace view that housing does not contribute to the overall fiscal and economic condition of cities. Recent trends—both nationally and here in California—suggest that this is not the case. New housing, including affordable units, provide some direct stimulation through construction jobs, but also allow people, particularly young families, to stay, work and shop locally. Lack of affordable housing ultimately drives people, particularly the entry level and young educated, out of regions where their labor would be coveted by local companies.

    Some in the real estate industry, seeing ever higher prices, do not see a crisis here. Yet the current real estate “bubble” is not a durable replacement for a strong, sustainable economy. Older owners, and land speculators with a hold on scarce developable parcel, may do well under such conditions, but draining household finances for rents depresses retail sales, and makes saving for a home purchase ever more difficult.

    The problems are particularly relevant to areas like the Inland Empire and the Central Valley, whose economies depend on the migration of middle and working class families seeking more affordable housing. Yet developing such houses—critical to future economic growth—has been greatly constrained by a regulatory regime that works to reduce housing growth, particularly for single family houses, in the periphery. The result has been steadily escalating rents and house prices across the state.

    To meet the needs of its increasingly diverse population, and particularly the next generation, California needs to reform its regulations to more fully reflect the needs and preferences of its citizens. Once the home of the peculiarly optimistic “California Dream”, our state is in danger of becoming a place good for the wealthy and well-established but offering little to the vast majority of its citizens who wish to live affordably and comfortably in this most blessed of states.

    Download the entire report (pdf) here.

    Joel Kotkin is executive editor of NewGeography.com. He is the Roger Hobbs Distinguished Fellow in Urban Studies at Chapman University and executive director of the Houston-based Center for Opportunity Urbanism. His newest book, The Human City: Urbanism for the rest of us, will be published in April by Agate. He is also author of The New Class ConflictThe City: A Global History, and The Next Hundred Million: America in 2050. He lives in Orange County, CA.