Category: Urban Issues

  • Politics Move Left, Americans Move Right

    In an election year in which the top likely candidates come from New York, big cities arguably dominate American politics more than at any time since New Deal. The dynamics of urban politics, which are characterized by high levels of inequality and racial tensions—may be pushing Democrats ever further to the left and Republicans toward the inchoate resentment of Donald Trump. 

    Yet if politics are now being dominated by big cities along the coasts, the most recent U.S. Census Bureau data suggests that when it comes to their own lives, Americans are moving increasingly elsewhere, largely to generally Republican-leaning suburbs and Sunbelt states. In other words, politics and power are headed one way, demographics the other.

    Perhaps no American president has been less sympathetic to suburbs than Barack Obama. Shaun Donovan, Obama’s first secretary of Housing and Urban Development, proclaimed the suburbs’ were “over” as people were “voting with their feet” and moving to dense, transit-oriented urban centers. More recently, Donovan’s successor, Julian Castro, has targeted suburbs by proposing to force them to densify and take more poor people into their communities. Other Democrats, notably California’s Jerry Brown, have sought to use concerns over climate change to make future suburban development all but impossible.

    This divergence between politics and how people choose to live has never been greater. As economist Jed Kolko has observed, the perceived “historic” shift back to the inner city has turned out to be a relatively brief phenomena. Since 2012, suburbs and exurbs, which have seven times as many people, again are growing faster than core cities.

    This is not likely to be a short-lived phenomena. Generally speaking, Kolko notes that an aging population tends to make the country more suburban. The overwhelming trend among seniors is not to move “back to the city” but to stay in or move out to suburban or exurban areas. Between 2000 and 2012, notes demographer Wendell Cox, 99.6 percent of the senior population increase in major metropolitan areas was in the suburbs, a gain of 4.3 million compared to the gain of 17,000 in the urban core.

    There is also the well-demonstrated tendency for people entering their 30s, prime child-bearing age, to move to suburban locations for safety, space and better schools. Here’s the basic score: Core counties last year lost a net 185,000 domestic migrants, while the suburban counties gained 187,000. Rather than a reversal of suburbanizing trends, we see something of an acceleration.

    Primarily Republican-leaning areas may be losing their political power for now, but their demographic growth is relentless. Like the suburbs, the sprawling Sunbelt metros were widely predicted by urban pundits to be heading toward an inevitable extinction.      

    Yet the 2015 census data shows something quite different: Virtually every fast-growing metro region in the country is located far from the Eastern Seaboard, and increasingly outside of California. Houston, Dallas-Fort Worth, Atlanta and Phoenix each gained more people last year than either New York or Los Angeles, which are three to four times larger.

    Among America’s 53 largest metropolitan areas, nine of the 10 fastest-growing ones are in the Sunbelt: Austin, Orlando, Raleigh, Houston, Las Vegas, San Antonio, Dallas-Fort Worth, Nashville and Tampa-St. Petersburg. The only outlier is Denver, which has become a destination for people and companies fleeing higher priced areas, particularly the West Coast.

    Perhaps even more revealing are the trends in domestic migration. The leaders in total domestic net migration parallel almost precisely those that have experienced the strongest total population growth, led by Houston, Dallas-Fort Worth and Phoenix; together these metro areas added 150,000 net domestic residents. In percentage terms the big winners are Austin, Tampa-St. Petersburg, Raleigh, and Orlando.

    So which states are losing out among domestic migrants? The biggest loser is the home of our likely next president. New York experienced a net out-migration of 160,000 between 2014 and 2015. Over the past five years its metropolitan area has lost 701,000 net domestic migrants after suffering a population loss of nearly 2 million in the first decade of the new millennium. Chicago and Los Angeles also have experienced net out-migration as have some cities—such as San Jose and Washington, D.C.—even as they experienced impressive economic booms.

    These latest numbers confirm the likelihood that highly suburbanized areas, particularly in the Sunbelt, will continue to represent our demographic future. For all the hype and hysteria surrounding the urban revival, dense cities are not irresistible lures to most people. For the most part, they are experiencing sub-normal, and even declining, growth. The most urban of our urban cores, New York City, illustrates this slackening of population. For one year, the Big Apple grew at 1.2 percent (2011), above the national average of 0.7 percent. Yet, its growth dropped in 2015 to 0.6 percent, well below the national average. Brooklyn’s population growth declined in half from 2011 to 2015, while Manhattan’s declined by two-thirds. The only borough to show strong growth has been its poorest, the Bronx.

    None of this suggests that dense core cities are irrelevant to the future. As economist  Kolko suggests, inner city gentrification, particularly close to the urban core, has accompanied strong income growth and remains attractive to relatively small parts of the population: the highly educated, the affluent childless, single as well as the uber-rich. These places loom large also because that’s where the media is increasingly concentrated. And with a big city, East Coast-oriented person in the Oval Office next year, they could find themselves more influential, at least in the short run, than at any time in recent history.  

    This divergence between power and population sets the stage for future political conflicts, particularly given likely Democratic Party electoral gains this year. Attempts to crack down on suburban housing and resource industries, notably fossil fuels, seems likely to hit hardest many   places that are growing quickly, and which generally lean to the GOP.

    It could well be, as some progressives have forecast for over a decade, that the movement of New Yorkers and Californians, combined with the growth of minorities, in places like Texas and Arizona will paint these places Democratic blue. This seems reasonable, but what happens when Washington adopts policies that clearly hurt the new suburban homeowners, and the industries that have sparked Sunbelt growth?

    The new Texans and Arizonans may well be more socially liberal than the current denizens, but one has to wonder if they would like to see the prospect of better professional opportunities and affordable homes squelched by Washington’s urban-centric elite.

    This could turn out to be a bad election for those middle American aspirations, but over time progressive triumphalism could engender a grassroots rebellion capable of overturning the 2016 election results in shockingly fast fashion.

    This piece first appeared by Real Clear Politics.

    Joel Kotkin is executive editor of NewGeography.com. He is the Roger Hobbs Distinguished Fellow in Urban Studies at Chapman University and executive director of the Houston-based Center for Opportunity Urbanism. His newest book, The Human City: Urbanism for the rest of us, will be published in April by Agate. He is also author of The New Class ConflictThe City: A Global History, and The Next Hundred Million: America in 2050. He lives in Orange County, CA.

    Dallas photo by Bigstock.

  • Black Residents Matter

    Black lives matter, we’re told—but in many American cities, black residents are either scarce or dwindling in number, chased away by misguided progressive policies that hinder working- and middle-class people. Such policies more severely affect blacks than whites because blacks start from further behind economically. Black median household income is only $35,481 per year, compared with $57,355 for whites. The wealth gap is even wider, with median black household wealth at only $7,133, compared with $111,146 for whites, according to a study by Demos and the Institute on Assets and Social Policy.

    How, then, are cities faring in meeting the aspirations of their black residents, judged especially by the ultimate barometer: whether blacks choose to move to these cities, or stay in them? Among major American cities, three main typologies emerge: the high-flying progressive enclaves of the West, the historically large cities of the Northeast and the Midwest, and the fast-growing boomtowns of the South. Though results vary to some extent, the broad trend is clear: the most progressive-minded cities are either seeing a significant exodus of blacks or, never having had substantial black populations, are failing to attract them. These same cities, home to some of the loudest voices alleging conservative insensitivity to blacks, are failing to provide economic environments where blacks can prosper.

    In theory, prosperous, growing western cities—the San Francisco Bay Area, Portland, Seattle, and Denver—should find it easier to provide upward mobility, as they have fewer disadvantaged people. Far from the South and not part of the Rust Belt industrial complex, they attracted far fewer blacks during the twentieth century’s Great Migration, when millions of blacks moved north. As a result, their black populations are small, compared with those of eastern cities—just 5.6 percent in the city of Portland, for example, compared with 53.4 percent in Cleveland and 46.9 percent in St. Louis. And many western cities are driving their small number of black residents out.

    Portland is part of the fifth-whitest major metropolitan area in America. Almost 75 percent of the region is white, and it has the third-lowest percentage of blacks, at only 3.1 percent. (America as a whole is 13.2 percent black.) Portland proper is often portrayed as a boomtown, but the city’s tiny (and shrinking) black population doesn’t seem to think so. The city has lost more than 11.5 percent of its black residents in just four years. Metro Portland’s black population share grew by 0.3 percentage points from 2000, but that trailed the nation’s 0.5 percentage-point growth. This implies that some of Portland’s blacks are being displaced from the transit- and amenity-rich city to the suburbs that progressives themselves insist are inferior.

    The San Francisco Bay metro area has lost black residents since 2000, though recent estimates suggest that it may have halted the exodus since 2010. The Los Angeles metro area, too, has fewer black residents today than in 2000. The performance in the central cities is even worse. America’s most liberal city, San Francisco, is only 5.4 percent black, and the rate is falling. It’s a similar tale in Seattle—“one of the most progressive cities in the United States,” as a Black Lives Matter protester noted. One city bucking the western trend is Denver. Though the Rocky Mountain city has a small black population—6.1 percent in the region and 9.5 percent in the city proper—that population is growing in both areas, if slowly.

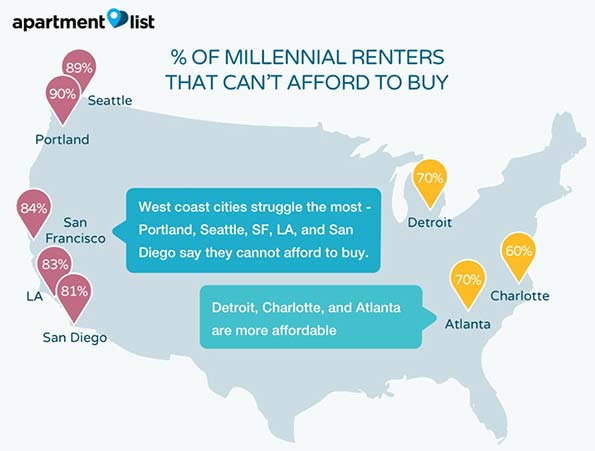
    These figures might not be important if they merely reflected a choice by blacks to move to more auspicious locations, but the evidence suggests that specific public policies in these cities have effectively excluded and even driven out blacks. Primary among them are restrictive planning regulations that make it hard to expand the supply of housing. In a market with rising demand and static supply, prices go up. As a rule, a household should spend no more than three times its annual income on a home. But in West Coast markets, housing-price levels far exceed that benchmark. According to the Demographia International Housing Affordability Survey, the “median multiple”—the median home price divided by the median household income—should average about 3.0. But the median multiple is 5.1 in Portland, 5.1 in Denver, 5.2 in Seattle, 8.1 in Los Angeles and San Diego, 9.4 in San Francisco, and 9.7 in San Jose. As the Demos/IASP report found, differences in homeownership rates between whites and blacks account for a large share of the racial wealth gap. Policies that put the price of homeownership out of reach for black families exacerbate the problem.

    Even some on the left recognize how development restrictions hurt lower- and middle-income people. Liberal commentator Matt Yglesias has called housing affordability “Blue America’s greatest failing.” Yglesias and others criticize zoning policies that mandate single-family homes, or approval processes, like that in San Francisco, that prohibit as-of-right development and allow NIMBYism to keep out unwanted construction—and, by implication, unwanted people. They don’t mention the role of environmental policy in creating these high housing prices. Portland, for example, has drawn a so-called urban-growth boundary that severely restricts land development and drives up prices inside the approved perimeter. The development-stifling effects of the California Environmental Quality Act (CEQA) are notorious. California also imposes some of the nation’s toughest energy regulations, putting a huge financial burden on lower-income (and disproportionately black) households. Nearly 1 million households in the Golden State spend 10 percent or more of their income on energy bills, according to a Manhattan Institute report by Jonathan Lesser. While liberals are quick to point out that in suburban communities, land-use restrictions that appear race-neutral can be functionally discriminatory, they don’t acknowledge that their own environmental-based restrictions on housing and energy are similarly exclusionary.

    The Windy City’s black population loss accounted for the lion’s share of the city’s total shrinkage during the 2000s.

    In some cases, western cities’ support for gentrification has come at the expense of long-standing black communities. In Portland, residents of the historically black Albina neighborhood complained about bike lanes—a progressive fetish—being built in their neighborhood. In Oakland, recent upscale arrivals got the government to cite Pleasant Grove Baptist Church, a fixture in the city for 65 years, for creating a public nuisance—because its gospel-choir practice was disturbing the newcomers.

    During the Great Migration, cities of the Midwest and the Northeast were industrial magnets, sucking in vast quantities of labor not just from the American South but also from Europe. As northern industry declined during the Rust Belt era, the great northern cities fell on trying times, and black residents, who had struggled to gain equal opportunity in factory jobs and in housing, were hit hard. Racial turbulence, often including riots, intensified, and helped drive a white exodus. Suburb-bound whites left behind an often-impoverished black underclass in segregated neighborhoods that, in many cases, remain so today.

    The most distressed cities in this region are the usual suspects: Detroit, Cleveland, Flint, and Youngstown. All have declining black populations, both in their urban cores and region-wide. Others, like St. Louis, have maintained their black populations only through natural increase (births outnumbering deaths). They are losing black residents to migration.

    The greatest demographic transition is taking place in Chicago. The Windy City’s black population loss of 177,000 accounted for the lion’s share of the city’s total shrinkage during the 2000s. Another 53,000 blacks have fled the city since 2010. In fact, the entire metro Chicago area lost nearly 23,000 blacks in aggregate, the biggest decline in the United States.

    By contrast, in northern cities with more robust middle-class economies—even if job growth doesn’t match Sunbelt levels—black populations are expanding. Since 2010, for example, metro Indianapolis added more than 19,000 blacks (6.9 percent growth), Columbus more than 25,000 (9 percent), and Boston nearly 40,000 (10.2 percent). New York’s and Philadelphia’s black population growth rates are low but positive, in line with slow overall regional growth. Washington, D.C., a traditional hub of black American life, is seeing declining black population share in the district itself, but the overall D.C. region continues to show solid black population growth.

    The somewhat unlikely champion for northern black population growth is Minneapolis–St. Paul. Though its black population makes up a much smaller proportion than many of its midwestern peers—at only 8 percent in the region and 19.5 percent in the city—Minneapolis’s black population has grown at a strong rate. Since 2010, the black population in the city has grown by 15,000 people, or 23 percent. The region added 30,400 black residents, growing by 12.1 percent. Part of the Minneapolis story (and that of Columbus as well) involves an influx of Somali immigrants—the metropolitan area has more Somalis than anywhere else in the United States. But immigration doesn’t explain everything. Minneapolis is also the third-leading destination for blacks leaving Chicago (behind Atlanta and Davenport, Iowa). About 1,000 black Chicagoans make the move north every year.

    Obviously, many blacks like what they see in places like Minneapolis, Indianapolis, and Columbus. One key is a development environment that keeps housing affordable. This is dramatically clear in Minneapolis, a liberal, historically white city often likened to western cities like Seattle and Denver. But being more housing-development-friendly, and also perhaps in part because of its famously brutal winters, Minneapolis is much more affordable than those cities, with a home-price median multiple of only 3.2. Similarly, in Columbus (with a median multiple of 2.9) and Indianapolis (also 2.9), black families can afford the American dream. When cities get the basics (planning policy, job growth, and reasonable taxation levels) right, even tough winters are no obstacle to a growing population—of whites and blacks.

    Where else do blacks go when they leave declining Rust Belt cities? Some seek opportunity in better-off regional cities, but others head to smaller regional communities that, if anything, are even worse off. Census Bureau data suggest that a significant number of blacks leaving Chicago are ending up in struggling downstate Illinois communities like Danville or Carbondale, where they’re unlikely to find economic opportunity. Why move to these places? One answer: they’re dirt cheap. But there’s a particular reason for that—demand has collapsed along with local economies. This creates a false allure. Harvard economist Edward Glaeser noted that some failing cities become so cheap that they turn into “magnets for poor people.” This left-behind population of blacks in places with low opportunity will prove challenging for these regions. The North also remains racially stratified. Milwaukee, New York, and Chicago are the three most segregated regions in the country. The maps of where black and white residents live in cities like Detroit shock the conscience. Urban school districts tasked with educating predominantly black students are failing miserably. Powerful public-employee unions make reform a difficult prospect.

    But for those blacks leaving the West, Midwest, and Northeast, one destination dominates: the South. A century ago, in search of economic and social opportunity, blacks were leaving the South to go north and west; today, they are reversing that journey, in what the Manhattan Institute’s Daniel DiSalvo dubbed “The Great Remigration” (Autumn 2012). DiSalvo found that blacks now choose the South in pursuit of jobs, lower costs and taxes, better public services (notably, schools), and sunny weather for retirement. The new arrivals aren’t solely working-class, either. Even better-off blacks, with household incomes over $100,000, are heading south from cities like Chicago.

    Historically, Southern blacks lived in rural areas. A large rural black population remains in the South today, often living in the same types of conditions as rural whites, which is to say, under significant economic strain. But the new black migrants to the South are increasingly flocking to the same metro areas that white people are—especially Atlanta, the new cultural and economic capital of black America, with a black population of nearly 2 million. The Atlanta metro area, one-third black, continues to add more black residents (150,000 since 2010 alone) than any other region.

    In Texas, Dallas has drawn 110,000 black residents (11.3 percent growth) and Houston just under 100,000 (9.2 percent) since 2010. Austin, a rare liberal city in the South, remains, at 53.4 percent, the whitest major Texas metro—Dallas and Houston double its black population share—but it, too, has seen strong black population growth. Miami, with its powerful Latino presence that includes both historically American as well as Afro-Latinos, also added about 100,000 blacks (8.3 percent). Today, Dallas, Houston, and Miami are all home to more than 1 million black residents.

    Many smaller southern cities—including Charlotte, Orlando, Tampa, and Nashville—are also seeing robust black population growth. Even New Orleans has seen a rebound in its black population since 2010. Not surprisingly, these southern cities are extremely affordable. A combination of pro-business policies combined with a development regime that permits housing supply to expand as needed has proved a winner. Among these southern cities, only Miami, with its massive influx of Latin American wealth, is rated as unaffordable, with a median multiple of 5.6. In addition to their sensible policies, many of these southern cities have also viewed their black communities not as a problem to be solved but as a potential civic asset and engine of growth. Atlanta embraced its emerging status as the capital of black America. Houston famously opened its doors and offered temporary shelter to thousands of poor black residents of New Orleans displaced by Hurricane Katrina. Many of those refugees stayed in Houston, attracted by its job opportunities and quality of life.

    Blacks are returning to southern cities, like Atlanta, drawn by economic opportunity and lower costs, especially compared with progressive cities like San Francisco, where restrictive housing policies have made living unaffordable for many. JIM WILSON/THE NEW YORK TIMES/REDUXBlacks are returning to southern cities, like Atlanta, drawn by economic opportunity and lower costs, especially compared with progressive cities like San Francisco, where restrictive housing policies have made living unaffordable for many. JIM WILSON/THE NEW YORK TIMES/REDUX

    These regional trends reveal two basic patterns. First, like whites, blacks are attracted by strong, broad-based economies. Pro-growth polices that allow workaday, not just elite, businesses to flourish are foundational to inclusive success. Second, with lower household incomes, black families are vulnerable to high housing costs. A few high-cost cities attract black residents; but for the most part, blacks are flocking to cities that are not only economically vibrant but generally affordable. Even strong urban economies can’t keep blacks from being displaced from cities, such as many on the West Coast, where housing costs remain stratospheric.

    Another conclusion revealed by the data: when it comes to how state and local policies affect black residents, the track record of the most liberal cities in the United States is truly dismal. These results should be troubling to progressives touting blue-state planning, economic, and energy policies as models for the nation. After all, if wealthy cities like San Francisco, Portland, and Seattle—where progressives have near-total political control—can’t produce positive outcomes for working-class and middle-class blacks, why should we expect their urban approach to succeed anywhere else?

    This piece first appeared at The City Journal.

    Aaron M. Renn is a senior fellow at the Manhattan Institute, a contributing editor of City Journal, and an economic development columnist for Governing magazine. He focuses on ways to help America’s cities thrive in an ever more complex, competitive, globalized, and diverse twenty-first century. During Renn’s 15-year career in management and technology consulting, he was a partner at Accenture and held several technology strategy roles and directed multimillion-dollar global technology implementations. He has contributed to The Guardian, Forbes.com, and numerous other publications. Renn holds a B.S. from Indiana University, where he coauthored an early social-networking platform in 1991.

  • Focus on Cost-Effective GHG Emissions: Report

    The Reason Foundation has published my new research reviewing the potential for urban containment (or other restrictive policies that are sometimes called “smart growth”) to reduce greenhouse gas (GHG) emissions. Principal reports cited by advocates of urban containment are reviewed. The conclusion is that only minimal reductions if the gains from improved automobile fuel economy are excluded. Of course, fuel economy improvements have nothing to do with urban containment policy, but are unrelated policy options that allow people to avoid draconian lifestyle changes that probably are impossible anyway.

    The report, "Urban Containment: The Social and Economic Consequences of Limiting Housing and Travel Options" expresses concern that the use of costly GHG reduction strategies, such as urban containment, has the potential to create significant economic disruption and unemployment. The report concludes that sufficient GHG emission reductions can be achieved without urban containment policy and its attendant economic problems: "The key is focusing on the most cost-effective strategy, without unnecessarily interfering with the dynamics that have produced the nation’s affluence."

    Read more and download the full report at Reason.com

    Photograph: BMW i3. 124 miles per gallon equivalent electric car (currently available)
    by TTTNISOwn work, CC0, https://commons.wikimedia.org/w/index.php?curid=34818839

  • Public Transportation Ridership: Three Steps Forward, Two Steps Back?

    The Bureau of Transportation Statistics recently released preliminary data summarizing public transportation ridership in the United States for the calendar year 2015. The preliminary data from the National Transit Data program showed transit ridership in 2015 of 10.4 billion annual riders approximately 2.5% below the 2014 count and also smaller than the 2013 count. The American Public Transit Association using a slightly different methodology released data showing 10.6 billion annual riders versus 10.7 billion in calendar year 2014, a 1.26% year-over-year decline. Such differences between sources are common, resulting from differences in methodology and definitions, and unsurprising, given that data is preliminary and national data is dependent upon reporting from hundreds of different agencies. 

    It is important to recognize that it’s extraordinarily difficult to consistently grow transit ridership. We have had growing population, a rebounding economy, growing total employment, and an aggressively argued hypothesis that the millennial generation is meaningfully different than their forefathers—with urban centric aspirations and indifference toward auto ownership and use. Yet, transit ridership has remained stubbornly modest. 

    Indicator

    2015 versus 2014

    Source

    U.S. Population

    +0.8%

    Census

    Total Employment

    +1.7%

    BLS

    Real GDP

    +2.4%

    BEA (third estimate)

    Gas Price

    -28%

    EIA

    VMT

    +3.5%

    FHWA

    Public Transit Ridership

    -1.3% to -2.5%

    APTA and NTD

    Amtrak Ridership (FY)

    -0.1%

    Amtrak

    Airline Passengers

    +5.0%

    USDOT, BTS

    The rebound in national vehicle miles traveled totals in 2015 (+3.5%) grabbed attention, as many had anticipated continued moderation. Couple that with modest declines in transit and Amtrak use and strong airline traffic growth, and one could argue the new normal for travel trends is looking more like the old normal. 

    When I entered full-time employment with a transit agency in 1980, industry leaders were touting the growth opportunities for public transit in light of the energy shortages in the late ’70s. Throughout the intervening time, there have been myriad seemingly logical events that led to expectations of strong transit growth. Growing congestion, a growing appreciation of the role of transportation in influencing land-use, growing federal support, increasing gasoline prices, expansion of rail systems, sensitivity to the safety benefits of transit travel, potential economic benefits for passengers who reduce auto ownership and use costs, air quality concerns and, subsequently, climate impact concerns, and, more have collectively created almost perpetual expectations of a more promising future for public transportation. Indeed, transit ridership has grown some since its low point in the early ’70s and subsequent dip in the mid-’90s, but the often-expected, sustained, or robust growth has never materialized. 

    More recently, demographic conditions, such as growing urbanization, declining driver’s-license-holding and auto-ownership rates for young people, and evidence that the love affair with the automobile has waned, have renewed expectations. Sprinkle in technology enhancements that enable real-time information, robust trip planning, automated and more convenient fare collection, and integrated first-mile last-mile opportunities; add a dash of heightened concerns about climate change; and there remains a credible argument that transit has a bright future. 

    An often-cited constraint on the growth of public transit has been the assertion of resource constraints for providing the quality of service that would be attractive to more travelers who have other options. While transit supply remains well below the aspirational levels of many transit users and transit advocates, the data in the graph below indicates that supply has grown far more rapidly than demand for the past several decades. This is a report card on productivity that mom and dad would hardly be proud of. And a larger share of the ridership has moved to more capital intensive (and larger vehicle capacity) rail systems.


    Source: 2015 APTA Public Transportation Fact Book, Appendix A, Historical Tables 2 and 8.

    Gas prices have certainly been a factor in recent trends, but they can’t explain the fact that growing transit ridership seems as tough as getting bipartisan harmony in the nation’s legislative bodies. Some cities are moving headlong into a more transit intensive future with aspirations of big ridership growth, like Seattle, where aggressive, multi-decade plans with big local funding commitment requests promise more transit supply. Other areas like Washington, D.C. are digesting the reality that more resources are required to sustain existing services, maintain infrastructure and meet underfunded pension obligations. The factors supporting or opposing ridership growth are numerous, with uncertainties dominating the lists. 


    I generally like to have a theoretically robust basis for speculating on the future, but in light of the complexity of factors involved and the uncertainty in their trends, transit ridership forecasts are speculative. The per capita transit ridership trend in the graph below (red line) is a pretty straight horizontal line since about 1970 and just might be pointing to the future. History tells us to be careful in presuming we understand causal factors governing complex behaviors; if anything the degree of uncertainty is greater than ever. 

    Transit remains very important to each trip maker but how many trips are made in the future remains a guess, one that should be informed by a keen understanding of travel behavior and history and not just aspirations.


    Source: APTA Public Transportation Fact Book, various years, Census.

    This piece first appeared at Planetizen.

    Dr. Polzin is the director of mobility policy research at the Center for Urban Transportation Research at the University of South Florida and is responsible for coordinating the Center’s involvement in the University’s educational program. Dr. Polzin carries out research in mobility analysis, public transportation, travel behavior, planning process development, and transportation decision-making. Dr. Polzin is on the editorial board of the Journal of Public Transportation and serves on several Transportation Research Board and APTA Committees. The opinions are those of the author—or maybe not—but are intended to provoke reflection and do not reflect the policy positions of any associated entities or clients.

  • DIY Urbanism

    Over the years I’ve belonged to a variety of different organizations that had the ostensible goal of accomplishing X or Y. At a certain point I would realize that all anyone was doing was exercising their fears and frustrations. Most of all they were trying to stop other people from doing things they didn’t like.

    I’m impatient. I want to get on with the business of actually doing something tangible. Waiting for someone else to come along and accomplish your goals for you is a really bad plan. Trying to change government policy is endless. Expecting “the market” to magically solve problems isn’t realistic. So where does that leave any of us?

    Screen Shot 2016-03-02 at 3.04.03 PM

    Screen Shot 2016-03-02 at 3.16.44 PM

    Screen Shot 2016-03-02 at 3.20.59 PM

    Enter the Incremental Development Alliance. Let’s say you have a problem in your neighborhood. It needs a grocery store. It needs bike infrastructure. It needs more public gathering spaces. It’s in decline and needs new investment. It’s in the process of being gentrified and people are being squeezed out. Whatever. Why not be the person who brings the desired change? You. Right now. Go do it.

    Screen Shot 2016-03-03 at 6.30.36 PM

    Screen Shot 2016-03-02 at 3.20.37 PM

    Screen Shot 2016-03-10 at 10.23.43 PM

    Easier said than done, right? This isn’t easy stuff. There are zoning regulations, building codes, financing obstacles, bureaucratic landmines… The red tape is endless. So you need help understanding the big picture. You need people who have already successfully done similar things. You need to know which projects are most likely to be approved and which ones are probably doomed from the start. You need to understand how things are paid for – or not. You need a sherpa guide to building civilization.

    Screen Shot 2016-03-02 at 3.18.50 PM

    Screen Shot 2016-03-02 at 3.19.34 PM

    Screen Shot 2016-03-02 at 3.25.31 PM

    Incremental development isn’t about large scale production builders. It isn’t about procuring government grants for pet projects. It isn’t about wooing a big company into your town to save things. It’s about an army of individual people, families, and small groups of friends and neighbors sorting things out on their own – very often in spite of “helpful” institutions that actually make positive change more difficult and expensive than it needs to be. Check it out. You might just become the agent of change you’ve been waiting for.

    John Sanphillippo lives in San Francisco and blogs about urbanism, adaptation, and resilience at granolashotgun.com. He’s a member of the Congress for New Urbanism, films videos for faircompanies.com, and is a regular contributor to Strongtowns.org. He earns his living by buying, renovating, and renting undervalued properties in places that have good long term prospects. He is a graduate of Rutgers University.

  • America’s Subway: America’s Embarrassment?

    Washington’s Metro (subway), often called "America’s subway," may well be America’s embarrassment. As a feature article by Robert McCartney and Paul Duggan in the Washington Post put it: “’America’s subway,’ which opened in 1976 to great acclaim — promoted as a marvel of modern transit technology and design — has been reduced to an embarrassment, scorned and ridiculed from station platforms to the halls of Congress. Balky and unreliable on its best days, and hazardous, even deadly, on its worst, Metrorail is in crisis, losing riders and revenue and exhausting public confidence." (emphasis by author.)

    The Post article started out by saying: "Metro’s failure-prone subway — once considered a transportation jewel — is mired in disrepair because the transit agency neglected to heed warnings that its aging equipment and poor safety culture would someday lead to chronic breakdowns and calamities." Moreover, according to the Post, there had been plenty of warnings over the nearly half-century the trains have been operated that maintenance and safety were not receiving sufficient attention. The article notes that the transit agency has lacked a robust safety culture and "it is maintenance regime was close to negligent."

    Indeed, things have gotten so bad that the new general manager Paul J. Wiedefeld ordered a one day system shutdown to make emergency repairs out of fear that a fault that killed one passenger a year ago might have recurred. The problem was considered so serious by Mr. Weidefeld that little more than 12 hours notice was provided: "Scores of passengers were sickened, one fatally, in a smoke-filled tunnel; a fire in a Metro power plant slowed and canceled trains for weeks; major stretches of the system were paralyzed for hours by a derailment stemming from a track defect that should have been fixed long before; and, on March 16, in an unprecedented workday aggravation for every Metro straphanger, the entire subway was shut down for 24 hours for urgent safety repairs."

    Things are so bad that Metro officials have warned it may be necessary to shut entire subway lines for up to six months to perform necessary maintenance.

    The feature length article, at nearly 5000 words, could well add to the Washington Post’s impressive list of Pulitzer Prizes.

    If there were an anti-Pulitzer Prize, it might well go to James Surowiecki of The New Yorkerwho opined: "Today, the Metro is in such a state that fixing it may require shutting whole lines for months at a time. It’s yet again an example for the nation, but now it’s an example of how underinvestment and political dysfunction have left America with infrastructure that’s failing and often downright dangerous."

    It is hard to imagine a more inappropriate characterization. Metro’s problem has nothing to do with any national infrastructure crisis. It is a crisis of competence — the failure of its governance system to competently manage the system.

    When is the last time that the entire New York subway was closed with 12 hours notice to make repairs critical to the safety of the system? Or when was the last such shutdown of the London Underground, the Paris Metro, or for that matter the Kolkata Metro or the Caracas Metro, much less the threat of closing lines for months at a time?

    How many of America’s many light rail systems have shut down as a result of their having failed to sufficiently maintain their safety? There is plenty to criticize about the many new urban rail systems in the United States. They may not carry the number of passengers projected, and often have cost far more than taxpayers were told and they may not have reduced traffic congestion. But they have managed to provide safe transportation to their riders. Only one of America’s rail systems has failed so abjectly in the most fundamental of its responsibilities: America’s subway in Washington.

    My one criticism of the Washington Post story is its preoccupation with finding new sources of funding. Funding levels do not excuse this failure. No one was forcing the powers that be in the Washington area to continue to expand a subway well into the hinterlands while the core was deteriorating. It was the responsibility of the governance structure of the Washington Metropolitan Area Transportation Authority (WMATA), which owns and operates Metro to put the safety of its customers first. If the priorities had been right and the system had not been built out faster than the funding would have prudently permitted, we would not be having this discussion.

    Perhaps the most important lesson to be learned from the Washington Metro failure is that we need to learn the lessons. As the Post article indicates, there are multiple reasons that have contributed to Metro’s failure over decades and a number of WMATA administrations. Certainly no single board of directors or manager bears principal responsibility. It is important to learn exactly what went wrong, and examinations by organizations such as the Government Accountability Office, the Congressional Research Service, the Department of Transportation Inspector General and others would be appropriate. It is important to recognize that Metro is not the typical transit agency that has fallen into financial difficulties. This is a very special case and needs to be treated as the serious governance and management failure that it is. Answers are needed before any new money should be allowed to flow for Metro. For its part, WMATA needs to figure out what it can competently do with the money that is available.

    Wendell Cox is principal of Demographia, an international pubilc policy and demographics firm. He is a Senior Fellow of the Center for Opportunity Urbanism (US), Senior Fellow for Housing Affordability and Municipal Policy for the Frontier Centre for Public Policy (Canada), and a member of the Board of Advisors of the Center for Demographics and Policy at Chapman University (California). He is co-author of the “Demographia International Housing Affordability Survey” and author of “Demographia World Urban Areas” and “War on the Dream: How Anti-Sprawl Policy Threatens the Quality of Life.” He was appointed to three terms on the Los Angeles County Transportation Commission, where he served with the leading city and county leadership as the only non-elected member. He served as a visiting professor at the Conservatoire National des Arts et Metiers, a national university in Paris.

    Washington Metro photo by Ben Schumin. SchuminWeb assumed (based on copyright claims). Own work assumed (based on copyright claims)., April 28, 2016

  • There Are No Writers Here

    I’ve long noted that the civic identity or culture of many places seems to be a cipher. What is our identity as a city? is a question frequently asked. And one that needs to be. Cities will succeed best when they undertake policies that are true to the place. To most successfully build or rebuild a place, it’s important to articulate that civic identity and work with it, not against it.

    Of course some of that happens by the very fact that the people who live in a place are steeped in its culture. But a lack of self-awareness can be a big liability. As the Greek oracle noted, the first call is to “Know Thyself.”

    But this is hard to do, both for people and places. It’s hard to give a succinct description of the culture of say Cleveland, Columbus, or Cincinnati, but visitors to those cities will be instantly struck by how starkly different they are.

    To unearth and understand the culture and identity of a place requires going on an anthropological or archeological mission deep into the soil of a city, with a proper balance of affection and detachment.  This takes time to do, and a lot of my own writing on various places would certainly be much better if I had time to embed in them and understand them more deeply.

    One big advantage larger cities have is that they have a much larger supply of journalists and writers than smaller ones, and these are the very people who are most likely to investigate, unearth, and articulate that culture.

    New York in an embarrassment of riches in this regard. Practically every day someone is writing something interesting about the city. Just today, for example, City Journal published a piece about the layers of New York history represented in Straus Park. And Urban Omnibus had one about finding New York in West Side Story.

    Back when the mega-bookstore chains were still going strong, I always liked to visit one when I came to a city, and go to the “local interest” section. In too many places, the titles on offer were pathetic. A number of large cities don’t even seem to have one high quality history on offer.

    The biggest cities, by contrast, had sections that were disproportionately large even relative to their larger population. There have been a massive number of great books written about Chicago, for example, and the Chicago section in the old downtown Borders was correspondingly huge.

    You can learn a lot about a city just by taking a look at the local interest section in a bookstore.

    Unfortunately, just when this kind of writing is greatly needed, the number of people who might be writing it have been shrinking.  Nieman Lab just published an article talking about the increasing concentration of media in New York, DC, and Los Angeles, noting, “[T]he increase in concentration is unmistakable. Journalism jobs are leaving the middle of the country and heading for the coasts.”

    What reporting remains is often done by inexperienced reporters with little tie to a community. Chains like Gannett seem to deliberately practice rotating reporters and even columnists from city to city, preventing them from really getting a place. Few of them have any real knowledge of even fairly recent history.

    Perhaps unsurprisingly, when you do go looking for books about smaller (but often still sizable) places, you can sometimes find books that are collections of pieces from long gone columnists.

    There has been a ton of money and effort poured in supporting artists and other “creative class” type endeavors in cities, but remarkably little financing of high quality writing about cities, their past, and their culture.

    By its very nature this work is often very time consuming and with limited, highly localized market appeal. It can require a ton of research. Unsurprisingly, a lot of the best of it is produced by writers who take it on as a side project while doing their “day job.”  Writers are often almost compelled to write, after all. For example, my colleague Stephen Eide typically writes studies about municipal finance, but also wrote an essay about the Lorelei fountain commemorating Heinrich Heine in the Bronx.

    Cities without a large resident base of writers are at a disdvantage here. And it appears to be growing by the day, yet another example of the bifurcation of society.

    This particularly local concern that is highly unlikely to be produced by the market is one local philanthropists will need to take on if they wish to fill this gap.  It is perhaps hyperbole so that that there are no more writers in these cities, but there certainly aren’t enough of them.

    This piece first appeared at Urbanophile.com.

    Aaron M. Renn is a senior fellow at the Manhattan Institute, a contributing editor of City Journal, and an economic development columnist for Governing magazine. He focuses on ways to help America’s cities thrive in an ever more complex, competitive, globalized, and diverse twenty-first century. During Renn’s 15-year career in management and technology consulting, he was a partner at Accenture and held several technology strategy roles and directed multimillion-dollar global technology implementations. He has contributed to The Guardian, Forbes.com, and numerous other publications. Renn holds a B.S. from Indiana University, where he coauthored an early social-networking platform in 1991.

  • Where Millionaires Are Moving

    In this oligarchic era, dominated as never before in modern history by the ultra-rich, their movements are far more than grist for gossip columns. They are critical to the health of city economies around the world.

    recent study by the consultancy New World Wealth traces this movement globally, identifying the big winners and losers in millionaire migration. It defines millionaires as those with net assets of at least $1 million outside their personal residence – generally, people with sizable investment capital or their own businesses.

    Among the countries that saw the largest outflows in 2015 are two where property rights are not the most secure: Russia and China. China ranks second in net outflows (-9,000) and Russia sixth (-2,000).

    Another big factor: public safety. France lost an estimated 10,000 net affluents last year, many of them after the terrorist attacks, the largest outflow of any country, according to New World Wealth. Other big losers were struggling economies, including hard-hit Italy and Greece. In fourth place is India, a country that has exported its wealthy around the world for generations.

    The country that was the biggest landing pad for the wealthy last year was Australia, gaining a net 8,000 millionaires. The country is popular most notably with Chinese investors as well as those from other Asian countries. In second place was the United States (7,000), followed by Canada (5,000) and, surprisingly, Israel (4,000). The United Arab Emirates (3,000) and New Zealand (2,000) round out the top six.

    Favorite Cities Of The Affluent

    Zooming in to the city level, the flows are a bit more surprising. The biggest winners are not the elite global cities, like New York or London, but ones that are comfortable, and boast pretty settings and world-class amenities. The leading millionaire magnets in 2015 were Sydney and Melbourne, gaining 4,000 and 3,000 millionaires, respectively, many from China. In third place is Tel Aviv, a burgeoning high-tech center which is attracting Jews fleeing Europe, notably from France.

    Dubai ranks fourth, luring many Middle Easterners seeking a safer, cleaner business locale. Then comes a series of some of the most attractive cities on the planet, including Seattle (seventh) and Perth (eighth). In many cases these cities are gaining from “flight capital” from Asia and the Middle East.

    London, long considered a primary haven for the mobile rich, actually lost a net 500 millionaires in 2015. Many, according to the study, are moving to other parts of the United Kingdom, often the countryside, or to other English-speaking countries.

    But the biggest losers by far were declining first-world cities, many of which have never fully recovered from the 2007 financial crisis. These include Paris, which saw a net outflow of 7,000 millionaires, the most in the world. Not surprisingly, many of the exiting Parisians are Jewish, and many are headed to Israel. There are widespread reports that more of that city’s estimated 350,000 Jews may also be considering an exit. Overall migration from France to Israel rose in 2015, with 7,469 leaving for the Jewish State, up from 6,658 in 2014 and 3,263 in 2013.

    Elsewhere in Europe, Rome lost 5,000 and Athens 2,000 amid poor economic conditions and perilous fiscal situations in their countries.

    Chicago lost 3,000 millionaires in 2015. Although the city continues to attract top-drawer corporate headquarters and luxury housing, the city’s economy is far from thriving, and there is growing concern about a rise in crime rates and growing racial tensions. Unlike other exiting millionaires, who often change countries, most of those leaving Chicago headed to other parts of the U.S.

    Why It Matters

    The movement of wealthy people matters increasingly in globalized societies, which allow money and ideas to relocate with relative ease. Investors, entrepreneurs and innovators are extraordinarily mobile by nature. They also bring with them capital, connections and tax revenues that are then lost to their former host countries and cities. There is also an employment impact. New World Wealth estimates that 30% to 40% of the millionaires they have tracked are business owners.

    Keeping the rich and luring more is a priority now widely embraced by many urban developers and politicians. Former New York Mayor Michael Bloomberg has suggested that today a successful city must be primarily “a luxury product,” a place that focuses on the very wealthy whose surplus can underwrite the rest of the population. “If we can find a bunch of billionaires around the world to move here, that would be a godsend,” Bloomberg, himself a multi-billionaire, said toward the end of his final term. “Because that’s where the revenue comes to take care of everybody else.”

    This reliance on the rich, notes a Citigroup study, reshapes urban economies, not always for the best. Their presence creates an urban employment structure based on “plutonomy,” an economy and society driven largely by the wealthy classes’ investment and spending. A 2014 Brookings report found that virtually all the most unequal U.S. metropolitan areas – with the exception of Atlanta and Miami — areas are luxury-oriented cities including San Francisco, Boston, Washington D.C., New York, Chicago and Los Angeles. Although the number of high-wage jobs has increased in these places, much of the new employment has been in low wage service jobs. As urban studies author Stephen J.K. Walters notes, these cities tend to develop highly bifurcated economies, divided between an elite sector and large service class. “This,” he notes, “is the opposite of [Jane] Jacobs vision of cities that as places that are “constantly transforming many poor people into middle class people.’ ”

    One clear effect is on housing prices, which have shot up precisely in those places now favored by the rich. Perhaps the most obvious case is Vancouver, where the inflow of predominately Chinese investors has helped make the Canadian city among the most unaffordable in the world, with median home prices breaking the million-dollar mark.

    Yet if the presence of the rich creates more inequality, their departure could also have some nasty effects. The movement for example of one billionaire — hedge fund manager David Tepper — from New Jersey to Florida could leave the Garden State with a $140 million hole just from his change of address. Overall New Jersey depends for 40 percent of its revenue of income taxes, one-third of which is paid by the top 1 percent of the population.

    Such movements could become more common, as affluent people look for more relaxed and less heavily taxed communities to settle in. A 2016 study by Phoenix Marketing International found that the fastest-growing millionaire populations in the country are not in big luxury cities but smaller towns like Mount Airy, N.C.; Cookeville, Tenn.; and Kalispell and Bozeman, Mont.

    Despite this year’s campaign rhetoric, the influence of affluent migration is likely to become greater in the years ahead. The number of American households with assets of $1 million or more, not including their primary residence, increased 3 percent last year to 10.4 million, according to Spectrem Group, a market research and consulting firm. Meanwhile, the number of American households worth $25 million or more has grown 73 percent since 2008, compared with growth of 54 percent for millionaire households.

    For communities around the world the choice is increasingly a Hobbesian one. Attract more of the wealthy to town, and see housing prices soar beyond the reach of the middle class, or push the rich away, and live with the likely loss of jobs, tax revenues and businesses. In a world dominated by oligarchy, these are the realities which countries and cities now have to confront.

    This piece first appeared in Forbes.

    Joel Kotkin is executive editor of NewGeography.com. He is the Roger Hobbs Distinguished Fellow in Urban Studies at Chapman University and executive director of the Houston-based Center for Opportunity Urbanism. His newest book, The Human City: Urbanism for the rest of us, will be published in April by Agate. He is also author of The New Class ConflictThe City: A Global History, and The Next Hundred Million: America in 2050. He lives in Orange County, CA.

    Sydney photo by Christopher Schoenbohm.

  • Millennial Home Ownership: Disappointment Ahead in Some Places?

    Millennial renters overwhelmingly plan on buying their own homes, though affording them could be far more challenging than they think. This is an important conclusion from a renters’ survey by apartmentlist.com, an apartment search website (See: The Affordability Crisis: Are Millennials Destined to be Renters?). Apartmentlist.com matched results from its own survey of prospective renters that visit its site with housing market data from more than 90 metropolitan areas around the country, The most revealing finding:  Millennials intend to purchase their own homes, but that housing affordability is the greatest barrier. According to apartmentlist.com, the problem is the greatest on the West Coast, New York and Miami (See Figure “% of Millennial Renters that Can’t Afford to Buy”, from apartmentlist.com):

    In nearly all the metros we looked at, affordability was the #1 reason for delaying homeownership, but millennials on the west coast struggled the most: Portland, San Diego, Seattle, Los Angeles, and San Francisco all had more than 80% of renters listing affordability as a concern. Miami and New York, expensive metros with many cost-burdened renters, were #6 and #7 on the list.

    Perhaps surprisingly, two metropolitan areas that have been among the greatest beneficiaries of the housing affordability driven net domestic migration from coastal California, Portland and Seattle, scored the worst on affordability as a barrier to purchasing homes (90 percent and 89 percent respectively). These areas were once much less expensive in the past, but are rapidly catching up with California in terms of unaffordability.

    The Preference for Home Ownership

    The apartmentlist.com survey found that 79 percent of Millennials eventually plan to become home or apartment owners, while only six percent expect to rent for their whole lives. The balance (15 percent) are not sure. This 79 percent preference for home ownership is well above the current homeownership rate of approximately 64 percent.

    The preference for home ownership was pervasive in the apartmentlist.com data. Among the 50 metropolitan areas with more than 1,000,000 population, none scored below two thirds (67 percent) in Millennial home ownership preference. This is, again, above the national home ownership rate. The lowest home ownership preference among these was in Las Vegas. The highest preference for home ownership was in Rochester, at 94 percent. Charlotte and Salt Lake City also scored a 90 percent home ownership preference.

    Millennials indicated a strong preference for home ownership even in metropolitan areas that have depressed home ownership rates. In 2015, Los Angeles had the lowest home ownership rate of any major metropolitan area, at 49 percent, yet 76 percent of the area’s Millennials intend to own their own homes. In New York, with only a 50 percent homeownership rate, 74 percent of Millennials plan on buying their own homes. In San Jose, with only a 51 percent home ownership rate, 74 percent of Millennials aspire to buy their own homes. In San Diego, the home ownership rate was 52 percent, yet the interest in home ownership was half-again higher (78 percent). In San Francisco, where the home ownership rate is 56 percent, 76 percent expressed an interest in owning their own homes (home ownership rates calculated from Census Bureau quarterly data from 2015).

    The story is the same in the metropolitan areas often characterized as magnets for Millennial migration. In Portland and Denver, 81 percent of Millennials anticipate owning their own homes. Boston (78 percent), Seattle (77 percent) and Minneapolis-St. Paul (77 percent) are not far behind.

    Saving for Decades

    This data suggests that many Millennials could need to relocate to afford their own homes. The really innovative contribution of the apartmentlist.com research is as estimate of how long it will take the average Millennial to save enough money for a down payment on a starter home, which according to Trulia, is generally defined as the lower third of the market.

    Apartmentlist.com develops an estimate for each metropolitan area, using monthly savings rates, existing savings and the potential for financial assistance (for example from relatives) in obtaining enough for the down payment. In the most costly market, San Francisco, the average Millennial will need more than 28 years to build up enough funding for a down payment in San Francisco. This means that older Millennials would be old enough (62) to qualify for early retirement benefits from Social Security by the time they have enough to pay the down payment on a starter home. Sacramento is nearly as challenging, where it would take another 27 years to accumulate a down payment. Things are not that much better in Los Angeles (20 years), San Diego (19 years) and Denver (18 years).

    Optimistic Expectations and Disappointment

    But the most important bottom line conclusion of the research is what apartmentlist.com calls the “affordability gap.” This is the difference between the actual time required to accumulate a down payment and the time expected by survey respondents. The biggest affordability gap is in San Francisco, where respondents expected down payment requirements that would take only 11 years more to save. The reality, according to the study, is 28 years, more than 2.5 times that figure. In Sacramento, respondents expected that it would take 16 years, still far short of the more realistic 27 years. In Los Angeles, San Diego and Denver, it is likely to take from eight to ten years more to save enough for a down payment than survey respondents estimate.

    Setting up for More Domestic Migration

    In contrast, in a number of other metropolitan areas, such as Houston, Dallas-Fort Worth, Atlanta, Philadelphia and Kansas City, Millennials have over-estimated the size of down payments necessary to enter the housing market.

    For some time, domestic migration trends in the United States has been principally about moving from more expensive metropolitan areas to less expensive metropolitan areas. The apartmentlist.com data suggests that this trend could continue. To achieve their dreams of home ownership and to avoid a life of renting, many Millennials may move to places where housing is priced more for livability.

    Wendell Cox is principal of Demographia, an international pubilc policy and demographics firm. He is a Senior Fellow of the Center for Opportunity Urbanism (US), Senior Fellow for Housing Affordability and Municipal Policy for the Frontier Centre for Public Policy (Canada), and a member of the Board of Advisors of the Center for Demographics and Policy at Chapman University (California). He is co-author of the “Demographia International Housing Affordability Survey” and author of “Demographia World Urban Areas” and “War on the Dream: How Anti-Sprawl Policy Threatens the Quality of Life.” He was appointed to three terms on the Los Angeles County Transportation Commission, where he served with the leading city and county leadership as the only non-elected member. He served as a visiting professor at the Conservatoire National des Arts et Metiers, a national university in Paris.

    Photo by Bigstockphoto.com.

  • Largest Cities in the World: 2016

    Tokyo-Yokohama continues to be the largest city in the world, with nearly 38 million residents, according to the just released Demographia World Urban Areas (12th Annual Edition). Demographia World Urban Areas (Built-Up Urban Areas or Urban Agglomerations) provides annual estimates of the population, urban land area and urban population density of all identified built-up urban areas in the world. This year’s edition includes 1,022 large urban areas (with 500,000 or more residents), with a total population of 2.12 billion, representing 53 percent of the world urban population.

    Demographia World Urban Areas uses base population figures, derived from official census and estimates data, to develop basic year population estimates within the confines of built-up urban areas. These figures are then adjusted to account for population change forecasts, principally from the United Nations or national statistics bureaus for a 2016 estimate.

    Built-up urban areas are continuously built-up development that excludes rural lands. Built-Up urban areas are the city in its physical form, as opposed to metropolitan areas, which are the city in its economic or functional form. Metropolitan areas include rural areas and secondary built-up urban areas that are outside the primary built-up urban area. These concepts are illustrated in Figure 1, which uses the Paris built-up urban area (unité urbaine) and metropolitan area ("aire urbaine") as an example.

    The Largest Cities

    The world’s eight largest cities are located in Asia. Tokyo-Yokohama became the largest urban area, according to the United Nations, in 1955, more than 60 years ago. However, Japan’s capital may not old onto the top position for long. With Japan now losing population, it seems likely that Tokyo-Yokohama — which has been about the only place in Japan gaining population — will begin shrinking in the next decade, while facing a strong challenge from Jakarta.

    Jakarta has closed the gap to about 6.4 million. This may seem like a lot, but this is the closest a number two urban area has been since 1965, when New York trailed Tokyo-Yokohama by 5.1 million. The gap between number one and number two New York amounted to 16.5 million in 1995.

    Jakarta has grown very quickly, and now stands at a population of 31.3 million. Between 2000 and 2010, Jakarta added more than 7,000,000 residents, one of the largest population gains of any city in history. Should this growth continue, and the population of Tokyo-Yokohama begin to decline, the largest city in the world could be Jakarta by 2030. Jakarta is also the largest city in size in the southern hemisphere, stretching beyond its city limits, into the regencies of Tangerang, Bogor, Bekasi and Karawang to  the large independent cities of Tangerang, South Tangerang, Depok, Bekasi and Bogor.

    Delhi, India’s capital, is not only the third largest city in the world, but is also the largest in India (25.7 million). That may be surprising, since Mumbai (Bombay) was the largest in India for decades and had been widely touted to become the world’s largest city. Delhi spreads from the National Capital Territory of Delhi into the states of Haryana and Uttar Pradesh. These areas include the modern edge city technology hubs of Gargaon and Noida (Figure 2).

    Seoul-Incheon is the fourth largest city in the world, with 23.6 million residents, Seoul-Incheon spreads from the core municipality of Seoul into suburban Gyeonggi and the independent municipality of Incheon. The core city of Seoul has stopped growing, and approximately 60 percent of the population is in the suburbs.

    Manila is the fifth largest city, with 22.9 million residents. Manila slipped from the fourth position according to recently obtained Philippine national statistics authority population projections. However, Manila continues to be one of the world’s fastest growing megacities and can be expected to pass Seoul-Incheon in the next few years. Manila spreads from the National Capital Territory into the adjoining provinces of Cavite, Laguna, Rizal and Bulacan.

    Sixth ranked Mumbai is a new entry to the top 10, with 22.9 million residents. The Mumbai urban area has been redefined to incorporate adjacent urban areas, which explains its larger population relative to last year. Mumbai extends from the municipality of Mumbai into the districts of Thane and Raighar.

    The sixth largest city is Karachi in Pakistan’s with 22.8 million residents. This population estimate is the least reliable among the largest cities. Pakistan’s last population census was nearly 20 years ago, and had been scheduled for March 2016. As of publication, the census has been postponed and no new date set.

    Shanghai dropped to the number eight position from sixth place last year. Shanghai’s population is estimated at 22.7 million residents. Like many cities across China, population growth has dropped substantially during this decade. Recently, the Shanghai city government announced that the population had fallen slightly over the last year, ending three decades of dramatic population growth in the last three decades. The Shanghai urban area is almost completely confined to the municipality of Shanghai, but has minor extensions into the provinces of Jiangsu and Zhenjiang.

    New York is the ninth largest city, with a population of 20.7 million. New York is the largest built-up urban area outside Asia and covers the largest land area of any urban area. New York extends into Long Island and the Hudson Valley in the state of New York, Connecticut and New Jersey. New York had been the world’s largest city before Tokyo, a distinction that it had held since 1925, when it surpassed London (now 33rd largest).

    The 10th largest city of Sao Paulo, with a population of 20.6 million. Sao Paulo is a new addition to the top 10, Latin America’s largest city and the core municipality. Sao Paulo stretches from its large core city in all directions, with approximately half of the population in the suburbs.

    Two cities fell out of the top 10, Beijing and Guangzhou-Foshan. Like Shanghai and some other cities of China, newer population estimates indicated a substantial decline in growth rates. Beijing is now the 11th largest city in the world, while Guangzhou-Foshan is 13th largest.

    Mexico City is ranked 12th largest in the world. Mexico’s capital has experienced a roller coaster ride in urban area rankings since the middle of the last century. In 1950, Mexico City ranked 17th in the world, according to United Nations estimates. By 2000, Mexico City was second in the world to only Tokyo Yokohama. During the period of its greatest growth, in the late 20th century, it was common to hear that Mexico City would eventually be the largest in the world (as was the case with Mumbai, above) but its once frenetic growth has cooled considerably.

    Los Angeles has also had its ups and downs. It is substantial growth in the first half of the 20th century brought Los Angeles from virtually nowhere to 12th largest in the world by 1950. As in Mumbai and Mexico City, there were those who expected Los Angeles to become the largest city in the world. By 1965, Los Angeles was the sixth largest city, trailing only Tokyo Yokohama, New York, Paris, London and Osaka Kobe Kyoto. Now, Los Angeles has fallen to 19th position and not only is unlikely to ever be the largest city in the world or even in the United States.` The 5 million population gap compared to New York in 2016 is little different from 1990.

    Distribution of Population

    Much has been made of the fact that the world now has more than one half of its population living in urban areas. More than one analyst has misunderstood this as meaning that the norm for world residents looks like Fifth Avenue in New York, central London or Paris or the huge shantytowns of Mumbai or Dhaka. In fact, however, most urban residents live in nothing like such environments (See: What is a Half Urban World?).

    Only 8.2 percent of the world population lives in megacities (built-up urban areas with more than 10 million population. In contrast nearly a quarter lives in cities of more than 1 million population, including the megacities. A larger 30 percent of the world population lives in urban areas under 1 million population, which includes the smallest towns. Rural areas still have nearly 46 percent of the world population (Figure 3).

    Most of the large built-up urban area population lives at densities between 4,000 and 10,000 per square kilometer, or approximately 10,000 to 25,000 per square mile. These population densities are typical in parts of Asia, Africa and South America. Another one quarter of the population lives at densities of below 4,000 per square kilometer or approximately 10,000 per square mile. These densities are principally found in Europe, North America and Oceania (principally Australia and New Zealand). Slightly less than one quarter of the population lives at higher densities, above 10,000 per square kilometer or 25,000 per square mile. These densities are largely limited to certain Asian and African nations, such as Bangladesh, the Democratic Republic of the Congo and Pakistan (Figure 4).

    The Future

    As has been noted before, much of the population growth in the world will be in Africa over the next century. However, in the next few decades the greatest urban population growth seems likely to be in Asia, where 57 percent of the large urban area population lives. Even with declining growth rates, such as in China, many millions more  rural residents are expected to continue moving into China’s  cities .

    Note on Availability

    The full Demographia World Urban Areas and its components can be downloaded as follows:

    Full Report:

    Demographia World Urban Areas

    By Component:

    Demographia World Urban Areas- Index

    Photograph: Cover of Demographia World Urban Areas: 12th Annual Edition

    Wendell Cox is principal of Demographia, an international pubilc policy and demographics firm. He is a Senior Fellow of the Center for Opportunity Urbanism (US), Senior Fellow for Housing Affordability and Municipal Policy for the Frontier Centre for Public Policy (Canada), and a member of the Board of Advisors of the Center for Demographics and Policy at Chapman University (California). He is co-author of the “Demographia International Housing Affordability Survey” and author of “Demographia World Urban Areas” and “War on the Dream: How Anti-Sprawl Policy Threatens the Quality of Life.” He was appointed to three terms on the Los Angeles County Transportation Commission, where he served with the leading city and county leadership as the only non-elected member. He served as a visiting professor at the Conservatoire National des Arts et Metiers, a national university in Paris.