Category: Urban Issues

  • The Sun Belt Is Rising Again, New Census Numbers Show

    From 2009-11, Americans seemed to be clustering again in dense cities, to the great excitement urban boosters. The recently released 2015 Census population estimates confirm that was an anomaly. Americans have strongly returned to their decades long pattern of greater suburbanization and migration to lower-density, lower-cost metropolitan areas, largely in the South, Intermountain West and, most of all, in Texas.

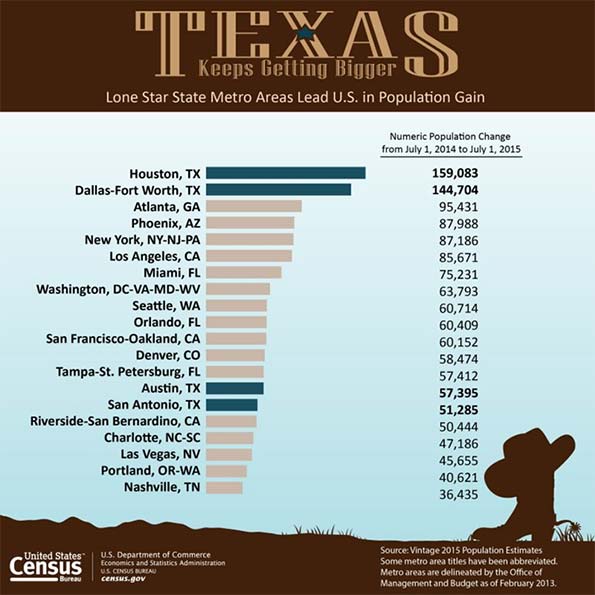
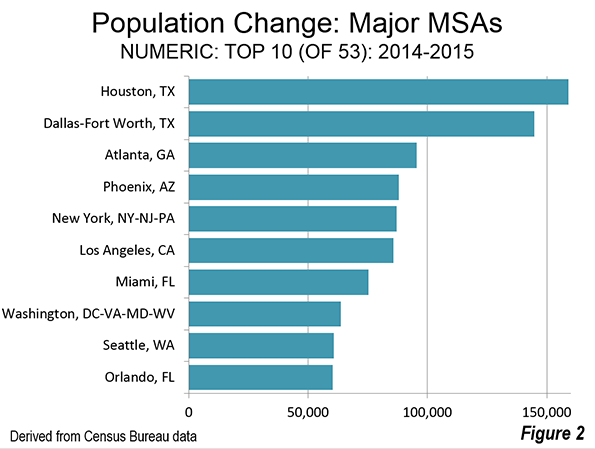
    Among the nation’s 53 largest metropolitan statistical areas, the two biggest population gainers between July 1, 2014, and July 1, 2015, were Houston and Dallas-Ft. Worth, together adding roughly 300,000 people. Their growth, in absolute terms, was larger than that of both Los Angeles and New York, which, respectively, are nearly two and three times as populous, notes demographer Wendell Cox. Two other Sun Belt metropolitan areas, Atlanta and Phoenix, also added more people over the year to July 2015 than L.A. and New York.

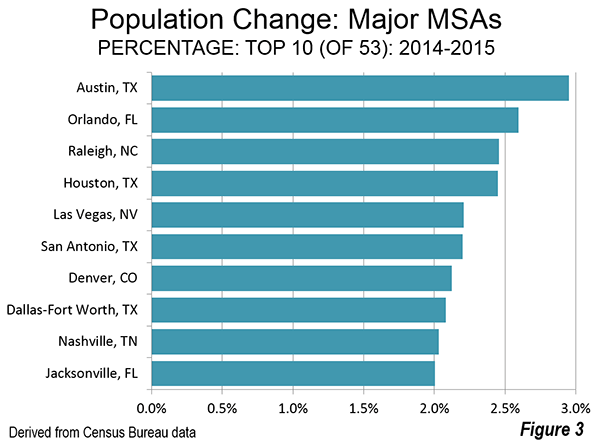
    The divergence in growth is even greater when expressed in percentage terms. Of the 10 fastest-growing metro areas in the country, all but two were located in the old Confederacy. Austin ranks first, with 3.0%  growth, followed by Orlando, Fla. (2.6%), and Raleigh (2.5%). Other fast-growing southern metro areas included San Antonio, Texas (2.2%); Nashville, Tenn.; and Jacksonville, Fla. (both 2.0%). The fastest growers outside the South are Denver (2.1%) and Las Vegas (2.2%), the latter of which is now clearly back from the dead.

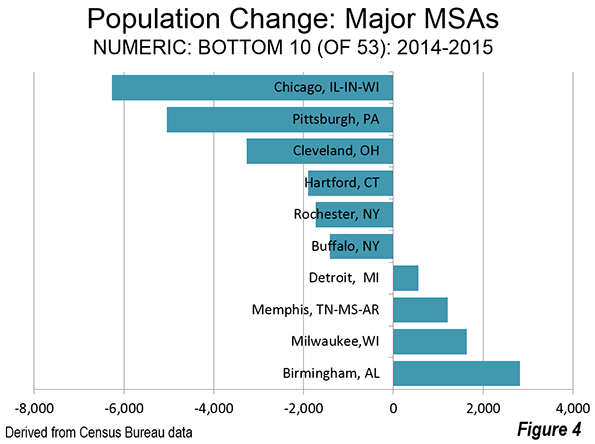
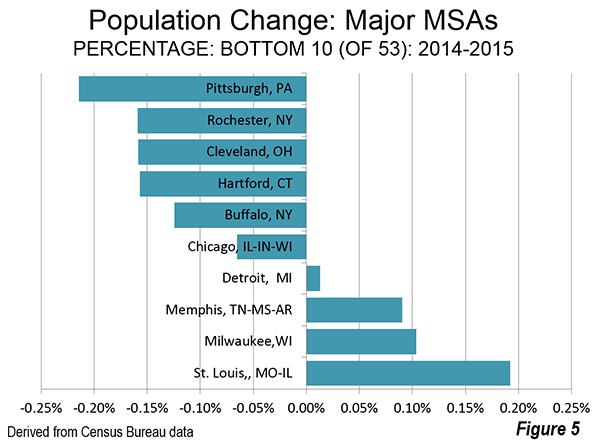
    The old big cities aren’t all losing people. New York and Los Angeles’ populations grew as well, 0.43%  and 0.65%, respectively, but that’s well below the overall U.S. population growth rate of 0.79% over the same span. Some metro areas, notably Chicago, Pittsburgh, Rochester, Hartford, Cleveland and Buffalo suffered slight losses, while many others, such as St. Louis, Memphis, Milwaukee and Detroit remained essentially stagnant.

    Critically, the most recent patterns confirm longer-term trends. Most of the cities at the top of the list are also the ones that have been growing fastest since 2000, led by Raleigh, Austin, and Las Vegas. Also in the top 10 since 2000 are the other three big Texas cities, Phoenix, Charlotte, Orlando and one California metro, largely exurban San Bernardino-Riverside. The slowest growth also follow a similar pattern, with Chicago, several Rust Belt cities, as well as Los Angeles and New York, all in the bottom quintile in percentage terms.

    Where Americans Are Moving

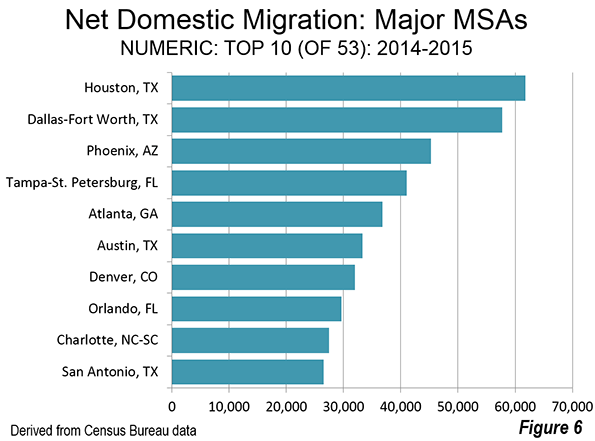
    To look ahead to where America will be growing in the future, perhaps the best indicator is net domestic migration. This measures where people are moving, essentially taking their skills, purchasing power and capital with them. Houston and Dallas-Fort Worth enjoyed the largest net gains from domestic migration, roughly 60,000 each, from July 1, 2014, to July 1, 2015, followed by Phoenix, Tampa-St. Petersburg, Atlanta and Austin. The Sun Belt, once written off as doomed by the urbanist punditry, is clearly back.

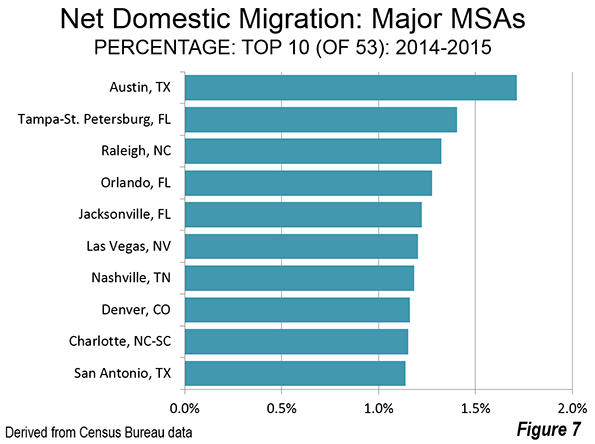
    In percentage terms, Austin led the nation, with a population expansion of 1.7% from net domestic migration. The top 10 cities in percentage terms are all in the Sun Belt (Tampa-St. Petersburg ranked second, followed by Raleigh, Orlando and Jacksonville) or the Intermountain West (Denver and Las Vegas).

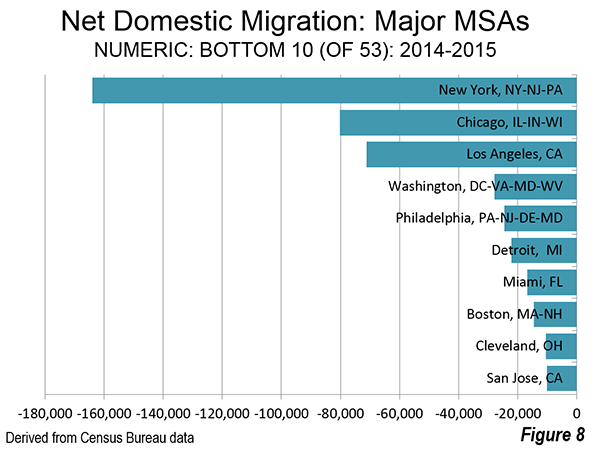
    The biggest losers in overall domestic migration are New York (-164,000), Chicago (-80,000) and Los Angeles (-71,000). In percentage terms, Chicago suffered the biggest losses, followed by New York, Hartford, Memphis and Milwaukee. Despite the explosive growth in Silicon Valley,   San Jose ranked 9th in percentage loss, just behind 10th place Detroit.

    In looking at these trends, the Atlantic’s Derek Thompson, one of the more savvy Census watchers, recently suggested that “it’s 2006 again” as people head out to the Sun Belt metros. When international migration is added to the mix along with the domestic migration numbers, the top five gainers remain in the Sun Belt, led by Houston and Dallas-Fort Worth, which are also becoming meccas for immigrants.

    These trends predate the recession. Since 2000, the biggest migration winners in percentage terms are Raleigh, Austin, Las Vegas, Charlotte, Phoenix, and Orlando. In total numbers since 2000 it’s also a familiar list, led by places like Phoenix (net gain: 705,000), Dallas-Ft. Worth (569,000), Atlanta (547,000), Riverside-San Bernardino (513,000) and Houston (496,000).

    The biggest losers are also familiar, led by the New York metropolitan area, which has lost 2.65 million net migrants since 2000, followed by Los Angeles (negative 1.65 million) and Chicago (down 880,000). Remarkably the two metro areas that have benefited the most from the digitization of the economy are in the loser’s column; between them San Jose and San Francisco lost over 550,000 domestic migrants since 2000.

    The Suburban Revival Continues

    The other big finding from the new estimates: suburbs are back. In the wake of the housing bust it was widely predicted that the ‘burbs were doomed by high gas prices, millennial preferences and a profound shift of employment to the core cities. The New York Times NYT -0.08% evenpublished fantasies on how the suburban carcass could be carved up, envisioning suburban three-car garages “subdivided into rental units with street front cafés, shops and other local businesses” while abandoned pools would become skateboard parks.

    As  economist Jed Kolko has noted, the much celebrated era when core cities grew faster than suburbs — the immediate 2009-2011 aftermath of the recession — turned out to be remarkably short-lived. From July 2014-July 2015, only seven out of 53 core cities added more domestic migrants than their suburbs. Of these, the District of Columbia (Washington) could be considered high density urban; the other five core counties are functionally more suburban than urban (Phoenix, Raleigh, Richmond, Sacramento and San Antonio).

    Overall domestic migration continues from the core cities to the suburbs. Over the last year core counties lost a net 185,000 domestic migrants, while the suburban counties gained 187,000.

    Looking Ahead

    These trends are likely to continue as long as the economy achieves even modest growth.  One big factor will be the migration of millennials, now headed increasingly to Sun Belt cities and suburbs. Since 2010,  among educated millennials, the fastest growth in migration has been to such lower-cost regions as Atlanta, Orlando, New Orleans, Houston, Dallas-Fort Worth, Pittsburgh, Columbus, and even Cleveland.

    This is largely a product of high housing prices. According to Zillow, rents claim upward of 45% of income in Los Angeles, San Francisco, New York, and Miami compared to less than 30% of income in places like Dallas-Fort Worth and Houston.  The costs of purchasing a house are even more lopsided: in Los Angeles and the Bay Area, a monthly mortgage takes, on average, close to 40% of income, compared to 15% nationally.

    Millennials are also headed increasingly to the suburbs. According to the National Association of Realtors, 80% of the homes purchased by millennials between 2013 and 2014 were detached houses, and 8% had chosen attached housing. This trend will accelerate in the next few years, suggests Kolko, as the peak of the millennial wave turns 30.

    Similarly immigrants — the other big driver shaping our future geography — are also moving increasingly to Sun Belt cities such as Houston, Dallas-Ft, Worth and Atlanta, as newcomers seek out both economic opportunities and lower housing prices. New York remains the immigrant leader, with the foreign-born population increasing by 600,000 since 2000, but second place Houston, a relatively newcomer magnet for immigrants, gained 400,000, more than Chicago and the Bay Area combined. The regions experiencing the highest growth in newcomers in percentage terms were Charlotte and Nashville, which each have seen their foreign-born populations double.

    In the coming decade, immigrants and millennials will produce the vast majority of the country’s children — and they increasingly sending them to school in the suburbs of Sun Belt cities. Central (urban core) areas lost substantial numbers of schoolchildren between 2000 and 2010, while school populations rose in newer suburbs and exurbs. Overall the child populations in cities such as Austin, Houston, San Antonio, Raleigh, Orlando and Nashville are on the rise while dropping in places like Los Angeles and Chicago, as well as some Rust Belt cities.

    America’s geography will be increasingly dominated by Sun Belt cities as well as suburbs. This challenges the preferred narrative among most planners and the mainstream media, as well as some developers who  believe more Americans desire to live in high cost, high density locales. Some day perhaps the facts — as seen both in this year’s numbers and longer term trends — will intrude on the narrative. Dispersion is back, and getting stronger. It’s time that developers, planners and the media adjust to the facts, rather than just reflect their prejudices.

    Population Change in the Nation’s Largest Metropolitan Areas, 2014-2015
    Change Rank Region 2014 Population 2015 Population 14-15 Change % Change
    1 Houston-The Woodlands-Sugar Land, TX  6,497,864 6,656,947 159,083 2.4
    2 Dallas-Fort Worth-Arlington, TX  6,958,092 7,102,796 144,704 2.1
    3 Atlanta-Sandy Springs-Roswell, GA 5,615,364 5,710,795 95,431 1.7
    4 Phoenix-Mesa-Scottsdale, AZ  4,486,543 4,574,531 87,988 2
    5 New York-Newark-Jersey City, NY-NJ-PA  20,095,119 20,182,305 87,186 0.4
    6 Los Angeles-Long Beach-Anaheim, CA  13,254,397 13,340,068 85,671 0.6
    7 Miami-Fort Lauderdale-West Palm Beach, FL  5,937,100 6,012,331 75,231 1.3
    8 Washington-Arlington-Alexandria, DC-VA-MD-WV  6,033,891 6,097,684 63,793 1.1
    9 Seattle-Tacoma-Bellevue, WA  3,672,866 3,733,580 60,714 1.7
    10 Orlando-Kissimmee-Sanford, FL  2,326,729 2,387,138 60,409 2.6
    11 San Francisco-Oakland-Hayward, CA  4,595,980 4,656,132 60,152 1.3
    12 Denver-Aurora-Lakewood, CO  2,755,856 2,814,330 58,474 2.1
    13 Tampa-St. Petersburg-Clearwater, FL  2,917,813 2,975,225 57,412 2
    14 Austin-Round Rock, TX  1,943,465 2,000,860 57,395 3
    15 San Antonio-New Braunfels, TX  2,332,790 2,384,075 51,285 2.2
    16 Riverside-San Bernardino-Ontario, CA  4,438,715 4,489,159 50,444 1.1
    17 Charlotte-Concord-Gastonia, NC-SC  2,379,177 2,426,363 47,186 2
    18 Las Vegas-Henderson-Paradise, NV  2,069,146 2,114,801 45,655 2.2
    19 Portland-Vancouver-Hillsboro, OR-WA  2,348,607 2,389,228 40,621 1.7
    20 Nashville-Davidson–Murfreesboro–Franklin, TN  1,793,910 1,830,345 36,435 2
    21 Boston-Cambridge-Newton, MA-NH  4,739,385 4,774,321 34,936 0.7
    22 San Diego-Carlsbad, CA  3,265,700 3,299,521 33,821 1
    23 Raleigh, NC  1,243,035 1,273,568 30,533 2.5
    24 Sacramento–Roseville–Arden-Arcade, CA  2,244,879 2,274,194 29,315 1.3
    25 Minneapolis-St. Paul-Bloomington, MN-WI  3,495,656 3,524,583 28,927 0.8
    26 Jacksonville, FL  1,421,004 1,449,481 28,477 2
    27 Columbus, OH  1,997,308 2,021,632 24,324 1.2
    28 San Jose-Sunnyvale-Santa Clara, CA  1,954,348 1,976,836 22,488 1.2
    29 Oklahoma City, OK  1,337,619 1,358,452 20,833 1.6
    30 Indianapolis-Carmel-Anderson, IN  1,971,861 1,988,817 16,956 0.9
    31 Kansas City, MO-KS  2,071,283 2,087,471 16,188 0.8
    32 Philadelphia-Camden-Wilmington, PA-NJ-DE-MD  6,053,720 6,069,875 16,155 0.3
    33 Salt Lake City, UT  1,154,513 1,170,266 15,753 1.4
    34 Richmond, VA  1,259,685 1,271,334 11,649 0.9
    35 New Orleans-Metairie, LA  1,251,962 1,262,888 10,926 0.9
    36 Baltimore-Columbia-Towson, MD  2,786,853 2,797,407 10,554 0.4
    37 Grand Rapids-Wyoming, MI  1,028,962 1,038,583 9,621 0.9
    38 Cincinnati, OH-KY-IN  2,148,450 2,157,719 9,269 0.4
    39 Louisville/Jefferson County, KY-IN  1,271,172 1,278,413 7,241 0.6
    40 Virginia Beach-Norfolk-Newport News, VA-NC  1,717,853 1,724,876 7,023 0.4
    41 Tucson, AZ  1,004,244 1,010,025 5,781 0.6
    42 St. Louis, MO-IL  2,806,191 2,811,588 5,397 0.2
    43 Providence-Warwick, RI-MA  1,609,533 1,613,070 3,537 0.2
    44 Birmingham-Hoover, AL  1,142,823 1,145,647 2,824 0.2
    45 Milwaukee-Waukesha-West Allis, WI  1,574,115 1,575,747 1,632 0.1
    46 Memphis, TN-MS-AR  1,342,914 1,344,127 1,213 0.1
    47 Detroit-Warren-Dearborn, MI  4,301,480 4,302,043 563 0
    48 Buffalo-Cheektowaga-Niagara Falls, NY  1,136,642 1,135,230 -1,412 -0.1
    49 Rochester, NY  1,083,678 1,081,954 -1,724 -0.2
    50 Hartford-West Hartford-East Hartford, CT  1,213,225 1,211,324 -1,901 -0.2
    51 Cleveland-Elyria, OH  2,064,079 2,060,810 -3,269 -0.2
    52 Pittsburgh, PA  2,358,096 2,353,045 -5,051 -0.2
    53 Chicago-Naperville-Elgin, IL-IN-WI  9,557,294 9,551,031 -6,263 -0.1

    This piece originally appeared in Forbes.

    Joel Kotkin is executive editor of NewGeography.com. He is the Roger Hobbs Distinguished Fellow in Urban Studies at Chapman University and executive director of the Houston-based Center for Opportunity Urbanism. His newest book, The Human City: Urbanism for the rest of us, will be published in April by Agate. He is also author of The New Class ConflictThe City: A Global History, and The Next Hundred Million: America in 2050. He lives in Orange County, CA.

    Photo by telwink.

  • “Texas Keeps Getting Bigger” The New Metropolitan Area Estimates

    The United States Census Bureau has just released its 2015 population estimates for metropolitan areas and counties. Again, the story is Texas, with the Bureau’s news release headline reading: Four Texas Metro Areas Collectively Add More Than 400,000 People in the Last Year. The Census Bureau heralded the accomplishment with a ”Texas Keeps Getting Bigger” poster, which is shown below. The detailed data is in the table at the bottom of the article.

    Fastest Growing

    Texas has four of the nation’s major metropolitan areas (over 1,000,000 population), and all of them ranked in the top 20 (out of 53) in population gain between 2014 and 2015. Houston again was number one, with a gain of 159,000, Dallas-Fort Worth followed in second place, gaining 145,000. The gap between Dallas-Fort Worth and Houston was small, only 10 percent. However, the gap between the third largest city (Atlanta) and Dallas-Fort Worth was more than 50 percent

    Austin and San Antonio were also in the top 20. Austin gained 57,000 residents, and again was the fastest growing major metropolitan area in the nation (3.0 percent). San Antonio added 51,000.

    This represents something of a return to pre-Great Recession normalcy, with Atlanta adding the third most population (95,000) and Phoenix adding 88,000. These two metropolitan areas were hard hit in the housing bust, but are seeing a return of substantial growth. New York, which is far larger than any of the top four, took fifth place, adding 87,000 (Figure 2).

    On a percentage gain basis, all four Texas metropolitan areas were in the top 10. Austin was again the fastest growing. Houston was 4th, San Antonio 6th and Dallas-Fort Worth 8th. Two other of the national best performers in percentage population growth were also high on the list, including #3 Raleigh and #5 Las Vegas. Las Vegas was the fastest growing major metropolitan area through most of the 2000s. When Las Vegas stumbled late in the 2000s, Raleigh assumed the top position. Denver ranked 7th, the only non-southern metropolitan area in the top 10 (Figure 3).

    Slowest Growing (or Losing)

    The Chicago metropolitan area had the largest population loss, at 6,000. This was the second straight year of losses for Chicago, though last year’s was much smaller. Chicago, at 9.55 million residents will need to reverse this performance if it is ever to add the 450,000 people necessary to make it a megacity of over 10 million. Chicago’s weather is not the most inviting and the state of Illinois’ dismal fiscal position (rated by one source as the second worst run in the nation) is not likely to attract the job creating investment necessary to population growth.

    Five other metropolitan areas experienced losses, including Pittsburgh, Cleveland, Hartford, Rochester and Buffalo. Not all of the South is growing either with both Memphis and Birmingham residing in the bottom 10 (Figure 4).

    Pittsburgh lost the largest percentage of its population, followed by Rochester, Cleveland, Hartford, Buffalo and Chicago (Figure 5).

    Domestic Migration: Top 10

    The four Texas cities all showed up on the top 10 in numeric net domestic migration gain as well. Houston added 62,000 net domestic migrants, followed by Dallas-Fort Worth and 58,000. Phoenix ranked third, Tampa St. Petersburg ranked fourth and Atlanta ranked fifth. Austin was sixth in net domestic migration and the other Texas City, San Antonio, ranked 10th (Figure 6).

    Austin led the nation in the percentage of population growth from net domestic migration, at approximately 1.7 percent. Tampa St. Petersburg ranked second, followed by Raleigh, Orlando and Jacksonville (Figure 7).

    Domestic Migration: Bottom 10

    By far the largest net domestic migration loser was New York, which lost 164,000. Chicago lost 80,000, and Los Angeles lost 71,000. It was a substantial drop to the fourth largest loser, Washington at 28,000,   closely followed by Philadelphia at 24,000 and Detroit at 22,000 (Figure 8).

    Chicago had the largest percentage loss of any major metropolitan area from net domestic migration, at 0.83 percent, slightly more than New York’s 0.82 percent. Hartford, Rochester and Memphis ranks from 3rd to 5th, all losing 0.6 percent from net domestic migration or more. Milwaukee, Los Angeles, Virginia Beach, San Jose, Detroit and Cleveland all lost between 0.5 percent and 0.6 percent to net domestic migration (Figure 9).

    Ranking Changes

    There were a few changes in the rankings this year. Washington passed Philadelphia to assume the sixth largest position. Philadelphia, which was the fourth largest metropolitan area in the nation in the early 2000’s has fallen to seventh, having also been passed by both Dallas-Fort Worth and Houston. Denver overtook St. Louis, to assume the 19th position. Orlando passed both San Antonio and Pittsburgh to become the 24th largest metropolitan area. Even while falling behind Orlando, San Antonio past Pittsburgh. Las Vegas overtook Kansas City and became the 29th largest metropolitan area. Austin passed both Indianapolis and San Jose.

    Milestones were also set by Miami, which rose to above 6 million population, while Columbus and Austin grew to more than 2 million. Perhaps the bigger surprise was a milestone not reached. Had recent trends continued, Honolulu would have become the 54th metropolitan area to reach 1 million population. However, Honolulu fell short by 1300 residents.

    Return to the City: The Elusive Illusion

    Despite the popular lore one hears at a Starbucks in Manhattan or reads in some ever-hopeful core city-centric news outlets, people are still moving to the suburbs. There is no doubt that urban cores, especially close to downtown areas (central business districts) are doing better than before, in no small measure because crime rates have fallen so much (Thank you, Rudi Giuliani).

    In all, 22 core counties out of 53 added net domestic migrants. But only y seven added more domestic migrants than the corresponding suburbs. Of these, only one is dominated by high density urbanization, the District of Columbia (Washington). Another, New Orleans, continues its recovery from the huge hurricane population losses. The other five core counties are functionally more suburban than urban (Phoenix, Raleigh, Richmond, Sacramento and San Antonio).

    But, overall, domestic migration continues from the core cities to the suburbs. That has been the case even in the worst year for suburban growth (2010-2011) and continued in 2014-2015. Core counties last year lost a net 185,000 domestic migrants, while the suburban counties gained 187,000.

    Conclusion

    With the release of 2015 population estimate data, halfway between the 2010 and 2010 census, the nation is settling back into a pattern of suburban southern and western growth.

    Major Metropolitan Area Population Estimates: 2015
    Population 2014-2015
    Rank Metropolitan Area 2010 2014 2015 % Change 2014-2015 Net Domestic Migration Rank: Domestic Migration
    1 New York, NY-NJ-PA     19,601     20,095     20,182 0.43% -0.82%           52
    2 Los Angeles, CA     12,844     13,254     13,340 0.65% -0.54%           47
    3 Chicago, IL-IN-WI       9,471       9,557       9,551 -0.07% -0.84%           53
    4 Dallas-Fort Worth, TX       6,453       6,958       7,103 2.08% 0.83%           14
    5 Houston, TX       5,948       6,498       6,657 2.45% 0.95%           12
    6 Washington, DC-VA-MD-WV       5,667       6,034       6,098 1.06% -0.46%           42
    7 Philadelphia, PA-NJ-DE-MD       5,971       6,054       6,070 0.27% -0.40%           40
    8 Miami, FL       5,586       5,937       6,012 1.27% -0.28%           36
    9 Atlanta, GA       5,304       5,615       5,711 1.70% 0.66%           16
    10 Boston, MA-NH       4,565       4,739       4,774 0.74% -0.31%           38
    11 San Francisco-Oakland, CA       4,345       4,596       4,656 1.31% 0.19%           22
    12 Phoenix, AZ       4,205       4,487       4,575 1.96% 1.01%           11
    13 Riverside-San Bernardino, CA       4,244       4,439       4,489 1.14% 0.16%           23
    14 Detroit,  MI       4,291       4,301       4,302 0.01% -0.51%           44
    15 Seattle, WA       3,449       3,673       3,734 1.65% 0.43%           17
    16 Minneapolis-St. Paul, MN-WI       3,356       3,496       3,525 0.83% -0.23%           32
    17 San Diego, CA       3,104       3,266       3,300 1.04% -0.29%           37
    18 Tampa-St. Petersburg, FL       2,789       2,918       2,975 1.97% 1.41%             2
    19 Denver, CO       2,554       2,756       2,814 2.12% 1.16%             8
    20 St. Louis,, MO-IL       2,790       2,806       2,812 0.19% -0.27%           33
    21 Baltimore, MD       2,716       2,787       2,797 0.38% -0.31%           39
    22 Charlotte, NC-SC       2,224       2,379       2,426 1.98% 1.15%             9
    23 Portland, OR-WA       2,232       2,349       2,389 1.73% 0.91%           13
    24 Orlando, FL       2,140       2,327       2,387 2.60% 1.28%             4
    25 San Antonio, TX       2,153       2,333       2,384 2.20% 1.14%           10
    26 Pittsburgh, PA       2,357       2,358       2,353 -0.21% -0.28%           35
    27 Sacramento, CA       2,155       2,245       2,274 1.31% 0.41%           18
    28 Cincinnati, OH-KY-IN       2,118       2,148       2,158 0.43% -0.12%           31
    29 Las Vegas, NV       1,953       2,069       2,115 2.21% 1.20%             6
    30 Kansas City, MO-KS       2,014       2,071       2,087 0.78% 0.04%           26
    31 Cleveland, OH       2,076       2,064       2,061 -0.16% -0.51%           43
    32 Columbus, OH       1,906       1,997       2,022 1.22% 0.26%           19
    33 Austin, TX       1,728       1,943       2,001 2.95% 1.71%             1
    34 Indianapolis. IN       1,893       1,972       1,989 0.86% 0.05%           25
    35 San Jose, CA       1,842       1,954       1,977 1.15% -0.52%           45
    36 Nashville, TN       1,676       1,794       1,830 2.03% 1.18%             7
    37 Virginia Beach-Norfolk, VA-NC       1,680       1,718       1,725 0.41% -0.52%           46
    38 Providence, RI-MA       1,602       1,610       1,613 0.22% -0.28%           34
    39 Milwaukee,WI       1,557       1,574       1,576 0.10% -0.54%           48
    40 Jacksonville, FL       1,349       1,421       1,449 2.00% 1.22%             5
    41 Oklahoma City, OK       1,258       1,338       1,358 1.56% 0.66%           15
    42 Memphis, TN-MS-AR       1,326       1,343       1,344 0.09% -0.60%           49
    43 Louisville, KY-IN       1,238       1,271       1,278 0.57% 0.02%           28
    44 Raleigh, NC       1,137       1,243       1,274 2.46% 1.32%             3
    45 Richmond, VA       1,210       1,260       1,271 0.92% 0.19%           21
    46 New Orleans. LA       1,196       1,252       1,263 0.87% 0.19%           20
    47 Hartford, CT       1,214       1,213       1,211 -0.16% -0.74%           51
    48 Salt Lake City, UT       1,092       1,155       1,170 1.36% -0.04%           29
    49 Birmingham, AL       1,129       1,143       1,146 0.25% -0.09%           30
    50 Buffalo, NY       1,136       1,137       1,135 -0.12% -0.46%           41
    51 Rochester, NY       1,080       1,084       1,082 -0.16% -0.70%           50
    52 Grand Rapids, MI          990       1,029       1,039 0.94% 0.09%           24
    53 Tucson, AZ          982       1,004       1,010 0.58% 0.02%           27
    Total   170,895   178,063   179,875 1.02% -0.52%
    In 000s
    Data from Census Bureau


    Wendell Cox is principal of Demographia, an international pubilc policy and demographics firm. He is a Senior Fellow of the Center for Opportunity Urbanism (US), Senior Fellow for Housing Affordability and Municipal Policy for the Frontier Centre for Public Policy (Canada), and a member of the Board of Advisors of the Center for Demographics and Policy at Chapman University (California). He is co-author of the "Demographia International Housing Affordability Survey" and author of "Demographia World Urban Areas" and "War on the Dream: How Anti-Sprawl Policy Threatens the Quality of Life." He was appointed to three terms on the Los Angeles County Transportation Commission, where he served with the leading city and county leadership as the only non-elected member. He served as a visiting professor at the Conservatoire National des Arts et Metiers, a national university in Paris.

    Cover picture: Census Bureau ”Texas Keeps Getting Bigger” poster (poster is used at the top and also as the first figure)

  • Why You Should Think Twice Before Building a Rail Transit System

    The Washington Metro system was shut down completely for a day recently to allow crews to inspect all of the power cables in the system. They found 26 cables and connectors in need of immediate repair.

    This is just the latest in a series of safety problems and breakdowns that have plagued the system.

    Metro has a large unfunded maintenance liability. This doesn’t surprise us because we expect American transit systems to have a backlog.

    The difference is that unlike NYC, Chicago, Boston, etc., which have systems a century old, the Washington Metro system is actually new.

    The oldest part of the Metro opened in 1976. That means Metro is 40 years old – max. Much of it is actually newer than that.

    Forty years after opening, Metro already faces a maintenance crisis.

    This should give other regions pause when it comes to building a rail transit system. My colleague Alex Armlovich points out that NYC has more or less been on a 40 year refresh cycle, with two rounds of major system investment since the subways opened. This doesn’t seem out of line as a capital life heuristic to me.

    So cities need to keep in mind that if they build a rail system, they not only have to pay to build it, they pretty much have to pay to rebuild it every 40 years. This is a challenge because as we see it’s easier to muster the will to build something new than to maintain something you already have.

    Given the huge permanent capital outlays implied by rail transit, you only want to build it where there’s sufficient value to justify it. Washington unquestionably achieves this. It simply hasn’t been able to capture the value into a maintenance revenue stream, plus Metro (like many systems) has been badly mismanaged.

    The problem comes in for cities that aren’t NYC, Chicago, Boston, Philly, DC, and San Francisco. Once you get below that group, the value starts becoming more debatable.

    Exhibit A is Los Angeles, which has spent untold billions on a huge rail system as ridership actually declined.  LA is continuing to build more and more rail.

    But what happens when this system is old?

    LA’s Red Line opened in 1993, so is 23 years old.  By the time LA finishes its current rail build out, it’s likely that the original parts of the system will be coming into the zone for a major capital refresh.

    Thus shortly LA will find itself in a perpetual capital catchup cycle starting in only a couple decades. This possibly may not happen, but it has happened everywhere else, so why should LA be different?

    Given the ridership levels we’ve seen so far, will the value added from rail vs. the old bus approach be there? It’s not looking good. And if the case in LA is looking weak, certainly smaller and less dense places are even more speculative.

    All these smaller cities investing billions into rail had better hope their projections of massive benefits come true, because all too soon the rebuild bill will start coming due.

    If you don’t believe me, just ask Washington.

    Aaron M. Renn is a senior fellow at the Manhattan Institute, a contributing editor of City Journal, and an economic development columnist for Governing magazine. He focuses on ways to help America’s cities thrive in an ever more complex, competitive, globalized, and diverse twenty-first century. During Renn’s 15-year career in management and technology consulting, he was a partner at Accenture and held several technology strategy roles and directed multimillion-dollar global technology implementations. He has contributed to The Guardian, Forbes.com, and numerous other publications. Renn holds a B.S. from Indiana University, where he coauthored an early social-networking platform in 1991.

    Photo Credit: Ben Schumin – CC BY-SA 3.0

  • Rethinking America’s Cities’ Success Strategy

    This piece is reprinted from a Kauffman Foundation series focusing on the role of cities in a new entrepreneurial growth agenda. Read the entire cities series here.

    Most cities are economically weak actors with limited ability to affect the critical forces driving their economies. Furthermore, changes in the structure of the economy often have changed the composition of urban leadership in ways that break the link between personal and community success and create an additional bias in favor of subsidized real estate development as a civic strategy. Less dependent on the local market, this local leadership increasingly identifies with a global community and its concerns in ways that have lowered the civic priority placed on inclusive economic development and entrepreneurship. To change these trends, local leadership should focus on inclusive local economic success first and make policies that reflect that priority and address areas where local government can make an impact. Creating an entrepreneur- and business-friendly local regulatory environment is a key piece of this effort, and the delivery of high-quality basic public services is vital.

    Cities as economically weak actors

    One of the most important preliminary steps to designing and implementing policies that promote entrepreneurial growth is understanding the economic and competitive context within which such policies are made. The STEEP (Social, Technological, Economic, Environmental, and Political) forces model is one method of inventorying and categorizing a business’s or community’s external context. The table below summarizes some of the key STEEP forces that create both challenges and opportunities for communities today.


    This list includes quite an array of profound and powerful forces that are difficult to understand and even more challenging to address. They are also primarily large macro forces that cities are not in a position to influence in a significant way, leaving most cities in a weak market position. Generally, local governments are weak actors and are more often market takers than market makers; they typically have limited scope for fundamentally transformative actions. Local policymakers must undertake efforts that respond to the economic context where there is a possibility of making an impact with the tools available.

    Ramsin Canon, a progressive political commentator in Chicago, describes this challenge and Chicago’s lack of pricing power in an article about his city, titled, “Entrepreneur-in-Chief: The New Model City:”1

    Why not raise property or luxury taxes, or institute a city income tax, to make up the deficit? Why not divert money from the TIF districts? …. Chicago is no longer a political community, it is an economic entity that is in competition with other cities in the region, in the state, across the world. In that mental framework, tax is cost, or price. You raise prices, you drive away your clients. In the case of the neoliberal city, the client is the developer, the investor, the employer. The federal government and the state are not going to give the city any real money; they are not investing in infrastructure, or education, or social welfare in any real way, the way they did up through the late 1970s and 1980s. The name of the game is “growth” through enticement of capital.— Ramsin Canon

    While one may not agree with Canon’s politics, his economic analysis insightfully illustrates how even many large cities today have become structurally weak players in the economic market.

    Most of the STEEP forces above have been discussed extensively elsewhere, but there are two under-appreciated and related items that deserve more consideration because of the impact they’ve had on local leadership: (1) the change in composition of local leadership resulting from the nationalization of the industrial base, and (2) the elite identification with global rather than local concerns.

    Changes in local leadership resulting from the nationalization of industry

    While talk of globalization is ubiquitous, less appreciated is the intermediate nationalization of many industries. Up until the 1980s, most cities’ commercial activities were conducted by local entities across a wide range of industries. In banking, for example, local banks dominated each city because state laws heavily restricted expansion. These banks were all independently owned, restricted to their home markets by branch banking rules, and limited in their activities by the Glass-Steagall Act. Similarly, most electric and gas utilities were local concerns due to restrictions from the Public Utilities Holding Company Act. And local and regional retailers, particularly department stores, were prominent and, often, dominant.

    This industrial structure produced a class of leaders whose business and personal successes were tied closely to the economic success of the local community. The only way to make more loans or sell more electricity, for example, was to grow the local market. There was, therefore, a high degree of alignment between business leadership and community interest.

    Beginning in the 1980s and especially the 1990s, however, deregulation and a wave of industrial rollups created a very different landscape ruled in many places by national players. The four largest banks in the country now hold about 45 percent of total national banking assets.2 There also has been significant utility consolidation. And, in retail and other industries, we have seen consolidation into a de facto “two towers” model, in which there are two large, national, primary players (e.g., Wal-Mart and Target, Home Depot and Lowe’s, Walgreens and CVS, and AT&T and Verizon).

    As a result, there is no longer local ownership over these key businesses in most markets, and the executives running local markets are effectively branch managers. Even where local firms survived, they did so largely by becoming larger national or global entities themselves. There is now, therefore, less overlap between the interests of business leadership and community economic growth; the nationalization of industry weakened the linkage between personal success and community success for local civic leadership.

    This broken link is exacerbated by the imbalance it created in the mindset of local business leadership. In the past, the business leadership was made up of a significant number of executives of operational-type businesses, such as banks and utilities, whose successes were tied closely to the success of the local market. Today, however, the businesses that continue to operate at the local level are primarily transactional businesses, including law firms (which are currently in early-stage consolidation), construction firms, architects, developers, and the “business” of politics. There are significant differences between operational and transactional businesses and their relationships to the community. While banks make money on the spread between what they pay for funding and what they charge for loans, lawyers, by contrast, get paid by the hour for work on specific matters. Bankers are making money while they are playing golf in the afternoon. Lawyers are only making money on the golf course if they are closing deals. Transactional business leaders’ interests are less closely aligned with the success of their communities.

    Lawyers and other local transactional business leaders always have been very influential, but there are no longer as many powerful bankers and other operating industry executives to balance their perspective. This imbalance has led to a transactional growth mindset among local leaders, which leads to a theory of change for the local economies that favors real estate development. The change from an operational to a transactional mindset, in other words, has introduced an additional bias in favor of publicly subsidized real estate projects as a strategy for growth. These projects satisfy the needs of a large segment of the transactional leadership class of the community, as well as the politicians who love cranes and ribbon cuttings. More broadly, real estate development is now seen as economic development.

    To be sure, major downtown development-type real estate projects, such as stadiums, malls, and convention centers, long have been popular for cities and may even be seen as populist projects. Mayors are under pressure to be seen as taking action to create jobs and growth, and, as this type of land development is within local control, it always will retain some popularity. Increasingly, however, these projects appear to be more pure play cronyism, with enormous subsidies bringing dubious public benefit. Cincinnati’s NFL stadium deal, for example, was described by The Wall Street Journal in a news (not editorial) item as “one of the worst professional sports deals ever struck by a local government.”3

    Identification of local elites with global, rather than local, interests

    In addition to weakening the link between the success of business leaders and that of their broader communities, the consolidation and globalization we’ve seen in many industries has resulted in a new affinity between the local elite and those who hold similar positions throughout the world. As business leaders and other elites are no longer as invested in their communities and have fewer economic ties to them, they identify primarily with their global class and have more loyalty to their global brethren in other places than to those who live in the same local region.

    Saskia Sassen, a pioneer in research on what are now called “global cities,” identified this trend in her description of the bifurcation of these regions. The global city, in this view, is a kind of city within a city. Richard Longworth at the Chicago Council on Global Affairs noted a similar trend: “Globalization is disconnecting a city from its hinterland.”4 The global city of the Chicago Loop and North Side, for example, exists in an almost parallel universe to those left behind in the South and West Sides.

    The term “elite” may seem inherently pejorative, but all systems have a group of leaders and agenda setters. At the local level, the elite includes prominent business, political, civic, academic, religious, and philanthropic leadership, as well as members of the media and cultural communities. The most educated strata of the community, or, more broadly, the upper middle class, also may be included. This group has best adapted to new economic realities and represents roughly the top 10 percent to15 percent of most communities, though higher in the largest urban centers.

    While this elite group is now more disconnected from the rest of a community, attracting and retaining this stratum is now often seen as critical to a region’s success. Richard Florida’s “creative class” theory maintains the importance of this group to local economic growth. Similarly, CEOs for Cities, an urbanist organization, released a report called “The Young and the Restless,” which suggests that the youth portion of this group is fickle, demanding, and highly mobile. A failure to cater to their desires, the report indicates, might harm a city’s economic future severely.5 This phenomenon is the human capital side of Canon’s description of the city as an economic entity.

    In this worldview, servicing the needs of the community’s elite and attracting more people like them is paramount to a particularly desired form of economic success. This strategy is not necessarily rooted in elitism or snobbery. Rather, communities facing enormous pressure from the STEEP forces above are looking to replicate models of success and finding their models in places like New York and San Francisco. While gentrification has been criticized, one can point to plenty of places where it has happened successfully. Meanwhile, there is little track record of success turning around non-elite portions of post-industrial cities. No wonder, then, that cities look to strategies that appear to offer the prospect of success, with the added benefit of some glamour, instead of going against the grain and trying to tackle problems that are much harder and lack obvious solutions.

    The consequence of this worldview, however, is that local leadership prefers to implement policies that show that their city belongs in the global club, rather than focusing on primarily local concerns. The priorities of the global community are set in the world’s major cities, including London, New York, San Francisco, Paris, and Hong Kong, among many others. These communities are very different from workaday American cities. It’s difficult to see how the same policies would suit such diverse places as Los Angeles, Buffalo, Oklahoma City, and Portland equally. While there is a clear need to spend more money on transit in New York City, for example, spending large sums to attempt to retrofit smaller and entirely auto-oriented cities to transit makes little sense.

    Furthermore, these major cities have, to some extent, market-making power, at least to a far greater degree than smaller localities do. A place like New York, for example, can implement the tactics that Canon says even Chicago cannot. It is no surprise that New York has far higher taxes than Chicago does, since New York has more marketplace leverage.

    Following a global, rather than a local, piper works well in many cases. For example, most local tech startups around the country are following the same script that appears to be effective, including open collaboration, co-working, meetups and events, angel investors, local venture capital funds, and local marketing groups. Similarly, aspirational locals opening top-quality coffee shops and microbreweries legitimately enhance their communities.

    This strategy can cause problems, however, as smaller cities may see quite different results when they try to prove their global bona fides by implementing the policies and priorities of global cities, especially those related to economic regulation and those that do not align with local needs. For example, America’s coastal cities are adopting very high minimum wages, and local progressives in cities with far less leverage than San Francisco often want to implement the same policy. Furthermore, it should be noted that global cities themselves are not without challenges, including growing inequality, which is an enormous problem in these places. In Chicago, we saw the juxtaposition of the opening of a gorgeous Riverwalk downtown on a Memorial Day weekend in which fifty-six people were shot and twelve of them killed.6

    Perhaps the greatest disconnect between the elites’ concerns and the localities’ needs is in the area of climate change. The quintessential global problem, climate change is particularly ill-suited to be addressed at the local level. No city alone could make a material impact on climate change, even if it eliminated all of its carbon emissions. Nonetheless, climate change is a core concern of the global class, and the fact that this issue drives policy and regulatory mandates in many cities is a powerful illustration of city elites’ global identification. These policies don’t align well with many smaller cities’ weak market power, and, more importantly, these smaller cities are poorly positioned to thrive under these policies.

    Even the global cities, in fact, have very particular economic structures and participate in specific global networks. Although globalization has produced a type of surface homogeneity among cities, Sassen points out that each city is truly unique. Similarly, Berkeley economist Enrico Moretti has identified a “great divergence” between cities.7 America’s cities are said to all look basically the same, but there are many different typologies, and each place has its own particular characteristics.

    Ultimately, the identification of community elites with global communities rather than local communities leads policymakers to imitate other localities’ efforts instead of thinking about the unique policy priorities for a particular city that are based on its own indigenous history, economy, culture, demographics, and geography. Civic policy at the local level is dominated by “school solutions” that promote the same characteristics everywhere, often as a way of signaling that a city belongs in the “club.” While companies try very hard to convince their audiences that they are different and better than other companies in their industries,8 most cities try to look exactly the same as other cities that are considered cool, including offering bike lanes, coffee shops, microbreweries, a creative class, a food scene, and a startup culture. Even most cluster analysis seems to produce primarily a collection of the same five basic focus areas in every region (high tech, life sciences, green industry, advanced manufacturing, and logistics). Instead, local thinking should play a critical role in policy setting. Copying some good attributes can be helpful, but it’s hard to be successful with a collection of borrowed ideas. Cities need locally tailored policies and unique, indigenous thinking based on the cities’ singular histories, economies, cultures, demographics, and geographies.

    How to think about local entrepreneurship and economic growth

    In light of all these factors, it is unsurprising that economic results have been meager in the aggregate, but good in select high-end sectors. To improve results throughout the country, I propose that local governments should apply the guidelines listed below to their economic development policies.

    1. Local civic priorities should favor building a successful and inclusive local economy, including entrepreneurship, over global concerns and real estate development.
    2. Policies should be made considering the totality of the environmental context (STEEP).
    3. Policies should be oriented toward areas in which local governments can have the most impact, given the contextual constraints that have been identified.
    4. Policies should be designed to fit each city’s unique situation.

    Because cities are all distinct, there is no one-size-fits-all solution. Some focus areas, however, do appear to be broadly applicable. For example, local communities can’t do much to affect global trade policy, but they largely can control local regulations and zoning. Reducing red tape is frequently discussed, but seldom accomplished to any significant degree. Rather than solely focusing on cutting regulations, local governments should make sure the operations of the regulatory structure are clear, predictable, transparent in their operations (not politicized), and timely. The most important factor of production in almost any business is management time and attention; owners and managers want to be able to get through compliance quickly so that they can focus on—or even simply start—their businesses.

    Local governments also are directly responsible for delivering an array of basic and critical services, including parks, libraries, policing, and streets, among many others. Getting these basics right throughout a city or region, rather than simply having a few select world-class districts, is important to inclusive success. These core services provide the basic platform on which businesses operate and are the actual business of local government. They must be performed well.

    There may be other appropriate actions, depending on each city’s particular local needs and opportunities. The key is to determine what policies and actions to undertake with a high priority on inclusive economic success for the local community based on where the best opportunities are for local actors to make a difference.

    The most important shift that needs to occur in cities is one of mindset. The civic elite and upper middle class of our cities need to see their communities as the places where they live, not see themselves primarily as part of a community of their peers in other cities and around the world. They must ask themselves the oldest questions: Who is my brother? Who is my neighbor? And, local leadership needs to see all of the people of their community, not just the upscale portion of them, as those to whom they owe first allegiance.

    Aaron M. Renn is a senior fellow at the Manhattan Institute, a contributing editor of City Journal, and an economic development columnist for Governing magazine. He focuses on ways to help America’s cities thrive in an ever more complex, competitive, globalized, and diverse twenty-first century. During Renn’s 15-year career in management and technology consulting, he was a partner at Accenture and held several technology strategy roles and directed multimillion-dollar global technology implementations. He has contributed to The Guardian, Forbes.com, and numerous other publications. Renn holds a B.S. from Indiana University, where he coauthored an early social-networking platform in 1991.

    Endnotes

    1. Canon, Ramsin. “Entrepreneur-in-Chief: The New Model City.” Gapers Block. January 4, 2013.
    2. Federal Deposit Insurance Corporation. 2012. FDIC Community Banking Study.
    3. Albergotti, Reed, and Cameron McWhirter. “A Stadium’s Costly Legacy Throws Taxpayers for a Loss.” The Wall Street Journal, July 12, 2011.
    4. Longworth, Richard. Caught in the Middle: America’s Heartland in the Age of Globalism.
    5. Coletta, Carol, and Joseph Cortright. “Wanted: The Young and Restless.” The Washington Post, February 13, 2006.
    6. http://www.chicagotribune.com.htmlhttp://chicago.curbed.com.php.
    7. Moretti, Enrico. The New Geography of Jobs.
    8. Apple, for example, once had an ad campaign called “Think Different.”

    Photo by caruba

  • Mass Transit Expansion Goes Off The Rails In Many U.S. Cities

    Journalists in older cities like New York, Boston or San Francisco may see the role of rail transit as critical to a functioning modern city. In reality, rail transit has been a financial and policy failure outside of a handful of cities.

    In 23 metropolitan areas that have built new rail systems since 1970, transit’s share of commuting — including all forms, such as buses and ferries — has actually slipped a bit, from an average of 5.0 percent before the rail systems opened to 4.6 percent in 2013. The ranks of those driving alone continue to grow, having increased 14.4 million daily one-way trips since 2000, nearly double transit’s overall daily total of 7.6 million, according to Census Bureau data.

    Virtually all the actual increase in rail commuting has occurred in the “legacy cities”: New York, Boston, San Francisco, Washington, Chicago and Philadelphia. These are older cities built around well-defined cores that were developed mostly before the automobile. Together the core cities of these metro areas, excluding the suburbs, accounted for 55% of all transit work trips in the nation in 2014, according to the latest American Community Survey data. Overall, transit’s work trip market share in these six metropolitan areas rose from 17 percent to 20 percent between 2000 and 2014. In the entire balance of the country, where most of the new rail systems have been built, transit’s market share is only 2.2 percent, up a scant 0.2 percentage points since 2000, according to Census Bureau data.

    Manhattan alone, in fact, accounts for more than 40 percent of all rail commuters in the nation. New York is the only U.S. city where more than 20 percent of workers labor in the central business district (downtown). In most cities, the percentage is less than half of that, and in many others, even smaller. In Los Angeles, less than 3 percent of employment is downtown. In Dallas only 2 percent of metropolitan employment is downtown. In Houston, where numerous large companies maintain headquarters, it’s still only 6.4 percent.

    For transit to work effectively, employment needs to be concentrated. This explains why between 2013 and 2014, New York accounted for a remarkable 88 percent of the total increase in train commuting. But what works for Brooklynites headed to Union Square does not generally work so well for people living in our increasingly dispersed metropolitan areas. Indeed in most cities — Dallas-Fort Worth, Houston, San Diego, and even the new urbanist mecca of Portland, according to 2015 American Community Survey data, where new transit lines have been put in, it has failed to increase the share of commuters who take public transportation, and in some cases the actual ridership has dropped.

    It has even failed where cities are booming and their downtowns flourishing. Houston’s light rail system opened in 2004, but has done little to change the car-dominated commuting pattern of America’s energy capital. Between 2003 and 2014, Harris County’s population grew 23 percent, but transit ridership decreased 12%, according to American Public Transportation Association data. This means that the average Houstonian took 30 percent fewer trips on the combined bus and light rail system in 2014 than on the bus-only system in 2003.

    The Next Great Transit City

    Nowhere is the transit mania more profound than in Los Angeles, a city progressive blogger Matt Yglesias describes as “the next great transit city.”

    There seems to be a conscious strategy of making auto commuting in Los Angeles and the rest of California so unpleasant as to force people into transit. Mayor Eric Garcetti has made bold predictions that commuting times will drop in half, largely by people moving from cars to trains. Of course this is folly, since transit commuting generally takes considerably longer than commuting by car. The Governor’s Office of Planning and Research has called for putting all California on “a road diet,” meaning that traffic will simply continue to worsen. This in a state which has among the worst roads in the country – 68 percent of which are in poor or mediocre condition.

    Can rail solve or mitigate congestion? L.A. has already spent over $15 billion on rail yet this has proven less than effective in either boosting transit ridership or lessening congestion.

    Since 1980 before the rail expansion the percentage of Los Angeles County commuters who take transit has actually dropped from 7.0 to 6.9 percent while the transit share of the combined statistical area has dropped from 5.1 to 4.7 percent. Even the total numbers of riders is heading down. Recently the transit booster Los Angeles Times published statistics that showed that there were now 10 percent fewer boardings on the Los Angeles MTA system than in 2006, and that the decline was accelerating.

    One reason for the poor performance is that much of the train ridership turns out to have been former bus travelers in the first place, which limits actual gains there. Taxpayers, however, should be screaming about this switchero; the subsidy for new L.A. new bus riders, who tend to be the poorest of the poor, cost taxpayers $1.40 while the cost for a new rail rider was $25.82 over the period of 1994 to 2007. If you believe in transit as public good, clearly building more trains makes less sense than expanding bus operations.

    But it’s not just a cost issue. Los Angeles is a vast and dispersed metropolis in which only one in five residents even lives within the city limits, and even much of the city — notably the San Fernando Valley — is essentially suburban in form. Transit travel takes much more time to get to work than the car, even on the region’s miserable roads and overcrowded freeways. With downtown only a minor employment center, people increasingly travel there for cultural events, sports or even a restaurant, not for work.

    Other factors also seem to be contributing to the decline. One is the trend toward working at home; in 2014, the number of Angelinos working at home surpassed the number taking transit. Although this saves more energy, and produces less carbon than transit ridership, there is virtually no government support for this innovative approach to traffic reduction from the climate-obsessed state government.

    Finally, there are now other options such as Uber and Lyft, which provide reasonably priced door to service, always available, often on short notice. Down the road, the path for transit looks even bleaker with the development of self-driving cars, which will make even long suburban commutes easier. Looked at objectively, the drive for a traditional transit dominated Los Angeles is on a collision course with reality.

     Taking Stock and Changing our Approach

    In the alternative world that dominates our transit planners and retro-urbanists, nothing succeeds like failure. Some urban experts still predict that the Sun Belt cities are ripe for a huge infusion of rail transit, despite all evidence to the contrary.

    Given what we know about the share of commuters using transit in most cities, pumping money into this form of transportation seems doubly wrong while other needs such as roads, schools, sewers and parks are neglected. Rather than try to fit all cities, and all parts of metropolitan areas, into a 19thcentury technology, maybe we should look to encourage 21st century innovation.

    Clearly some of this is already with us, notably in the rise of services like Uber and Lyft which, for many, seems a far more effective way of getting around with your own car. Ride-sharing and services like Zipcar also provide new alternatives. And other innovations could be developed, with expanding shuttle and dial-a-ride services. In many big cities dedicated commuter buses, connecting the dispersed employment centers, would make great sense in cities such as Houston, which has many large employment centers, notes my Center for Opportunity Urbanism fellow, Tory Gattis.

    But it’s changing work patterns that may provide the most promising opportunities to reduce traffic and reduce greenhouse gases. In the U.S., working at home, not transit, was the principal commuting alternative to the automobile in 39 of the 53 major metropolitan areas with populations over 1 million as of 2014, according to Census Bureau data. The share of work access accounted for by home workers rose by more than a third between 2000 and 2014, from 3.3 percent to 4.5 percent

    Many of the most striking work at home share gains are taking place in the country’s leading technology regions, including Austin, Raleigh, the San Francisco Bay Area, Denver, Portland and San Diego. Millennials in particular, notes a recent Ernst and Young study, embrace telecommuting and flexible schedules more than previous generations did, in large part due to concerns about finding balance between work and family life.

    All this suggests we need to revamp our ideas of transit, particularly in the newer, fast-growing cities. Trains may elicit a nostalgic smile about the good old days, but most Americans, and the vast majority of our cities, need to live not in the past but in an increasingly dispersed, and choice-filled reality. Time to embrace that future.

    Joel Kotkin is executive editor of NewGeography.com. He is the Roger Hobbs Distinguished Fellow in Urban Studies at Chapman University and executive director of the Houston-based Center for Opportunity Urbanism. His newest book, The Human City: Urbanism for the rest of us, will be published in April by Agate. He is also author of The New Class ConflictThe City: A Global History, and The Next Hundred Million: America in 2050. He lives in Orange County, CA.

    Photo: Atlanta MARTA train by RTABus (Own work) [CC-BY-SA-3.0], via Wikimedia Commons

  • Japan Census 2015: Decline Less than Projected

    Headlines were recently made recently as Japan finally experienced a long predicted official decline in population. This is widely expected to be the beginning of a long decline in population, which the National Institute of Population and Social Security Research has projected will drop Japan’s population from its present 127 million to 43 million by 2100 (Chart). This loss equals or exceeds the population of all but 15 of the world’s nearly 200 nations, including Germany, the United Kingdom and France.

    Population projections are, of course, not an exact science. They can be accurate, or they can “miss by a mile.” The preliminary 2015 census figures indicate that the population loss since 2010 has been considerably less than predicted. Japan lost 950,000 residents since between 2010 and 2015,The previous 5-year census period had shown a gain of 280,000. Losing nearly a million population is a big deal. But losing 1.5 million would have been an even bigger deal, as had been projected by Japan’s National Institute of Population and Social Security Research. Over the past five years, Japan’s population loss was more than one-third less than expected (35 percent).

    The big question is “why?” The most obvious answer is a combination of factors, such as   more births than projected or a falling death rate. The Japanese enjoy long lives. In 2013, there were more people aged 100 or above than in the United States, despite, Japan’s 60 percent lower population. More than one in eight of the world’s centenarians live in Japan, while only one in sixty of the world’s people is Japanese.

    No analysis has been identified, nor is the detailed age data for such an analysis readily available. This is to be expected this soon after publication of the first census results. However, recent media reports indicate a continuing annual decline in births. The difference could also be the result of problems in the projection methodology.

    Actual and Projected Population by Area

    As had been the case in the last census period (2005-2010) Tokyo was the big winner. Tokyo prefecture (note), which contains the 23 ku (cities) that constituted the city of Tokyo until its mid-1940s dissolution as well as suburbs, was expected to gain 190,000 residents, but added 355,000. Overall, the four-prefecture area of Tokyo-Yokohama, which includes Tokyo, Kanagawa, Saitama and Chiba prefectures added more than 500,000 residents, compared to the expected 275,000. The gain in Tokyo-Yokohama was 1.4 percent, nearly double the 0.8 percent expected.

    The other two megacities (over 10 million population) did not do so well. Osaka-Kobe-Kyoto (Osaka, Hyogo, Kyoto and Nara prefectures), which is larger than the Los Angeles-Riverside combined statistical area, lost 140,000 residents, nearly as many as the 164,000 projected. Osaka-Kobe-Kyoto was expected to lose 0.9 percent of its population, and nearly equaled that, at minus 0.8 percent.

    Nagoya, including the prefectures of Aichi, Mie and Gifu, lost 13,000 residents, two-thirds the 19,000 projected. Nagoya lost 0.1 percent of its population, slightly better than the minus 0.2 percent projected.

    The middle-sized metropolitan areas did better. The prefecture of Fukuoka, which includes the nation’s fourth largest metropolitan area, Fukuoka-Kitakyushu was expected to lose 0.5 percent of its population, Instead it managed a 0.5 percent gain. Hiroshima was expected to lose 1.2 percent of its population and lost only one-half that much (minus 0.6 percent).

    The city of Sapporo, in Hokkaido prefecture, was a big winner more than doubling its projected 1.0 percent increase (Note 2). Sapporo had a population gain of 2.1 percent. Most of the Sapporo metropolitan area is in the city of Sapporo, and unlike many core municipalities, there is still room for greenfield development.

    Sendai, in Miyagi prefecture was particularly hard hit by the great earthquake and tsunami of 2011. That makes Sendai’s population performance all the more impressive. Sendai was projected to suffer a population loss of 1.8 percent. Yet, its population loss was two thirds less, at 0.6 percent.

    The balance of the nation even did better than expected. Outside the metropolitan areas listed above (and the city of Sapporo), Japan was expected to lose 2.7 percent of its population. The loss was somewhat more modest, at 2.4 percent.

    Government Concern

    Despite the better news out of the census, the government is taking the longer term population loss very seriously. Its Committee for the Future indicates that the prospect could be: “…impose a great burden on people that offsets economic growth, threatening to decrease the actual per-capita consumption level, or the metric for the actual quality and level of people’s lives.”

    Even Tokyo, which has escaped the effects of population decline will be at risk, according to the Committee: The Tokyo Metropolitan area, while unable to avoid the effects of hyper-aging, will lose the vitality of a global city…”

    The changing demographics are already evident in a near majority single person household population in the core Tokyo prefecture. In 2010, 46 percent of Tokyo prefecture households are single person, compared to just 32 percent at the national level, and 36 percent in Osaka prefecture, which has the second highest percentage, according to National Institute of Population and Social Security Research data. Moreover, Tokyo prefecture’s average household size, at 2.03 in 2010, was the lowest, by far in the nation, and well below the national average of 2.42. Like many core areas in the largest metropolitan areas around the world, Tokyo prefecture, less than the normal proportion of children is to be found.

    The government has established a goal of increasing the fertility rate from the present 1.4 (children per woman of child-bearing age) to 1.80 by 2030 and 2.07 by 2040. This would mean a population of 102 million in 2060, compared to the 87 million that current trends suggest. This would also eventually stabilize at around 90 million, more than double the presently projected figure of 43 million.

    Proposed government strategies have involved an array from expanding the use of paternity leave, making it easier for women to retain their jobs after childbirth, supporting better job security for younger people and extending to “support for matchmaking efforts by municipalities and local chambers of commerce.”

    More recently, the government has even hinted at encouraging immigration, which is a radical proposal for a nation that has generally not been welcoming of a large influx of foreigners: “In February 2014, the Cabinet Office revealed that Japan will likely only be able to maintain a population of more than 100 million if it accepts 200,000 immigrants annually from 2015 and the total fertility rate recovers to 2.07 by 2030.”

    There is much riding on Japan’s effort to halt or at least slow the decline of its  population. Other  nations, especially across East Asia and Europe, face similar difficulties, so Japan’s success or failure (and the latter seems more likely) could materially impact policies elsewhere in the decades to come.

    Note 1: Tokyo prefecture is officially called the Tokyo metropolis, which has led many, including some researchers to imagine it to be the metropolitan area. It is simply a jurisdiction within a metropolitan area more than three times as large.

    Note 2: The city of Sapporo is used, because Hokkaido prefecture is far too large to be a metropolitan area (labor market).

    Wendell Cox is principal of Demographia, an international pubilc policy and demographics firm. He is a Senior Fellow of the Center for Opportunity Urbanism (US), Senior Fellow for Housing Affordability and Municipal Policy for the Frontier Centre for Public Policy (Canada), and a member of the Board of Advisors of the Center for Demographics and Policy at Chapman University (California). He is co-author of the “Demographia International Housing Affordability Survey” and author of “Demographia World Urban Areas” and “War on the Dream: How Anti-Sprawl Policy Threatens the Quality of Life.” He was appointed to three terms on the Los Angeles County Transportation Commission, where he served with the leading city and county leadership as the only non-elected member. He served as a visiting professor at the Conservatoire National des Arts et Metiers, a national university in Paris.

    Photo: Sapporo (by author)

  • What Happens When Walmart Dumps You

    The first knock on Walmart was that it gutted the mom-and-pop businesses of small-town America. So what happens to those towns when Walmart decides to leave?

    What is the future of American retail? The keys might be found not only in the highly contested affluent urban areas but also in the countryside, which is often looked down upon and ignored in discussion of retail trends.

    Yet these small towns, as well as middle- and working-class suburbs, have produced many of the dominant trends in American retail, from discount chains to super-stores. So, too, could these communities create a new trend, as some of the former innovators, such as Walmart, have begun to close stores, leaving some towns and villages bereft of convenient, affordable retail.

    This year the world’s largest retail chain announced it was closing 154 stores, most of them “express” centers and other smaller stores that serve primarily small-town and urban markets, such as Oakland, California. The effect has been worst in poorer towns, notably in the Southeast and Appalachia, where there is little alternative retail in place.

    Walmart’s move, driven by flagging sales and profits, represents a shift away from the very working-class and small-town customers who drove its rise. It also reflects a growing disinterest among retailers in serving the nation’s beleaguered middle and working classes. One in six Walmart customers, notes one University of Michigan study, received food stamps in 2013, with an estimated average household income of $40,000 or less.

    In contrast, online shoppers, now a primary focus for Walmart, tend to be more affluent, with 55 percent of e-commerce shoppers living in households with incomes greater than $75,000. As Walmart and many other traditional “brick and mortar” stores have struggled with declining sales, online merchants have enjoyed an average growth of more than 11 percent annually since 2011. In this game, Walmart is clearly playing catch up.

    The other big Walmart bet seems to be superstores, which compete directly with ascendant retailers such as Costco. Yet these moves are crushing for smaller towns, who are generally too small to accommodate large centers. Say what you will about Walmart—historically low wages, mediocre selection, less than attractive stores—the Arkansas-based juggernaut brought affordable products from around the world to thousands of small communities and suburbs. Before then, smaller communities often were forced to either travel great distances to more urban locations or shop at small, often overpriced local stores.

    Back to the Futurem—and the Past?

    Now once again small towns are threatened with becoming desiccated islands cut off from the high-precision magnificence of American retail. In some cases, they might even become “food deserts,” cut off even from reasonably priced grocery items. This includes not only small towns but some hard-luck suburbs near major cities.

    No surprise then that some communities now resent Walmart for having essentially invaded Main Street, laid it to waste, and then abandoning it. Some places where Walmart have come in, such as Whitewright, Texas, a town of 1,600 in the northern reaches of the state, saw the retailer come in just last year, drive out of business some long-standing local stores, notably the longtime local grocery, and now, as part of its strategic change, leaving the town with little in the way of retail options.

    Tales of “the Walmart effect” on small towns, of course, are legion. In exchange for access to more affordable goods, communities sacrificed much that was unique—the local haberdasher, the mom-and-pop mini-department stores, the one-of-a-kind hamburger joint. In the 40 years after the first Walmart opened in Rogers, Arkansas, in 1962, the number of specialty retailers declined by 55 percent nationwide. In the same time period, the number of retail chain store locations , including Walmart, nearly doubled. Research conducted at Iowa State University in the ’90s found that, after a Walmart opened in a town, sales at specialty stores—sporting goods, jewelry, and gift shops—dropped by 17 percent within 10 years.

    Yet, fortunately, this may not prove to be the disaster that many predict. The new realities of retail, notably the inexorable shift toward online retail, suggests that rural communities and small towns are not as cut off as one might have expected. The ability to access Amazon in a small, remote Central Valley town in California is not much different from accessing Amazon in Los Angeles. For anyone even marginally computer literate, the retail world is more accessible than ever, but this time through a finger click than a stroll down the aisle.

    The Proliferation of Channels

    None of this suggests that the retreat of big boxes from smaller towns and some urban areas will be painless. Yet those who see this trend as the harbinger of the end of malls or Main Streets may be in for a surprise. Rather than die off, bricks-and-mortar shopping will change, adding new elements and moving from ever greater uniformity to more variety and differentiation, which are critical to independent business’s survival. Much of this change will take place in small towns, but also in suburban areas, which have long been the happy hunting ground of big boxes.

    Why not in the big cities? One of the chief ironies of our times is that chains and their attendant sameness now define much of our most sophisticated urban core—Starbucks on every corner, global brands and restaurants serving the same trendy cuisine. The recovery of large cities, suggests New York researcher Sharon Zukin, has also made them more alike by “bringing in the same development ideas—and the same conspicuous textual allusions and iconic corporate logos inevitably affixed to downtown architectural trophies—to cities across the globe.” Efforts to make the city “safer and less strange to outsiders’ eyes”—tourists, expatriates, media producers, and affluent consumers—are making one global city barely indistinguishable from another.

    At the same time suburbs and even smaller towns are becoming more diverse, and one of the chief causes of this diversity is the spread of millennials, with their own specific needs, into the peripheral areas surrounding core cities. This movement, once dismissed as inconceivable by some urbanists, is becoming more evident as census data show. And with more millennials entering their family-forming years, suggests economist Jed Kolko, this trend to suburbs and possibly smaller towns will only accelerate.

    The other great game-changer has been the rapid movement of ethnic minorities, particularly immigrants and their descendants, to suburbia. Roughly 60 percent of Hispanics and Asians already live in suburbs; more than 40 percent of non-citizen immigrants now move directly to suburbs. Between 2000 and 2012, the Asian population in suburban areas of the nation’s 52 biggest metro areas grew 66.2 percent, while in the core cities the Asian population expanded by 34.9 percent. Of the top 20 cities with an Asian population of more than 50,000, all but two are suburbs.

    As ethnics and millennials gather in suburbs and even small towns, we are starting to see the emergence of new retail forms in suburban areas. Orange County, California, for example, has long been seen as an area dominated by chains, and the largely suburban county is indeed sprinkled with scores of shopping centers, some of them massive, ranging from more working-class shopping centers in such cities as Orange or Santa Ana to more elite retail centers such as South Coast Plaza and Newport’s Fashion Island.

    Yet at the same time, the area is seeing the growth of new, unique retail districts that appeal to millennials, ethnics, and their descendants. Anaheim, for example, heretofore known for Disneyesque blandness, now features a thriving Packing District, a converted fruit-packaging structure now filled with numerous vendors, most of them local products such as confectionary, ethnic food and locally brewed beer. Several other projects, many in former office parks, have opened in places like Costa Mesa, drawing large numbers of suburbanites to unique agglomerations of smaller stores.

    Ethnic change is also transforming the retail environment in both suburbs and smaller towns. Throughout Southern California, Chinese, Korean, Vietnamese, and Mexican markets now proliferate. New developments in places like Irvine—now roughly 40 percent Asian—are filled with ethnic restaurants, shops, and boutiques. Similar trends can be seen in the emerging immigrant hubs, notably in Dallas-Fort Worth and Houston, but also in parts of New Jersey, Westchester, Northern Virginia, suburban Chicago, and in Seattle suburbs like Bellevue and Federal Way. Even the main street in Grand Island, Nebraska, home to meatpacking plants, is lined with, of all things, Honduran, Salvadoran, Mexican, and Haitian restaurants.

    At the same time, numerous suburban communities, particularly those with old downtowns dating from their agricultural pasts, have revived their own Main Streets. These areas may have a Walmart or Target nearby, or even adjacent, but now they also sport shopping, restaurant, and other cultural options, as well as an opportunity for promenading, once an important small-town activity. The list of communities doing this extends from places in Southern California—such as the old towns of Orange, Fullerton, and Laguna Beach—to older eastern towns like Montclair, New Jersey; Rockville Centre on Long Island; Naperville outside Chicago; as well as Carmel, Indiana. We may not be returning to Bedford Falls before the onslaughts of banker Henry Potter in It’s a Wonderful Life (1946), but smaller towns and suburban shopping area may prove far better able to adjust to the digital age than many suspect.

    Retail’s Increasingly Diverse Future

    Despite the erosion from online sales, the country’s retail structure is not about to go away. Even though overall department stores are doing poorly, as are some malls, many are also doing well, particularly in ethnic areas and more affluent suburbs. The importance of brick-and-mortar retail is still compelling enough that even Amazon may soon build its own physical bookstores; several other online sites have already done so.

    Of course, not all communities or Main Streets will thrive as the Walmarts and other large chains begin to cut back. There will indeed be many communities that continue to depopulate as younger people move away, and there is little hope that large retailers will come back to such places as markets dwindle and as more shoppers order online.

    Yet not all small towns, much less suburbs, face such a difficult future. Many smaller communities, particularly in attractive parts of the country, are beginning to see a wave of migration from aging boomers, who arrive with both significant cash and also often well-developed consumer tastes. Far more seniors, for example, retire to rural or semi-rural communities (PDF) than to urban districts. In certain areas—for example, Rocky Mountains towns, parts of inland California, and the hill country of Texas—may find their retail base growing, even if this means very different kinds of stores and services.

    Some small towns—and suburbs even more so—will be transformed by immigrants and millennials, who may want to set up their own unique shops along the very Main Streets once targeted by firms like Walmart. In wealthier communities, this may mean more boutiques and high-end restaurants. But among less affluent areas, other institutions, such as cooperatives—300 already nationwide and another 250 on the way, as well as farmers markets—could provide some of the products that many once found at Walmart.

    These changes may prove far more positive in the long run than many anticipate. A future with a slightly lower Walmart or other big-box footprint poses not just a challenge to communities once seen as unable to resist mass retailing but also a once in a lifetime opportunity. As the retail world become more digitally focused, and less big-box-dominated, there is a golden opportunity to restore the geographic and local diversity that has seemed doomed for nearly a half-century, but now may enjoy a new burst of life.

    This piece originally appeared in The Daily Beast.

    Joel Kotkin is executive editor of NewGeography.com. He is the Roger Hobbs Distinguished Fellow in Urban Studies at Chapman University and executive director of the Houston-based Center for Opportunity Urbanism. His newest book, The Human City: Urbanism for the rest of us, will be published in April by Agate. He is also author of The New Class ConflictThe City: A Global History, and The Next Hundred Million: America in 2050. He lives in Orange County, CA.

    Wal-Mart photo by Mike Kalasnik from Fort Mill, USA [CC BY-SA 2.0], via Wikimedia Commons

  • Suburban Sustainablity

    There’s a philosophical debate about what is “sustainable.” The two dominant camps tend to advocate on behalf of either the hyper efficient dense city or bucolic rural self sufficiency. Personally, I’m not a fan of either.


    The more finely tuned and efficient any system is the more vulnerable it is to disruption. There’s also an inevitable concentration of authority in large systems that doesn’t appeal to me.

    Screen Shot 2015-06-07 at 2.31.03 AM

    The picturesque farm out in the country has a romantic allure, but the reality is mostly isolation, lack of economic opportunity, and a stifling culture.

    Almost all of the built environment in North America is actually suburban which is neither fish nor fowl in terms of the urban/rural divide. And that isn’t going to change anytime soon.

    Screen Shot 2016-02-16 at 9.20.34 PM

    At the moment suburbs have none of the efficiencies of the urban core and none of the productive capacity of the countryside. Suburban residents are just as dependent on large centralized systems as people living downtown. Where does suburban food come from? Energy? Water? Where does suburban trash go? Sewerage? Who owns everything? (If you have a mortgage… the bank, not you.) A small family farm in the country can manage all these things right at home on a tight budget. But the average tract house is no different from a high rise apartment.

    Screen Shot 2016-02-17 at 1.12.42 PM

    Screen Shot 2016-01-30 at 10.24.54 PM

    That private vehicle that sits in the driveway appears to be a source of personal freedom unlike the city bus or subway. But the car is invisibly tethered to gas stations, pipelines, refineries, and ultimately to the oil fields of North Dakota, Venezuela, and Nigeria by way of massive corporations and no small amount of Big Government. Wall Street also finances these cars as well, so add that to the mix of dependencies. Suburbanites believethey’re more independent than city people. They aren’t.

    unnamed

    Screen Shot 2016-01-30 at 4.56.01 PM

    Screen Shot 2016-01-30 at 7.17.32 PM

    Screen Shot 2016-01-30 at 7.10.47 PM

    Screen Shot 2016-01-30 at 7.13.20 PM

    Segovia 054 (800x600)

    Screen Shot 2016-01-30 at 7.08.44 PM

    Historically this tension between efficient urbanism and rural productivity was resolved by building compact medium density towns that were immediately surrounded by farmland. Economic opportunity, high culture, and great efficiencies were baked in to every level of the built environment. Take a fifteen minute walk from the center of town and you’ll find water, grain, grazing livestock, orchards, and all other essentials for supporting the population. A two thousand year old settlement like this one in Spain demonstrates pretty clearly that this is a sustainable model. But how does it relate to American suburbs?

    Screen Shot 2016-01-30 at 5.29.30 PM

    Screen Shot 2016-01-30 at 5.29.11 PM

    Screen Shot 2016-01-30 at 10.03.43 PM

    Screen Shot 2016-01-30 at 10.04.38 PM

    Screen Shot 2016-01-30 at 10.04.57 PM

    Screen Shot 2016-02-18 at 12.40.44 AM

    Screen Shot 2016-02-01 at 2.27.06 AM

    Screen Shot 2016-01-30 at 10.24.23 PM

    The typical suburban home is surrounded by a modest patch of garden. Instead of growing a lawn (the largest single crop in North America) the land could be producing fresh food. Ornamental shrubs and specimen trees could just as easily be fruit bearing. No need to truck in refrigerated lettuce from 1,500 miles away. The supply chain is effectively reduced to a matter of feet. There’s no need for battery hens from a distant factory farm. This transforms a consumptive landscape into a productive property. No one is suggesting this is “self sufficient”. But it’s a huge step up from having a kitchen full of Lean Cuisine, Fruit Loops, and Go-Gurt from the supermarket.

    Screen Shot 2016-01-30 at 10.23.22 PM

    Screen Shot 2016-01-30 at 10.21.38 PM

    Screen Shot 2016-01-30 at 10.23.06 PM

    In addition to home gardens suburbia is full of places that can be transformed into community gardens. Every church, school, and vacant parking lot is a potential veggie patch or orchard.

    Screen Shot 2016-02-18 at 12.23.05 AM

    Screen Shot 2016-02-17 at 1.13.15 PM

    This solar water heater is the biggest bang for the green buck. A couple of tanks, some black boxes covered in glass, a little pump… and you’ve got free hot water for decades. The cheapest and greenest energy is always the power you don’t need to use in the first place.

    Screen Shot 2016-02-18 at 12.17.53 AM

    Screen Shot 2016-02-17 at 1.13.26 PM

    A modest number of photovoltaic panels can often provide nearly all the electricity for a suburban home, particularly if the house was first fitted with high efficiency lights and appliances. Combine this with loads of insulation, solar hot water, and a food garden and a suburban home begins to resemble a small family homestead in the country.

    Screen Shot 2016-01-30 at 10.58.30 PM

    Screen Shot 2016-01-30 at 10.56.36 PM

    Screen Shot 2016-01-30 at 2.14.11 PM

    Screen Shot 2016-01-30 at 2.14.28 PM

    Screen Shot 2016-01-30 at 2.14.46 PM

    Screen Shot 2016-01-31 at 2.44.44 AM

    Screen Shot 2015-09-09 at 11.58.24 PM

    The weakest aspect of suburbia has always been the impoverishment of the public realm. Suburbs are first and foremost about private space. In order to become more vibrant parts of the suburbs need to be activated with shared community spaces. These strip mall parking lot cafes may not resemble Paris, but they do the job in a straightforward cost effective manner. The food is good. The company is pleasant. Commerce and culture can start to take baby steps. If many more such places are allowed to gradually evolve and connect they might eventually turn in to something more refined and dynamic.

    Screen Shot 2016-02-01 at 2.52.37 AM

    Screen Shot 2016-02-01 at 2.53.06 AM

    There will always be people who prefer to drive no matter what. And the suburbs do provide serious challenges when it comes to alternative forms of mobility. Public transit rarely works well in dispersed sprawling environments. Honestly, I don’t think it’s worth even trying to serve most suburban neighborhoods with transit. But knitting together the viable parts of suburbia with bike infrastructure is so incredibly cheap that it’s worth doing in places where people value the option. Most folks may still drive, but they may not need to do it nearly as often if walking and biking are at least reasonable options.

    Screen Shot 2016-02-17 at 1.10.51 PM

    While I’m at it, I’d like to describe what isn’t sustainable. Massive solar arrays on suburban rooftops appear to be a step in the right direction. But look closer. This homeowner could have installed far fewer panels and spent the remaining money on added insulation and energy efficiency instead. But being frugal and productive was never really the goal here.

    Screen Shot 2016-02-17 at 1.12.17 PM

    Screen Shot 2016-02-17 at 1.11.46 PM

    Next to the sterile lawn are all sorts of toys that run on liquid fuels. I’m not saying people shouldn’t have playthings. I’m saying these items are expensive and disposable and were almost certainly bought on credit. The extended cab pick up truck has never seen a sheet of plywood, an eight foot length of pipe, or a bale of hay. It’s sport. Not utility. The speed boat isn’t exactly built for fishing. This is standard suburban debt and consumption. It’s fragile and unlikely to hold up well over the long haul.

    John Sanphillippo lives in San Francisco and blogs about urbanism, adaptation, and resilience at granolashotgun.com. He’s a member of the Congress for New Urbanism, films videos for faircompanies.com, and is a regular contributor to Strongtowns.org. He earns his living by buying, renovating, and renting undervalued properties in places that have good long term prospects. He is a graduate of Rutgers University.

  • Your City Is Not the Next Silicon Valley

    “No man needs sympathy because he has to work, because he has a burden to carry,” began Theodore Roosevelt, the U.S. president from 1901 to 1910. “Far and away the best prize that life offers is the chance to work hard at work worth doing.”

    No doubt, during Roosevelt’s time there was much work to do. In 1910, for example, nearly 40% of the country was still employed in agriculture. The percent of workers in industry—or manufacturing, construction, and mining—was at 30% and rising, driven by the revving of the Industrial Revolution.

    So, 70% of the country’s workforce made a living through labor. They made food to eat and the steel, railroads, cars, bridges, and buildings that modernized America.

    Cleveland was a prime benefactor. The manufacturing sector alone employed nearly 307,000 Clevelanders by 1967.

    But things changed. Labor-intensive industries matured, which ultimately means taking less people to produce more output. The percentage of the American labor force employed in agriculture stands at 2%, down from nearly 70% in 1840. This doesn’t mean we eat less food, but that technological advances have made the food sector ultra-efficient.

    Industry has been experiencing the same forces. Twenty percent of Americans are employed in manufacturing, mining, and construction. In the manufacturing sector, the national percentage is 8%, with Cleveland at 12%—down from 21% in 1990. Again, this doesn’t mean we don’t manufacture things— manufacturing output is at an all-time high nationally—it’s just that we need fewer people to produce more goods.

    Okay, so where do people work? The simple answer is services, or those sectors that make up the economy outside of agriculture and industry. Think legal, marketing, business, technology, education, healthcare, and hospitality. For instance, 20% of the nation worked in services in 1840. By 1960 that number was over 50%, before reaching nearly 80% by 2010.

    These numbers illustrate a shift in the U.S. economy over time, or from goods producing to service providing. To a large extent, these services are based on the production of ideas.

    Writing in the Harvard Business Review, the University of Toronto’s Roger Martin dubs this change the “rise of the talent economy”. Martin notes that in the 1960s, 72% of the top 50 U.S. companies owed their wealth to “the control and exploitation of natural resources.” Today, however, only 10% of the nation’s top companies are industry-based. Instead, over 50% of America’s companies are talent-based, such as Google, Apple, and Microsoft.

    “Over the past 50 years the U.S. economy has shifted decisively from financing the exploitation of natural resources to making the most of human talent,” writes Martin.

    Enter Silicon Valley. As Pittsburgh was to steel and Detroit to cars, Silicon Valley has been to the talent economy, particularly technology. It was there that the top minds clustered to design new-age circuits and microprocessors in the 1950s and 60s. It was also there that the best software engineers went to birth the internet, search engine, and social media in the 1990s and 2000s.

    On the backs of this talent came the wealth, not only the venture capital that has continually acted to “water” the region’s innovation, but also the rising wages of the workers. In fact, in Santa Clara, C.A., the county seat of Silicon Valley, the average salaried employee makes over $103,000 annually, approximately double that of Cuyahoga County employees and the U.S. workforce as a whole.

    The successes of Silicon Valley have led many regions to devise their own strategy to be a technology hub. Simply, there existed an “old” economy, so how does a region transition into the “new” economy, primarily one embodied by the high-end services and start-up culture of Northern California?

    Often, the tactics are rudimentary, like branding a part of your region as “Silicon X” so as to attract the components of a tech cluster. For instance, Philadelphia has “Philicon Valley” and New York has “Silicon Alley”, whereas New Orleans has “Silicon Bayou” and Portland has “Silicon Forest”. There’s “Silicon Swamp” in Gainesville, “Silicon Slopes” in Utah, “Silicon Harbor” in Charleston, and a variant of “Silicon Prairie” in Dallas, Chicago, Omaha, and Jackson Hole, Wyoming.

    Then, once you brand a part of your region “Silicon X”, the next step is to get the story out. A recent piece in Charleston Magazine entitled “The Rise of Silicon Harbor” is illustrative on this front. The author opens the piece by explaining that in Charleston there are “three local tech companies, all within three miles of each other”. The author then quotes a media outlet that states Charleston’s “Silicon Harbor is on its way to becoming the East Coast counterpart to California’s Silicon Valley”.

    This idea that your region can become the “next Silicon Valley”, well, its clickbait for online journalism—if only because folks wantto believe their hometown is the place of the future.

    For example, a recent Huffington Post piece hints “You Might Be Living in the Next Silicon Valley”. “Could Detroit become the next Silicon Valley?” echoes the industry magazine CIO. Meanwhile, a NewYorker piece is titled “How Utah Became the Next Silicon Valley”, while an Oklahoma story is headlined “Vision proposal aims at Tulsa being the next Silicon Valley”.

    Still, if everywhere is the next Silicon Valley, then nowhere is the next Silicon Valley. That’s the reality, and it’s important for cities to grasp it so they can plan their economic futures properly.

    “When it comes to tech, nobody can simply create the next Silicon Valley,” explains Aaron Renn, a Senior Fellow at the Manhattan Institute.

    “Just because a place has a number of startups doesn’t mean it’s destined to be a Silicon Valley,” Renn continued. “By all means celebrate a growing tech industry, but don’t get carried away.”

    But the bigger issue for regions looking for their economic future in Silicon Valley’s past is whether or not that’s even a sound strategy in the first place. Specifically, the tech economy is also a maturing, prone to the same job contractions, offshoring, and wage declines that hallmarked deindustrialization.

    According to data compiled by the Institute for Strategy and Competitiveness, four out of the top five tech clusters in the United States lost jobs from 1998 to 2013. San Jose, CA, the metropolitan area comprising Silicon Valley, led the way in contraction, going from nearly 160,000 tech jobs in 1998 to fewer than 74,000 in 2013—a decline of 54%. Telling, automotive employment in Detroit declined by less over the same time period, at 32%.

    These figures are in line with a new study out of Oxford University that found that while technology start- ups often create a lot of wealth, they are not good at creating many jobs. The study found that only 0.5% of the American workforce in 2010 were employed in industries that did not exist in 2000.

    “What I think the Oxford study is saying is that you’re not getting the kind of job growth from these kind of high-tech, high-growth, high-profitability startups that you had in the past,” said economist Jim Pethokoukis in the industry magazine Re/code.

    Why? A primary culprit is that tech jobs are becoming automated, just like farm and factory jobs before it. Specifically, tech companies over the last 15 years don’t need to hire as many people as they did in the 90’s because the software — loosely described as machines — is doing the work.

    For Jim Russell, the economic development blogger at Pacific Standard, the aging of the tech industry— Russell uses the term “tech convergence”—has echoes in the decline of industry. Russell discusses his life growing up on the run from macroeconomics, going from Erie, PA, to Schenectady, NY, to Vermont as his father, a General Electric engineer, tried to keep ahead of the wave of contractions.

    “He had an uncanny knack for moving our family just before the layoffs hit,” said Russell. “We were always racing to stay ahead of the economic restructuring.”

    Russell, whose wife is in tech sales, is experiencing the same game of cat and mouse today.

    “The tech industry enjoyed divergence until the end of the 1990s,” he’d note, explaining there were “fatter” times in emerging tech hubs like Boulder—where they’d lived.

    “But then the bubble burst,” Russell explained, “resulting in massive layoffs. Good friends were out of work.”

    Today, his family lives in Northern Virginia. That’s because it makes no economic sense for firms to house tech sales in Silicon Valley. This is partly due to the exorbitant cost of living in Northern California. But it is also due to the emergence of cloud computing, which has pushed tech everywhere— meaning tech hubs are increasingly nowhere.

    This maturation of tech has Russell wondering “whether Silicon Valley is the next Detroit”.

    Does this mean technology is no longer integral in regional economic growth? No. It just means the tech industry is changing. Detailing this change can both sharpen, if not make more realistic, a regional innovation strategy.

    According to the Manhattan Institute’s Aaron Renn, the issues boils down to this: “Do you have proprietary industry to marry to tech?”

    What Renn is getting at is the fact that tech in itself is a tool. It is by and large circuitry that allows access to information. But information is not knowledge. To give an example, information is the medical textbook, while knowledge is the application of information to become a heart surgeon. In other words, in what fields of applied knowledge can technology be tied to so as to further a given regional industry?

    Most recently, tech has been tied to the entertainment or leisure industry. “Silicon Valley started with tech for the sake of tech: making computers, search engines, and software,” says Cleveland technologist Eamon Johnson. “Now it’s 20-something dudes making solutions to replace what their mom did for them at home…laundry, food, rides around town, and recommendations on where to eat.”

    According to Johnson, the coming evolution of innovation is to use the next generation of computing power to go beyond tech’s capacity to distract or consume.

    “But techies need industry experts to give them problems so solutions can be worked on,” he says.

    This exactly what is happening in Cleveland with healthcare. Cleveland observes, treats, and innovates within the field human health like few other regions worldwide. As a result, the field of medical technology, or medtech, is gaining some traction in the region.

    This is evidenced by IBM’s recent acquisition of the Cleveland Clinic-spinoff Explorys, which is a “big data” health analytics firm. The company, based in Cleveland’s University Circle, is expanding its Cleveland office, perfecting its processes of how the region’s elite health “know-how” can be further mined through technology—thus creating more knowledge, and then more health innovation.

    These kind of developments are important. Medtech is still a frontier industry, and it fits in well with Cleveland’s area of specialization. So there’s plenty of room for a first mover advantage if the region can gets its medtech playbook right.

    Now, is medtech cool? Well that depends on your definition of “cool”. "You can work for a cool tech company with a texting app," said Explorys’ Charlie Lougheed to the Plain Dealer recently. "Or you can work for a company that improves health for millions of people."

    Returning to Teddy Roosevelt: that is a lot of work, and a lot of work worth doing.

    Richey Piiparinen is a Senior Research Associate who leads the Center for Population Dynamics at the Levin College of Urban Affairs at Cleveland State University. His work focuses on regional economic development and urban revitalization.

  • Why Jersey City is the New Brooklyn

    For hundreds of years, New York City has been viewed by Americans and foreigners alike as the default capital of the United States. Though not the official political capital city, New York, New York has been commonly viewed, and certainly among its own residents, as the de facto center for American culture, music, sports, food, and art.

    Although far more people migrate out of the New York area than come, it remains a primary destination for those who—in the words of Frank Sinatra—want to be a part of it.

    However, today being “a part of it”—particularly in Manhattan and the fashionista parts of Brooklyn—is a lot more difficult than it once was. It no longer involves just a suitcase and a dream. Those looking to move out to the Big Apple increasingly difficult, largely due to huge costs for housing.

    The chorus of complaints about skyrocketing real estate prices has become an ever growing occurrence in the area, as most New York City residents and newcomers alike struggle to make ends meet. For well over a decade Manhattan has been so popular, and so expensive, that the real estate boom has spread to other boroughs—in particular, the western reaches of Brooklyn, only a short subway ride from Manhattan.

    Once a significant and yet often ignored part of New York City, Brooklyn has for decades held its own identity within the city, usually in variance with more self-conscious Manhattan. However, in this most recent decade, we have seen a shift in that identity. Increasing gentrification and a multitude of new residents have transformed the area and created an unfortunate spike in house prices in their wake. An area that was once populated by longtime family residents and iconic brownstones, is now seeing giant penthouses selling for upwards of $4 million. In fact, as early as 2012, we were already seeing Brooklyn being labeled as the second most expensive place to live in the US.

    Brooklyn neighborhoods like Park Slope, DUMBO, Downtown and Williamsburg have seen an influx of new residents along with the resulting spikes in real estate prices. Even the recent trend of supertall residential buildings springing up throughout Manhattan has begun to infest Brooklyn, with developers planning new towers much taller than anything the borough has seen in the past. While longtime Brooklyn residents with rent-controlled and rent-stabilized properties, as well as current Brooklyn homeowners, have little to worry about, all of this is making for an increasingly prohibitive market for anyone hoping to move to the borough.

    The result of all of this has been a natural shift in the popularity of Brooklyn as a viable destination for new, young residents. So, while—not too long ago—Brooklyn was being touted as the new Manhattan, we are now seeing a rise in other cities vying to claim the coveted title of becoming the “new Brooklyn.” Of course, both of these New York boroughs will still remain popular, but generally younger people, at least those without jobs at Goldman Sachs or trust funds, simply cannot afford the new and skyrocketing prices required to make them their new home.

    Thus, with Manhattan and Brooklyn now both out of reach for many New York real estate shoppers, the much maligned state of New Jersey is suddenly becoming more appealing; and in particular, we are seeing the rise of the conveniently located municipality of Jersey City. Jersey City is located directly across the Hudson River from downtown Manhattan, and just like New York in the early 1990s the city is fast shedding its once dangerous reputation and emerging as an appealing option as a uniquely livable area.

    At one time, most residents of the area east of the Hudson River lumped Jersey City into “everything west of the Hudson.” In other words, it was dismissed out of hand immediately. However, more people are starting to learn that Jersey City is its own unique location, itself comprised of a number of distinct neighborhoods with individual charms and flavors. And most important of all, affordability.

    “Three or four years ago, when you would mention Jersey City to people who didn’t know the area, you’d get a concerned look,” Natalie Miniard, the owner of JCity Realty, told the New York Times, “now everybody wants to know more. It’s a much different conversation.”

    Generally the most desirable section of Jersey City for newcomers is downtown, thanks to its proximity to the Hudson River and concentration of trendy bars and restaurants. Popular spots here include the Jersey City location of Brooklyn’s Barcade, Skinner’s Loft, the Iron Monkey and the Roman Nose.

    And it’s convenient, too. Right in the middle of downtown Jersey City is the Grove Street PATH train station. Like every PATH station in Jersey City, Grove Street offers speedy service to several locations in Manhattan 24 hours a day, seven days a week. Unlimited monthly PATH cards are actually cheaper than monthly NYC subway Metrocards, and you can even use pay-per-ride Metrocards on the PATH. As an added bonus for residents, surrounding the Grove Street station is a pedestrian plaza which regularly hosts food fairs and street festivals.

    Of course, the gentrification train chugs on, and as with the more popular neighborhoods in Brooklyn, downtown Jersey City is already becoming so popular that many new residents are seeking even more affordable sections of the city. One such neighborhood is Journal Square, which is in close proximity to the Journal Square PATH station. Local flavor abounds in the Journal Square area, and prices in the neighborhood are still lower than downtown, despite being not too far in distance. A bit further from downtown Jersey City is the neighborhood known locally as the Heights.

    The Heights is a large section of Jersey City with plenty of lower priced options for real estate shoppers, thanks in part to being not quite as close to the PATH as Journal Square or downtown. However, the Heights is an area jam-packed with plenty of its own great shopping and local restaurants, especially along the main thoroughfare of Central Avenue. Most of the Heights is still within reasonable walking distance to the Journal Square PATH station, and walking from the Heights to the nearby city of Hoboken is also an option.

    With a variety of lively, singular neighborhoods and close proximity to Manhattan, Jersey City already boasts several parallels with the borough of Brooklyn. Though it cannot yet compete in terms of culture and “street cred,” developers are rushing to construct tens of thousands of new, affordable residential properties, hopping on the newest fashionable real estate bandwagon while it is still hot. What this means is that it is certainly the right time to move to Jersey City. Housing prices are lower across the board than in most sections of Brooklyn—and certainly anything in Manhattan—and the options for condos, rental apartments and even entire houses are multiplying by the day. And people are starting to take notice. An increasing influx of residence—according to the most recent US census data, the total number of residents increased by six percent between 2010 and 2014— revitalizing the cultural and social scene, and many more people are expected to soon follow. With all of this in mind, it would not be a surprise if in the next few years we find fewer people moving to New York City altogether, and many more looking to the exciting reborn metropolis of Jersey City.

    Cary is an Oregon native with a flair for fashion and organic gardening. She’s passionate about writing and enjoys hiking, reading, and cooking. When she isn’t writing about economics and real estate, or health and fashion, she is playing with her rescue pitbull, Mazie.