Category: Urban Issues

  • Around The World, The Tide Is Turning Against Megacities

    The massive construction waste collapse last month in Shenzhen reflects a wider phenomenon: the waning of the megacity era. Shenzhen became a megacity (population over 10 million) faster than any other in history, epitomizing the massive movement of Chinese to cities over the past four decades. Now it appears more like a testament to extravagant delusion.

    In 1979, Shenzhen was a small fishing town of roughly 30,000 people when it became a focus of former Chinese leader Deng Xiaoping’s first wave of modernization policies. Now it is a metropolis of 12 million whose population grew 56 percent between 2000 and 2014. For years, it stood as the brash wunderkind of Chinese cities, proud of its gleaming infrastructure that is now increasingly suspect.

    The Shenzhen collapse came four months after a similar deadly public safety disaster in Tianjin, another relatively new megacity, where an explosion at a chemical warehouse killed 173 people. And of course, there is the widespread urban air pollution that is hazardous in Beijing and simply noxious elsewhere. Simply put, the once compelling “economies of scale” offered by increasing the size of cities have broken down in urban agglomerations over 10 million people, where their size has now become encumbrances to further growth, not to mention the happiness and health of their citizens.

    One big problem with megacities, the Chinese are discovering, is their impact on property prices and fertility. Chinese may have been freed last year from the tyranny of the one-child policy, but don’t expect a baby boom in any of the biggest, most glamorous cities. Shanghai has among the lowest fertility rates in the world, one-third of the replacement rate. Beijing and Tianjin suffer a similarly dismal fertility rate.

    This reflects both crowded conditions and insanely high property prices that, on an income-adjusted basis, now are far higher than those in expensive world cities like Vancouver, London, Sydney, San Francisco and New York — two times higher in some cases.

    The population growth rate in Beijing and Shanghai has dropped dramatically since 2010, according to  demographer Wendell Cox. The population of China’s capital expanded 3.9 percent a year from 2000 to 2010; growth slowed to 2.3 percent annually from 2010 to 2014. In Shanghai the population growth rate for the same periods slowed from 3.4 percent annually to 1.3 percent. High degrees of pollution have led at least some affluent urban Chinese to move back toward the countryside, as well as to cleaner, less congested regions in Australia, New Zealand, and North America.

    Nonetheless, the Chinese government remains committed to driving further urbanization to boost economic growth, aiming to turn more rural farmers into city-dwelling, free-spending consumers. In 2014 the government set a goal to increase the ratio of the Chinese population that lives in cities to 60% by 2020 from 53.7% then. But  the urbanization strategy aims to funnel migrants to small and midsize cities with less than 5 million residents, maintaining tight restrictions on legal migration to the megacities.

    To make the smaller cities more attractive Beijing promised to ramp up infrastructure spending, and local governments have rolled out housing subsidies, tax breaks and cheaper mortgages to lure migrants. Whether that will be enough to counteract the pull of the megacities’ bigger job markets is an open question.

    Peak Megacity In Much Of The World

    Until recently the worldwide trend toward megacities — there were 34 in 2014 — has seemed relentless. But in much of the world this trend is slowing down. The populations of Europe and North America are growing slowly, with the exception of London and Moscow. In the last decade the population of New York City grew at roughly one third the relatively low national rate.

    Where megacities can be expected to grow in the future are in the backwaters of the global economy, in Africa and parts of Asia, where the most rapid population growth and urbanization is taking place.

    In an impressive 2011 study, the consultancy McKinsey predicted that through 2025, population growth would shift to 577 “fast-growing middleweight” cities many of them in China and India, while, in contrast, megacities would underperform economically and demographically.

    In India as well, population growth rates have slowed considerably for two of its three largest cities, Mumbai and Kolkata, while New Delhi has become the country’s largest megalopolis. More rapid population growth has taken place in mid-sized cities such as Hyderabad, Pune, Chennai, and Bangalore, as well as in smaller cities like Coimbatore, home to 2.5 million, that have seen much of the industrial and tech growth in the country.

    Urban decentralization has become something of a theme of the government of Prime Minister Narendra Modi, who implemented a program of “rurbanization” as Chief Minister of the state of Gujarat. Villages are still home to the vast majority of Indians and serve as the primary source of new urban migrants. Modi speaks of human settlements with the “heart of a village” and developing “the facilities of the city.”

    Singapore-based scholar Kris Hartley notes a shift of industrial and even service businesses to more rural locales in Southeast Asian countries like Thailand, Vietnam and Indonesia, and parts of China. As megacities become more crowded, congested, and difficult to manage, Hartley suggests, companies in these areas are finding it more convenient, less costly, and better for the families of their employees to locate farther from giant cities.

    Where Megacities Will Grow Fastest

    According to U.N. estimates, 99 percent of all population growth between 2010 and 2100 will take place in developing countries, some 83 percent in Africa alone followed by 13 percent in Asia, particularly the less developed parts.    

    Rather than an indicator of the future, megacity growth in these regions increasingly is something of a lagging indicator of an early phase of urbanization. Growth projections suggest the evolution of two more megacities in Africa: Johannesburg-East Rand (South Africa) and Luanda (Angola).  They will join Lagos in Nigeria, as well as the rapidly growing and poor megacities Cairo and Kinshasa, as well as Karachi in Pakistan

    As is the case in India, these cities will likely be most prolific in producing slums. Worldwide there are now as many as a billion denizens of these depressed areas, threatening the social stability of not only of their countries but also the world, as they tend to generate high levels of both random violence and more organized forms of thuggery, including terrorism.

    One does not have to be a Gandhian idealist to suggest that perhaps dispersion, not concentration, provides a better model for future urban growth in developing countries, offering more space, privacy, and connection to nature, note social scientist Robert Obudho. A focus on large city development, he argues, will exacerbate problems, while shifting toward smaller-scale areas could encourage more “self-reliance, spatial equity, [and] local participation.”

    Ultimately, a shift toward dispersion—both within regions and between them—has been made more feasible in the developing world, as in the West, by new technology. Smaller cities and even villages are no longer as economically isolated and are brought closer to the outside world through the use of cell phones and the Internet. Economic growth in these places could help stem megacity migration by closing the gaps in living standards of rural people relative to their urban counterparts, as has occurred in western countries.

    Such ideas need to be heard more in the discussion about cities in the developing world. We need to confront the urban future with radical new thinking. Rather than foster an urban form that demands heroic survival, we should focus on ways to create cities that offer a more prosperous, healthful and even pleasant life for their citizens.

    Joel Kotkin is executive editor of NewGeography.com and Roger Hobbs Distinguished Fellow in Urban Studies at Chapman University, and a member of the editorial board of the Orange County Register. He is also executive director of the Houston-based Center for Opportunity Urbanism. His newest book, The New Class Conflict is now available at Amazon and Telos Press. He is also author of The City: A Global History and The Next Hundred Million: America in 2050. He lives in Orange County, CA.

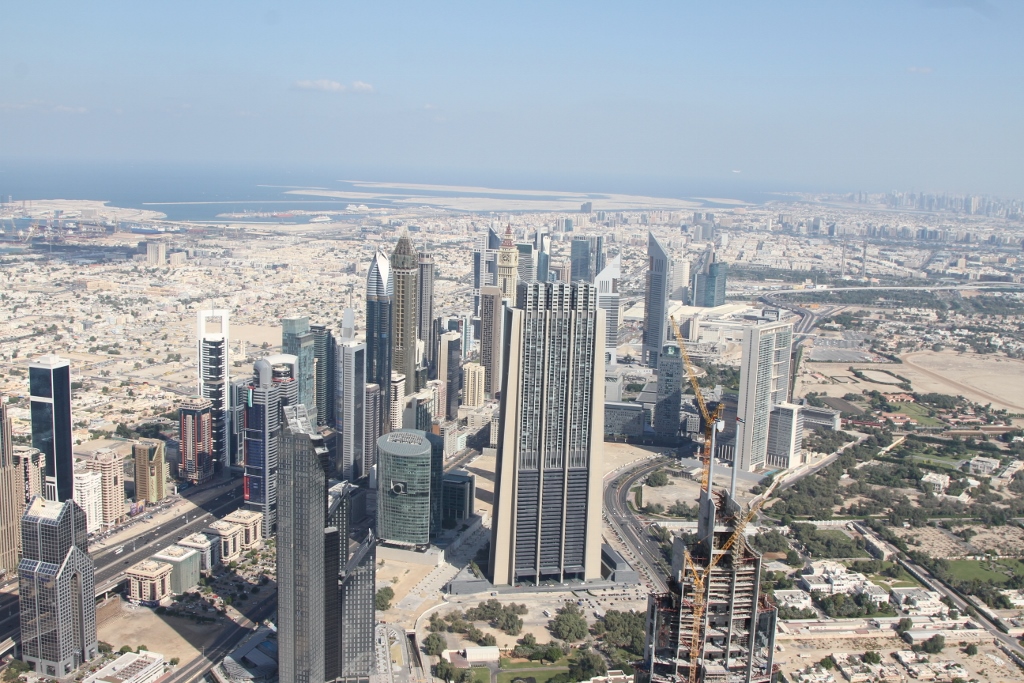
    Photo: Shenzhen:  Binhe Avenue from the Shun Hing Tower (by Wendell Cox)

  • America’s Next Boom Towns: Regions to Watch in 2016

    Which cities have the best chance to prosper in the coming decade? The question is a complex one, and as the economy changes, so, too, will the best-positioned cities.

    To identify the cities most likely to boom over the next 10 years, we took the 53 largest metropolitan statistical areas in the country (those with populations exceeding 1 million) and ranked them based on eight metrics indicative of past, present and future vitality. We factored in, equally, the percentage of children in the population, the birth rate, net domestic migration, the percentage of the population aged 25-44 with a bachelor’s degree, income growth, the unemployment rate, and population growth.

    The results show two divergent kinds of ascendant cities. One is driven by the tech industry, the in-migration of educated people and sharply rising incomes; the other type is what we describe as “opportunity cities,” which tend to have a diverse range of industries, lower costs and larger numbers of families. We may be one country, but the future is being shaped by two very different urban archetypes.

    The Lone Star Model

    The most vital parts of urban America can be encapsulated largely in one five-letter word: Texas. All four of Texas’ major metro areas made our top 10. Austin, Houston, Dallas-Ft. Worth and San Antonio are very different places, but they all have enjoyed double-digit job growth from 2010 through 2014, well above the national average of 8.1%. They also all have posted income growth well above the national average.

    But the biggest divergence from the pack may be demographics. The Texas cities have become major people magnets, with huge growth in their populations of young, educated millennials and households with children. The clear star of the show is No. 1-ranked Austin, which has become the nation’s superlative economy over the past decade.

    Austin leads the pack in terms of population growth, up 13.2% between 2010 and 2014, in large part driven by the strongest rate of net domestic in-migration of the 53 largest metropolitan areas over the same span: 16.4 per 1,000 residents. The educated proportion of its population between 25 and 44 is 43.7%, well ahead of the national average of 33.6%, although somewhat below the traditional “brain center” cities of the Northeast and the West Coast.

    The other Texas cities also do well across the board, with strong domestic in-migration, low unemployment and a rising population of young families. The biggest question marks going ahead involve No. 6 Houston, which benefited heavily from the energy boom and now is dealing with the consequences of the oil price collapse. Most economists do not see a total meltdown as occurred in the 1980s, but it would not be a surprise to see Houston fall out of our top 10 until energy prices recover. Economist Patrick Jankowski projects some 9,000 layoffs in the energy sector locally in 2016 but enough growth elsewhere — for example 9,000 new jobs in medical services — to keep employment expanding, although far below the pace of the last few years. The other, less energy-dependent Texas metro areas seem likely to continue their stellar performance.

    The Flyover Superstars

    There are several dynamic, fast-growing metro areas elsewhere in the country that seem likely to increase their status in the coming years, mostly in the Southeast and the Intermountain West. Like the Texas cities, these areas enjoy lower costs than the Northeast or California, notably for housing, and tend to be pro-business. All are experiencing significant population growth.

    No. 2 Salt Lake City and No. 4 Denver have been expanding for years, with significant tech-sector growth. Both are logging population increases, with Denver benefiting from strong domestic in-migration while Salt Lake City has the highest birth rate among major metro areas, 16.9 per 1,000 women from 2010-14, largely due to its fecund Mormon population.

    The Southeast has a number of ascendant cities led by No. 5 Raleigh, which, like Austin, has emerged as a tech hot-spot. Some 49% of all Raleigh residents aged 25 to 44 have a four-year degree, higher than any other metro area in the South. The national average is 33.6%.

    The Glorious Gated Community

    Unlike the rest of our rising cities, the Bay Area’s two major metro areas — No. 3 San Jose and No. 9 San Francisco — do not boast rapid population growth, and have low rates of family formation and births. Yet the area’s technology domination has made it so rich that it blows by most regions in terms of positioning for the future.

    The big divergence here is income growth. Since 2010, the two metro areas have enjoyed the strongest expansion in earnings in the nation – 9.2% in the San Jose area between 2010 and 2015 and 7.8% in San Francisco. Silicon Valley and the Bay Area also boast extraordinarily well-educated young workforces. In San Jose 53.5% of workers aged 25 to 44 have a college degree, the third-highest share in the nation, and San Francisco ranks fourth at 52.4%.

    So why are people not flocking to these areas? San Jose is net negative for domestic migration over the time we examined while San Francisco made modest gains only after years of net out-migration. Much of the problem lies in high housing prices, which, notes Dartmouth College economist William Fischel, have turned the Bay Area and the Valley into an “exclusionary region” inaccessible to all but the wealthy and highly gifted.

    Given the growing importance of the technology industry, it seems likely that this gated region will continue to thrive in the years ahead, albeit with a low level of new family formation, relatively few children and a limited middle class. It’s a model that some cites may wish to duplicate but few will be able to. Perhaps the most promising candidate to join this list is No. 15 Seattle, which also has experienced strong job growth, largely from technology and boasts a large population of college graduates.

    The Fading Big Enchiladas

    Perhaps the most glaring omissions at the top of our list are America’s three largest metropolitan areas: New York, Los Angeles and Chicago. Of the three, New York does best, but only well enough for 36th place, hardly what one would expect for America’s, and arguably the world’s, premier city.

    New York has high costs like San Francisco but a far more bifurcated economy and demographics. Wall Street may be approaching the end of an epic run, but overall incomes in New York have fallen 0.5% since 2010. Employment has expanded a respectable 7.3% over the past five years, roughly the national average, but the metro area has the highest rate of domestic out-migration in the country.

    Similar dynamics have lowered future prospects for Los Angeles and Chicago. Ranked 39th, Los Angeles has posted better job growth than New York at 10.2%, but its income losses were also more severe, down 3.8%. As in Gotham, the elites of Southern California in entertainment, real estate and technology may be thriving, but the vast majority are not doing so well, as manufacturing, construction and business services have lagged. Los Angeles’ population — more heavily Latino and African America — is also less well-educated, with only 34.8% of adults 25 to 44 holding bachelor’s degrees, a good 20 points less than their San Francisco-area competitors.

    Chicago, ranked 40th, appears to have worse prospects. For all its problems, Los Angeles still dominates entertainment, has the largest port in the country, close Pacific Rim connection and enjoys the finest weather on the continent. Chicago has none of those advantages, although it boasts a very attractive downtown. The region around the magnificent mile is not doing well, with low job and population growth, stagnant incomes and strong out-migration. Urban analyst Pete Saunders describes Chicago’s economy as “one-third San Francisco and two-thirds Detroit.” That seems more true than many Windy City boosters would like to admit.

    Future Of The Future

    Of course the future is not completely predicable and many things could change in the coming years. In the short run, as mentioned above, the energy boom towns will take a bit of a hit. Energy slowdowns could impact other cities with a concentration in this industry, notably Denver, Salt Lake and even Columbus, near Ohio’s big natural gas and oil reserves.

    But other factors suggest that these lower-cost cities will do well into the future. Columbus, Ohio, for example, may see its  job growth impacted, but the benefits of strong in-migration will linger, particularly the growing numbers of college-educated millennials who have headed to it and other more affordable Rust Belt metro areas in recent years.

    Ultimately we may see the emergence of two distinct urban futures. One will emerge in elite “gated” regions such as San Francisco, San Jose, and, perhaps in the near term, Seattle. These areas will dominate many key tech sectors, and will continue to leverage their well-educated populations. The other will be more along the Texas model, diversified economies driven by lower costs, particularly for housing, diversified economies and increasingly well-educated populations.

    Rather than being fundamentally incompatible, this enormous country should have room for both models. America needs its elite centers, but there also have to be cities for middle-class families. Each can claim a piece of the future.

    2016 Regions to Watch Index
    Rank Region (MSA) Score Children age 5-14, 2014 Job Growth, 2010-2015 Popltn Change, 2010-2014 Earnings growth, 2010-2015 Domestic Mig rate 2010-2014 Birth rate, 2010-2014 Bachelor’s degrees, Age 25-44, 2014 Unemplymt, Nov 15
    1 Austin 75.6 13.7% 19.1% 13.2% 1.5% 16.4 13.8 43.7% 3.3%
    2 Salt Lake City 66.3 16.2% 14.8% 6.0% 2.1% -0.1 16.9 31.2% 2.9%
    3 San Jose 65.6 13.1% 21.3% 6.3% 9.2% -1.8 13.1 53.5% 3.9%
    4 Denver 63.2 13.6% 15.0% 8.3% 0.8% 9.3 13.1 43.9% 3.2%
    5 Raleigh 63.1 14.7% 15.4% 10.0% -1.6% 11.0 12.9 49.0% 4.6%
    6 Houston 63.0 15.2% 15.2% 9.6% 3.8% 7.4 15.0 32.5% 4.9%
    7 Dallas 61.1 15.2% 15.0% 8.2% 0.7% 6.6 14.4 33.4% 4.0%
    8 San Antonio 58.6 14.5% 12.5% 8.7% 1.1% 9.9 14.1 27.6% 3.8%
    9 San Francisco 56.6 11.4% 15.7% 6.0% 7.8% 2.9 11.7 52.4% 3.9%
    10 Oklahoma City 56.2 13.9% 9.3% 6.7% 3.5% 6.8 14.5 30.4% 3.6%
    11 Nashville 56.1 13.3% 14.8% 7.3% 1.7% 8.9 13.1 37.8% 4.3%
    12 Charlotte 54.3 14.1% 15.4% 7.4% 0.9% 8.8 12.8 37.6% 5.1%
    13 Minneapolis 52.1 13.6% 8.7% 4.4% -0.6% 0.1 13.3 44.9% 2.7%
    14 Columbus 51.2 13.5% 10.8% 4.9% 0.7% 2.6 13.7 40.7% 3.9%
    15 Seattle 50.9 12.2% 13.8% 6.7% 4.0% 4.3 12.8 43.1% 4.9%
    16 Atlanta 50.8 14.6% 11.9% 6.2% 0.8% 3.5 13.3 38.2% 5.0%
    17 Orlando 49.1 12.6% 16.6% 8.8% -1.5% 8.2 12.1 31.0% 4.5%
    18 Grand Rapids 48.2 14.0% 20.0% 3.9% -2.2% 1.7 13.5 37.1% 5.2%
    19 Phoenix 48.1 14.2% 12.9% 7.1% -2.1% 6.5 13.7 29.3% 5.0%
    20 Indianapolis 47.9 14.3% 11.0% 4.4% -2.2% 2.1 13.8 36.4% 4.2%
    21 Washington 47.8 12.9% 5.3% 7.0% -3.4% 0.4 13.8 53.2% 4.1%
    22 Portland 47.5 12.7% 12.2% 5.5% 3.1% 5.1 12.1 38.9% 4.8%
    23 Kansas City 45.8 14.2% 6.9% 3.1% -0.3% -0.3 13.6 39.5% 3.9%
    24 San Diego 44.1 12.1% 9.6% 5.4% 1.9% 0.3 14.0 38.7% 4.8%
    25 Boston 43.1 11.4% 8.4% 3.9% 2.2% -0.5 11.2 54.1% 4.1%
    26 Cincinnati 39.4 13.6% 6.4% 1.6% 0.4% -2.1 12.9 37.0% 4.2%
    27 Louisville 39.3 13.0% 10.2% 2.8% -1.2% 1.5 12.5 31.7% 4.2%
    28 Riverside 39.0 15.0% 13.9% 5.1% -2.7% 1.6 14.1 18.8% 6.1%
    29 Jacksonville 39.0 12.7% 9.0% 5.5% -2.4% 5.4 12.7 28.2% 4.7%
    30 Richmond 38.3 12.7% 5.3% 4.3% -2.4% 3.1 12.0 38.1% 4.2%
    31 Detroit 37.5 12.9% 12.0% 0.0% -1.6% -4.6 11.6 33.9% 3.0%
    32 Sacramento 36.7 13.3% 8.3% 4.4% -0.6% 1.7 12.5 32.2% 5.5%
    33 Tampa 35.8 11.5% 10.2% 4.7% -1.6% 6.4 10.9 31.3% 4.6%
    34 Miami 35.0 11.4% 12.6% 6.5% -1.7% 0.9 11.4 31.3% 5.0%
    35 Milwaukee 35.0 13.3% 4.9% 1.0% -1.0% -3.4 12.8 38.3% 4.4%
    36 New York 35.0 12.1% 7.3% 2.7% -0.5% -6.3 12.7 44.8% 4.7%
    37 Baltimore 34.9 12.4% 6.8% 2.8% -1.2% -0.6 12.3 43.9% 5.3%
    38 Las Vegas 33.8 13.5% 13.6% 6.1% -6.5% 4.7 13.2 22.4% 6.3%
    39 Los Angeles 33.7 12.5% 10.2% 3.4% -1.8% -3.6 13.0 34.8% 5.3%
    40 Chicago 32.9 13.3% 6.5% 1.0% -0.1% -6.0 12.7 41.7% 5.4%
    41 Birmingham 31.9 13.1% 5.5% 1.4% -1.1% -0.6 12.9 32.3% 5.2%
    42 St. Louis 31.8 12.8% 4.2% 0.7% -0.4% -3.3 12.2 38.4% 4.6%
    43 Philadelphia 31.6 12.4% 3.8% 1.4% -1.7% -3.0 12.1 41.7% 4.6%
    44 New Orleans 31.2 12.6% 4.5% 5.2% -6.0% 4.7 12.7 33.4% 5.6%
    45 Cleveland 30.1 12.3% 5.2% -0.7% 0.3% -4.3 11.2 34.5% 3.7%
    46 Memphis 29.5 14.2% 3.6% 1.4% -0.8% -4.0 14.2 28.3% 6.1%
    47 Pittsburgh 28.8 10.8% 3.9% 0.0% 2.6% 0.4 10.1 42.2% 4.5%
    48 Virginia Beach 28.8 12.3% 1.0% 2.4% -1.2% -3.5 13.4 30.1% 4.6%
    49 Tucson 25.3 12.3% 3.7% 2.5% -3.9% 0.1 12.1 29.1% 5.3%
    50 Buffalo 25.0 11.6% 3.7% 0.1% 0.3% -2.3 10.6 36.8% 4.9%
    51 Hartford 24.5 11.9% 5.5% 0.2% -1.6% -5.7 10.0 41.9% 4.8%
    52 Rochester 23.9 11.9% 3.3% 0.3% -2.5% -3.9 10.8 36.6% 4.6%
    53 Providence 23.3 11.5% 5.1% 0.5% -0.4% -3.2 10.4 33.2% 4.9%

    Analysis by Mark Schill, Praxis Straetgy Group (mark@praxissg.com). The index incldues eight equally-weighted measures: share of population age 5-14, 5-year job growth, 5-year population change, 5-year real earnings growth, annual average domestic migration rate, annual average birth rate, share of young population with a bachelor’s degree, and current unemployment rate.

    This piece first appeared in Forbes.

    Joel Kotkin is executive editor of NewGeography.com and Roger Hobbs Distinguished Fellow in Urban Studies at Chapman University, and a member of the editorial board of the Orange County Register. He is also executive director of the Houston-based Center for Opportunity Urbanism. His newest book, The New Class Conflict is now available at Amazon and Telos Press. He is also author of The City: A Global History and The Next Hundred Million: America in 2050. He lives in Orange County, CA.

    Mark Schill is a community process consultant, economic strategist, and public policy researcher with Praxis Strategy Group.

    SaltLake City photo by Skyguy414.

  • What If Singapore and Las Vegas Had a Love Child?

    Compared to what? That’s the question I kept asking myself as I explored Dubai for the second time. Like many people I have serious concerns about the glistening new city-state. But in the end I’ve decided that it’s all really a matter of degree, not kind. I came to this conclusion unexpectedly and begrudgingly. I wanted to hate the place much more than I ultimately did. For all its behind-the-scenes repression and social injustice Dubai is thriving primarily because so many other places are failing so spectacularly. It’s a carnival mirror held up to the rest of the world reflecting the things we don’t like to acknowledge in our own backyards.

    Screen Shot 2015-12-10 at 3.20.48 PM

    IMG_6817 (1024x646)

    IMG_6245 (1024x683)

    IMG_6355 (1024x683)

    Screen Shot 2015-12-10 at 4.42.53 PM

    Screen Shot 2015-12-10 at 4.43.28 PM

    Screen Shot 2015-12-10 at 4.27.16 PM

    Screen Shot 2015-12-10 at 5.55.32 PM

    How is an indoor ski resort in the Persian Gulf all that different from ice hockey stadiums in Houston, Miami, or Los Angeles? How is the Edmonton Mall in the frozen plains of Alberta really different from the Dubai Mall out in the desert? How is a city of over two million people kept alive in a forbidding landscape with no water or farm land? Ever been to Henderson, Nevada or Scottsdale, Arizona? Isn’t it cruel and immoral to use underpaid and exploited immigrant workers who are systematically threatened with deportation? Really? Really? Do I need to go there?

    Screen Shot 2015-12-10 at 5.02.14 PM

    Screen Shot 2015-12-10 at 5.47.14 PM

    Screen Shot 2015-12-11 at 1.07.31 AM

    Dubai is the love child of Singapore and Las Vegas. I choose these two “parents” very carefully. The founder of modern Singapore, Lee Kuan Yew, was fond of saying that what impoverished countries lacked most is good governance. Singapore was transformed from a tiny hardscrabble island nation with no hinterland or natural resources to a world class economy in a matter of forty or fifty years. Skilled management was responsible for most of that success. Singapore’s puritanical one party rule can be criticized on many levels, but providing a safe prosperous life for its people is not on that list. And its inhabitants are free to leave if they feel oppressed – which some do.

    Screen Shot 2015-12-10 at 4.46.46 PM

    Screen Shot 2015-12-10 at 5.00.33 PM

    Screen Shot 2015-12-10 at 5.02.44 PM

    Screen Shot 2015-12-10 at 5.03.10 PM

    Screen Shot 2015-12-10 at 4.48.26 PM

    Las Vegas cultivated an economy based on strategically pulling in money from outside the region. Tourism, tax havens, property investment, and retirement villas turned a one horse town in a desert wasteland into a massive growth machine. Is Vegas built to last? Probably not. But it has demonstrated some basic principles that, for the time being, are highly effective.

    IMG_5863 (1024x683)

    IMG_5852 (1024x683)

    Dubai has far less oil than its neighbors. The emires (Arabic kings) understood that once their modest supplies were pumped dry there would be nothing to fall back on. Their nation would sink into poverty and chaos. You don’t have to look very far in the region to see what happened to other nations whose leaders weren’t so thoughtful or wise. Nearby Yemen is the poster child for depletion, population overshoot, and collapse into bloodshed. 

    Screen Shot 2015-12-10 at 11.56.47 PM

    Screen Shot 2015-12-11 at 3.11.43 AM

    Screen Shot 2015-12-11 at 3.10.25 AM

    Dubai provides stability and order in a world where that’s often hard to find,so long as you can afford it. Pakistan, Sudan, and many other places are simply incapable of getting their sh*# together. In a troubled world middle and upper class people are looking for a safe haven to stash their money and their families. Dubai skims the cream off the turbulent bits of the planet. It’s a pure pay-per-view environment and the ultimate gated community. I honestly can’t blame people for choosing to relocate to Dubai when the alternative back home in Syria or Zimbabwe is what it is. This is especially true when so many other destinations aren’t so welcoming.

    Screen Shot 2015-12-10 at 4.23.20 PM

    Screen Shot 2015-12-10 at 10.44.35 PM

    Screen Shot 2015-12-10 at 10.46.06 PM

    Screen Shot 2015-12-10 at 10.47.08 PM

    Screen Shot 2015-12-11 at 3.08.52 AM

    Screen Shot 2015-12-10 at 5.58.59 PM

    Screen Shot 2015-12-10 at 6.00.07 PM

    Screen Shot 2015-12-10 at 6.08.29 PM

    Screen Shot 2015-12-10 at 6.04.38 PM

    At the same time armies of desperate workers from failed states are invited in to do the dirty heavy lifting on the cheap. Bangladesh, Pakistan, Ukraine, Burma, Nigeria, Bosnia… Depending on their skill set there’s a special niche for each type. Illiterate Malaysian men have one kind of use in construction. Pretty young women from the Philippines and Bulgaria are put to use as cleaners and nannies (among other things.) These workers are “guests” who are cycled through every couple of years thereby eliminating the need for pensions, schools, proper housing, health care, and other long term social obligations. This is the purest expression of neoconservative Reagan/Thatcherism. For better. And worse. But these workers wouldn’t be in Dubai at all if their home countries provided them with proper education and employment. 

    Screen Shot 2015-12-10 at 11.56.24 PM

    Screen Shot 2015-12-10 at 5.53.28 PM

    Screen Shot 2015-12-10 at 5.52.21 PM

    Screen Shot 2015-12-10 at 5.52.05 PM

    Screen Shot 2015-12-10 at 5.51.04 PM

    I can’t say I love Dubai or that I would ever want live there myself. But I understand it more now that I’ve poked around in person a couple times. I simply can’t criticize it in isolation without acknowledging how much Dubai is merely taking global trends to their logical extensions. From that perspective it’s a great mirror to examine conditions everywhere rather than indulge in obsessing about Dubai’s particular shortcomings. If you don’t like the place and what it stands for you might want to re-examine your own country first. They may be more similar than you think.

    John Sanphillippo lives in San Francisco and blogs about urbanism, adaptation, and resilience at granolashotgun.com. He’s a member of the Congress for New Urbanism, films videos for faircompanies.com, and is a regular contributor to Strongtowns.org. He earns his living by buying, renovating, and renting undervalued properties in places that have good long term prospects. He is a graduate of Rutgers University.

  • Land Regulation Making Us Poorer: Emerging Left-Right Consensus

    There is an emerging consensus about the destructiveness of excessive land use regulation, both with respect to its impact on housing affordability but also its overall impacts on economies. This is most evident in a recent New Zealand commentary.

    New Zealand

    Both the center-Left and center-Right have come together in agreement on the depth of New Zealand’s housing affordability and its principal cause, overly restrictive urban planning regulations. Labour Party housing spokesperson (shadow minister) Phil Twyford and Oliver Hartwich, executive director of the New Zealand Initiative, wrote in a co-authored New Zealand Herald commentary:“Our own research leaves no doubt that planning rules are a root cause of the housing crisis, particularly in Auckland…” (See: “Planning Rules the Cause of Housing Crisis.”).

    The Labour Party is the largest opposition party in Parliament, and has traded governing with the currently ruling National Party more than eight decades. The New Zealand Initiative is "an association of business leaders that is also a research institute."

    Planning and the New Zealand Housing Crisis

    New Zealand’s housing crisis has been building for more than two decades. New house construction has fallen dramatically. According to Twyford and Hartwich, house construction has declined nearly 40 percent from 1973. At the same time the demand for housing has increased. The authors note that New Zealand’s population has increased 50 percent since that time. The housing shortage is further exacerbated by the falling average size of households, which means more new dwellings are required than  indicated by the increase in population

    Across the Pacific nation, far more restrictive land use regulations have been adopted, including urban containment boundaries (urban growth boundaries), which have been associated with higher house prices relative to incomes. Before the imposition of strict land use regulation, houses typically cost three times or less that of household incomes. Since then, house prices have double or tripled relative to household incomes. Twyford and Hartich note that houses now cost a “severely unaffordable” 9 times household incomes in Auckland: They say that “A big part of the problem in Auckland is escalating land costs. Linked to this, too few houses are being built. The houses that are being built are too expensive.”

    Twyford and Hartwich indicated an even broader general agreement, endorsing comments by the ruling National Party government’s as indicated by Deputy Prime Minister Bill English: “It costs too much and takes too long to build a house in New Zealand. Land has been made artificially scarce by regulation that locks up land for development. This regulation has made land supply on responsive to demand” (also see: "Planning has Become the Externality")

    Broad Consequences

    Twyford and Hartwich starkly described the consequences of New Zealand’s urban planning regime.

    “Rising house prices are making us poorer as a nation. They force people to spend an ever larger proportion of their incomes on housing, and it ties up vast amounts of the nation’s wealth in housing instead of investing it in businesses that create jobs and exports.”

    Twyford and Hartwich also agreed that there is more than enough blame to go around for the mess that has arisen in New Zealand (a criticism that would be appropriate across Australia, the United Kingdom, some markets in the Unites States and the largest markets in Canada):

    "Because this is a national housing crisis that has grown over decades and under governments of different hues, playing political blame games is pointless. You cannot solve problems in retrospect. We need to face the facts and work together for real reform."

    The authors identified three issues for reform: “First, urban growth boundaries driving up section costs. Second, anti-density restrictions stopping affordable housing. Third, the expensive and inefficient way we fund infrastructure.” They also indicated a familiarity with the economics of development fees (also called impact fees”), often missed by planners in Australia, Canada, the United States and elsewhere. “Even though developers nominally pay for all these costs,” “they note, these costs “are immediately passed on to the new home-buyer.”

    Twyford and Hartwich propose what they refer to as "modest" reforms:

    “• Instead of using urban growth boundaries, empower communities to protect places that are of special character and value to them.

    • Free up density and height controls and rely more on high urban design standards including requirements for open and green space, to allow more affordable housing in the city. Let the market discover where and how people want to live.

    • Take developers out of the business of financing new infrastructure. Instead, spread the cost over the assets’ lifetime, either by issuing local government bonds or establishing Community Development Districts” (These could be similar to the Municipal Utility Districts of Texas).

    Importantly, in their second proposal, Twyford and Hartwich exhibit the appropriateness of consumer choice in housing. As in other goods and services, consumers should be free to make their own housing choices, rather than being limited to those permitted by urban planning  decrees. Yet, urban planning, in recent years, has attempted to reduce house sizes and force higher densities, attempting to drive many households into smaller houses and into condominiums who prefer larger detached houses. 

    The concluded that:

    "It is an issue of national importance and concerns all of us – all councils and political parties, developers and the wider business community – and of course the people of this country who would benefit the most from restored housing affordability.

    The time for reform is now."

    The Twyford-Hartwich commentary follows other significant developments in New Zealand.

    Indicating the depth of concern about the impact of planning policies on housing prices, the city of Auckland’s Chief Economist has proposed setting a target to nearly halve house prices relative to incomes over the next 15 years (to a price-to-income ratio of 5.0, compared to its now reported near 10). This represents an important turnaround in thinking in the city.

    Moreover, economic research produced recently for the  Productivity Commission of New Zealand indicated that the housing market distortion has become so bad that “After controlling for a range of other influences, the gradient in land prices (per hectare) from Auckland’s CBD to the rural land adjacent to the city undergoes a step change at the point of the MUL [metropolitan urban limit or urban containment boundary].” The differential was identified at approximately 10 times and the Commission noted that the land value gap has “increasingly binding as housing demand pressures have intensified” (Note 1).

    The Emerging International Consensus

    Consistent with the Productivity Commission recommendation, London School of Economics professors Paul Cheshire, Max Nathan and Henry Overman, in their recent book, Urban Economics and Urban Policy: Challenging Conventional Policy Wisdom, that (see: “People Rather than Places, Ends Rather than Means”):

    “…observed price discontinuities – the difference in market prices across boundaries categories – should become a ‘material consideration’ leading to a presumption in favour of any proposed development unless (a very important ‘unless’) it could be shown that the observed monetary value of the discontinuity reflected wider environmental, amenity or social values of the land in its current use.”

    Shortly after the Twyford-Hartwich article, George Mason University professor Ilya Somin wrote of an “emerging cross-ideological consensus” in his Washington Post column. Somin mentions economists perceived as representative of right of center and left of center positions, such as Harvard’s Edward Glaeser and Nobel Laureate and New York Times columnist Paul Krugman, as well as Jason Furman, Chair of the White House Council of Economic Advisors. He quotes Krugman: “this is an issue on which you don’t have to be a conservative to believe that we have too much regulation.”

    If there is any issue that the Left and Right should be able to unite around, it is policies that keep cities affordable (a prerequisite to livability) not only for both the threatened middle-class and for lower income citizens. More than 40 years ago, legendary urbanist Sir Peter Hall’s raised these as principal points in his critique of urban containment policy. Twyford, Krugman, Cheshire and Harwich are right. This is not an ideological issue but one about the human future in our cities.

    Wendell Cox is Chair, Housing Affordability and Municipal Policy for the Frontier Centre for Public Policy (Canada), is a Senior Fellow of the Center for Opportunity Urbanism (US), a member of the Board of Advisors of the Center for Demographics and Policy at Chapman University (California) and principal of Demographia, an international public policy and demographics firm. He is co-author of the “Demographia International Housing Affordability Survey” and author of “Demographia World Urban Areas” and “War on the Dream: How Anti-Sprawl Policy Threatens the Quality of Life.” He was appointed to three terms on the Los Angeles County Transportation Commission, where he served with the leading city and county leadership as the only non-elected member. He served as a visiting professor at the Conservatoire National des Arts et Metiers, a national university in Paris.

    —-

    Photograph: Phil Twyford, Labour Party housing spokesperson (shadow minister)

  • Where American Families Are Moving

    Much is made, and rightfully so, about the future trends of America’s demographics, notably the rise of racial minorities and singles as a growing part of our population. Yet far less attention is paid to a factor that will also shape future decades: where families are most likely to settle.

    However hip and cool San Francisco, Manhattan, Boston or coastal California may seem, they are not where families are moving.

    In a new study by the Chapman Center for Demographics and Policy, we found that the best cities for middle-class families tend to be located outside the largest metropolitan areas. This was based on such factors as housing affordability, migration, income growth, commute times, and middle-income jobs. Many of our best-rated cities tend to mid-sized. The three most highly rated were Des Moines, Iowa, Madison, Wis., and Albany, N.Y., all with populations of less than 1 million. Among our top 10 metropolitan areas for families, five are larger than this, but only two—the Washington, D.C. area and Minneapolis-St. Paul—are among the nation’s 20 largest metropolitan areas.

    Download the full report (pdf) here.

    Our bottom 10 includes the media’s favorite two cities, New York and Los Angeles, also the largest metropolitan areas in the nation. Three other large metropolitan areas rank in the bottom 10: Miami, Riverside-San Bernardino, Calif., and Las Vegas. The hipster cities, in other words, are not so amenable to the new generation of young families.   

    Why Families Head to the Suburbs

    In the 1960s, renowned urbanist Jane Jacobs asserted that “suburbs must be a difficult place to raise children.” But they remain popular nonetheless. According to U.S. Census Bureau statistics, in 2011, children between ages 5 and 14 constituted about 7 percent in urban core Central Business Districts (CBDs) across the country, less than half the level in newer suburbs and exurbs. In Manhattan, singles comprise half of all households, based on the American Community Survey. The highest percentage of women over 40 without children, notes geographer Ali Modarres, can be found in expensive and dense Washington, D.C.

    One clear example of the new child-free city is San Francisco, which is now home to 80,000 more dogs than children. In 1970, children made up 22 percent of the population of San Francisco. Four decades later, they comprised just 13.4 percent of the town’s 800,000 residents. Nearly half of parents of young children there, according to 2011 survey conducted by the city, planned to leave in the next three years, largely due to high housing costs. This pattern is accelerating: Since 2011, less-dense ZIP codes have been growing far faster than the more dense ones.

    The desire for affordable, single-family homes is driving this trend. Over 80 percent of married couples live in such housing, compared to barely 50 percent of households of unrelated individuals and single. The choice to move to the suburbs also reflects the preference for a safer setting. FBI crime statistics show the violent crime rate in the core cities of major metropolitan areas is nearly 3½ times higher than in the suburbs. Given the murder rate in many major cities, this gap can be expected to grow.

    Another key motivation in choosing the suburbs, especially for families with children, is frustration with the quality of urban public education. Suburban schools still consistently out-perform those of inner cities in terms of achievement, graduation and college admission.

    In the coming years the progressive penchant for enforced densification—contrary to the preferences of most Americans—could cause some serious intra-party rifts, even in areas that today are reliably Democratic “blue.” The biggest opposition to building more single family housing has often been in liberal bastions such as Marin County, Calif., Boulder, Colo., and Westchester County, N.Y., the official residence of Hillary and Bill Clinton after they left the White House. As one Bay Area blogger observed, “suburb-hating is anti-child”—because it seeks to undermine neighborhoods with children.

    Exclusionary and Opportunity Regions

    America has always had its fancy neighborhoods, often associated also with racial or ethnic exclusion. But increasingly large parts of the country, and this is true in certain cities and suburbs, are evolving into what Dartmouth College’s William Fischel has called “exclusionary regions”—too expensive for middle-class families to access.

    Fischel traces much of this development to regulatory policies that restrict housing supply. In 1970, for example, housing affordability in coastal California metropolitan areas was similar to the rest of the country, as measured by the median multiple (the median house price divided by the median household income). Today, due in part to a generation of strict growth controls, home prices in places like San Francisco and Los Angeles are now three or more times higher than in some other metropolitan areas.

    The impact is being felt disproportionately by younger adults, who, unlike earlier generations, do not benefit from housing inflation, and who face other barriers to home-buying ranging from student debt to weak income growth. Coupled with an overall weak economy, the net worth of people under age 35 has plummeted almost 70 percent from 2004 levels, making affordable housing an even more pressing issue.

    This cash-short generation is moving to more affordable places. Since 2010, the fastest growth in the ranks of college-educated millennials has been to lower-cost regions such as the four large Texas cities (Dallas-Fort Worth, Houston, San Antonio and Austin), Nashville, Tenn., and Orlando, Fla., as well as such Rust Belt cities as Pittsburgh and Cleveland. These cities offer what the “exclusionary” regions once did: an affordable inner-city option for the young and childless as well as suburbs they can move to as they start families. Other families are settling in small, relatively inexpensive metropolitan areas: Fayetteville, Ark., Cape Coral and Melbourne, Fla., Columbia, S.C., Colorado Springs, Colo., and Boise, Idaho.

    High rents, which now constitute the largest share of income in modern U.S. history, could be determining these change in youthful migration. Since 1990, renters’ income has been stagnant, but inflation-adjusted rents have soared 14.7 percent. Housing, long the largest expenditure item, now takes an even larger share of family costs, while expenditures on food, apparel and transportation have dropped or stayed about the same. In 2015, increases in housing costs essentially swallowed gains made elsewhere, notably savings on the cost of energy.

    This situation is most severe in the highest-priced markets. In New York, Los Angeles, Miami and San Francisco, for example, renters spend 40 percent of their income on rent, well above the national average of under 30 percent. In each of these markets there have been strong increases (income adjusted) relative to historic averages. In New York, rents increased between 2010 and 2015 by 50 percent, while incomes for renters between ages 25 and 44 grew by just 8 percent.

    Where the Future Is Being Built

    This wide disparity between “opportunity” and “exclusionary” areas is being locked in place by the persistent lack of new housing in most high-priced regions. Since 2010, among the 10 areas that experienced the biggest increases in housing supply, only one was in a deep-blue urban area: Seattle. The cities producing the most new units—Austin, Raleigh, N.C., Houston, Dallas-Fort Worth, Nashville, Charlotte, N.C., Orlando, Oklahoma City, and Jacksonville, Fla.—have managed to keep their housing costs, and rents, to levels acceptable to middle- and working-class families.

    In contrast New York, San Francisco, Los Angeles and Boston are authorizing far fewer new units per capita than these rising cities. Houston and Dallas-Ft. Worth, with a population roughly one-third of Los Angeles-Orange Country, have produced close to two times as many new units. Overall, California’s rate of new housing permits is one-third that of the Lone Star State.

    This divide will become more pronounced as progressives work to undermine lower-density lifestyles, often in the name of combatting climate change. In California, new single-family homes are gradually being made the exclusive province of the super-affluent, while multi-family units often face opposition from neighbors and even environmentalists. Older residents, with lower property taxes and ideal weather, may stick around, but young people likely will be forced to migrate, particularly as they enter their 30s or get tired of living in their parents’ spare rooms.

    No surprise, then, that expensive and highly regulated markets have seen declines in their numbers of children since 2000. In contrast, affordable cities continue to gain families with children in the 5 to 14 age range. Dallas-Ft. Worth, for example, gained 230,000 youngsters between 2000-2013. In Houston, the number was 190,000 and in Atlanta it was more 167,000 over that span. During the same period, Los Angeles’ child population dropped by 303,000, or 15 percent. In New York it fell by 238,000 kids.

    Increasingly, employers are factoring affordable local housing stock as an equation into their decisions about where they locate—or relocate. A recent SMU study found that high housing prices to be the biggest reason why Toyota left Los Angeles for the Dallas-Fort Worth area.

    The Emerging Family/Childless Divide 

    Although American localities are being pitted against one another not just by politics but by their ability to attract young families, the emerging map of where families live is not necessarily custom-made for conservatives.

    Key Democratic groups, including African-Americans, are also moving to the suburbs, particularly in less expensive cities, largely in the southeast and Texas. The suburbs are also increasingly the chosen destination of immigrants and their offspring, another blue-leaning cohort. Roughly 60 percent of Hispanics and Asians already live in suburbs. Between 2000 and 2012, the Asian population in suburban areas of the nation’s 52 biggest metro areas grew 66.2 percent, while in the core cities it expanded by 34.9 percent. Of the top 20 cities with an Asian population of more than 50,000, all but two are suburbs.

    Republicans also will be challenged to appeal to the rising number of suburban millennials, who also lean Democratic. But there’s some good news for Republicans in that the political future is not going to be shaped primarily in the Obama hotbeds along the coasts, but places, such as the South and the suburbs, where conservatives at are more competitive.

    To compete for diversifying suburban, Sunbelt and smaller city electorates, conservatives need to better show why families of all ethnicities should support them. They must make the case that Republican policies are better for voters economically and can provide the most efficient and effective services, particularly for their children.

    As for Democratic Party leaders, they would do well to push back the narrative of their urban core elites, who tend to characterize suburbs and Sunbelt cities as soulless enemies of culture and killers of the planet. It is time to recognize that most American families, whatever their ethnicity, desire a decent home in a nice neighborhood, whether in a suburb or a city, where children can be raised. In addition, and this is of increasing importance, they want a place where seniors can grow old amid familiar places and faces. These homeowners will likely yield disproportionate influence over elections since they are more likely to vote — and be active in local affairs — than the general population.

    Ultimately, these families will determine the political future of the country. After all, there is no “replacement” generation for singles and childless couples. In the long run, wooing families will determine who wins the political wars not only this year but in the decades ahead.

    Download the full report (pdf) here.

    Joel Kotkin is executive editor of NewGeography.com and Roger Hobbs Distinguished Fellow in Urban Studies at Chapman University, and a member of the editorial board of the Orange County Register. He is also executive director of the Houston-based Center for Opportunity Urbanism. His newest book, The New Class Conflict is now available at Amazon and Telos Press. He is also author of The City: A Global History and The Next Hundred Million: America in 2050. He lives in Orange County, CA.

  • New Report: Building Cities for People

    This is the introduction to a new report: “Building Cities for People” published by the Center for Demographics and Policy. The report was authored by Joel Kotkin with help from Wendell Cox, Mark Schill, and Ali Modarres. Download the full report (pdf) here.

    Cities succeed by making life better for the vast majority of their citizens. This requires less of a focus on grand theories, architecture or being fashionable, and more on what occurs on the ground level. “Everyday life,” observed the French historian Fernand Braudel, “consists of the little things one hardly notices in time and space.” Braudel’s work focused on people who lived normal lives; they worried about feeding and housing their families, keeping warm, and making a livelihood.

    Adapting Braudel’s approach to the modern day, we concentrate on how families make the pragmatic decisions that determine where they choose to locate. To construct this new, family- centric model, we have employed various tools: historical reasoning, Census Bureau data, market data and economic statistics, as well as surveys of potential and actual home-buyers.

    This approach does not underestimate the critical role that the dense, traditional city plays in intellectual, cultural and economic life. Traditional cities will continue to attract many of our brightest and most capable citizens, particularly among the young and childless. But our evidence indicates strongly that, for the most part, families today are heading away from the most elite, more congested cities, and towards less expensive cities and the suburban periphery. (See report appendix “Best Cities for Families”)

    New York, San Francisco, and Los Angeles long have been among the cities that defined the American urban experience. But today, families with children seem to be settling instead in small, relatively inexpensive metropolitan areas, such as Fayetteville in Arkansas and Missouri; Cape Coral and Melbourne in Florida; Columbia, South Carolina; Colorado Springs; and Boise. They are also moving to less celebrated middle-sized metropolitan areas, such as Austin, Raleigh, San Antonio and Atlanta.

    Traditional cities will continue to attract many of our brightest and most capable citizens, particularly among the young and childless. But our evidence indicates strongly that, for the most part, families today are heading away from the most elite, celebrated cities, and towards less expensive cities and the suburban periphery.

    Download the full report (pdf).

  • Urban Residents Aren’t Abandoning Buses; Buses Are Abandoning Them

    “Pity the poor city bus,” writes Jacob Anbinder in an interesting essay at The Century Foundation’s website. Anbinder brings some of his own data to a finding that’s been bouncing around the web for a while: that even as American subways and light rail systems experience a renaissance across the country, bus ridership has been falling nationally since the start of the Great Recession.

    But it’s not buses that are being abandoned. It’s bus riders.

    The drop in bus ridership over the last several years has been mirrored by a decline in bus service, even as transit agencies have managed to resume increasing frequency and hours on all types of rail lines – heavy, light, and commuter.* (In this post, “service” means vehicle revenue miles – literally, multiplying a city’s bus or rail vehicles by the number of miles they run on their routes.) After a post-recession low in 2011, by 2013 rail service had increased by over 4% nationally in urban areas of at least one million people. Light rail in particular has continued its decade-plus boom, with a service increase of more than 12% in just two years. By contrast, bus service – which already took a heavier hit in the first years of the recession – was cut an additional 5.8%.


    And it turns out that when you disaggregate the national data by urban area, there’s a very tight relationship between places that cut bus service between 2000 and 2013 and those that saw the largest drops in ridership. If you live in a city where bus service has been increased, it’s likely that your city has actually grown its bus ridership, despite the national trends. In other words, the problem doesn’t seem to be that bus riders are deciding they’d rather just walk, bike, or take their city’s new light rail line. It’s that too many cities are cutting bus service to the point that people are giving up on it.


    Admittedly, this is a crude way to demonstrate a very complicated relationship. To rigorously test the impact of bus service on ridership, you’d want to take into account all sorts of other things: the presence of other transit services; population density; gas prices; demographics; and so on.

    Fortunately, we don’t have to do that, because researchers at San Jose State University’s Mineta Transportation Institute just did it for us. And they found that even if you control for those other factors, service levels are still the number one predictor of bus ridership.

    Still, I can imagine two big objections to the idea that cuts to bus operations are behind ridership declines. First, a lot of cities have opened new rail lines since 2000 – many of which, if not most, replaced heavily-trafficked bus routes. In those cases, cities are adding rail service and reducing bus service, but it obviously wouldn’t be right to say that those bus riders are being abandoned.

    But while that has surely happened in some places, it just doesn’t match the overall data. Rail service, including new lines, has been booming since long before the recession – but up until about 2009, bus service was growing, too, or at least holding steady. If rail expansions were driving bus cuts, you’d expect to see those cuts all the way back to the beginning of the data. But you don’t. Instead, cuts to bus routes appear right as transit funding was hit hard by the recession.

    Second, you might argue that service and ridership are linked, but the other way around: as ridership declines, agencies cut back on hours and frequency to match demand. Teasing out which way the causation runs would be difficult – and the answer would almost certainly include at least some examples in both directions. One quick-and-dirty way to get an idea, though, is to compare ridership changes from one year to service changes in the next year. If agencies cut service because of earlier ridership declines, then you’d expect to see that places with larger drops in ridership in “Year One” tend to be the places with larger cuts to service in “Year Two.”


    But, again, they don’t. In fact, just 3% of the variation in service cuts is explained by ridership changes from the year before.

    So while that’s hardly ironclad – and I look forward to further research that sheds more light on this problem – it does appear that a major part of the divergence in bus and rail ridership is a result of a divergence in bus and rail service: since the recession, transit agencies have cut bus service year after year, while returning service to rail relatively quickly.

    Why did they do that? I don’t know. But I can speculate that it has something to do with the fact that bus transit supporters are not always the same kinds of people as rail transit supporters. Even though more people take buses than trains in nearly every metropolitan area in the country, train riders, on average, tend to bewealthier and whiter. Not only that, but many civic and business leaders who don’t use transit at all are heavily invested in rail service as an economic development catalyst for central city neighborhoods. In other words, rail tends to have a more politically powerful constituency behind it than buses.

    As a result, when the recession blew a hole in transit budgets around the country, it may have been politically easier for local governments to fill those holes by sustaining cuts to bus lines, rather than rail.

    To be clear, the problem here has nothing to do with whether transit agencies are running more services that are rubber-on-asphalt or steel-on-tracks. As Jarrett Walker has eloquently argued, the technology used by a particular line matters far less than the quality of service: how often it runs, how quickly, for how much of the day.

    But there are at least two problems here. First, because of the spread-out nature of even relatively dense American cities, it will be a very, very long time before rail transit can connect truly large numbers of people to large numbers of jobs and amenities. When Minneapolis opened the 12-mile Blue Line light rail in 2004, for example, it was a major step forward for Twin Cities transit – but still, only 2% of the region’s population lived close enough to walk to one of the stations. For everyone else, transit still meant taking the bus, even if they were taking the bus to a train station.

    And even in places with well-developed rail networks, those systems are usually oriented to serve downtown commuters. Especially in outer neighborhoods, crosstown trips in places like Chicago, Boston, or DC are heavily reliant on buses. Abandoning buses means abandoning those trips, and the people who depend on them.


    Boston's T reaches both Dorchester and Jamaica Plain, but a bus is by far the easiest way to get from one to the other on transit. Credit: Google Maps
    Boston’s T reaches both Dorchester and Jamaica Plain, but a bus is by far the easiest way to get from one to the other on transit. Credit: Google Maps


    Second, there are serious equity issues with shifting resources from bus to rail – again, not because of anything inherent to those technologies, but simply because of who happens to use them in modern American cities. In most cases, shifting funding from bus to rail means shifting funding from services disproportionately used by lower-income people to ones with with a stronger middle- and upper-middle-class constituency. And while transit ought to be viewed as much more than just a service for the poor, we can’t ignore the equity impacts of transit policy.

    In light of all this, we have to stop talking about America’s bus woes as a ridership problem. All the evidence suggests that when service is strong, and buses are a reliable way to get to work, school, or the grocery store, people will take them. Instead, the problem is that fewer and fewer people have access to that kind of strong bus line. If we care about ridership, we need to restore and enhance the kind of transit services that people can rely on.

    * “Heavy rail” includes traditional subways and elevated trains found in cities like New York, Washington, and Chicago. “Light rail” includes many newer systems, with smaller train sets that are sometimes designed to run on streets as well as in their own right of way. Rail lines in Seattle, the Twin Cities, and Dallas are typical of light rail. “Commuter rail” services generally reach from central business districts far out into the suburbs, and are meant almost exclusively for peak-hour workers.

    This piece was first published by City Observatory on its CityCommentary blog.

    Daniel Kay Hertz is completing his graduate studies at the University of Chicago Harris School of Public Policy. He has written about urban demographics, neighborhood change, housing policy, and public transit for the Washington Post, CityLab, Next City, and other publications, as well as on his personal blog.

    Image from BigStockPhoto.com: A metro bus in Madison, Wisconsin.

  • What Does It Mean to Bring Buffalo Back?

    Prior to the holidays City Journal published  my major essay on Buffalo in their fall issue.  Here’s an excerpt:

    Local planner Chuck Banas observes that while Buffalo’s regional population today is roughly the same as it was in 1950, the urbanized footprint of the region has tripled. “Same number of people, three times as much stuff to pay for” is the quip—and it’s true. Physical capital must either be maintained at great cost in perpetuity or ignored and allowed to become a drag on the city. Between 1980 and 2011, according to the University of Buffalo Regional Institute, Buffalo-area governments issued permits for almost 60,000 new single-family homes—while regional population declined. Given the gargantuan scale of state aid to the region, this is clearly not market-rate development.

    While Buffalo’s urban advocates agree that investing in sprawl is misguided, they’re less critical about new construction in the urban center. The city’s $550 million light-rail line was an epic civic folly, yet Buffalo is currently reconstructing a downtown station on the line. More ill-conceived spending lies ahead. The region’s long-range transportation plan projects a need for an additional $100 million in capital expenditures through 2040, just to keep the existing line running—plus more operating subsidies every year. Seen in this light, neither cranes on the skyline nor bulldozers paving the countryside are necessarily good signs for Buffalo.

    I learned a lot in Buffalo and it stimulated my thinking about post-industrial cities generally. What is the best way to bring some of these places back? What does it even mean for them to be back?  If you wanted to inject a billion dollars of state or federal money into them, where would it most profitably be spent? These and other questions are ones I’ll be looking at in more detail during 2016.

    Read the entire piece at City Journal.

    Aaron M. Renn is a senior fellow at the Manhattan Institute and a Contributing Editor at City Journal. He writes at The Urbanophile, where this piece originally appeared.

  • Declining Population Growth in China’s Largest Municipalities: 2010-2014

    After three decades of breakneck urban growth, there are indications of a significant slowdown in the largest cities of China. This is indicated by a review of 2014 population estimates in the annual statistical reports filed individually by municipalities with the National Bureau of Statistics.

    For context, municipalities in China, which are also translated as “cities” in English are nothing like cities as is commonly understood in English. In China, municipalities are large geographic areas that have their own governments, but also control rural lands often far beyond the urban area. Indeed, in China, counties are subdivisions of cities, while in Anglo heritage nations, cities are within counties, with the notable exception of the city of New York or in a few, like San Francisco, are identical with counties. Some cities, like Kansas City and Atlanta stretch into adjacent counties, though occupy only part of their main county.

    This article examines municipality population growth trends, from 2010 to 2014 and comparing to the 2000 to 2010 period. The analysis focuses on 21 municipalities, which include 20 of the 25 largest built-up urban areas in the nation areas of continuous development. The 21st municipality is Foshan, which shares its built-up urban area with Guangzhou. The statistical reports the other five municipalities did not provide sufficient data to be included in this analysis (Table).

    Back in 1980, as Deng Xiaoping’s reforms were beginning to take effect, China was approximately 20 percent urban. By 2010, 55 percent of Chinese citizens lived in urban areas, a near tripling of the urban share. A large share of this growth was the so-called “floating population,” which was made up largely of rural residents who moved to the urban areas to take jobs in the export oriented factories and the massive building and infrastructure construction sites.

    The Roaring 2000s

    In the 2000s, the largest Chinese municipalities experienced some of the most rapid growth in world history. Shanghai and Beijing added between 6 and 7 million residents. Both had annual growth rates of between 3% and 4%. During the same period, the U.S. annual growth rate was about 1.0 percent.

    But even these growth rates were not the highest in the country. Xiamen, in Fujian grow at an annual rate of 5.6%, while Suzhou (in Jiangsu, adjacent to Shanghai on the west) and Shenzhen (in Guangdong, just north of Hong Kong) expanded their population at rates between 4% and 5%.

    The Slowing 2010s

    The last four years have been very different. Overall, these 21 municipalities added population at a rate of 2.2% annually between 2000 and 2010. Between 2010 and 2014, the annual growth has been reduced by nearly half, to 1.2%. This is a far greater rate than that of the national population increase, which is gradually moving from modest growth to eventual decline. The 2010 to 2014 annual national population growth rate was 0.50 percent, a 12 percent reduction from the 0.57 percent 2000 to 2010 annual rate, according to the National Bureau of Statistics. The cause of the larger decline in these municipalities thus seems likely to be the result of reduced domestic migration from more rural areas.

    Nearly all — 19 of the 21 municipalities — are experiencing slower growth in this decade than in the last. Only one, Tianjin, is experiencing the growth similar to the fast-growing municipalities of the last decade. Between 2010 and 2014, Tianjin grew 4.1%, annually, a considerable increase over its 2.8% rate from between 2000 and 2010. During this decade, Tianjin added approximately 560,000 residents annually, the largest increase among the 21 municipalities. This fits well with national priorities, since the high densities of Beijing and related consequences have led to a plan to decentralize the population of nearby Beijing (100 miles or 160 kilometers away), encouraging the movement of residents, businesses and government agencies to Tianjin as well as to the municipalities of Tangshan (location of the great 1976 earthquake), and Langfang (midway between Beijing and Tianjin) and Baoding in the province of Hubei. The newly integrated area would be called Jin-Jing-Ji.

    Chongqing has begun to grow, after having lost 1.7 million residents in the last decade. . But Chongqing itself is uncharacteristic and the most “uncitied” of Chinese municipalities. Chongqing is a largely rural province, governed directly from Beijing (like Beijing, Shanghai and Tianjin). The principal built-up urban area, Chongqing, has a population of less than 7.5 million, or one-quarter of the municipality population. Chongqing has grown 0.9 percent annually since 2010 and is adding 267,000 residents per year. The population losses of the last decade occurred principally in the rural areas, as the Chongqing metropolitan area added more than three million residents, according to United Nations data.

    Strong growth continues in Beijing, but at a much reduced rate. The annual population growth rate in Beijing has dropped 38%, to 2.3% annually. Beijing is adding 475,000 residents annually, second only to nearby Tianjin.

    Shanghai’s growth has fallen even further, to 60% below the 2000 (1.3%). Shanghai is adding 310,000 residents annually. Other municipalities in the Yangtze Delta region are not doing as well. Suzhou’s annual growth has dropped more than 90% to 0.3%. Hangzhou and Nanjing have seen their growth drop more than 70 percent, with Hangzhou growing 0.5 percent annually and Nanjing 0.7 percent.

    The Pearl River Delta, in Guangdong, was at the heart of China’s three decade economic miracle, with its export driven growth. All four of the Pearl River Delta’s largest municipalities have seen their population growth rates dropped by 70% or more. Shenzhen grew 4.0% in the 2000’s and grows barely 1.0% today. Guangzhou has fallen from 2.5% in the 2000 to 0.7%. Foshan, which grew 3.0% in the 2000’s, now grows only 0.5%. Dongguan has fallen from a growth rate of 2.5% in the 2002 0.4% over the past four years, the slowest among the Pearl River Delta giants.

    Some other municipalities have grown nearly as quickly as before. Zhengzhou, the capital of Henan, grew rapidly during the 2000’s, at 2.6%, and has maintained a growth rate of 2.1%. With the third fastest growth rate, after Tianjin and Beijing, Zhengzhou is adding 186,000 residents annually, Quanzhou (Fujian), one of the best world examples of “in situ” urbanization is growing at 85% of its previous rate, though only 0.9% annually. Wuhan (Hubei), a long-time central China manufacturing center has been similarly successful in retaining its growth, and now has an annual growth rate of 1.4%.

    Without complete information on all of China’s largest municipalities, it is difficult to assess the extent to which (if any) urban growth has slowed. Certainly, the national government remains committed to strong urban growth. On the other hand, with China’s slowing economic growth rates, there may be less reason to leave the countryside for the city.

    2014 Population & Comparison of 2000-10 and 2010-4 Growth Rates
    Municipalities of China Corresponding to Largest Built-Up Urban Areas
    Annual Population Growth % Annual Population Growth
    Municipality Population: 2014 2000-2010 2010-2014 2000-2010 2010-2014
    Beijing            21,516,000 3.8% 2.3%      604,300      476,000
    Chengdu            14,428,000 2.4% 0.7%      293,900        95,000
    Chongqing            29,914,000 -0.6% 0.9%     (166,700)      267,000
    Dongguan              8,343,000 2.5% 0.4%      177,400        30,750
    Foshan              7,351,000 3.0% 0.5%      185,600        39,250
    Guangzhou            13,081,000 2.5% 0.7%      275,900        95,000
    Hangzhou              8,892,000 2.4% 0.5%      182,100        48,000
    Jinan              7,067,000 1.4% 0.9%        89,200        63,250
    Nanjing              8,216,000 2.7% 0.7%      187,900        52,750
    Qingdao              9,046,000 1.5% 0.9%      122,100        82,750
    Quanzhou              8,440,000 1.1% 0.9%        84,600        77,750
    Shanghai            24,257,000 3.4% 1.3%      661,100      309,500
    Shenyang              8,287,000 1.2% 0.6%        90,200        45,250
    Shenzhen            10,790,000 4.0% 1.0%      334,900      108,000
    Suzhou            10,604,000 4.4% 0.3%      366,800        36,000
    Taiyuan              4,299,000 2.3% 0.6%        85,800        24,250
    Tianjin            15,168,000 2.8% 4.1%      308,900      557,500
    Wuhan            10,338,000 1.6% 1.4%      147,200      138,250
    Xiamen              3,810,000 5.6% 1.9%      147,800        69,750
    Xi’an              8,628,000 1.5% 0.5%      119,300        40,000
    Zhenghou              9,371,000 2.6% 2.1%      197,000      186,000
    Total          241,846,000 2.2% 1.2%   4,495,300   2,842,000
    Calculated from annual municipality reports to the National Bureau of Statistics and NBS data
    Comparable data not available for 5 municipalities corresponding to the 25 largest built-up urban areas
    Built-up urban areas from Demographia World Urban Areas


    Photograph: Still fast growing Zhengzhou (by author)

    Wendell Cox is Chair, Housing Affordability and Municipal Policy for the Frontier Centre for Public Policy (Canada), is a Senior Fellow of the Center for Opportunity Urbanism (US), a member of the Board of Advisors of the Center for Demographics and Policy at Chapman University (California) and principal of Demographia, an international public policy and demographics firm. He is co-author of the "Demographia International Housing Affordability Survey" and author of "Demographia World Urban Areas" and "War on the Dream: How Anti-Sprawl Policy Threatens the Quality of Life." He was appointed to three terms on the Los Angeles County Transportation Commission, where he served with the leading city and county leadership as the only non-elected member. He served as a visiting professor at the Conservatoire National des Arts et Metiers, a national university in Paris.

  • San Francisco With 200,000 More People — Would we be Better Off?

    You want something truly scary? Take a look at these mockups of what San Francisco might look like if we build all the housing that the developers say we need.

    According to writer Greg Ferenstein,

    The city probably needs somewhere north of 150,000 more units: most high-rises would be concentrated in the Eastern, Downtown, and mid-market areas, while every block in the entire city would need at least one 7-story building. Essentially, San Francisco would be Manhattan downtown and Paris everywhere else.

    Set aside that I never want to live in Manhattan (at any price), and that the infrastructure to handle 200,000 more people would be horrendously expensive (and developers are already refusing to pay their fair share for far lower levels of need).

    It’s not just “how to we build that much housing.” It’s how do we build maybe $20 billion or more worth of transportation capacity to handle that density. Manhattan has a citywide underground transit system with high capacity and no surface traffic issues. SF doesn’t, and won’t, as long as we can’t raise property taxes and refuse to charge developers for the cost of that new system.

    Never mind, let’s take Ferenstein’s idea and play it out. Suppose we decided as a city that we are willing to accept a lot more density in exchange for affordability. (This is something the mayor is promoting). Let’s say that the city really needs to build highrises all over the eastern side of town (why only the east?) and put mid-rise buildings everywhere.

    Let’s say we decide that 47.5 square miles of space are enough for1 million people, and that we are willing to give up everything about San Francisco that we would lose in the process.

    Remember, the streets in the highrise districts in Manhattan are much broader than the streets in SF, able to handle more traffic, with big sidewalks that can handle more pedestrians – and still it’s often overwhelming.

    Right now in SF, for example, I am able to walk down the streets at 5pm without being jammed in a pack of stressed-out pushing people, which is life in parts of NYC. It’s possible to able to take your young kids and your dog for a walk in a place where there’s actually room to walk.

    Imagine Mission and Valencia, being packed with thousands more pedestrians. Don’t even think about the traffic.

    In fact, unless we took entire streets and banned cars, forget about the bicycle lanes – they are narrow and limited and can’t easily handle say 200 percent more traffic.

    But again, whatever. Let’s say that it’s elitist to try to keep the charm of a human-scale city in a world-class city like SF, which Ferenstein calls “quaint.” Let’s say that our only hope of avoiding being a city of just the rich is to build all the apartments and condos anyone could every want to build.

    Let’s say we have that debate and decide that the need for affordable housing trumps all, and we will just have to live with the implications.

    So what happens if we let the developers build 200,000 new units – and prices don’t come down?

    That’s actually a pretty likely scenario. It’s happened in other places (NYC, for example, where lots of new housing is being built and prices are not in any way coming down.)

    It’s happened in SF so far, where we have built more market-rate housing in the past four years than at any point since the 1960s, and prices continue to soar.

    Ferenstein talked to an econometrics expert at a credit agency. Okay. No idea if this person has ever studied housing or housing price trends in San Francisco, but he has a model. It assumes that we have to build housing faster than the population grows. Nice.

    Except that market-rate housing causes population growth as fast as it solves it – that is, if your model is the traditional capital-market model, you can’t keep up with population growth by building. You might as well try to decrease traffic by building freeways; never works, never has – not in San Francisco.

    And how come we never talk about why the population is growing so fast, and why so much of that growth comes from one industrial sector that hires one type of workers?

    I emailed Ferenstein with my questions, and here’s what he said:

    Well, prices don’t fall here because we don’t build enough. It’s been an issue for decades. And, if you build enough units, prices will fall. You just have to build more supply than people. The question is whether it is possible to do so. But, I’m actually not advocating for that. I’m advocating for *some* solution. If the city decides it doesn’t want to grow, then it should be responsible for finding some solution where people can live and work in the same city–somewhere. Maybe it’s San Francisco. Maybe it’s Oakland. Maybe it’s a new city. But there has to be a giant metropolis somewhere. And, San Franciscans must realize, if jobs relocate elsewhere, they will suffer massive inequality and terrible commutes.

    Interesting argument. Of course, we are not talking about a city where people live and work; San Francisco’s housing crisis in large part the result of people living here and commuting to Silicon Valley, on private buses. The Valley cities build no housing at all, and expect us to solve the problem.

    And I would argue that if some tech jobs went elsewhere, we would have less inequality and less terrible commutes – it’s the displacement from too many people moving here for jobs when housing doesn’t exist that has created the problem. Most of San Francisco does better when there is slower growth in bubbly tech industries.

    There’s a much more interesting question that we might want to address: Suppose we built may 20,000 new units, or 30,000, or 50,000, spread all over the city – and every one of them was social housing, that is, housing that was never in the private sector? Would that bring down prices? Would that provide the same level of affordability, or maybe much more, than the Manhattan West model?

    Would that be a better deal?

    At the very least, we would know that the new housing would be affordable, instead of taking a huge gamble that the (failed) free market, and the (failed) econometric projections of the past, would save us.

    Oh, and what if we said that SF no longer wants to be the bedroom community for Silicon Valley, and will stop entitling things like private buses that make that trend possible?

    That’s a bit of a different picture.

    This piece originally appeared at 48hills.org.

    Photo: A mockup by Alfred Two for a Medium story on what an “affordable” SF might look like