Category: Urban Issues

  • The Great Train Robbery: Urban Transportation in the 21st Century

    Below is an excerpt from a new report published by the Chapman University Center for Demographics and Policy titled, “The Great Train Robbery: Urban Transportation in the 21st Century.” Read the full report (pdf) here.

    Productive cities could not exist without transportation. Economic performance and job creation in a city — by which we mean a metropolitan area — generally improve when people can reach more job destinations more rapidly. Over time, the ways in which people have reached their worksites has changed. In the distant past, nearly all people walked. Later, they relied on mass transit. Now, people in metropolitan areas rely primarily on cars for transportation to their jobs.

    However, in some cities, transit remains both critical and effective.
    These are metropolitan areas with strong historic — legacy — urban cores, which include large, downtown central business districts or CBDs. This is most notable in New York’s central business district, which accounts for a dominant 40 percent of all transit work trip destinations in the country, despite having only two percent of the nation’s jobs.

    Overall, barely 5.2 percent of all commuter trips nationally are on some form of mass transit. Among the nation’s 53 major metropolitan areas (places with over 1,000,000 population), only 11 exceed this 5.2 percent average.

    Read the full report here.

  • Postcards From the Zombie Apocalypse

    I’m regularly accused of being a doomer whenever I point out the obvious – that many aspects of how we’ve organized our affairs over the last several decades aren’t meant to last. So they won’t. The end of Jiffy Lube and Lean Cuisine isn’t The End. Civilization will carry on without them, I assure you. But when it’s suggested that our current set of arrangements won’t last forever people immediately imagine Mad Max, as if no other alternative exists. Things are going to change. They always have and they always will. The future will just be different. That’s absolutely not the same as saying the world is coming to an end. Clear eyed individuals who are paying attention can start to get a feel for who the new winners and losers are likely to be and place themselves in the best possible situation ahead of the curve. That’s a pragmatist’s view – not a doomer’s.

    It helps to explore previous versions of these regularly occurring historical shifts. Think of them as postcards from the last few rounds of the Zombie Apocalypse. Here’s a small farm town in rural Nebraska. Its population peaked in the 1920s. The period between World War I and the Great Depression was an especially prosperous time for such towns as commodity prices were high and technological innovation (the telephone, radio, automobiles, tractors, etc.) created an enormous amount of new wealth and opportunity. The 1920s was also an era of rampant unsustainable practices of all kinds that lead to the ruined soils and draughts of the Dustbowl and the collapse of speculative credit based financial institutions. The population of this town began to decline in the 1930s and is currently down to a few dozen souls.

    Remnants of some of that early twentieth century technology still litter pastures on the edge of town. One resourceful farmer organized these old car carcasses into a makeshift corral for his livestock.

    It’s possible to connect the dots from rural Nebraska to Detroit where those very same vintage vehicles were manufactured all those decades ago. Detroit peaked in population, economic power, and political influence in 1950. Today huge swaths of Motown look remarkably similar to the abandoned farms and small towns of the prairie. Entire city blocks are now cleared of people and buildings. The Zombie Apocalypse arrived there too. If small scale agriculture was made redundant by mechanization and industrial scale production, then industry itself was hammered by other equally powerful forces. Everything has a beginning, middle, and end.

    The most recent iteration of the Zombie Apocalypse has already begun to unfold in some places. Suburbia was exactly the right thing for a particular period of time. But that era is winding down. The modest tract homes and strip malls built after World War II  are not holding up well in an increasing number of marginal landscapes. I have been accused of cherry picking my photo ops, particularly by people who engage in their own cherry picking when discussing the enduring value of prosperous suburbs. But there’s too much decay in far too many places to ignore the larger trend. The best pockets of suburbia will carry on just fine. But the majority of fair-to-middling stuff on the periphery is going down hard.

    The desire to push farther out and build ever more upscale suburban developments in increasingly remote locations is palpable. That’s what a significant proportion of the population desires on some level. But in the same spots – often next to each other – is ample evidence that there’s something profoundly wrong.

    Not all farm towns died. Not all industrial cities collapsed into ruin. Not all suburbs will fail… But the external forces at work are going to favor some places much more than others moving forward. The trick is to understand what those forces are before everyone else does and position yourself to benefit instead of getting whacked by the shifts. Would you have rather sold your house in Detroit in 1958 when things were still pretty good, or wait until 1967 when the panicked herd began to stampede? Would it have been better to buy property in the desert in 1970 and take advantage of a wave of growth for a few decades, or buy now at the top of that cycle and slide down from here on out?

    The future drivers of change will be the same as the previous century – only in reverse. The great industrial cities of the early twentieth century as well as the massive suburban megaplexes that came after them were only possible because of an underlaying high tide of cheap abundant resources, easy financing, complex national infrastructure, and highly organized and cohesive organizational structures. Those are the elements of expansion.

    But once the peak has been reached there’s a relentless contraction. The marginal return on investment goes negative as the cost of maintaining all the aging structures and wildly inefficient attenuated systems becomes overwhelming. The places that do best in a prolonged retreat from complexity are the ones with the greatest underlying local resource base and most cohesive social structures relative to their populations. The most complex places with the most critical dependencies will fail first as the tide recedes.

    The next Zombie Apocalypse will relentlessly dismantle superficial decorative landscapes and highly leveraged economies of scale. Take away the twelve thousand mile just-in-time supply chains, heavy debt loads, and limitless cheap resources and you get a very different world. Over the long haul Main Street has a pretty good chance of coming back along with the family farm. But the shorter term in-between period of adjustment to contraction is going to be rough as existing institutions attempt to maintain themselves at all costs.

    This piece first appeared on Granola Shotgun.

    John Sanphillippo lives in San Francisco and blogs about urbanism, adaptation, and resilience at granolashotgun.com. He’s a member of the Congress for New Urbanism, films videos for faircompanies.com, and is a regular contributor to Strongtowns.org. He earns his living by buying, renovating, and renting undervalued properties in places that have good long term prospects. He is a graduate of Rutgers University.

  • On the Outside, Looking In

    The urban political base that was the foundation of African-American politics since the Civil Rights Movement is slowly eroding. Because of large-scale demographic trends at work in our metro areas, black political influence is in decline. Unless blacks become more inclusive (or intersectional) in our political approach, or better at building coalitions, we risk having our political concerns relegated to the margins, by virtue of where we live.

    I said as much nearly three years ago (“How ‘Black = Urban’ Ends”) and in subsequent posts I wrote nearly two years ago about urban and suburban demographic trends and how that’s reflected in our metro areas. I haven’t updated the data, but think the trends are more evident now than ever.

    How can I make this claim? One measure is the number of elected African-American mayors in our nation’s largest cities.

    Let’s look at how thing have changed over the last 25 years. In 1992 four of the ten largest cities in the nation were led by black mayors (New York, Los Angeles, Philadelphia and Detroit). Some cities, like Chicago and Cleveland, had already elected black mayors but no longer had them; others, like Seattle, Denver, Kansas City, Memphis, Minneapolis and San Francisco, would elect their first black mayors before the end of the decade. In all, by 2000, 13 of the 25 largest U.S. cities at the time, and 19 of the 50 largest, either had or would have a black mayor in office.

    But the election of black mayors in large cities would slow greatly after 2000. Today, only six of the 50 largest cities (Houston, Denver, Washington, DC, Baltimore, Kansas City and Atlanta) currently have black mayors. Five more cities in the top 50 — San Antonio, Jacksonville, Columbus, Sacramento and Wichita — had black mayors whose terms started in 2000 or later, but have since been replaced (most recently former San Antonio Mayor Ivy Taylor, just last month).

    Let’s be clear about a couple things, however. While the numbers of black mayors of large cities has declined over the last 25 years, the leadership of our cities is far more diverse — and representative — than it was then. There are more Latino, Asian and women mayors leading our large cities than ever before, and that’s a positive. But that doesn’t change the fact that there are fewer blacks in those positions.

    And while the election of big city mayors is relatively easy to track, identifying trends among other local officials is far more difficult. My guess is that city councils, county boards, special service districts and the like are also more diverse and representative, and may even have more African-Americans in those positions — even as the number of black mayors has declined. That also can be viewed as a positive.

    The Explanation

    How can this be explained? Two years ago I pulled some Census Bureau ACS data for the twenty largest U.S. urbanized areas (the contiguous portions of metro areas with more than 1,000 people per square mile) that offered some interesting findings:

    • Nationally, principal cities and their suburbs both grew at 4.4% between 2010 and 2014.

    • Metro area population growth is driven by strong growth among Hispanics, Asians and other groups.

    • Within urbanized areas, however, whites and blacks are growing at much slower rates – blacks at 4.0%, whites at just 0.3% nationwide.

    • Within the twenty largest urbanized areas, the number of white residents is growing in principal cities and decreasing in suburbs.

    • Similarly, the number of black residents in growing in suburbs, and essentially flat in principal cities.

    • At the metro level, 12 of the top 20 metro areas have principal cities where the white population is increasing while the black population is decreasing, or where the growth rate of whites exceeds that of blacks.

    • Similarly, 19 of the top 20 metro areas have suburbs where the black population is increasing while the white population is decreasing, or where the growth rate of whites exceeds that of whites.

    • Here’s how that information looks graphically. First, for whites, blacks, Hispanics, Asians and others, at the national level by city and suburban geography:

    And then, a focus in on whites and blacks nationally, by city and suburban geography:

    Now, let’s look at percentage changes of whites and blacks within the principal cities of the twenty largest urbanized areas:


    And lastly, at percentage changes of whites and blacks in suburban areas of the top 20:


    This data is in need of updating, and there is the question of whether trends evident within the top 20 urban areas are applicable to smaller ones. I’ll try to answer both when I can. In the meantime, simply put, Latino and Asian populations are growing in the largest cities and suburbs. Whites are growing more numerous in cities while declining in suburbs, while blacks are declining in cities and growing in suburbs.

    This is the first part of understanding the change in African-American political influence.

    Much of this seems to slip under the radar of urbanists, because of the second part of trying to understand this — your level of analysis impacts your ability to perceive, and evaluate, the trend. At the metro level, we see that suburbs are becoming more diverse as they add more people of color and cities see a return of white residents to core cities. After generations of practices put in place to exclude people of color from suburbs, this is applauded. But at the neighborhood level, it could be viewed quite differently — an influx of minorities where none previously existed in the suburbs, or an influx of whites in minority-dominated neighborhoods. Only one of these trends at the neighborhood level has truly been considered by most urbanists.

    Speaking of which — I want to dispel any notion that displacement related to gentrification plays a dominant role in this. That’s the narrative that’s fueled gentrification debates for years. But rarely does this narrative consider the aspirational appeal of moving to the suburbs that still resonates with many people of color, just as it did with earlier generations of whites in the 20th century. Lance Freeman, a professor of urban planning at Columbia University, has conducted considerable research that counters this assumption:

    “What distinguishes gentrification is not who moves out; it’s who moves in. In a gentrifying neighborhood, new residents are more likely to be well-off . As a result, the neighborhood’s poverty makeup can shift, even if no one leaves. In 2004, I found that a neighborhood’s poverty rate could drop from 30 percent to 12 percent in a decade with minimal displacement. That’s because gentrification often leads to new construction or to investment in once-vacant properties.”

    Thinking that gentrifiers are forcing this dynamic magnifies their importance, and diminishes the decision-making process of people of color.

    The Impact

    Back to politics. What will this mean going forward, given what we know about how cities are changing the political landscape? We know that cities are pushing forward to develop an urban political agenda; in the aftermath of the election of Donald Trump to the presidency, a key recommendation of Richard Florida’s book The New Urban Crisis was that cities should become more autonomous so they can more effectively address the challenges that impact them. But with increasing numbers of minorities in suburbia, and a growing number of urbanists who have “been there, done that” when it comes to the suburbs, does autonomy come at a price?

    Here’s how I see things playing out over the next decade or two. People of color will continue to move to suburbia in increasing numbers. They will do so for the same reasons people before them did — affordability, good schools, lower crime. They are doing so in part because suburbia is something that eluded them for so long, and is now within their grasp. As they move in, they will begin to wield more influence on suburban politics — suburban mayors, County Board representatives, more representation in state legislatures. We will see more minority representation in the suburbs — just as suburban political influence wanes.

    Why? Because cities are ascendant. It’s not just people flowing back into cities. It’s jobs, and it’s money. More and more people in residential and commercial real estate are finding out that the real money to be made is now in cities. Banks will change lending patterns to favor cities, and not suburbs. The case will be made — and rightly so — that urban density is the right response to lowering carbon emissions in a climate change world, and those who choose density will be rewarded. At the same time, those who choose sprawl will be punished. Banks won’t finance new development or renovations. Property values will decline. Tax dollars for infrastructure improvements will be harder to come by.

    I hardly see this happening to all suburban areas across the country. There are suburbs in some metro areas that are closely aligned with the core city (either by adjacency or transit) and will adapt accordingly. There are pockets of affluence in many suburbs that will not change, no matter what broader trends portend. There are other metro areas whose entire makeup is largely suburban in orientation, and any change they have will more likely be region-wide. As for metro areas with a bigger city-suburban divide, over time I see wealth being pulled from suburbia and back into cities in quite the same way it happened in the middle of the 20th century, in reverse. Minority political representation will continue to decline in cities and increase in suburbs — and they’ll find they own a landscape few people want.

    In other words, even as people of color are making decisions that work in their interests now, we may need to get accustomed to a future of being on the outside, looking in.

    This piece originally appeared on The Corner Side Yard.

    Pete Saunders is a Detroit native who has worked as a public and private sector urban planner in the Chicago area for more than twenty years.  He is also the author of “The Corner Side Yard,” an urban planning blog that focuses on the redevelopment and revitalization of Rust Belt cities.

    Photo: huffingtonpost.com

  • Transit’s Precipitous Decline

    Transit ridership in the first quarter of 2017 was 3.1 percent less than the same quarter in 2016, according the American Public Transportation Association’s latest ridership report. The association released the report without a press release, instead issuing a release complaining about the House Appropriations bill reducing funding for transit.

    The ridership report is devastating news for anyone who believes transit deserves more subsidies. Every heavy-rail system lost riders except the PATH trains between Newark and Manhattan and the Patco line between Camden and Philadelphia. Commuter rail did a little better, mainly because of the opening of Denver’s A line and trend-countering growth of riders on the Long Island Railroad. Most light-rail lines lost riders, though surprisingly many streetcar lines gained riders.

    In most cases where light-rail ridership grew, it did so at the expense of bus ridership. Los Angeles Metro gained 1.66 million light-rail riders but lost 8.73 million bus riders, or more than five for every new light-rail rider. Between the two modes, Phoenix’s Valley Metro lost 23,100 riders; Charlotte 20,200 lost riders; and Dallas Area Rapid Transit lost 193,100 riders. Similarly, Orlando’s commuter trains gained 22,700 riders but buses lost 98,500.

    Houston and Minneapolis-St. Paul lost bus riders but not quite as many as they gained in light-rail riders. Houston gained 192,100 light-rail riders but lost 154,200 bus riders. Minneapolis gained 337,000 light-rail riders but lost 270,000 bus riders. Only Seattle scored a large increase in light-rail riders (thanks to an expensive new line that opened March 16, 2016) without an offsetting decline in bus ridership.

    Many individual transit agencies suffered particularly catastrophic declines. Broward County (Fort Lauderdale), which wants to build a $200 million streetcar line, lost 12.8 percent of its transit riders. San Jose’s VTA, the agency I’ve sometimes called the worst-managed transit agency in the country, lost 11.9 percent. Birminghan lost 9.8 percent; Cleveland lost 7.9 percent; and San Diego lost 6.2 percent. In San Francisco, Muni lost 6.4 percent, BART lost 5.6 percent, SamTrans lost 8.9 percent, AC Transit (Oakland) lost 0.8 percent, and Central and Eastern Contra Costa County lost more than 7.0 percent.

    One factor contributing to the losses might be that 2016 was leap year, so its first quarter had 1.1 percent more days than 2017. But both quarters had exactly the same number of work days (62 or 64 depending on whether you count King’s Birthday and President’s Day as holidays or work days), so leap day counted for less than it might have.

    Many of these losses are just a continuation of trends that began in 2009 or earlier. As the Antiplanner noted last month, several major transit agencies lost 25 to 35 percent of their riders between 2009 and 2016, and most of these continued to lose in 2017. Moreover, none of the factors that led to these declines–low fuel prices, high auto ownership rates, rising costs, increasing competition from ride-hailing services–are going away, and some are only going to get worse.

    Since 1970s, the transit industry has received well over a trillion dollars in subsidies while seeing a 20 percent drop in the average number of rides urban resident take each year. All this should lead Congress and state legislatures to question why taxpayers ought to continue subsidizing this fast declining industry.

    This piece first appeared on The Antiplanner.

    Randal O’Toole is a senior fellow with the Cato Institute specializing in land use and transportation policy. He has written several books demonstrating the futility of government planning. Prior to working for Cato, he taught environmental economics at Yale, UC Berkeley, and Utah State University.

    Photo by METRO96 [CC BY-SA 3.0], via Wikimedia Commons

  • Deep Ellum

    I recently wrote about the need to embrace reality when it comes to land use regulation, culture, politics, and economics. My interpretation can seem a bit… dark. It’s not my intention to discourage people looking to make a positive difference in their communities. I’ve just seen how things tend to play out and the process doesn’t exactly favor mom and pop operations that are juggling day jobs, raising kids, and working on limited budgets. Telling motivated individuals to go out into the world and build great new small scale walkable mixed use urbanism of the kind once found on every Main Street in North America is disingenuous. Yes, it’s “possible.” But it’s also incredibly unlikely in most places. Building from scratch or even modifying existing properties isn’t the answer for these folks. We need to be honest about that.

    I’ll use the Deep Ellum neighborhood in Dallas as an example. A few years ago I was in Dallas to attend a series of overlapping city planning conferences. Deep Ellum was a recurring theme and a number of events were held there as demonstration projects. Back in 1973 city officials bulldozed most of the neighborhood to make way for a massive elevated highway. Urban removal killed two birds with one stone. State and federal money provided commuter infrastructure that supported the ever growing new middle class suburbs on the edge of town while simultaneously wiping away blight near downtown. What’s not to love? (Anyone want to guess who lived in Deep Ellum before it was razed?)

    Dallas locals like Jason Roberts of Build a Better Block as well as fellow participants from out of state like Street Plans Collaborative advocate fast, cheap, temporary, and iterative programming for neglected neighborhoods. Potted plants, inexpensive outdoor furniture, food trucks, street vendors, bicycle accommodations, string lights, outdoor movie nights, and live music can reactivate otherwise dead streets, vacant lots, and disused storefronts. If done sensitively with the active participation of the people who already live in the neighborhood these techniques can be transformative. The goal is to discover what works and build upon those successes incrementally over time. It’s bootstrap urban revival on a shoestring budget.

    These days market demand for urban living is strong and there’s money to be made in redeveloping what’s left of these old neighborhoods. They have “authenticity” and “texture” that can’t be duplicated in new construction. Deep Ellum is well located within walking and biking distance of the central business district as well as Baylor University Medical Center. There’s a spread between what these buildings are now and what they could be with new investment and institutional support.

    While I was in town conference hopping I attended a side presentation organized by a group of prominent business leaders who advocate pulling down the highway that cuts through Deep Ellum. This meeting was held at the behest of the American Conservative and D Magazine populated by a lot of old white guys in suits, not crunchy hippie treehuggers.

    The business argument is simple. The aging highway is at the end of its design life and neither the city of Dallas nor the Texas Department of Transportation has the money to rebuild it since both are functionally insolvent. Dismantling the highway would liberate a huge amount of downtown land that could be redeveloped by the private sector. Construction jobs would be created up front, market demand for urban living would be satisfied, and substantial tax revenue would be generated for the city for many decades into the future. In other words, a cost center would become a profit center.

    And let’s not forget there’s a tremendous amount of money to be made for well placed developers with deep pockets. Hence all the wine and cheese gatherings and thought leaders with their PowerPoints. I hasten to add this isn’t corruption per se. The cost in time, money, and political wrangling is enormous. Only exceptionally well funded organizations can work their way through these endless processes and achieve any kind of worthwhile goal. Why would anyone bother if there wasn’t an equally massive payoff at the end?

    The reality of how land is redeveloped in this context is simple. The cost of buying distressed property, site remediation, upgrading the infrastructure, accommodating all the requirements of multiple bureaucracies from the fire marshal to institutional investors – all while still creating a product the market wants and can actually afford to pay for… leads to this. It’s referred to as the Texas Doughnut. It’s an entire city block of multi-storied parking garages wrapped in a skin of apartments. Sometimes they’re rentals, sometimes they’re condos for sale. If your goal is to recreate the fine grained individually owned mom and pop buildings of a previous century that’s just not going to happen. Again, it’s not impossible. It’s just highly unlikely to pan out for a dozen reasons having to do with the fact that the society that build Main Street no longer exists.

    So let’s go back to the smaller older existing buildings in Deep Ellum. These are at a scale an average family can wrap its mind around. Lots of people dream of owning an independent business and living upstairs. It’s a great arrangement that’s been used successfully for eons all around the world. But there are complications here. The most pragmatic way to purchase and renovate buildings like these is with cash. Some people have it. Most don’t. Private equity (A.K.A. asking your father-in-law or a collection of dentists and chiropractors from the country club for money) works if you have that kind of personal situation and charisma…

    Don’t expect to go to just any random bank and get a thirty year mortgage for one of these places. Almost all banks see such properties as “non-conforming.” They’re used to writing loans for four bedroom two bath homes on cul-de-sacs and then bundling them off at the end of the month to pension funds that require consistency in the product profile. If these were ten thousand square foot strip malls with fifty seven parking spaces on a road with forty thousand cars driving by each weekday there’d be an institutional bundle for that. Same with a two hundred unit garden apartment complex. But a fifteen hundred square foot bakery or barber shop with an apartment upstairs? What kind of freaky platypus is that?

    Some people will sit you down and calmly explain that the guidelines for plain vanilla federally insured mortgages technically include buildings with up to four units and up to 25% commercial space in an otherwise residential building. On paper it’s no different than a single family home. That’s absolutely true. But many older buildings are closer to fifty/fifty residential/commercial. Even if you find a building that does conform you still need to find a banker who will grant that loan in this neighborhood. Again, it’s absolutely possible. But it’s not easy. And if a building is too cheap – generally under $50,000 – no bank will write a mortgage either.

    A commercial loan with a short term – typically eight years – and a significantly higher interest rate might be offered instead of a standard thirty year mortgage. Maybe. As part of the due diligence process the right bank will make you prove that the building is structurally sound, conforms to modern codes, and has a pro forma that can cash flow properly. And then there’s the cost of renovations, complying with the Americans With Disabilities Act, the fire code, and existing zoning regulations… It can be done. But something as basic as installing fire sprinklers or an elevator can easily kill a proposed project. It’s just too expensive in a building with too little value. Sorting out all this stuff takes real skill and experience. I know several seasoned mid-size property developers who lost everything to bankruptcy because their high quality projects came on line just in time for a big market correction and they couldn’t service their debts. And these folks were light years ahead of an ordinary person looking to invest in a modest property.

    The scenario I see all over the country is formulaic. Older buildings in formerly derelict neighborhoods are bought and renovated by well funded and skilled firms who specialize in this kind of development. Shops and apartments are then rented to individuals. These legacy districts become amenity centers that add value to new large scale infill development of the Texas Doughnut variety. There are exceptions, but that’s mostly what I see. It’s neither good nor bad. People sometimes complain about gentrification, but the alternative is for these neighborhoods to continue to decline until they can’t be saved at all. It might be nice if every aspect of society changed to allow other options, but I’m not holding my breath. At the end of the day we live in the world we live in. We have the rules and procedures we have. Shrug. Mom and Pop need to find a new gig.

    This piece first appeared on Granola Shotgun.

    John Sanphillippo lives in San Francisco and blogs about urbanism, adaptation, and resilience at granolashotgun.com. He’s a member of the Congress for New Urbanism, films videos for faircompanies.com, and is a regular contributor to Strongtowns.org. He earns his living by buying, renovating, and renting undervalued properties in places that have good long term prospects. He is a graduate of Rutgers University.

  • Should Transit Fares Cover Operating Costs?

    Maryland has long had a state law requiring transit systems to collect enough fares to cover at least 35 percent of their operating costs. While it is admirable to set a target, this particular target is disheartening for two reasons.

    First, 35 percent is a pretty low goal. The 2015 National Transit Database lists 48 transit operations that cover between 100 and 200 percent of their costs, including New York ferries, the Hampton Jitney, several other bus lines, and a bunch of van pooling systems. No rail lines cover 100 percent of their operating costs, but BART covers 80 percent, Caltrains covers 72 percent, New York and DC subways cover 64 percent, and New York commuter trains cover 60 percent. On average, commuter bus and commuter rail systems earn half their operating costs. So 35 percent lacks ambition.

    Even worse, most Maryland transit operations don’t come close to meeting the target. Maryland commuter trains cover 45 percent of their costs. But Baltimore’s light rail only covers 17 percent, and its heavy rail covers a pathetic 13 percent. Standard bus service also covers just 13 percent of its costs, though commuter buses come closer to the target, reaching 28 percent.

    Maryland lawmakers have figured out a solution to the second problem, if not the first. They simply passed a bill abolishing the target. Now, transit advocates hope, the state can spend even more money building obsolete transit systems that won’t be able to afford to maintain because they can’t even cover a third of their operating costs.

    Transit is “not profitable,” said one advocate, “but it’s essential for an economically competitive region.” Just how economically competitive has Baltimore been since it sunk billions of dollars into light- and heavy-rail lines that don’t cover even a fifth of their operating costs? Maryland certainly won’t make itself more economically competitive by increasing the tax burden still further so they can build more obsolete transit lines.

    Failing to cover costs isn’t a symptom that you are economically competitive. It is a symptom that you’ve failed to provide things that people need and want. The Antiplanner can understand why people think we need to subsidize food stamps or other aid to low-income people. I can’t understand why people think nothing of throwing huge amounts of money towards marketable operations like transit.

    C. Northcote Parkinson, the author of Parkinson’s Law, said that organizations that set goals low so they would be easy to meet were suffering from a disease he called injelititis. The transit industry has been suffering from this disease since the mid-1960s, when it discovered it could live off the public trough rather than actually have to provide services that people want. Once this disease reached its late stages, he said, the only cure required “a change of name, a change of site, and an entirely different staff.”

    There’s still a chance that Maryland’s governor may veto the bill. Let’s hope he does.

    This piece first appeared on The Antiplanner.

    Randal O’Toole is a senior fellow with the Cato Institute specializing in land use and transportation policy. He has written several books demonstrating the futility of government planning. Prior to working for Cato, he taught environmental economics at Yale, UC Berkeley, and Utah State University.

  • Can the Chicago White Sox Help Turn Around the South Side?

    As a displaced Detroit Tigers fan who adopted the Chicago White Sox as my team, I often wonder how our city’s other team, the Cubs, became an integral institution in the remaking of our city, while the White Sox have not. I published a piece at my Forbes site some time ago that detailed my thoughts on how the Cubs facilitated that transition. The Cubs’ growth in prominence, particularly from 1969 until today, parallels the city’s transition from Rust Belt to Global City. Conversely, the White Sox have diminished in prominence over the same span. I realized the Sox missed out on the locational advantages the Cubs enjoyed, and circumstances and mistakes have hurt them.

    Once again, readers may ask, “what does any of this have to do with cities?”, so let me explain. Baseball, I believe, holds a special place as a sport that is an institution and amenity for the places they call home. As the nation’s oldest professional team sport, it has an enduring history in many of our largest cities. In its early years, major league teams sought to establish close relationships with the neighborhoods that surrounded them; with 77 (and now 81) home games scheduled each year, that was just a good business practice. Teams in other sports have tried to replicate the institution/amenity feel, with varying degrees of success. Basketball and hockey are winter sports and played indoors. Football plays to much larger crowds and with far fewer games, and is far more likely to be viewed as a neighborhood intrusion than an amenity. But baseball is summer. It’s (mostly) outdoors. It can be easily integrated into a neighborhood fabric. So, yes, I see baseball teams, baseball stadiums, as having an outsized impact on city revitalization that other sports teams can’t compete with.

    What I tried to capture in my Forbes piece is that before the Cubs enjoyed their current baseball success, they have for some decades enjoyed that locational success, and parlayed that into a successful partnership with the surrounding neighborhood. From that piece:

    “Starting in 1969, the Cub mythology begins to grow, and television becomes a bigger part of it. Chicago kids would come home from school to watch day baseball games. Plays by David Mamet were being written about bleacher bums. At the same time, the economies of north and south were continuing to diverge. Institutions like DePaul and Loyola University, Children’s Hospital, and others, were attracting more of the Midwest’s best and brightest to study and work. And the Cubs became a very attractive amenity to people returning to cities exactly for that reason.

    It was in the 1980s that the real and enduring changes occurred. WGN became a cable television superstation, and now Cub games were broadcast nationally. Throughout the ’80s, especially with Harry Caray at the helm in the broadcast booth, every game was a celebration of what Chicago, and specifically North Side Chicago, had to offer. A jewel of a ballpark, day baseball, views of sailboats on Lake Michigan and a dramatic skyline nearby — all of this became not just a Midwestern phenomenon, but a national one. Suddenly, it wasn’t just Midwestern kids who dreamed of moving to big city Chicago. It became national.”

    In other words, the heart of Cubbie fandom lies in its place: the old ballpark, the surrounding neighborhood, the bars and restaurants, the nearby lakefront, even the nearby eds and meds institutions that employ many of the neighborhood’s residents — they all blend together to create a unique and enviable environment.

    Conversely, over the last 50 years or so the White Sox lost whatever locational advantage they had. Deeply identified as the “South Side’s Team”, their fortunes diminished just as the South Side’s:

    Meanwhile, as the Cubs became more popular in the late ’60s, the luster on the White Sox began to dim. The Bridgeport neighborhood that is home to the Sox is in many respects the polar opposite of the Cubs’ Lake View neighborhood. It’s working-class, with far fewer eds and meds institutions, and a Bronzeville neighborhood — also known as the Black Belt — that stood between it and the south lakefront. While Cubs fans sitting in the upper reaches could see sailboats on the lake, Sox fans could see a never-ending row of public housing towers.

    Beginning in the late ’60s and early ’70s the fortunes of the Cubs and White Sox diverged as dramatically as their respective parts of the city.

    First, Some Facts

    Let’s try to establish a context for the Cubs and White Sox by using the most accepted measure of popularity in baseball, attendance. Since 2001 the Cubs have been in the top tier of MLB attendance, with an average annual rank of eighth out of thirty teams. The Cubs are regularly in the mix with the Yankees, Dodgers, Cardinals, Giants, Mets, Red Sox and Angels as a top MLB draw. Over this period the Cubs have averaged just under 3 million fans per season, or about 37,000 per game. Cubs attendance has proven to be remarkably consistent and impervious to big fluctuations in wins and losses. The Cubs paid a big price in 2013 when attendance dropped by 11.8% after disappointing seasons in 2011 and 2012, but overall the Cubs increased attendance at a rate of 1.2% a year over the last sixteen seasons. MLB attendance has grown at a rate of about 0.6% annually since 2001.

    The White Sox, however, are quite a different story. Since 2001 the Sox have consistently ranked in the bottom third in MLB attendance. They’ve averaged just over 2 million fans annually, or nearly 26,000 per game. That’s enough to rank them 21st out of thirty teams in that span.

    I haven’t been able to document this yet, but I suspect the Sox may be among the more win-sensitive teams in MLB. Attendance jumped 21.3% from 2004 to 2005, the year the Sox won the World Series, and jumped another 26.2% in 2006, in the World Series afterglow. The Cubs have no such huge year-to-year gains over the last sixteen seasons. However, subsequent poor seasons meant attendance has dropped for eight consecutive seasons before ticking upward again in 2015. The Sox have gained about 0.5% annually in attendance since 2001, just under the MLB average.

    Cubs fans, and Chicagoans in general, seem to accept the Cubs/Sox fandom differential as an immutable fact, but that’s not the case. Historically speaking, as I wrote previously about this at Forbes, the White Sox regularly outdrew the Cubs following World War II and into the ’60s. From the late ’60s to early ’80s, there was general attendance parity between the teams. Since the early ’80s, the Cubs have regularly outdrawn the Sox. The Cubs have outpaced the Sox in attendance every year since 1992.

    Downtown, Neighborhood and Suburban Teams

    The Cubs are one of just a handful of major league baseball teams that have maintained a strong neighborhood identity and association. Out of 30 MLB teams, just nine are located in neighborhood locations today, with 18 located in downtown areas and three in the suburbs (including the Atlanta Braves, who moved to suburban Cobb County this season). Here are the nine so-called neighborhood teams, located at least two miles outside of the center of a city’s CBD:

    • New York Yankees
    • Boston Red Sox
    • Chicago White Sox
    • New York Mets
    • Philadelphia Phillies
    • Washington Nationals
    • Miami Marlins
    • Oakland Athletics
    • Chicago Cubs

    Philadelphia, Washington, Oakland and Miami deserve special attention. By my eyes, the Phillies, Nationals and A’s all play in stadiums that are beyond their cities’ central business districts, but appear to be located in areas that are largely warehouse or former manufacturing districts, as opposed to residential or mixed-use areas. The home of the Miami Marlins opened in Miami’s Little Havana in 2012, so one could argue it’s had little time to develop — yet — a strong relationship with the surrounding neighborhood. (Kansas City — the Royals’ Kauffman Stadium, although within the city’s limits, is so far from the city’s downtown, and relies on interstate access to reach it, that it gets a “suburban” designation from me.)

    The Yankees, Red Sox and Cubs are each intimately connected with their surrounding neighborhoods. Yankee Stadium is in the Bronx; while it doesn’t seem to have the same revitalization impact on its surrounding area, it is within easy reach affluent Manhattan. The Red Sox’ Fenway neighborhood and Fenway Park might be the closest analogue to the Cubs’ Lake View/Wrigleyville neighborhood and Wrigley Field in terms of vibrancy and impact on the city. I’m less familiar with the connection between the Mets and the nearby Queens neighborhoods.

    What Happened?

    The White Sox, however, seem to have far less impact than the others on the surrounding neighborhoods. In fact, the White Sox’ home seem most similar to the Oakland A’s — beyond downtown, and in the less-favored area of a two-team baseball market.

    I don’t know what happened with the A’s and Oakland, but I think it’s easy to figure out how the neighborhood fortunes, and subsequently the fan fortunes, of the Cubs and White Sox diverged. Keep in mind that prior to about 1950, the areas around Wrigley Field and Comiskey Park were more similar than they are today. But the area around Clark and Addison retained its neighborhood fabric, while the area around 35th and Shields mostly lost it. A few things factored into the divergence:

    Macro: the general decline of the South Side. A quick and easy way of seeing the difference between the North and South sides is looking at the median household incomes for the communities that house the respective teams, Lake View (Cubs) and Bridgeport (Sox). In 1970, the median household income in Lake View (in 2014 dollars) was $44,889. In Bridgeport, it was $48,548. In 2015, median household income in Lake View was $76,424, and in Bridgeport it was $42,951. This plays out more broadly as well; wealth has flowed into the north lakefront neighborhoods of the Near North Side, Lincoln Park, Lake View and Edgewater, and it flowed away from Bridgeport, Bronzeville, Washington Park and Woodlawn.
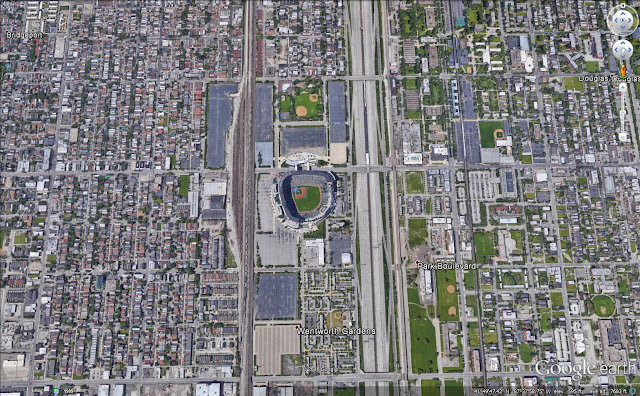
    Micro: Sox Park’s hemmed-in geography. The home of the White Sox has long been hemmed in by two freight rail lines, about a third of a mile apart — the Norfolk Southern line on the west and the Rock Island on the east. For much of its stretch on the South Side, the narrow corridor has been treated as a no-man’s land with manufacturing uses, intermodal facilities, and poor quality housing strewn in. The intact Bridgeport neighborhood lies further west, and Bronzeville further east. A look at an aerial of U.S. Cellular Field highlights this:

    Lack of nearby institutions and amenities. Several key institutions are located near Wrigley Field — DePaul and Loyola universities, several hospitals — that make the area an attractive place to live. Near old Comiskey, the much smaller Illinois Institute of Technology and Mercy Hospital are still there, but their presence might not be felt in the same way in the community as those further north.

    Public housing construction. The year 1949 began a 20-year period where public housing was constructed just to the east of Comiskey Park. Dearborn Homes, Stateway Gardens, and Robert Taylor Homes were built within eyesight of Comiskey over that period, concentrating tens of thousands of low-income residents along the area’s eastern edge.

    Dan Ryan Expressway construction. Between 1957 and 1962, the Dan Ryan Expressway was constructed just feet from Comiskey’s eastern edge. Remember the narrow rail corridor? The 16-lane expressway, with a new public transit line in the median, made it even narrower.

    When you combine these with some management differences between the Sox and Cubs, like the spotty radio and TV presence the Sox had when compared to their Cub brethren, and the failed venture to showcase Sox as a pay-per-view attraction on CableVision in the early ’80s, and it becomes clearer how the two teams took vastly different tracks.

    Paths to White Sox Success — And Urban Revitalization

    That being said, I think there are ways the White Sox could reclaim the kind of locational advantage they once had and the Cubs currently enjoy. However, it would mean the Sox would have to view themselves as a city institution invested in the revitalization of its surrounding area and employ unconventional tactics. Otherwise, they may need to consider other options. Here’s what they can do:

    Stay at 35th and Shields — and partner with commercial and residential developers. In the late ’80s, when the White Sox threatened to leave Chicago and received the public gift of U.S. Cellular Field in return, a counter-proposal was floated by Chicago architect Philip Bess to create Armour Field. It was to be a stadium that wouldn’t just be firmly integrated into the fabric of the surrounding community — it would create community where none currently existed. Take a look:


    The oddly-shaped outfield harkens back to the New York Giants’ Polo Grounds, and Bess took pains to re-create the outlines of old Comiskey. More importantly, Bess frames the stadium with mixed-use development to the east, west and south of the stadium, and includes a circle at 35th and Wentworth that creates a signature entrance into the area. I’m guessing this type of development would bring the same types of residents who live near Wrigley today. I’ve never heard an explanation from the Sox for why this proposal was rejected, but I assume costs had much to do with it. And yes, working on the commercial and residential sides of the project would be a challenge.

    This, of course, is just one redevelopment option. If the Sox are serious about staying at 35th and Shields, it would be in their best interest to lead the revitalization of the surrounding area.

    Find another neighborhood site on the South Side. There are likely other spots on the South Side that don’t have the constraints that prevent Cubs-style community cohesiveness and neighborhood connection. One such site could’ve been the 49-acre site of the former Michael Reese Hospital on the Near South lakefront; it was formerly considered as the site for the Olympic Village in Chicago’s 2016 Olympic bid, but is now being redeveloped as a major mixed-use development. I’ve also considered locations in largely manufacturing areas adjacent to the Southwest Side’s Orange Line. I’m sure there are other possible sites out there. All, however, would probably come with some significant neighborhood resistance, and have the same cost challenges inherent in the above scenario.

    Find a downtown or near-downtown location. It’s quite possible that in a two-team baseball market, only one team can be the “neighborhood” team. If so, the Cubs are it. The White Sox could find a site downtown or nearby (to be sure, very expensive) and begin to shed their South Side identity by becoming the team at the center of the metro area. Even though they’re not in a two-team market, the Detroit Tigers invigorated their fan base by moving from antiquated Tiger Stadium to Comerica Park in 2000, leaving the city’s Corktown neighborhood for a downtown locale. During the ’90s the Tigers were among the lower rung teams in attendance, drawing 1.5 million annually. The Tigers vaulted into the middle tier with the new stadium (and some on-field success) in the 2000’s, averaging 2.5 million a season. Of course, the last option would be to…

    Move to the suburbs. The White Sox flirted with suburban locations in the late ’80s. However, suburban stadium locations are seen less often today, particularly for baseball stadiums (Atlanta Braves excepted). Perhaps it’s because suburbs or suburban counties are less able to put together the public financing packages that team owners often demand (or extort?). If it were to happen, my guess is that the Sox would target relatively affluent south or southwest suburban communities like Orland Park or Bolingbrook, so that the team could easily attract fans from a broad spectrum of the metro area without completely compromising its South Side heritage. Honestly, I see this as highly unlikely, as the return-to-the-city movement is moving ahead in Chicago as much as anywhere.

    I couldn’t fathom a move to another city now, so I won’t explore it as an option.

    Bottom line, despite their on-field failures over the years, the Cubs have done a masterful job of taking advantage of locational opportunities presented to them. The White Sox have had a more difficult go of it for the last 60 years or so, but could turn it around with the right kind of thinking. Here’s hoping the White Sox can become the kind of integral institution of South Side change that the Cubs have been up north.

    This piece originally appeared on The Corner Side Yard.

    Pete Saunders is a Detroit native who has worked as a public and private sector urban planner in the Chicago area for more than twenty years.  He is also the author of “The Corner Side Yard,” an urban planning blog that focuses on the redevelopment and revitalization of Rust Belt cities.

    Top photo: U.S. Cellular Field, home of the White Sox. Source: sportingnews.com

  • Moving Away from Toronto and Montréal

    The latest Statistics Canada data indicates that people are leaving Toronto and Montréal in large numbers since the 2011 census. Even so, both metropolitan areas continued to grow through the 2016 census as a result of net international migration and the natural increase of births over deaths (Figure 1). It turns out that Canada’s urban pattern is much more like that of the US, as well as other high-income countries, than many may suppose.

    Toronto

    Toronto lost 128,000 net domestic migrants, while Montréal lost 89,000 representing 2.3 percent of its total 2011 population.

    At the same time, the migration has been regional rather than national. In the case of Toronto, more than 90 percent of the net migration loss was to other areas of Ontario (118,000), as opposed to other provinces (10,000). The metropolitan area losses were concentrated in the city of Toronto, which lost a net 119,000 domestic migrants, while the suburbs lost 9,000. The city’s loss of 4.5 percent was nearly double that of the metropolitan area and 15 times that of the suburbs.

    Despite the late 1990s municipal amalgamation that increased the population of the city by three times, Toronto has become a majority suburban metropolitan area. The city of Toronto now has fallen to 46 percent of the population from 53 percent in 2001.

    Part of the metropolitan area loss is likely the result of Toronto’s higher house prices and shortage of single family homes that people prefer (see: Ryerson University Research Cites Urban Containment Policy as Major Factor in Toronto House Price Escalation), with nearby metropolitan areas experiencing strong net domestic migration gains. Up to one-half of Toronto’s loss may have been picked up by Oshawa (16,000), Hamilton (12,000), St. Catharine’s-Niagara (8,000), Barrie (7,000), Guelph (4,000), Brantford (4,000) Kitchener-Cambridge-Waterloo (1,000) and Peterborough (1,000), which are served by the commuter rail or bus services of Go Transit (Metrolinx).

    Moreover, with its highly dispersed employment patterns, commuters from exurban metropolitan areas can find employment much closer to home than downtown Toronto, with its less than 15 percent of metropolitan employment. A few years ago, it was reported that the largest employment center in Canada was the sprawling area around Pearson International Airport (Toronto-Missassauga-Brampton), rather than downtown Toronto. Meanwhile, the Kitchener-Cambridge-Waterloo area has emerged as Canada’s answer to Silicon Valley.

    Montréal

    Things were similar in Montréal, which lost 89,000 net domestic migrants, also representing 2.3 percent of its 2011 population. Unlike Toronto, Montréal’s loss was evenly split, with 45,000 moving out of Quebec and 44,000 moving to other parts of Québec.

    The concentration of net domestic migration losses were even more concentrated in the core than in Toronto. The ville de Montréal lost 117,000 net domestic migrants, while the suburbs gained 28,000. The ville’s loss of 7.0 percent was three times the rate of the total metropolitan area.

    Vancouver

    Vancouver, the third largest metropolitan area, also lost domestic migrants (12,000) at a rate of 0.5 percent relative to its 2011 population. Vancouver gained 10,000 net domestic migrants from other provinces, while losing 22,000 to other parts of British Columbia. Kelowna and Victoria appear to have prospered at Vancouver’s expense, both adding a 7,000 net intraprovincial migrants.

    Alberta: Calgary and Edmonton

    As has been the case for years, Alberta’s two largest metropolitan areas have led the national statistics. Calgary, the fourth largest metropolitan area added 55,000 net domestic migrants between 2011 and 2016. Much of this 4.6 percent gain was from other provinces (41,000). With the recent oil bust, which has hit Alberta hard, net interprovincial migration dropped from 7,000 in 2014-2015 to minus 1,000 in 2015-2016.

    Edmonton, Alberta’s second largest metropolitan area and Canada’s sixth largest, added even more net domestic migrants (72,000), for the strongest performance in the country. This 6.2 percent gain was also concentrated in people from outside the province (48,000). As in Calgary, net interprovincial migration fell strongly from 2014-2015 to 2015-2016, from 10,000 to 2,000.

    It remains to be seen how the recovering energy industry will impact the economy and migration trends in Alberta.

    Ottawa-Gatineau

    Ottawa-Gatineau (Ontario- Québec) has Canada’s capital and is the only major metropolitan area that spans two provinces. Ottawa-Gatineau is Canada’s fifth largest metropolitan area although likely to be overtaken almost at any time by faster growing Edmonton. Ottawa-Gatineau gained 14,000 net domestic migrants between 2011 and 2016 (1.1 percent). Most of the net domestic migration was from other parts of Ontario or Québec (10,000).

    Smaller Census Metropolitan Areas

    Among the other 27 census metropolitan areas that had been designated by the 2011 census, the largest percentage gain was in Kelowna, BC, at 8.4 percent. Saint John, New Brunswick had the largest net domestic migration loss at minus 3.5 percent.

    Overall Results

    Approximately two thirds of Canada’s population resides in the census metropolitan areas. Between 2011 and 2016, there was a net domestic migration of only 17,000 from outside the metropolitan areas (Table). Among the six major metropolitan areas, there was a net domestic migration loss of 89,000, probably driven in large measure by the “severely” or “seriously” unaffordability of housing virtually everywhere but Ottawa-Gatineau. While new metropolitan areas are likely to be designated (like Lethbridge, Alberta since 2011), it may be that there will be little additional net domestic migration to the largest metropolitan areas, and what will occur is largely in the suburbs.

    Net Domestic Migration: Canada Metropoltian Areas: 2011-2016
    Census Metropolitan Area 2016 Census Population Net Domestic Migration % of 2011 Population
    Toronto, Ontario      5,928,040         (128,432) -2.3%
    Montréal, Quebec      4,098,927           (88,913) -2.3%
    Vancouver, British Columbia      2,463,431           (11,928) -0.5%
    Calgary, Alberta      1,392,609             55,415 4.6%
    Ottawa-Gatineau, Ontario/Quebec      1,323,783             14,119 1.1%
    Edmonton, Alberta      1,321,426             71,620 6.2%
    Québec, Quebec         800,296               2,683 0.3%
    Winnipeg, Manitoba         778,489           (17,812) -2.4%
    Hamilton, Ontario         747,545             12,208 1.7%
    Kitchener-Cambridge-Waterloo, Ontario         523,894               1,390 0.3%
    London, Ontario         494,069               4,534 1.0%
    St. Catharines-Niagara, Ontario         406,074               8,030 2.0%
    Halifax, Nova Scotia         403,390               2,926 0.7%
    Oshawa, Ontario         379,848             16,028 4.5%
    Victoria, British Columbia         367,770             17,647 5.1%
    Windsor, Ontario         329,144                  (48) 0.0%
    Saskatoon, Saskatchewan         295,095               8,672 3.3%
    Regina, Saskatchewan         236,481               2,004 0.9%
    Sherbrooke, Quebec         212,105               1,792 0.9%
    St. John’s, Newfoundland and Labrador         205,955               7,949 4.0%
    Barrie, Ontario         197,059               6,943 3.7%
    Kelowna, British Columbia         194,882             15,171 8.4%
    Abbotsford-Mission, British Columbia         180,518               2,952 1.7%
    Greater Sudbury, Ontario         164,689             (1,285) -0.8%
    Kingston, Ontario         161,175               5,572 3.5%
    Saguenay, Quebec         160,980                (782) -0.5%
    Trois-Rivières, Quebec         156,042               2,721 1.8%
    Guelph, Ontario         151,984               3,384 2.4%
    Moncton, New Brunswick         144,810               2,425 1.7%
    Brantford, Ontario         134,203               3,603 2.7%
    Saint John, New Brunswick         126,202             (4,512) -3.5%
    Peterborough, Ontario         121,721               1,394 1.2%
    Thunder Bay, Ontario         121,621                (330) -0.3%
    Total    24,724,257             17,140 0.1%
    Derived from Statistics Canada data


    Wendell Cox is principal of Demographia, an international public policy and demographics firm. He is a Senior Fellow of the Center for Opportunity Urbanism (US), Senior Fellow for Housing Affordability and Municipal Policy for the Frontier Centre for Public Policy (Canada), and a member of the Board of Advisors of the Center for Demographics and Policy at Chapman University (California). He is co-author of the “Demographia International Housing Affordability Survey” and author of “Demographia World Urban Areas” and “War on the Dream: How Anti-Sprawl Policy Threatens the Quality of Life.” He was appointed to three terms on the Los Angeles County Transportation Commission, where he served with the leading city and county leadership as the only non-elected member. He served as a visiting professor at the Conservatoire National des Arts et Metiers, a national university in Paris.

    Photo: Photo: Old City Hall, Toronto (by author)

  • Meet Marble

    I’ve lived in this neighborhood for so long that I’ve grown used to tech start ups beta testing their schemes on my doorstep. I remember the first time I saw a car drive by with a huge furry pink mustache strapped to the front grill between the headlights. That was the start of Lyft. I have a clear memory from 2008 when a friend rented her apartment out on a new internet platform. That was Airbnb. Back in the late 1990s during the dot com bubble there was a start up that would deliver everything from milk to condoms via bicycle courier.

    Meet Marble. This little pushcart size machine is launching the next generation of tech based business models. It’s using fine grained real time lidar navigation so autonomous machines can learn to negotiate the city “on foot.”

    The initial concept is for robots to deliver Chinese food to your door. My guess is that Marble’s electronic pizza boy is just the first baby step to much larger and more lucrative contracts. The postal service, private package delivery systems, and utility meter readers will ultimately save billions on labor by switching to such machines. See also city parking enforcement. Meter maids will go the way of buggy whips. Humans and their endless need for salaries, medical insurance, pensions, and workers compensation will melt away.

    New jobs will be created around the production, maintenance, and management of these new systems of course. But there’s the tricky business of getting people who are qualified to deliver pastrami sandwiches or check VIN numbers to craft algorithms – especially when a lot of this work can be done remotely from anywhere on the planet. Don’t expect the people who clean and reload these machines to get paid enough to rent a studio apartment anywhere near the Bay Area. Oh, wait. There’s an automated system that will do that too…

    We don’t have a technology problem. We have a societal distribution problem. These trends are going to make an ever larger proportion of the population redundant. Wealth has not and will not “trickle down.” Instead it will continue to concentrate into specific hands in particular geographic locations. Focusing on the technology itself is a mistake. The challenge is to create a culture and a political framework where everyone has the opportunity to enjoy the benefits of these shifts. History tells us that existing institutions don’t self reform. They fail and are replaced by entirely new systems. From where I’m looking that process has already begun and it ain’t gonna be pretty.

    This piece first appeared on Granola Shotgun.

    John Sanphillippo lives in San Francisco and blogs about urbanism, adaptation, and resilience at granolashotgun.com. He’s a member of the Congress for New Urbanism, films videos for faircompanies.com, and is a regular contributor to Strongtowns.org. He earns his living by buying, renovating, and renting undervalued properties in places that have good long term prospects. He is a graduate of Rutgers University.

  • Want to be Green? Forget Mass Transit. Work at Home.

    Expanding mass-transit systems is a pillar of green and “new urbanist” thinking, but with few exceptions, the idea of ever-larger numbers of people commuting into an urban core ignores a major shift in the labor economy: More people are working from home.

    True, in a handful of large metropolitan regions — what we might call “legacy cities” — trains and buses remain essential. This is particularly true of New York, which accounts for a remarkable 43% of the nation’s mass-transit commuters, and of other venerable cities, such as San Francisco, Washington, Boston, Philadelphia and Chicago. Together, these metros account for 56% of all mass-transit commuting. But for most of the rest of the country, transit use — despite often-massive infrastructure investment — has either stagnated or declined. Among the 21 metropolitan areas that have opened substantially new urban-rail systems since 1970, mass transit’s share of work trips has declined, on average, from 5.3% to 5%. During the same period, the drive-alone share of work trips, notes demographer Wendell Cox, has gone up from 71.9% to 76.1%.

    Meantime, the proportion of the labor force working from home continues to grow. In 1980, 2.3% of workers performed their duties primarily at home; by 2015, this figure had doubled to 4.6%, only slightly behind the proportion of people who commute via mass transit. In legacy core-metropolitan statistical areas (MSAs), the number of people working from home is not quite half that of those commuting by transit. In the 47 MSAs without legacy cores, according to the American Community Survey, the number of people working from home was nearly 250% higher than people going to work on trains or buses.

    In the greater Los Angeles area, roughly 1.5% of people worked from home in 1980; today about 5% do. Meanwhile, despite significant expenditures, the share of people using mass transit went from slightly over 5% to slightly less than 5%.

    The areas with the thickest presence of telecommuters — including cities such as Austin, Raleigh-Durham, San Diego, Denver, and Seattle — tend to have the greatest concentration of tech-related industries, which function well with off-site workers. In San Jose, the epicenter of the nation’s tech industry, 4.6% of people work from home, exceeding the 3.4% who take mass transit. Other telecommuting hot spots include college towns like Boulder, where over 11.6% of workers work from home, and Berkeley, where the share is 10.6%.

    Leading telecommuting centers tend to be home to many well-educated, older and wealthy residents. Communities such as San Clemente, Newport Beach and Encinitas in Southern California, as well as Boca Raton in Florida, all have telecommuting shares over 10%. Perhaps older, well-connected people are more inclined to avoid miserable commutes, given the chance to do so. As the American population skews older, the economy will likely see more workers making such choices.

    Another important demographic force contributing to the work-from-home inclination is Americans’ continuing move to lower-density cities, which usually lack effective transit, and to the suburbs and exurbs — where 81% of job growth occurred between 2010 and 2014. While most metropolitan regions can be called “polycentric,” they are actually better described as “dispersed,” with central business districts (CBDs) and suburban centers (subcenters) now accounting for only a minority of employment. By 2000, more than three-quarters of all employment in metropolitan areas with populations higher than 1 million was outside CBDs and subcenters.

    Home-based work could be the logical extension of this dispersal — and modern technologies, from ride-sharing services to automated cars, will probably accelerate the trend. A recent report by the global consulting firm Bain suggested that greater decentralization is likely in the coming decades. A 2015 National League of Cities report observes that traditional nine-to-five jobs are on the decline and that many white-collar jobs will involve office-sharing and telecommuting in the future. The report also predicts that more workers will act as “contractors,” taking on multiple positions at once.

    Some see these developments as ominous, but greens and urbanists shouldn’t: Telecommuting will, among other things, reduce pollution. It may be that the shift to home-based work will prove the ultimate in mixed use — albeit for workers in their pajamas.

    This piece originally appeared on the Los Angeles Times.

    Joel Kotkin is executive editor of NewGeography.com. He is the Roger Hobbs Distinguished Fellow in Urban Studies at Chapman University and executive director of the Houston-based Center for Opportunity Urbanism. His newest book is The Human City: Urbanism for the rest of us. He is also author of The New Class ConflictThe City: A Global History, and The Next Hundred Million: America in 2050. He lives in Orange County, CA.

    Photo from Picjumbo.