Urban risk may be understood as a function of hazard, exposure, and vulnerability.1 In metro New Orleans, Katrina-like storm surges constitute the premier hazard (threat); the exposure variable entails human occupancy of hazard-prone spaces; and vulnerability implies the ability to respond resiliently and adaptively—which itself is a function of education, income, age, social capital, and other factors—after having been exposed to the hazard.
This essay measures the extent to which, after the catastrophic deluge triggered by Hurricane Katrina in 2005, residents of metro New Orleans have shifted their settlement patterns and how these movements may affect future urban risk.2 What comes to light is that, at least in terms of residential settlement geographies, the laissez faire rebuilding strategy for flooded neighborhoods proved to be exactly that.
“The Great Footprint Debate” of 2005-2006
An intense debate arose in late 2005 over whether low-lying subdivisions heavily damaged by Katrina’s floodwaters should be expropriated and converted to greenspace. Most citizens and nearly all elected officials decried that residents had a right to return to all neighborhoods. Planners and experts countered by explaining that a population living in higher density on higher ground and surrounded by a buffer of surge-absorbing wetlands would be less exposed to future storms, and would achieve a new level of long-term sustainability.
Despite its geophysical rationality, “shrinking the urban footprint” proved to be socially divisive, politically volatile, and ultimately unfunded. Officials thus had little choice but to abrogate the spatial oversight of the rebuilding effort to individual homeowners, who would return and rebuild where they wished based on their judgment of a neighborhood’s viability.
Federal programs nudged homeowners to return to status quo settlement patterns. Updated flood-zone maps from FEMA’s National Flood Insurance Program, for example, would provide actuarial encouragement to resettle in prediluvial spaces, while the federally funded, state-administered Louisiana Road Home Program’s “Option 1”—to rebuild in place, by far the most popular of the three options—provided grant money to do exactly that.
“Shrinking the urban footprint” became heresy; “greenspacing” took on sinister connotations; and rebuilding in flooded areas came to be valorized as a heroic civic statement. Actor Brad Pitt’s much-celebrated Make It Right Foundation, for example, pointedly positioned its housing initiative along a surge-prone canal, below sea level and immediately adjacent to the single worst Katrina levee breach, to illustrate that if a nonprofit “could build safe, sustainable homes in the most devastated part of New Orleans, [then it] would prove that high-quality, green housing could be built affordably everywhere.”3 Ignoring topography and hydrology gained currency in the discourse of community sustainability even as it flew in the face of environmental sustainability.
A Brief History of New Orleans’ Residential Settlement Patterns, 1718-2005
Topography and hydrology have played fundamental roles in determining where New Orleanians settled since the city’s founding in 1718. The entire region, lying at the heart of the dynamic deltaic plain of the Mississippi River, originally lay above sea level, ranging from a few inches along the marshy perimeter, to a few feet along an interior ridge system, to 8 to 12 feet along the natural levee abutting the Mississippi River.
From the 1700s to the early 1900s, the vast majority of New Orleanians lived on the higher ground closer to the Mississippi. Uninhabited low-lying backswamps, while reviled for their (largely apocryphal) association with disease, nonetheless provided a valuable ecological service for city dwellers, by storing excess river or rain water and safeguarding the city from storm surges. Even the worst of the Mississippi River floods, in 1816, 1849, and 1871, mostly accumulated harmlessly in empty swamplands and, in hindsight, bore more benefits than costs. New Orleanians during the 1700s-1900s were less exposed to the hazard of flooding because the limitations of their technology forced them to live on higher ground.4
Circumstances changed in the 1890s, when engineers began designing and installing a sophisticated municipal drainage system to enable urbanization to finally spread across the backswamp to the Gulf-connected brackish bay known as Lake Pontchartrain. A resounding success from a developmental standpoint, the system came with a largely unforeseen cost. As the pumps removed a major component of the local soil body—water— it opened up cavities, which in turn allowed organic matter (peat) to oxidize, shrink, and open up more cavities. Into those spaces settled finely textured clay, silt, and sand particles; the soil body thus compacted and dropped below sea level. Over the course of the twentieth century, former swamps and marshes in places like Lakeview, Gentilly, and New Orleans East sunk by 6-10 feet, while interior basins such as Broadmoor dropped to 5 feet below sea level. New levees were built along the lakefront, and later along the lateral flanks, were all that prevented outside water from pouring into the increasingly bowl-shaped metropolis.
Nevertheless, convinced that the natural factors constraining their residential options had now been neutralized, New Orleanians migrated enthusiastically out of older, higher neighborhoods and into lower, modern subdivisions. Between 1920 and 1930, nearly every lakeside census tract at least doubled in population; low-lying Lakeview increased by 350 percent, while parts of equally low Gentilly grew by 636 percent. Older neighborhoods on higher ground, meanwhile, lost residents: Tremé and Marigny dropped by 10 to 15 percent, and the French Quarter declined by one-quarter. The high-elevation Lee Circle area lost 43 percent of its residents, while low-elevation Gerttown increased by a whopping 1,512 percent.5
The 1960 census recorded the city’s peak of 627,525 residents, double the population from the beginning of the twentieth century. But while nearly all New Orleanians lived above sea level in 1900, only 48 percent remained there by 1960; fully 321,000 New Orleanians had vertically migrated from higher to lower ground, away from the Mississippi River and northwardly toward the lake as well as into the suburban parishes to the west, east, and south.6
Subsequent years saw additional tens of thousands of New Orleanians migrate in this pattern, motivated at first by school integration and later by a broader array of social and economic impetuses. By 2000, the Crescent City’s population had dropped by 23 percent since 1960, representing a net loss of 143,000 mostly middle-class white families to adjacent parishes. Of those that remained, only 38 percent lived above sea level.7
Meanwhile, beyond the metropolis, coastal wetlands eroded at a pace that would reach 10-35 square miles per year, due largely to two main factors: (1) the excavation through delicate marshes of thousands of miles of erosion-prone, salt-water-intruding navigation and oil-and-gas extraction canals, and (2) the leveeing of the Mississippi River, which prevented springtime floods but also starved the delta of new fresh water and vital sediment. Gulf waters crept closer to the metropolis’ floodwalls and levees, while inside that artificial perimeter of protection, land surfaces that once sloped gradually to the level of the sea now formed a series of topographic bowls straddling sea level.
When those floodwalls and levees breached on August 29, 2005, sea water poured in and became impounded within those topographic bowls, a deadly reminder that topography still mattered. Satellite images of the flood eerily matched the shape of the undeveloped backswamp in nineteenth-century maps, while those higher areas that were home to the historical city, quite naturally, remained dry.
But the stark geo-topographical history lesson could only go so far in convincing flood victims to move accordingly; after all, they still owned their low-lying properties, and real estate on higher terrain was anything but cheap and abundant. Besides, New Orleanians in general rightfully felt that they had been scandalously wronged by federal engineering failures, and anything short of full metropolitan reconstitution came to be seen as defeatist and unacceptable. Most post-Katrina advocacy thus focused on reinforcing the preexisting technological solutions that kept water out of the lowlands, rather than nudging people toward higher ground. “Shrink the urban footprint” got yelled off the table; “Make Levees, Not War” and “Category-5 Levees Now!” became popular bumper-sticker slogans; and “The Great Footprint Debate” became a bad memory.
Resettlement in Vertical Space
The early repopulation of post-Katrina New Orleans defied easy measure. Residents living “between” places as they rebuilt, plus temporarily broken-up families, peripatetic workers, and transient populations all conspired to make the city’s 2006-2009 demographics difficult to estimate, much less map. The 2010 Census finally provided a precise number: 343,829. By 2014, over 384,000 people lived in Orleans Parish, or eighty percent of the pre-Katrina figure. Of course, not all were here prior; one survey determined roughly 10 percent of the city’s postdiluvian population had not lived here before 2005.8
How had the new population resettled in terms of topographic elevation? We won’t know precisely until 2020, because only the decennial census provides actual headcounts aggregated at sufficiently high spatial resolution (the block level) for this sort of analysis; annual estimates from the American Community Survey do not suffice. Thus we must make do with the 2010 Census. While much has changed during 2010-2015, the macroscopic settlement geographies under investigation here had largely had fallen into place by 2010.
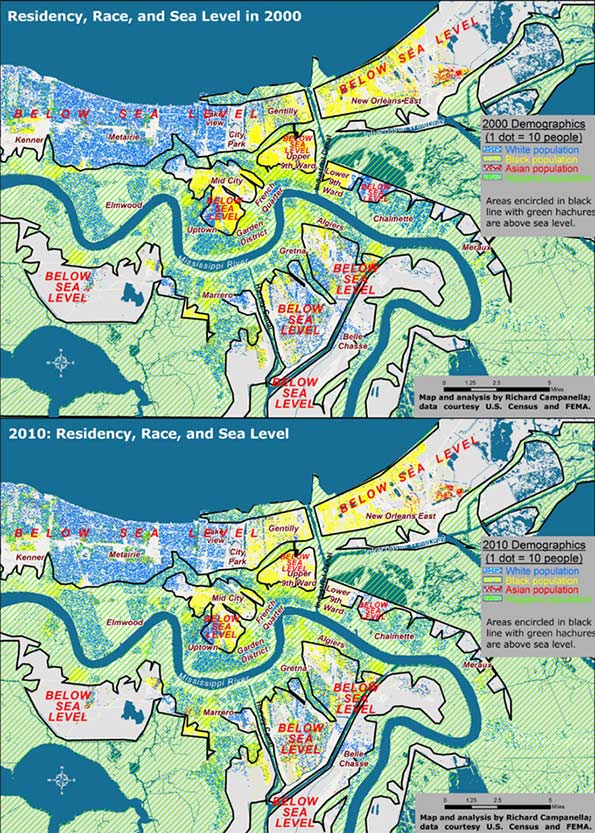
Figure 1. Residential settlement above and below sea level, 2000 and 2010; analysis and maps by Richard Campanella.
When intersected with high-resolution LIDAR-based digital elevation models, the 2010 Census data show that residents of metro New Orleans shifted to higher ground by only 1 percent compared to 2000 (Figure 1). Whereas 38 percent of metro-area residents lived above sea level in 2000, 39 percent did so by 2010, and that differentiation generally held true for each racial and ethnic group. Whites shifted from 42 to 44 percent living above sea level; African Americans 33 to 34 percent, Hispanics from 30 to 29 percent, and Asians 20 to 22 percent.
Clearly, elevation did not exercise much influence in resettlement decisions, and people distributed themselves in vertical space in roughly the same proportions as before the flood. Yet there is one noteworthy angle to the fact that the above-sea-level percentage has risen, albeit barely (38 to 39 percent): it marked the first time in New Orleans history that the percent of people living below sea level has actually dropped.
What impact did the experience of flooding have on resettlement patterns? Whereas people shifted only slightly out of low-lying areas regardless of flooding, they moved significantly out of areas that actually flooded, regardless of elevation. Inundated areas lost 37 percent of their population between 2000 and 2010, with the vast majority departing after 2005. They lost 37 percent of their white populations, 40 percent of their black populations, and 10 percent of their Asian populations. Only Hispanics increased in the flooded zone, by 10 percent, in part because this population had grown dramatically region-wide, and because members of this population sometimes settled in neighborhoods they themselves helped rebuild.
The differing figures suggest that while low-lying elevation theoretically exposes residents to the hazard of flooding, the trauma of actually flooding proved to be, sadly, much more convincing.
Resettlement in Horizontal Space
Contrasting before-and-after residential patterns in horizontal space may be done through traditional methods such as comparative maps and demographic tables. What this investigation offers is a more singular and synoptical depiction of spatial shifts: by computing and comparing spatial central tendencies, or centroids.
A centroid is a theoretical center of balance of a given spatial distribution. A population centroid is that point around which people within a delimited area are evenly distributed.9
Centroids capture complex shifts of millions of data with a single point. But they do not tell the entire story. A centroid for a high-risk coastal area, for example, may shift inland not because people have moved away from the seashore, but because previous residents decided not to return there. It’s also worth noting it takes a lot to move a centroid, as micro-scale shifts in one area are usually offset by countervailing shifts elsewhere. Thus, apparent minor centroid movements can actually be significant. Following are the centroid shifts for metro New Orleans broken down by racial and ethnic groups (Figures 2 and 3).
In 2000, five years before the flood, there were 1,006,783 people living within the metro area as delineated for this particular study, of whom 512,696 identified their race as white; 435,353 as black; 25,941 as Asian; and 50,451 as Hispanic in ethnicity. Five years after the flood, these figures had changed to 817,748 total population, of whom 416,232 were white; 327,972 were black; 27,562 were Asian, and 75,397 were Hispanic.10 When their centroids are plotted, they show that metro residents as a whole, and each racial/ethnic sub-group, shifted westward and southward between 2000 and 2010, away from the location of most of the flooding and away from the source of most of the surge, which generally penetrated the eastern and northern (lakeside) flanks of the metropolis.
Did populations proactively move away from risk? Not quite. What accounts for these shifts is the fact that the eastern half of the metropolis bore the brunt of the Katrina flooding, and the ensuing destruction meant populations here were less likely to reconstitute by 2010, which thus nudged centroids westward. Additionally, flooding from Lake Pontchartrain through ruptures in two of the three outfalls (drainage) canals disproportionally damaged the northern tier of the city, namely Lakeview and Gentilly. Combined with robust return rates in the older, higher historical neighborhoods along the Mississippi, as well as the unflooded West Bank (which sit to the south and west of the worst-damaged areas), they abetted a southwestward shift of the centroids. In a purely empirical sense, this change means more people now live in less-exposed areas. But, as we saw with the vertical shifts, the movements are more a reflection of passive responses to flood damage than active decisions to avoid future flooding.
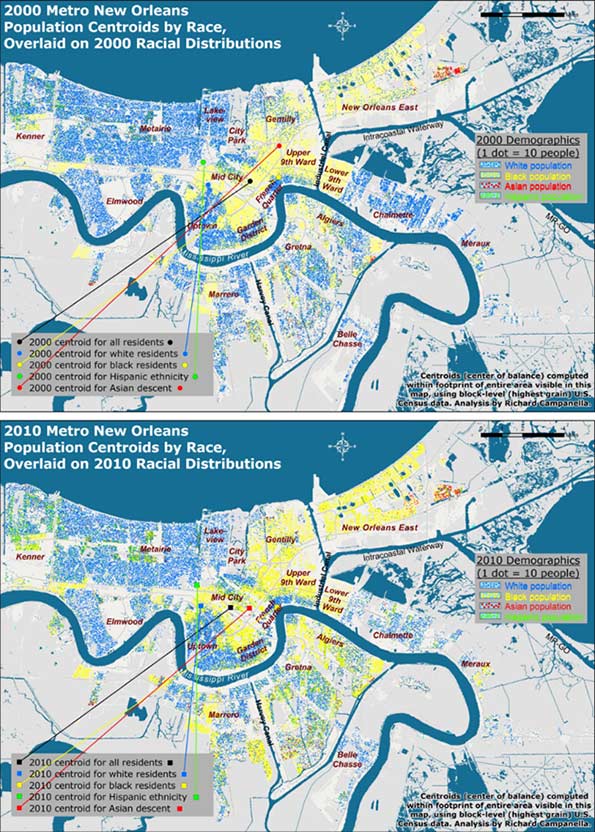
Figure 2. Population centroids by race and ethnicity for metro New Orleans, 2000-2010; see next figure for detailed view. Analysis and maps by Richard Campanella.
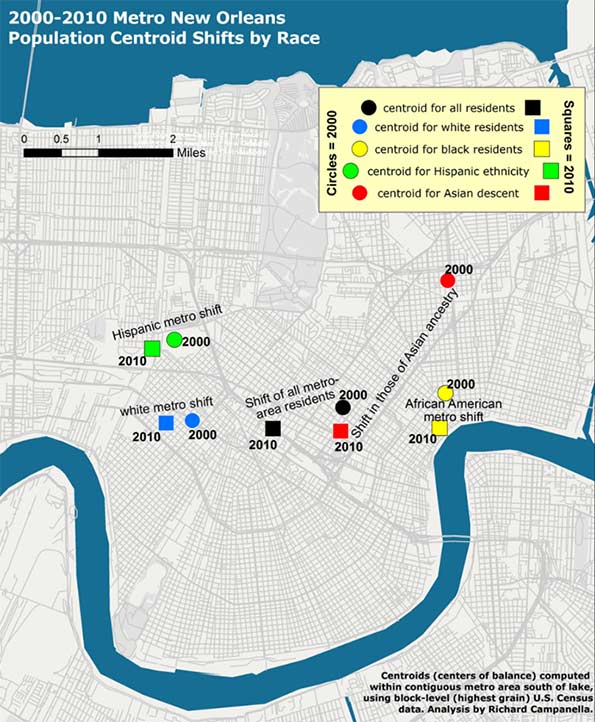
Figure 3. A closer look at the metro-area population centroid shifts by race and ethnicity, 2000-2010; analysis and map by Richard Campanella.
Reflections
Resettlement patterns in metro New Orleans have only marginally reduced residential exposure to the hazard of storm surge. In the vertical dimension, metro-area residents today occupy below-sea-level areas at only a slightly lower rate than before the deluge, 61 percent as opposed to 62 percent, although that change represents the first-ever reverse (decline) of the century-long drift into below-sea-level areas. Likewise, residents’ horizontal shifts, which were in southwestward directions, seemed to suggest a movement away from hazard, but these shifts were more a product of passive than active processes .
Metro New Orleans, it is important to note, has substantially reduced its overall risk—but mostly thanks to its new and improved federal Hurricane & Storm Damage Risk Reduction System (HSDRRS) rather than shifts in residences. No longer called a “protection” system, the Risk Reduction System is a $14.5 billion integrated network of raised levees, strengthened floodwalls, barriers, gates, and pumps built by the U.S. Army Corps of Engineers and its contractors to protect the metropolis from the surges accompanying storms with a 1-percent chance of occurring in any given year.11 The HSDRRD, which worked well during Hurricane Isaac’s surprisingly strong surge in 2012, has given the metropolis a new lease on life, at least for the next few decades. But all other risk drivers—the condition of the coastal wetlands, subsidence and sea level rise, social vulnerability, and, as evidenced in this paper, exposure—have either slightly worsened, only marginally improved, or generally remained constant.
The exposure-related patterns reported here reflect who won the “Great Footprint Debate” ten years ago.12 Months after Katrina, when it became clear that no neighborhoods would be closed and the urban footprint would persist, decisions driving resettlement patterns in the flooded region effectively transferred from leaders to homeowners. Rather inevitably, the laissez faire rebuilding strategy proved to be exactly that, and people generally repopulated areas they had previously occupied, though at markedly varied densities.
Ten years later, the resulting patterns are a veritable Rorschach Test. Some observers look to the 75-90 percent repopulation rates of certain flooded neighborhoods and view them as heroically high, proof of New Orleanians’ resilience and love-of-place. Others point to the 25-50 percent rates of other areas and call them scandalously low, evidence of corruption and ineptitude. Still others might point to the thousands of scattered blighted properties and weedy lots and concede—as St. Bernard Parish President David Peralta admitted on the ninth anniversary of Hurricane Katrina—that “we probably should have shrunk the footprint of the parish at the very beginning.”13
As for the HSDRRS, continual subsidence and erosion vis-à-vis rising seas, coupled with costly and as-yet undetermined maintenance and certification responsibilities, will gradually diminish the safety dividend provided by this remarkable system. The nation’s willingness to pay for continued upkeep, meanwhile, may grow tenuous; indeed, it’s not even a safe bet locally. Voters in St. Bernard Parish, which suffered near-total inundation from Katrina, defeated not once but twice a tax to pay for drainage and levee maintenance, a move that may well increase flood insurance rates.14
Residents throughout the metropolis appear to be repeating the same mistakes they made during the twentieth century: of dismissing the importance of natural elevation, of over-relying on engineering solutions, of under-maintaining these structures in a milieu of scarce funds, and of developing a false sense of security about flood “protection.”
We need to recognize the limits of our ability to neutralize hazards—that is, to presume that levees will completely protect us from storm surges—while appreciating the benefits of reducing our exposure to them. Beyond the metropolis, this means aggressive coastal restoration using every means available as soon as possible, an effort that may well require some expropriations. Within the metropolis, it means living on higher ground or otherwise mitigating risk. In the words of University of New Orleans disaster expert Dr. Shirley Laska, “mitigation, primarily elevating houses, is [one] way to achieve the affordable flood insurance…. It is possible to remain in moderately at-risk areas using engineered mitigation efforts, combined with land use planning that restricts development in high-risk areas.”15
Planning that restricts development in high-risk areas: this was the same reasoning behind the “shrink the urban footprint” argument of late 2005—and anything but the laissez faire strategy that ensued.
Bio
Richard Campanella, a geographer with the Tulane School of Architecture, is the author of “Bienville’s Dilemma,” “Geographies of New Orleans,” “Delta Urbanism,” “Bourbon Street: A History,” and other books. His articles may be read at http://richcampanella.com , and he may be reached at rcampane@tulane.edu or @nolacampanella on Twitter.
Acknowledgements
The author wishes to thank Gulf of Mexico Program Officer Kristin Tracz of the Walton Family Foundation, Dr. Shirley Laska, and the Gulf Coast Restoration Fund at New Venture Fund, and Tulane School of Architecture, as well as Garry Cecchine, David Johnson, and Mark Davis for their reviews.
1 David Crichton, “The Risk Triangle,” in Natural Disaster Management, edited by J. Ingleton (Tudor Rose, London, 1999), pp. 102-103.
2 In this paper, “metro New Orleans” means the conurbation (contiguous urbanized area shown in the maps) of Orleans, Jefferson, western St. Bernard, and upper Plaquemines on the West Bank (Belle Chasse); it excludes the outlying rural areas of these parishes, such as Lake Catherine, Grand Island, and Hopedale, and does not include the North Shore or the river parishes.
3 Brad Pitt, as cited in “Make It Right—History,” http://makeitright.org/about/history/, visited February 13, 2015.
4 Richard Campanella, Bienville’s Dilemma: A Historical Geography of New Orleans and Geographies of New Orleans (University of Louisiana Press, 2006, 2008); R. Campanella, Delta Urbanism: New Orleans (American Planning Association, 2010); R. Campanella, “The Katrina of the 1800s Was Called Sauve’s Crevasse,” Times-Picayune, June 13, 2014, and other prior works by the author.
5 H. W. Gilmore, Some Basic Census Tract Maps of New Orleans (New Orleans, 1937), map book stored at Tulane University Special Collections, C5-D10-F6.
6 Richard Campanella, Bienville’s Dilemma: A Historical Geography of New Orleans (University of Louisiana Press, 2008) and other prior works by the author.
7 Coincidently, 38 percent of all residents of the contiguous metropolis south of Lake Pontchartrain also lived above sea level in 2000. Thus, at both the city and metropolitan level, three out of every eight residents lived above sea level and the other five resided below sea level. All figures calculated by author using highest-grain available historical demographic data, usually from the U.S. Census, and LIDAR-based high-resolution elevation data captured in 1999-2000 by FEMA and the State of Louisiana.
8 Henry J. Kaiser Family Foundation, “New Orleans Five Years After the Storm: A New Disaster Amid Recovery” (2010), http://kaiserfamilyfoundation.files.wordpress.com/2013/02/8089.pdf
9 Defining the study area is essential when reporting centroids. New Orleans proper, the contiguous metro area, and the Metropolitan Statistical Area, which includes St. Tammany and other outlying parishes, would all have different population centroids. This study uses the metro area south of the lake shown in the accompanying maps. It is also important to use the finest-grain—that is, highest spatial resolution—demographic data to compute centroids, as coarsely aggregated data carries with it a wider margin of error. This study uses block-level data from the decennial U.S. Census, the finest available.
10 Figures do not sum to totals because some people chose two or more racial categories while others declined the question, and because Hispanicism is viewed by the Census Bureau as an ethnicity and not a race.
11 For details on this system, see http://www.mvn.usace.army.mil/Missions/HSDRRS.aspx
12 Richard Campanella, Bienville’s Dilemma: A Historical Geography of New Orleans (University of Louisiana Press, 2008), pp. 344-355.
13 David Peralta, as quoted by Benjamin Alexander-Bloch, “Hurricane Katrina +9: Smaller St. Bernard Parish Grappling with Costs of Coming Back,” Times-Picayune/NOLA.COM, August 29, 2014.
14 Mark Schleifstein, “St. Bernard Tax Defeat Means Higher Flood Risk, Flood Insurance Rates, Levee Leaders Warn,” Times-Picayune/NOLA.COM, May 4, 2015, http://www.nola.com/environment/index.ssf/2015/05/st_bernard_tax_defeat_means_hi.html ; see also Richard Campanella, “The Great Footprint Debate, Updated,” Times-Picayune/NOLA.COM, May 31, 2015.
15 Shirley Laska, email communication with author, April 12, 2015.
LA’s Tale of Two Cities
It’s the best of times and the worst of times in Los Angeles.
Los Angeles is now attracting notice as a so-called “global city,” one of the world’s elite metropolises. It is ranked #6 in the world by AT Kearney and tied for 10th in a report by the Singapore Civil Service College that I contributed to. Yet it also has among the highest big city poverty rates in the nation, and was found to be one of the worst places in America for upward mobility among the poor. Newspaper columns are starting to refer to LA as a “third world city.”
Though the Bay Area gets the headlines, the LA region likes to boast it’s coming on strong in tech. With a diverse set of marquee names including Snapchat, Tinder, Oculus, and SpaceX, LA’s startup scene continues to grow. But tech growth overall has been middling, ranking 28th out of the country’s sixty-six largest region in information job growth, according to a recent Forbes survey.
More disturbing, job growth has also been slow, ranking 35th overall, at a time when it’s long time rivals in the Bay Area occupy the top job and tech rankings. Some of this reflects the loss of a key industry, aerospace, but also the departure of major corporations such as Lockheed, Northrup Grumman, Occidental Petroleum, and Toyota, which has left LA’s once vaunted corporate community but is a shell of its former self.
Yet LA’s glitz factor remains potent. The fashion industry has gained considerable recognition. Tom Ford set up shop and brought his runway show to the city. Locally grown brands like Rodarte have a major following. LA also is increasingly a global center of gravity in the art world.
Yet behind the glitz, in the city of Los Angeles, aging water mains regularly erupt and the streets and sidewalks decay, with the city’s own report estimating it has an $8.1 billion infrastructure repair backlog.
One report chronicles the flight of cash-strapped New York creatives fleeing to sunny, liberating, and less expensive LA. Another how high prices and the Southern California grind are sending those same creatives packing.
What’s going on here?
What we are witnessing is LA changing in the context of the two tier world —divided between rich and poor — that we live in. This has been made worse by a city that has excessively focused on glamour at the expense of broad based opportunity creation.
Los Angeles may be a creative capital and a great place to live as a creative worker, but it was always much more than that. It was also a great place to build the middle class American Dream or run a business that employed people at scale. For example, it was and still today remains the largest manufacturing center in the United States. Yet it has lost half of its manufacturing job base since 1990. That’s over half a million manufacturing jobs lost in the region since then, with over 300,000 of those just since 2000. Unlike Detroit, Houston, Nashville and even Portland, the region has not benefited at all from the resurgence of US manufacturing since 2009.
Manufacturing decline, of course, is hardly unique to LA, but the city’s problems are particularly acute because region is so huge and diverse, being both the second largest metro area in the country, and the most diverse major region in America. LA has a higher share of Hispanic population than any major metro apart from San Antonio – one twice as high as the Bay Area. The LA/Inland Empire’s 8.4 million Hispanics would by themselves be the fourth largest metro area in the country, and are more than the total number of people living in the Bay Area. The area also has over a million black residents.
With their heavily well-educated populations the Bay Area and Boston can perhaps get away with operating as sort of luxury boutiques for upscale whites and Asians, however dubious a decision that may be. Not so LA.
The problem is that LA and California more broadly have adopted the luxury boutique mindset. Policies are made in ways that favor the glamorous industries like Hollywood, high tech, and the arts – industries that don’t employ a lot of aspiring middle class people, particularly Hispanics or blacks.
These policies include strongly anti-growth land use and environmental policies designed to produce the kind pristine playgrounds favored by glamour industries and creative elite. But they have rendered the region increasingly unaffordable to all but the highly affluent or those who were lucky enough to buy in long ago.
Tech firms and entertainment companies can afford to pay their key workers whatever they need to live in LA. That’s tougher for more workaday businesses. Ditto for business regulations, where many industries don’t have the margins to spend on things like a phalanx of compliance attorneys.
Now that high prices are starting to hurt younger hipsters who want to join the creative industries, this is starting to get attention. But if it’s a problem for young, educated Millennials, it’s a disaster for the working class.
LA does deserve credit for potentially opportunity expanding investments in transit. But if transit can be seen as a potential winner, most political leaders seem more concerned with finding ways to simply attempt to politically reallocate some money to those being squeezed by their policies, all at the expense of growth. The $15 minimum wage is Exhibit A. Like rent control, a high minimum wage benefits a few lucky winners while harming others and making it harder to justify business investment that would create more jobs and entry level opportunities onto the ladder of success, while raising consumer prices. The fact that nearly half of LA’s workers might be covered by the new minimum is a damning testament to the erosion of the region’s middle class job base.
The real measure of success for LA is not how many runway shows, startups, and elite rankings it can achieve, but whether it can recover its role as an engine of opportunity for its large and diverse population to achieve their American Dream. Local leaders would be better served looking for policies that will expand opportunity instead of the ones they are following that actually reduce it.
Aaron M. Renn is a Senior Fellow at the Manhattan Institute for Policy Research and a Contributing Editor at its magazine City Journal.
The Cities Creating The Most White-Collar Jobs
In our modern economy, the biggest wellspring of new jobs isn’t the information sector, as hype might lead some to think, but the somewhat nebulous category of business services. Over the past decade, business services has emerged as easily the largest high-wage sector in the United States, employing 19.1 million people. These are the white-collar jobs that most people believe offer a ladder into the middle class. Dominated by administrative services and management jobs, the sector also includes critical skilled workers in legal services, design services, scientific research , and even a piece of the tech sector with computer systems and design. Since 2004, while the number of manufacturing and information jobs in the U.S. has fallen, the business services sector has grown 21%, adding 3.4 million positions.
Given these facts, mapping the geography of business services employment growth is crucial to getting a grip on the emerging shape of regional economies. And because business services cover such a wide spectrum of activities, there is no one kind of area that does best. Business services thrive in a host of often different environments, far more so than the more narrow patterns we see in manufacturing or information. To generate our rankings of the best places for business services jobs, we looked at employment growth in the 366 metropolitan statistical areas for which BLS has complete data going back to 2003, weighting growth over the short-, medium- and long-term in that span, and factoring in momentum — whether growth is slowing or accelerating. (For a detailed description of our methodology, click here.)
Tech-Service Hubs
Increasingly much of what we call tech is really about business services. Companies that primarily use technology to sell a product generally require many ancillary services, from accounting and public relations to market research. Apple, Google, and Facebook clearly demand many services, and that’s one reason why San Jose-Sunnyvale-Santa Clara ranks first on our big metro areas list (those with at least 450,000 jobs). Since 2009, business service employment has expanded 34.7% in the area; just last year the sector expanded 7.9%. The Bay Area’s other tech rich region, San Francisco-Redwood City-South San Francisco, ranks second.
This linkage of tech with business services can be seen in other information-oriented parts of the country. Both third-ranked Raleigh, N.C., and No. 5 Austin, Texas, are also tech hubs, and boast rapidly expanding business service sectors. They are also much less expensive places to do business, which may suggest these areas will be well positioned to capture more service jobs if bubble-licious stock and real estate prices undermine some of the economic logic that has driven business in the Bay Area.
The key here may also be cultural. Workers in business services tend to be well educated, and younger employees may well share the lifestyle preferences that have led workers to the Bay Area, as well as such moderately hip places as Austin. Their higher wages help defray the spiraling costs of living in these desired locations and millennials’ and, at least until their 30s, keep them closer to the urban core.
Sun Belt Service Boom Towns
The balance of our top 10 business service locations are all in the Sun Belt. For the most part, these are lower cost places that have enough amenities and transportation links to attract and nurture business service firms. The strongest example is Nashville, ranked fourth on our list, where business service employment has soared 41.4% over the past five years. Much of this growth is tied to health services, entertainment and staffing services.
The re-emergence of No. 10 Atlanta-Sandy Springs-Roswell is particularly marked, as we saw in our overall rankings. Business service growth has led economist Marci Rossell to predict a net gain of 140,000 jobs for the metro area this year, which would be the first time it has netted more than 100,000 since 1999.
The Traditional Big Players
Business services have long clustered in the largest American cities. But with the exception of the Bay Area, greater Dallas and Atlanta, few of our biggest metro areas did particularly well on our list. Indeed of those areas with over 2 million business service jobs, the next highest ranking belongs to No. 21 Houston, which has seen a healthy 27.8% growth in this sector since 2009.
Other mega-regions have not done nearly as well. The largest business service economy, that of New York City, with over 4.1 million jobs in this sector, ranks 29th, with good but not spectacular 20.5% growth over the past five years. But New York, as we have seen on our overall list of The Best Cities For Jobs, consistently outpaces its major rivals. Chicago lags on our business services list in 42nd place, with 18.1% growth over the past five years, and Los Angeles, which once saw itself as a serious challenger to New York, ranks 44th, with 17.4% job growth over that span.
Perhaps the biggest surprise has been the relatively weak record of the capital area. A major beneficiary of the stimulus, it appears now to be slipping in ways no one could have anticipated. The Washington- Arlington- Alexandria MSA, with over 2.5 million business service jobs, ranked 65th out of the 70 largest metro areas; neighboring Silver Spring-Frederick- Rockville won the dubious distinction of coming in dead last, the only large metro area to actually lose business service jobs. Washington’s “beltway bandits” have long thrived during periods of government growth. But after a boom during the early stimulus, Republican controls on spending have filtered into the business service economy. “D.C.,” noted the Washington City Paper, “went from the star of the recession to the runt of the recovery.”
Potential Rising Stars
Some might type-cast business service jobs as the domain of large metropolitan regions, clustered particularly in well-developed downtowns. Yet growth also is occurring in small and mid-sized cities, which often enjoy lower costs than their big city cousins. These are clearly some advantages to being in a big urban center in terms of amenities and face-to-face connections, but smaller cities are generally more attractive to middle class families, particularly to middle managers who might not be able to live decently in the hyper-expensive areas.
One prime example is our fastest growing mid-sized region, Provo-Orem, Utah, where business service employment has surged 46.5% since 2009 to 29,600 jobs. Located south of Salt Lake City, and home to Brigham Young University, the area has long attracted manufacturers and tech firms, who provide a base for business service providers. Indeed small and mid-sized college towns have seen some of the most rapid growth. This includes our No. 1 small and overall metro area, Auburn-Opelika Ala., which has posted 66.7% growth in business services employment since 2009 (albeit off a small base – total employment in the metro area is just 60,700). Just behind is Tuscaloosa, Ala., another small town built around a big university (“Roll Tide”) and some smaller colleges. (For our overall top 10 list, click here.)
But, as we have seen elsewhere, business service growth also tends to be strongest in areas with expanding other industries. For example, Fayetteville-Springdale-Rogers, Ark., ranked fourth on our mid-sized metro area list, is also home to Walmart, a company that provides opportunities for local business service firms. Overall 11 of the top 12 areas for business service job growth are small and one, Provo-Orem, is midsized.
These rapidly growing service regions could prove big winners in the years ahead. As telecommunication technology consistently destroys the tyranny of distance, more service firms may find it less expensive, and convenient, to locate their activities elsewhere. Just as manufacturing shifted out of the bigger cities, we could soon see a movement of business service providers as well, which would be a great boom to hundreds of small and medium-size regions.
Joel Kotkin is executive editor of NewGeography.com and Roger Hobbs Distinguished Fellow in Urban Studies at Chapman University, and a member of the editorial board of the Orange County Register. He is also executive director of the Houston-based Center for Opportunity Urbanism. His newest book, The New Class Conflict is now available at Amazon and Telos Press. He is also author of The City: A Global History and The Next Hundred Million: America in 2050. He lives in Orange County, CA.
Michael Shires, Ph.D. is a professor at Pepperdine University School of Public Policy.
Big Tiger Paw” by Josh Hallett – originally posted to Flickr as Big Tiger Paw. Licensed under CC BY 2.0 via Wikimedia Commons.
Chicago’s Great Financial Fire
My latest piece is online in City Journal and is called “Chicago’s Financial Fire.” It’s a look at the ongoing financial crisis in that city, which has all of a sudden gotten very real thanks to a downgrade of the city’s credit rating to junk by Moody’s. Here’s an excerpt:
While some sort of refinancing may be required, the proposed debt issue contains maneuvers similar to those that helped get Chicago into trouble in the first place—including more scoop and toss deferrals, $75 million for police back pay, $62 million to pay a judgment related to the city’s lakefront parking-garage lease, and $35 million to pay debt on the acquisition of the former Michael Reese Hospital site (an architecturally significant complex Daley acquired and razed for an ill-fated Olympic bid). The debt-issue proposal also includes $170 million in so-called “capitalized interest” for the first two years. That is, Chicago is actually borrowing the money to pay the first two years of interest payments on these bonds. In true Chicago style, the proposal passed the city council on a 45-3 vote. Hey, at least the city is getting out of the swaps business.
Even with no further gimmicks, Emanuel will be six years into his mayoralty before the city can stop borrowing just to pay the interest on its debt. And without accounting for pensions, it will take the full eight years of both his terms to get the city to a balanced budget, where it can pay for the regular debt it has already accumulated.
Click through to read the whole thing.
Rahm donned a sweater during his reelection campaign and told the public he recognized he needed to change his ways, saying that he knows he “can rub people the wrong way.” The title of that ad was “Chicago’s Future.”
I decided to take him up on his new approach. When I was working on this piece, I tried to get some information of the mayor’s press office. I asked them such extremely hard hitting questions as, “Is there a consolidated location where all of the mayor’s most recent financial proposals can be seen in their current form?” I emailed them and got no response. So I followed up with a phone call. I was put on hold for a while then told the person I needed to talk to was away from her desk, but I should email her at a XYZ address. So I did. No response. This is the same pattern all previous inquiries I’ve made have followed, though I believe on occasion I’ve been put through to a voice mail from which I got no callback. Now, it’s not like I try to get stuff from these guys every day, but the message is pretty clear. I gather that this experience is not at all unusual when dealing with Rahm.
Having his press office simply refuse to respond at all to even basic inquiries from (the apparently many) people on his blacklist is naught put pettiness. Rahm takes people who could be friends and does his best to turn them into enemies. No wonder the Sun-Times titled a recent about him, “Rahm’s troubles plentiful, allies scarce.”
Thus it is that Chicago, a city of grand and expansive history and ambition, a city so big it overflows the page, comes to have a mayor with a certain smallness of spirit.
Aaron M. Renn is a senior fellow at the Manhattan Institute and a Contributing Editor at City Journal. He writes at The Urbanophile, where this piece first appeared.
Chicago photo by Bigstock.
The Evolving Urban Form: Sprawling Boston
Few terms are more misunderstood than "urban sprawl." Generally, it refers to the spatial expansion (dispersion) of cities and has been use to describe urbanization from the most dense (least sprawling) in the world (Dhaka, Bangladesh), the most dense in the United States (Los Angeles) and also the least dense in the world (such as Atlanta and Charlotte, low density world champions in their population categories).
The discussion of density and dispersion is often confused, a prisoner of pre-conceived notions about various urban areas. Boston is in a class by itself in this regard. Boston certainly deserves its reputation for a high density urban core and a strong CBD. Yet, Boston itself represents only a small part of the urbanization in its commute shed, which is a combined statistical area (CSA) or stand-alone metropolitan area (Note 2). The CSA is the largest labor market definition and combines adjacent metropolitan areas with strong commuting ties. The city of Boston had only 8% of the Boston-Worcester-Providence CSA population in 2010.
Much of the Boston CSA is made up of extensive, low density suburbanization more akin to Atlanta or Charlotte than to Los Angeles, which has the densest suburbs.
The Boston Combined Statistical Area
In contrast to its reputation for compactness, the Boston CSA is massive in its geography, covering more than 9,700 square miles (25,000 square kilometers). It is larger than Slovenia or Israel. The CSA stretches across parts of four states, including the eastern half of Massachusetts, all of Rhode Island, a large southeastern corner of New Hampshire and the northeastern corner of Connecticut. It includes the Boston, Providence, Worcester, Manchester and Barnstable Town metropolitan areas and the Concord (NH) and Laconia (NH) micropolitan areas.
Boston is the only CSA in the nation that includes three state capitals, Boston (Massachusetts), Providence (Rhode Island) and Concord (New Hampshire). It is the only CSA in the nation that contains the largest municipalities in three states, Boston, Providence and Manchester (New Hampshire).
The Boston CSA also includes multiple CBDs, from the fifth largest in the nation, Boston, to much smaller, but historically significant Providence, Worcester, and Manchester.
Consider this: The Boston CSA is more than 200 miles (320 kilometers) from the southernmost point, Westerly, Rhode Island to the northernmost point, on the shores of Lake Winnipesaukee, north of Laconia, New Hampshire and more than a third the way to Montréal. Westerly itself is less than 50 miles (80 kilometers) from the New York combined statistical area, which begins at Madison, Connecticut across the New Haven County line. From Boston’s easternmost point near Provincetown, at the end of Cape Cod, it is more than 225 miles (360 kilometers) to Lake Winnipesaukee. From Provincetown to Athol, Massachusetts, to the west is more than 180 miles (290 kilometers).
Urbanization in the Boston CSA
But perhaps the most remarkable feature of this "Greater Greater Boston" is the extent of its urbanization (Note 3). The urban areas within the Boston CSA cover 3,640 square miles (9,400 square kilometers). This includes the dominant urban area of Boston (4.2 million), Providence (1.1 million), Worcester (0.5 million), which have largely grown together and a number of other urban areas. The urbanization is illustrated in the photograph above, which superimposes a Census Bureau maps of Boston’s urbanization and the Boston CSA, both on a Google Earth image. The CSA is a "reddish" color, while the urban areas are more "pinkish," and completely enclosed in the CSA.
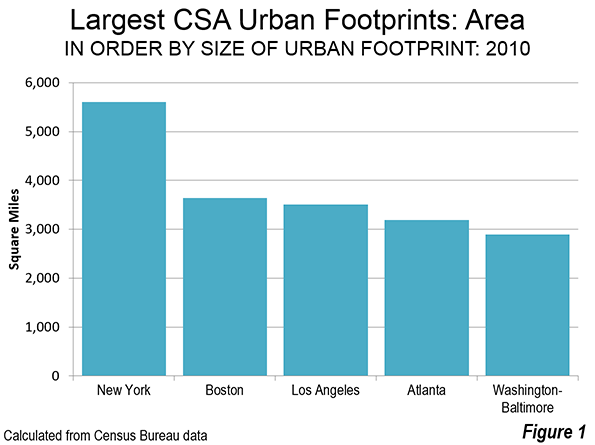
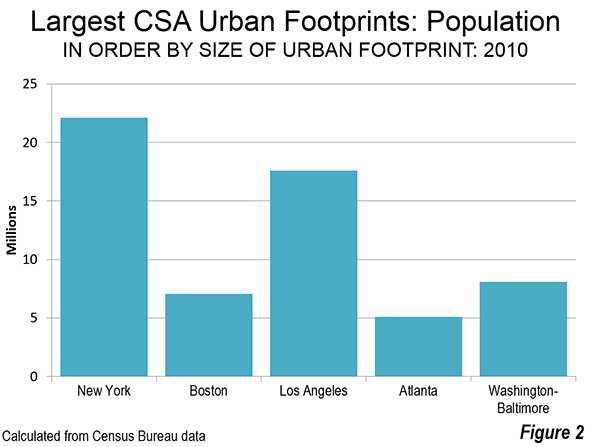
If all of Boston’s urbanization were a single urban area, it would be the third most expansive in the world (Figure 1), following the combined urban area of New York-Bridgeport-New Haven (4,500 square miles or 11,600 square kilometers) and Tokyo-Yokohama (3,300 square miles or 8,500 square kilometers).
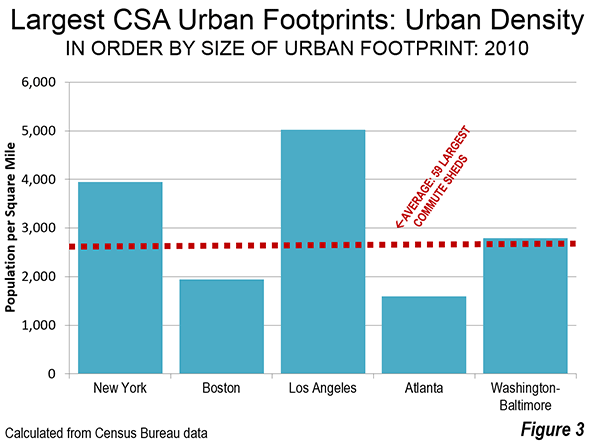
There is a big difference, however, in the intensity of development between the urbanization in these labor markets. The urban population of the Boston CSA is 7.1 million (Figure 2). The urbanization of the New York CSA has more than three times as many people (23 million), but covers only about 1.5 times the land area. Tokyo, with a tenth less land area, has more than five times the population (38 million). With a density of 1,941 per square mile (750 per square kilometer), the urbanization of Boston is 60% less dense (Figure 3) than the urbanization of the Los Angeles CSA (5,020 per square mile or 1,940 per square kilometer), which includes the Inland Empire urban area of Riverside-San Bernardino.
Pre-World War II Boston is largely confined within the Route 128 semi-circumferential highway (most of it now called Interstate 95), had a 2010 population of approximately 1.9 million, with a population density of 6,300 per square mile (2,400 per square kilometer). The core city of Boston is among the most dense in the United States, with a 2014 density of 13,300 per square mile (5,200 per square kilometer). It is also very successful, having experienced a strong population turnaround, after falling from 801,000 residents in 1950 to 562,000 in 1980 (a 30% loss). By 2014, the city had recovered nearly 40% of its former population, rising to 656,000.
Suburban Densities
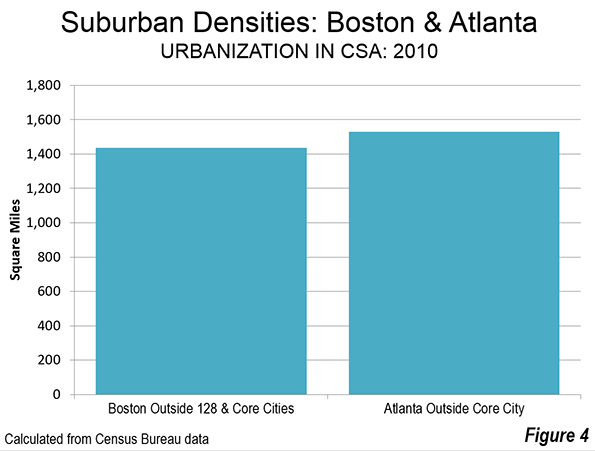
But once you get outside of 128, Boston’s urban population density fall steeply. If the denser urbanization inside Route 128 and the historic, dense municipalities of Providence, Worcester and Manchester are excluded, the remainder of Boston’s urbanization has a population density of 1,435 per square mile (550 per square kilometer). This is less dense than Atlanta’s urbanization outside the city of Atlanta. Overall, the Atlanta urban area is the least dense in the world with more than 2.5 million population. Approximately two-thirds of the Boston CSA urban population lives in these sparsely settled suburbs (Figure 4).
If the Boston CSA were as dense as the Los Angeles urban form, the population would be 18.3 million, not 7.1 million, more than 2.5 times as -people as now reside there.
In many ways, Boston is the epitome of the dispersed urban development that followed World War II. Once one of the nation’s densest urban areas, it has evolved into one of the least. What distinguishes Boston from other low density urban areas, like Atlanta, Charlotte or Birmingham (Alabama) is that is core well reflects the urban form built for the pre-automobile age.
Employment Dispersion
As would be expected, Boston’s highly dispersed urbanization has been accompanied by highly dispersed employment. Despite having the fifth largest CBD in the nation, Boston’s "hub" accounts for only 6% of the CSA employment. In the 1950s and 1960s, Route 128 became the nation’s first high-tech corridor and has been referred to as the birthplace of the modern industrial park. But most people work outside 128.
Despite Boston’s huge urban expanse the average trip travel time is only 29 minutes. This is slightly above the US average of 26 minutes and 18 minutes shorter than Hong Kong, the high-income world’s densest urban area. Hong Kong’s urban density is more than 30 times that of Boston’s urbanization.
One of the World’s Most Prosperous Metropolitan Areas
Highly dispersed Boston has emerged as one of the world’s most affluent areas. According to the Brookings Global Metro Monitor, the Boston metropolitan area has the fourth largest GDP per capita, purchasing power parity, in the world. Boston trailed only Macau, nearby Hartford and San Jose, the world’s leading technology hub. Two other Boston CSA metropolitan areas were successful enough to be included in the top 100 in the Brookings data. The Providence and Worcester metropolitan areas ranked in the top 100 (like 65 other US metropolitan areas), at about the same level as Vienna, while leading Brussels and Tokyo. Overall, Boston has to rank as one of the country’s – and the world’s most successful labor markets. It has done so while not being denser but while combining the virtues of both a successful core city and a large, expansive periphery.
Note 1: Cites have two generic forms, physical and economic (or functional). The physical form is the continuously built-up area, called the urban area or the urban agglomerations. This is the area that would be outlined by the lights of the city from a high flying airplane at night. The economic form is the labor market (metropolitan area or combined statistical area), which includes the urban area but stretches to include rural areas and other areas from which commuters are drawn. There is considerable confusion about urban terms, especially when applied to municipalities when called "cities," Municipalities are not themselves generic cities, but are usually parts of generic cities. Some municipalities may be larger than their corresponding generic cities (principally in China).
Note 2: "Commute sheds" encompass core based statistical areas, as defined by the Office of Management and Budget. including combined statistical areas, as well as metropolitan and micropolitan areas that are not a part of combined statistical areas), Combined statistical areas themselves are formed by strong commuting patterns between adjacent metropolitan and micropolitan areas. A table of all 569 commuter sheds is posted to demographia.com.
Note 3: Combined statistical areas (and metropolitan areas) often have more than one urban area. This article combines all of the urban areas in the Boston CSA, rather than focusing only on the principal urban area, Boston. Comparisons are made to the total urbanization (not the principal urban areas) of other CSAs in the United States.
Wendell Cox is Chair, Housing Affordability and Municipal Policy for the Frontier Centre for Public Policy (Canada), is a Senior Fellow of the Center for Opportunity Urbanism (US), a member of the Board of Advisors of the Center for Demographics and Policy at Chapman University (California) and principal of Demographia, an international public policy and demographics firm.
He is co-author of the "Demographia International Housing Affordability Survey" and author of "Demographia World Urban Areas" and "War on the Dream: How Anti-Sprawl Policy Threatens the Quality of Life." He was appointed to three terms on the Los Angeles County Transportation Commission, where he served with the leading city and county leadership as the only non-elected member. He served as a visiting professor at theConservatoire National des Arts et Metiers,a national university in Paris.
Photo: Second largest geographical expanse of labor market urbanization in the world (Boston). US Census Bureau maps superimposed on Google Earth.
Revisiting Two Forces of Modern Urban Transformation
Few factors have had a greater impact on recent urban growth than communications technology (ICT) and property investment strategies. The evolution of both is transforming space and social interaction at an unprecedented pace and depth, with mixed results. As these maturing forces are increasingly taken for granted, the next generation of urban growth should accommodate them in ways that preserve urban vitality and citizen livelihoods.
The jetpack that wasn’t
The impacts of ICT on urban life have been examined primarily in two realms: government operations and citizen-user lifestyles. With several decades of modern technology absorbed into urban life, it is now possible to longitudinally examine the impacts of ICT in both its functional and social dimensions.
In the mid-20th century, simple technologies supported the minutiae of city operations in ways that now seem mundane: stoplight sequencing, emergency response, utilities management, etc. After decades of innovation, technology is now a broader and more integral part of urban governance, from design to operations. For example, ICT’s value in aiding growth projection continues to be explored through highly sophisticated systems such as UrbanSim, which is being used by several cities around the world. What was once the concern only of technocrats – and the muse of Popular Science magazine – is now the recipient of large budget appropriations and a common topic for discussions about inter-urban competitiveness.
Beyond operations, ICT has also restructured urban social interaction in both planned and unexpected ways; these are expressed in particular through changes in the physical environment. One example is the book retail industry, for which virtual markets have caused catastrophic impacts. For example, Barnes and Noble provided proxy community gathering spaces where people of varying ages and interests interacted. Aimless and leisurely perusing created a shared atmosphere of curiosity and exploration. However, many such stores are now bankrupt, replaced by an online shopping medium that eliminates the need for face-to-face interaction. A vestige of community life may have perished as a result.
Urban planners should be concerned about the socio-physical impacts of these transformations. As society withdraws into virtual realms, ICT exerts both convergent and divergent effects. The former allows people in dispersed locations to rally around a common interest, political cause, or commercial pursuit. It bridges cultures and geographies, and “flattens” the world in ways already amply studied. At the same time, ICT can splinter interests and fragment shared identities. There is little consensus about this matter, with some studies arguing that online media diminishes social skills and increases isolation, and others arguing that it has a positive correlation with “civic engagement” and tightens familial ties. Regardless, as social and commercial activity is virtualized there remains the chance that that place-based affinities – expressed, for example, by patronage of local enterprises – will gradually erode. Despite their virtues, “online communities” are still fundamentally a-spatial constructs. What is begun there often must be executed in person, underscoring the continued relevance of public space.
The long-term transformative effects of ICT cannot yet be fully appraised in part because technology uptake is rapid and unpredictable. Nevertheless, in one aspect – urban design – a synergy has emerged between bricks-and-mortar merchants and planners, in reaction to virtualization. Their complementary efforts, when successful, imbue commercial space with interaction-based vitality. The human instinct for sociability further supports these efforts, evidence that there is no substitute for many of the benefits cities offer. Lives are arguably better in proximity, a point supported by decades of agglomeration and anthropological research. The challenge for planners, therefore, is to create space for meaningful experiences inimitable in the virtual realm.
The masters of the neighborhood
Modernized property investment models predate ICT, but have imposed similarly transformative impacts on urban growth. 20th century efforts to generate vibrant commercial and residential spaces have a chequered history: suburban malls of the 1960s, festival marketplaces of the 1980s, and live-work-play new urbanist developments of the pre-recession 2000s. These development strategies exhibit the prevailing commercial and social trends of the time: white-flight suburbanization, urban core revitalization, and densified brownfield redevelopment.
More importantly, property development in its various forms is a product of the global investment climate. Susan Fainstein argues that emotion, shoddy research, and availability of (other people’s) money have fuelled unsuccessful investments that ultimately destabilised property markets. Development capital – particularly for large projects that can redefine an entire urban core – is increasingly sourced from institutional investors who arguably have little stake beyond financial returns. For example, Turkey has recently announced plans to facilitate international investment in its domestic property markets, and investment in Indian property by private equity firms has risen sharply in 2015. These types of developments range from business and technology parks to vast urban retail and residential complexes.
Additionally, the behavior of investors can influence the nature of such development. Stock investment strategies increasingly favor the short-run – “in and out quickly” – over the long-run (“blue-chips”). Translated into property investment, this strategy attracts capital to projects with quick returns but poor long-run viability. The immediacy of funding is commercially alluring, but rapid flight of capital can be devastating for neighborhoods. For example, the mortgage crisis illustrated the risk of designing property investment models like those for intangible (and liquid) assets such as stocks. Rapid divestment of investment shares and properties – in panicked response to market signals – elevates natural cycles into manic booms and catastrophic busts.
Cases like this illustrate how urban growth is impacted not only by the characteristics of financial institutions, but also by the eminently human irrationalities that distort their function. The city becomes less a product of local market demand than of the financial ambitions and risk preferences of absentee investors. These global prospectors often have little contextual knowledge of projects and even less interest in their social impacts. This investment approach may work for stocks, but not for property developments – particularly those that support urban growth and generate economically sustainable neighborhoods.
Citizens as social investors
Both technology and investment patterns have been enablers of growth strategies that serve interests beyond local livelihoods. This tension tests the power and will of urban governments to interpret global trends – including those of ICT and capital markets – in ways that enhance local livability and equity. It is therefore incumbent on planners to reconcile the vicissitudes of technological and financial change with the exigencies of authentic and inclusive urban growth. Moreover, a city is not merely a product of planning; it is the embodiment of resident priorities.
Authentic urban transformation relies more on citizen initiative than the influence of global capital, and may be facilitated by ICT but not defined by it; this can be seen in the quiet regeneration of urban neighborhoods. Global capital may underwrite loans for acquiring properties and developing land, decisions in such neighborhoods are often made locally and in the type of fragmented manner that generates a bricolage of uses and styles. Examples in the United States include East Nashville, Kansas City’s Crossroads district, and Oakland’s foodie Temescal and KoNo districts. None displays the architectural shock-and-awe of emerging global mega-cities, but each embodies a citizen-level developmental determinism that shapes their design and atmosphere. They are literal incarnations of the unique priorities of citizens at that time and place, independent of global trends that often result in regression to an aesthetic mean.
If cities balance opportunism with judiciousness in absorbing these forces, citizens ultimately should be the ones to demand it. Examples of facilitative policies are inclusive zoning, public space requirements, mixed-use zoning that reserves space for local enterprises. From the current vantage point, ICT and global investment appear poised to maintain their role in development; however, this no defeat for citizen livelihoods. Among their many responsibilities, planners should embrace their role as public-private intermediaries, creatively channelling external forces to de-commodify space and preserve vernacular authenticity. This is only possible by balancing stakeholder influence.
Kris Hartley is a visiting researcher at the Center for Government Competitiveness at Seoul National University, and a PhD Candidate at the National University of Singapore, Lee Kuan Yew School of Public Policy.
Gates and Borders, Malls and Moats: A Photo Essay of Manila
Home-made housing (left): Refugee families from Mindanao set up shop-houses in the grounds of the mosque in Quiapo. Quiapo contains a number of significant sacred sites for Catholic pilgrimages and festivals. Islamic refugees are making a living in the markets, even as some have sought refuge inside their own sacred site.

Private turned public (above): Stylish home design transformed into gallery space showing contemporary Pinoy artworks. Pinto Art Gallery, Antipolo.
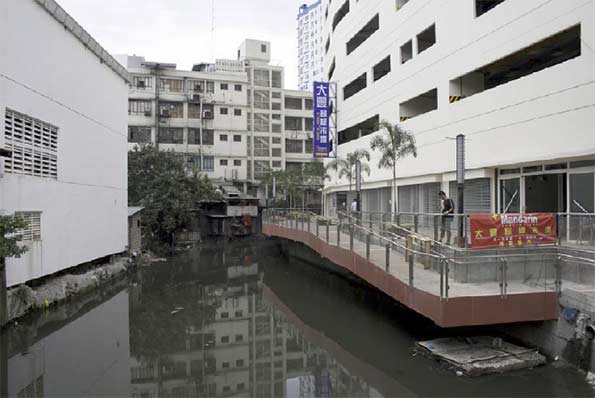
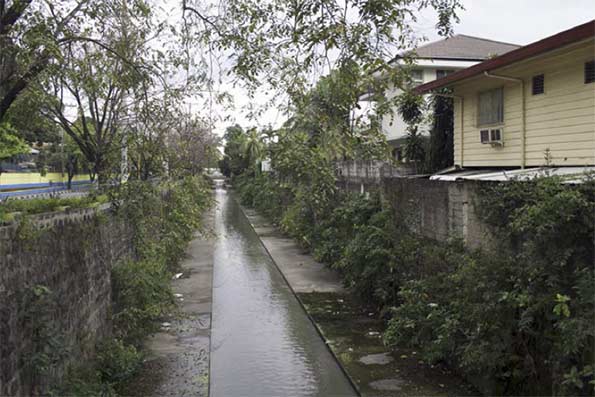
Modernizing the canal frontage: A Spanish-era esterogets a make-over Chinatown style. The water is polluted, the smells are noxious and the blank wall opposite and infor- mal housing at the back compromise the attempt at a waterfront outdoor sitting area.
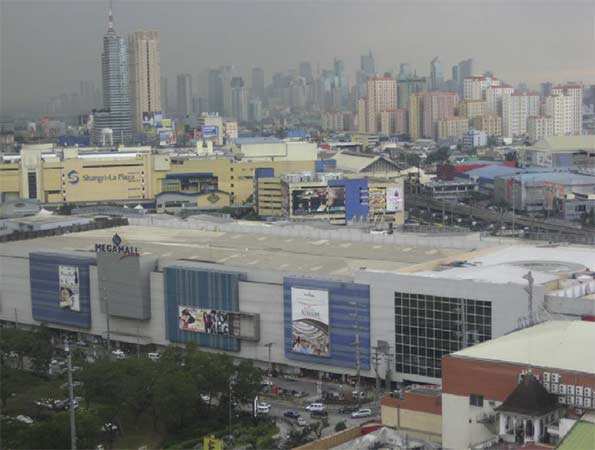
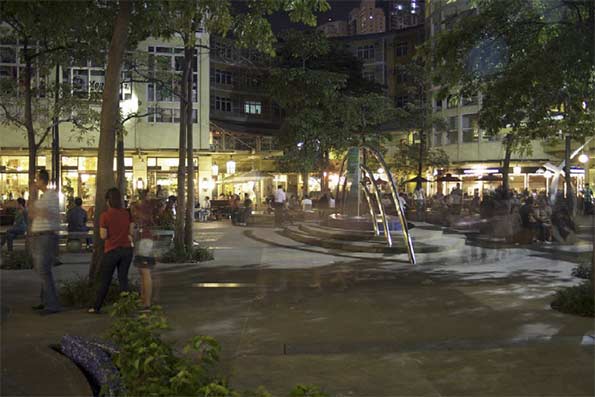
The air-con city: Mega-malls and new skyscraper districts such as these in Pasig City (Ortigas) provide havens from the outside world of heavy metals – in the air and on the tollways. The lack of commons means that the corpora- tized spaces of malls, and gated apartment and business high-rises, are very popular not least because these cathedrals of consumption are air-con simula- cra of public life. Mega-malls are not only about the shopping but also about looking, promenading and hanging out. But these are not public spaces so much as corporately owned.
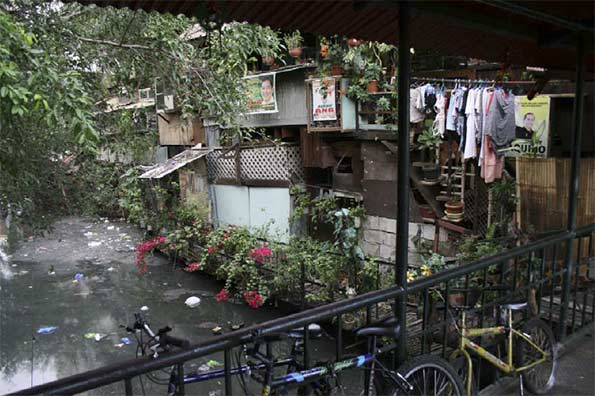
Informal housing on an estero, Quiapo: Public space is non-owned space and therefore represents what is left over rather than something consciously created to reflect public order and culture. Without adequate sanitation systems the water- ways do the flushing, but modern cities generate more than organic waste so the esteros have long been biologically dead. The poor are ever ingenious in making the best out of whatever comes to hand – in recycling building materials for their homes, parking their bicycles on the public bridge, hanging the washing over the canal, and creating walled gardens.
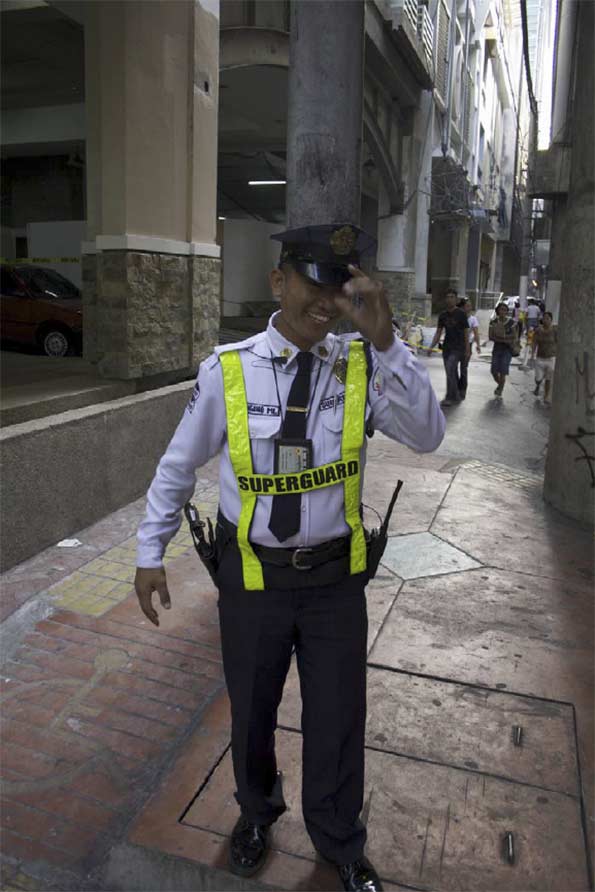
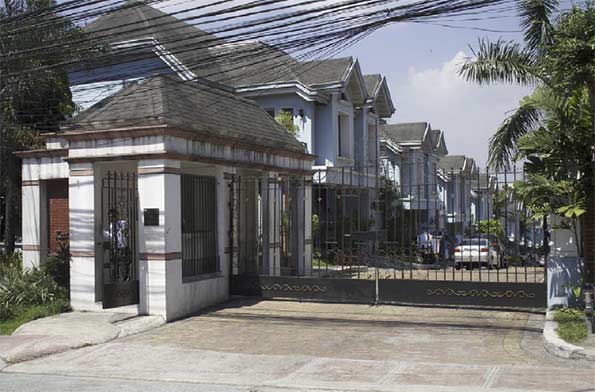
Superguard at your service: In a city of gates and borders that mark the boundaries of private territories, private armies are required by rich and poor alike to police them. Uniforms and guns abound and it is not always obvious who is protecting whom. Regulation and authorization of the guardians is a complex, semi-legal and irregular process. Each guard has his own moniker, many of them spoofs of popular culture super-heroes.
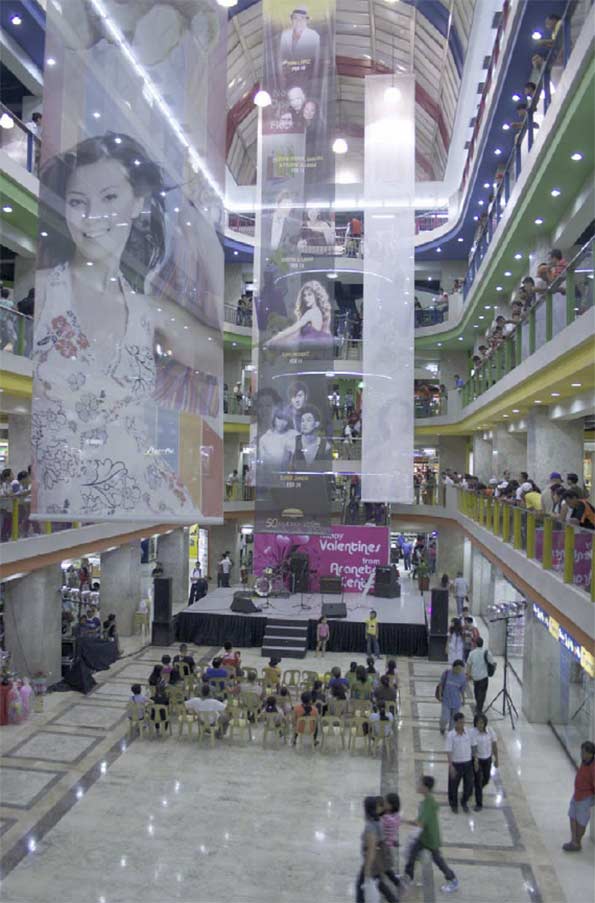
Mega-mall commons: Shopping malls are owned by billionaire tycoons with dynasties like the Araneta, Ayala and Sy families. Local pop and film stars perform on concert stages in the cathedral-like vaults of the central halls where fashion shows, trade fairs and church masses are also held every day. Araneta Center, Cubao, where this photo was taken, is one of the earliest popular mall areas in Manila, dating back to the 1950s, that is undergoing a major make-over. Its fortunes declined into the ’80s as the attentions of the fashion-conscious middle class moved to other malled cities. For the past two decades, Cubao has been a shopping centre for the poor and a bus terminus for the provinces. The area itself has been notable for its urban grunge. The sex bars were shifted from Ermita and Malate to Cubao in the ’90s. The shopping mall has recently had a major make-over and is now connected to two light rail lines – a development that in turn attracts high-density apartment building in the area. As Cubao begins a gentri- fication process, so its urban rents rise. The rich return – or at least a new middle class arrives to graze, shop and parade. The Araneta Center and Coliseum complex has over a million visitors daily.
New urban villages arrive in Manila: Fort Bonifacio is the biggest, boldest experiment in new city building inside a Southeast Asian mega-city. As a series of public-private partnerships, it represents a sustained attempt to mimic world’s best practice in city building and urban renewal. Here at Serendra the pedestrian mall exhibits a careful integration of greenery, sitting areas, promenades, and restau- rants, cafes, boutiques and medium-density walk-up apartments. Not surprisingly, it is very popular and is copied by developers of other new cities in Metro Manila. It is one thing to get the plan right, quite another to regulate and maintain these areas in a city of massive socio-economic inequalities.
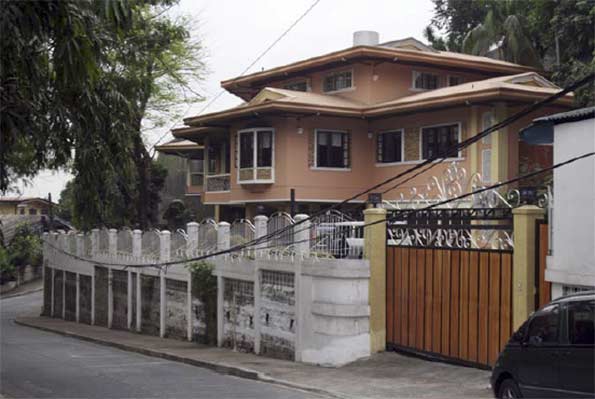
High wall to the street: The rich build fashionable mansions with global-local consciousness of design fashions. Even if the suburb is not gated, the fence to the street is – more often than not – high. The formula is something like this: the more aspirational and richer the houseowner, the greater the probability that the sociality is turned indoors and against the street. The rationalization is security.
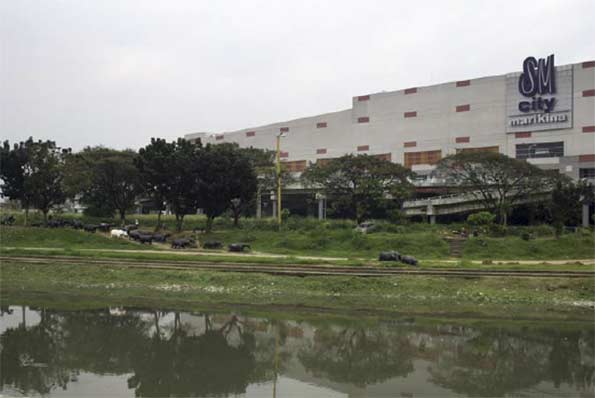
SM Marikina: shopping mall as fortress: Waterfront park on the Pasig River replete with sculpted carabao. The people’s park project has been embraced by the citizens of Marakina Barangay, but here SM presents a blank wall and car park to the riverfront and thereby discourages pedestrian flows between the shops and the park.
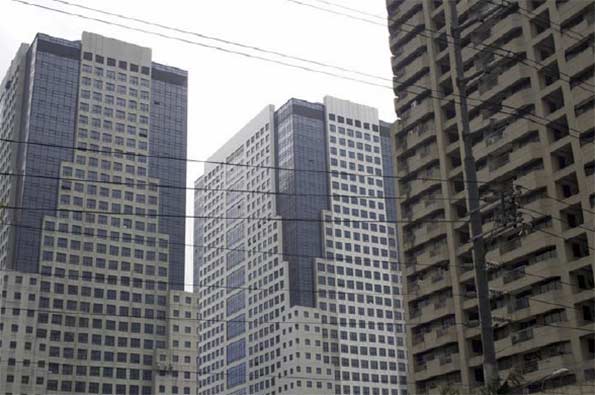
Skyscraper city: Ortigas, Pasig City, is a poorly planned new city along EDSA. Identi-kit skyscrapers sit cheek to jowl, there are no parks, and the streets are car-jammed 24-7.
Drain as moat: The gated community of Casa Verde has three defensive layers to the street – the walls of the houses themselves, the drain which acts as a moat, and a wall on the street. The opposite side of the street is likewise walled. It is a street without pedestrians – an unusual phenomenon in Asian urbanism.
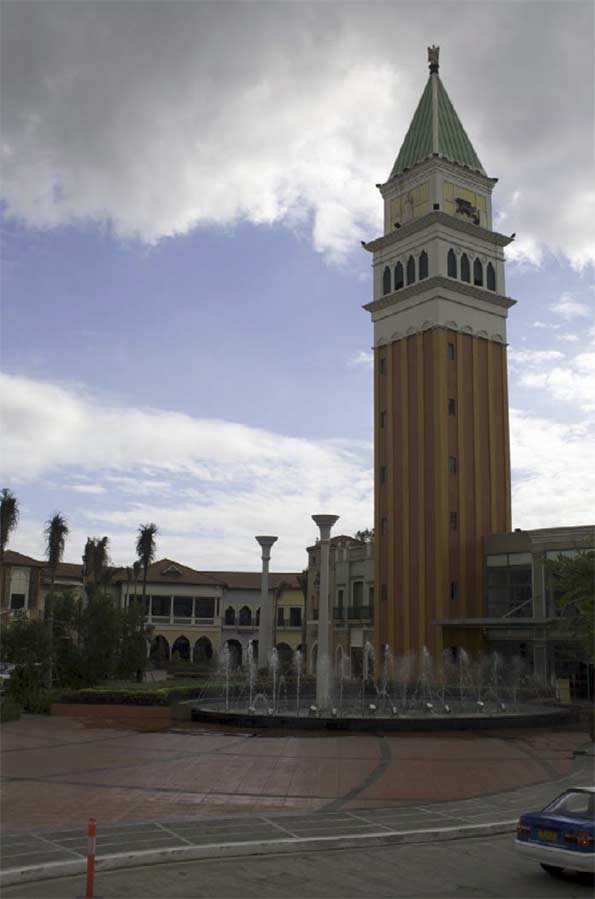
Theme park cities: Las Vegas is most famous for this kind of ersatz ‘Dis- neyfication’ of living spaces, but Manila has been doing it for longer – theme park histories of imagined communities in medieval and Renaissance Europe abound. The aesthetic might be kitsch but the lived experience for the local residents and business folk is another thing altogether. In a city with one of the lowest percen- tages of green and pedestrianized spaces, these places – such as this one in McKinley Hill, Fort Bonifacio – are highly sought after and valued by its citizens.
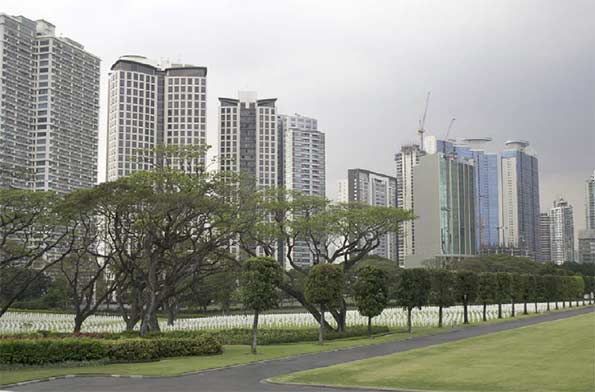
Spectres and spectacles: New apartment blocks in Fort Bonifacio tower over the hauntingly beautiful memorial park and cemetery for 17,201 American military killed during ‘the liberation (sic) of Manila’ and other parts of the Philippine archipelago. It is the largest such Second World War cemetery for American military in the world, covering 152 acres. They have the best views and sea breezes in Manila.
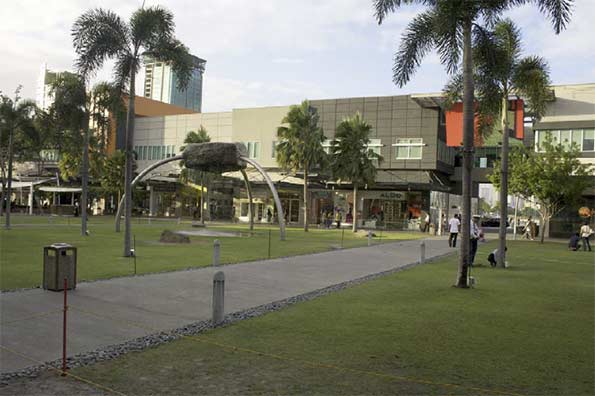
Tampa Bay, Florida, or Cairns, Australia? No, it’s Fort Bonifacio, Manila. Fort Bonifacio was made possible by Mt Pinatubo blowing its top on 15 June 1991. No amount of protests against the US communications and military bases in the Philippines could budge the Americans. But the fall of the Soviet empire and a volcano did the trick. Fort Bonifacio, ironically, named by the Americans after one of the revolutionary leaders against the Spanish colonisers, when vacated, left one of the largest areas ever made available for urban renewal in an Asian city. It is now one of the highest social status new areas and consequently one of the most expensive. Its progress has been slow, not least due to various economic downturns but also because of the care taken by government planners and corporate investors in designing the infrastructure of a city that integrates commercial, government, and social facilities and amenities. In stark contrast to the big boxed mega-malls, this shopping area seeks a suburban outdoor tropical ambience, and again privi- leges pedestrians over vehicles – a too rare occurrence in Manila.
Gates, guards and wires: Manila is a world leader in gated community living. This one in Cubao is typical in its structure – two-storey, semi-detached houses inside a fortress wall with single gate entrance with 24-7 security guards. Standard issue telephone lines clutter the streetscapes of cities the world over – will Wifi technologies clear urban skies?
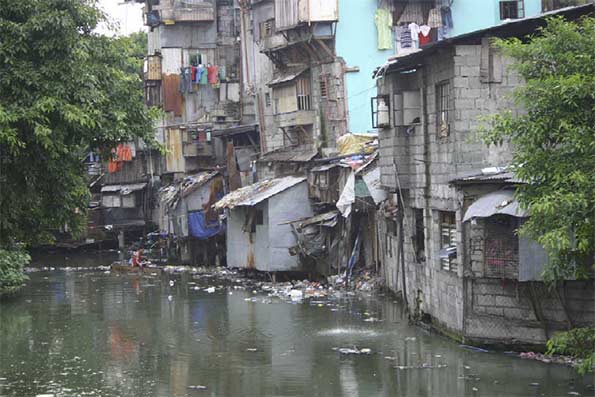
Quiapo, Manila: How can a city turn a backyard sewer into a living waterfront again? The canals (esteros) of Manila are historical artefacts of the Spanish era, but are now the backyards of the poor. The challenge is threefold: heritage (historical con- servation and re-use), ecology (toxic and organic waste management, restoring riv- erine and estuarine ecosystems requiring an integrated approach to the whole Pasig River and Manila Bay area and not just the canals themselves), and livelihoods and sustainable housing for the poor (including their involvement in the re-development of the area and the restoration of the canals). Some success on all three fronts can not only transform the economic fortunes of the whole city but make the area an urban village area that is aesthetically appealing to locals and tourists alike.
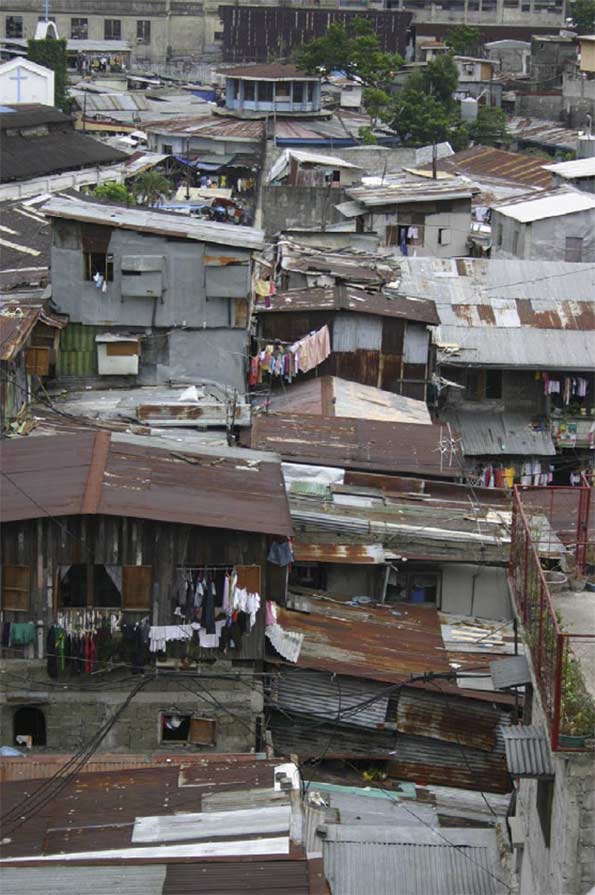
Spot the prison wall!: This high-density informal settlement in the university belt area opposite Far Eastern University fences in a prison! You can spot the panopti- con guard house at the centre-top of the photo. This community is well-established but has been legally protesting a developer’s permit to build a shopping mall on their site. Informal settlers use every available space and the streets and paths are literally left-over space. The more established, longer-term settlers build up and consolidate their homes by turning their walls from cardboard, Masonite and plas- tic into concrete bricks and tin roofs. By definition informal settlements are DIY – including sanitation, water, electricity and telephone connections. The high density ensures maximization of population in an inner city zone and makes it easier for its residents to organize protection against potential hostile intruders. The disadvantage is that should there be a fire or flood then fast and efficient assistance by city services is hard to provide.
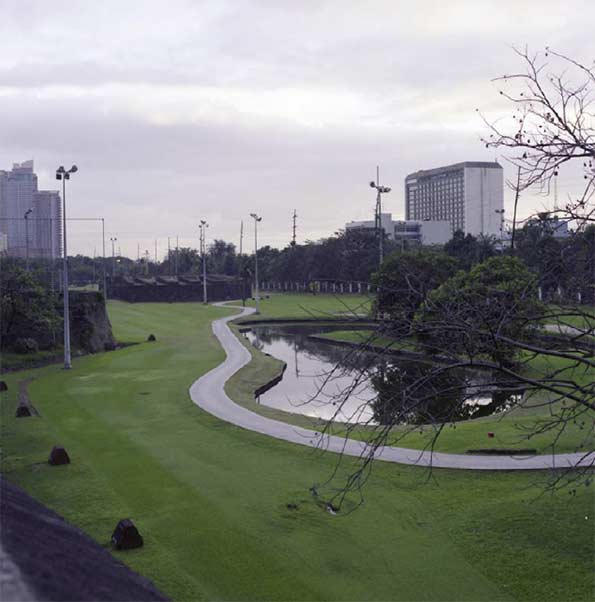
Intramuros: The old wall and the new moat: Intra-muros is the original walled city of Manila, and now the old Spanish moat – that was filled in by the Americans in the name of public health – has a new purpose: golf! Along with polo and yachting, golf is a high status sporting pastime which the very rich can use to assert their distinction. In a city where over 50 per cent are poor and which has one of the lowest proportions of areas allocated to public parks in the world, here is a key public space that has been turned into a private space for those rich enough to afford leisure time and who can pay for the privilege.
This piece was originally published by Sage Publications Thesis Eleven, 112, October: 35-50.
Trevor Hogan teaches in Sociology at the School of Social Sciences, La Trobe University, where he is Deputy Director of the Thesis Eleven Centre for Cultural Sociology and Director of the Philippines-Australia Studies Centre.
Caleb J. Hogan is a Fine Arts student at Royal Melbourne Institute of Technology University (RMIT).
Countering Progressives’ Assault on Suburbia
The next culture war will not be about issues like gay marriage or abortion, but about something more fundamental: how Americans choose to live. In the crosshairs now will not be just recalcitrant Christians or crazed billionaire racists, but the vast majority of Americans who either live in suburban-style housing or aspire to do so in the future. Roughly four in five home buyers prefer a single-family home, but much of the political class increasingly wants them to live differently.
Theoretically, the suburbs should be the dominant politically force in America. Some 44 million Americans live in the core cities of America’s 51 major metropolitan areas, while nearly 122 million Americans live in the suburbs. In other words, nearly three-quarters of metropolitan Americans live in suburbs.
Yet it has been decided, mostly by self-described progressives, that suburban living is too unecological, not mention too uncool, and even too white for their future America. Density is their new holy grail, for both the world and the U.S. Across the country efforts are now being mounted—through HUD, the EPA, and scores of local agencies—to impede suburban home-building, or to raise its cost. Notably in coastal California, but other places, too, suburban housing is increasingly relegated to the affluent.
The obstacles being erected include incentives for density, urban growth boundaries, attempts to alter the race and class makeup of communities, and mounting environmental efforts to reduce sprawl. The EPA wants to designate even small, seasonal puddles as “wetlands,” creating a barrier to developers of middle-class housing, particularly in fast-growing communities in the Southwest. Denizens of free-market-oriented Texas could soon be experiencing what those in California, Oregon and other progressive bastions have long endured: environmental laws that make suburban development all but impossible, or impossibly expensive. Suburban family favorites like cul-de-sacs are being banned under pressure from planners.
Some conservatives rightly criticize such intrusive moves, but they generally ignore how Wall Street interests and some developers see forced densification as opportunities for greater profits, often sweetened by public subsidies. Overall, suburban interests are poorly organized, particularly compared to well-connected density lobbies such as the developer-funded Urban Land Institute (ULI), which have opposed suburbanization for nearly 80 years.
The New Political Logic
The progressives’ assault on suburbia reflects a profound change in the base of the Democratic Party. As recently as 2008, Democrats were competitive in suburbs, as their program represented no direct threat to residents’ interests. But with the election of Barack Obama, and the continued evolution of urban centers as places with little in the way of middle-class families, the left has become increasingly oriented towards dense cities, almost entirely ruled by liberal Democrats.
Obama’s urban policies are of a piece with those of “smart growth” advocates who want to curb suburban growth and make sure that all future development is as dense as possible. Some advocate radical measures such as siphoning tax revenues from suburbs to keep them from “cannibalizing” jobs and retail sales. Some even fantasize about carving up the suburban carcass, envisioning three-car garages “subdivided into rental units with street front cafés, shops and other local businesses” while abandoned pools would become skateboard parks.
At the end of this particular progressive rainbow, what will we find? Perhaps something more like one sees in European cities, where the rich and elite cluster in the center of town, while the suburbs become the “new slums” that urban elites pass over on the way to their summer cottages.
Political Dangers
The abandonment of the American Dream of suburban housing and ownership represents a repudiation of what Democrats once embraced and for which millions, including many minorities, continue to seek out. “A nation of homeowners,” Franklin D. Roosevelt asserted, “of people who own a real share in their land, is unconquerable.”
This rhetoric was backed up by action. It was FDR, and then Harry Truman, who backed the funding mechanisms—loans for veterans, for example—that sparked suburbia’s growth. Unlike today’s progressives, the old school thought it good politics to favor those things that most people aspire to achieve. Democrats gained ground in the suburbs, which before 1945 had been reliably and overwhelmingly Republican.
Even into the 1980s and beyond, suburbanites functioned less as a core GOP constituency than as the ultimate swing voters. As urban cores became increasingly lock-step liberal, and rural Democrats slowlyfaded towards extinction, the suburbs became the ultimate contested territory. In 2006, for example, Democrats won the majority of suburban voters. In 2012, President Obama did less well than in 2008, but still carried most inner and mature suburbs while Romney trounced him in the farther out exurbs. Overall Romney eked out a small suburban margin.
Yet by 2014, as the Democratic Party shifted further left and more urban in its policy prescriptions, these patterns began to turn. In the 2014 congressional elections, the GOP boosted its suburban edge to 12 percentage points. The result was a thorough shellacking of the Democrats from top to bottom.
Will demographics lead suburbs to the Democrats?
Progressive theory today holds that the 2014 midterm results were a blast from the suburban past, and that the key groups that will shape the metropolitan future—millennials and minorities—will embrace ever-denser, more urbanized environments. Yet in the last decennial accounting, inner cores gained 206,000 people, while communities 10 miles and more from the core gained approximately 15 million people.
Some suggest that the trends of the first decade of this century already are passé, and that more Americans are becoming born-again urbanistas. Yet after a brief period of slightly more rapid urban growth immediately following the recession, U.S. suburban growth rates began to again surpass those of urban cores. An analysis by Jed Kolko, chief economist at the real estate website Trulia, reports that between 2011 and 2012 less-dense-than-average Zip codes grew at double the rate of more-dense-than-average Zip codes in the 50 largest metropolitan areas. Americans, he wrote, “still love the suburbs.”
What is also missed by the Obama administration and its allies is the suburbs’ growing diversity. If HUD wants to start attacking these communities, many of their targets will not be whites, but minorities, particularly successful ones, who have been flocking to suburbs for well over a decade.
This undermines absurd claims that the suburbs need to be changed in order to challenge the much detested reign of “white privilege.” In reality, African-Americans have been deserting core cities for years, largely of their own accord and through their own efforts: Today, only 16 percent of the Detroit area’s blacks live within the city limits.
These trends can also be seen in the largely immigrant ethnic groups. Roughly 60 percent of Hispanics and Asians, notes the Brooking Institution, already live in suburbs. Between the years 2000 and 2012, the Asian population in suburban areas of the nation’s 52 biggest metro areas grew by 66 percent, while that in the core cities expanded by 35 percent. Of the top 20 areas with over 50,000 in Asian population, all but two are suburbs.
Left to market forces and natural demographic trends, suburbs are becoming far more diverse than many cities, meaning that in turning on suburbia, progressives are actually stomping on the aspirations not just of privileged whites but those of many minorities who have worked hard to get there.
Another huge misreading of trends relates to another key Democratic constituency, the millennial generation. Some progressives have embraced the dubious notion that millennials won’t buy cars or houses, and certainly won’t migrate to the suburbs as they marry and have families. But those notions are rapidly dissolving as millennials do all those things. They are even—horror of horrors!—shopping atWal-Mart, and in greater percentages than older cohorts.
Moreover, notes Kolko, millennials are not moving to the denser inner ring suburban areas. They are moving to the “suburbiest” communities, largely on the periphery, where homes are cheaper, and often schools are better. When asked where their “ideal place to live,” according to a survey by Frank Magid and Associates, more millennials identified suburbs than previous generations. Another survey in the same year, this one by the Demand Institute, showed similar proclivities.
Stirrings of Rebellion
So if the American Dream is not dead among the citizens, is trying to kill it good politics? It’s clear that Democratic constituencies, notably millennials, immigrants and minorities, and increasingly gays—particularly gay couples—are flocking to suburbs. This is true even in metropolitan San Francisco, where 40 percent of same-sex couples live outside the city limits.
One has to wonder how enthusiastic these constituents will be when their new communities are “transformed” by federal social engineers. One particularly troubling group may be affluent liberals in strongholds such as Marin County, north of San Francisco, long a reliable bastion of progressive ideology.
Forced densification–the ultimate goal of the “smart growth” movement—also has inspired opposition in Los Angeles, where densification is being opposed in many neighborhoods, as well as traditionally more conservative Orange Country. Similar opposition has arisen in Northern Virginia suburbs, another key Democratic stronghold.
These objections may be dismissed as self-interested NIMBYism, but this misses the very point about why people move to suburbs in the first place. They do so precisely in to avoid living in crowded places. This is not anti-social, as is alleged, but an attempt—natural in any democracy—to achieve a degree of self-determination, notes historian Nicole Stelle Garrett.
Aroused by what they perceive as threats to their preferred way of life, these modern pilgrims can prove politically effective. They’ve shown this muscle while opposing plans not only to increase the density in suburbs, and also balking at the shift of transportation funding from roads, which suburbanites use heavily, to rail transit. This was seen in Atlanta in 2012 when suburban voters rejected a mass transit plan being pushed by downtown elites and their planning allies. Opposition to expanding rail service has also surfaced in the Maryland suburbs of Washington.
Suburbs and 2016 Election
To justify their actions against how Americans prefer to live, progressives will increasingly cite the environment. Climate change has become the “killer app” in the smart growth agenda and you can expect the drumbeat to get ever louder towards the Paris climate change conference this summer.
Yet the connection between suburbs and climate is not as clear as the smart growth crowd suggests. McKinsey and other studies found no need to change housing patterns to reduce greenhouse gases, particularly given improvements in both home and auto efficiency. Yet so great is their animus that many anti-suburban activists seem to prefer stomping on suburban aspirations rather seeking ways to make them more environmental friendly.
As for the drive to undermine suburbs for reasons of class, in many ways the assault on suburbia is, in reality, a direct assault on our most egalitarian geography. An examination of American Community Survey Data for 2012 by the University of Washington’s Richard Morrill indicates that the less dense suburban areas tended to have “generally less inequality” than the denser core cities; Riverside-San Bernardino, for example, is far less unequal than Los Angeles; likewise, inequality is less pronounced in Sacramento than San Francisco. Within the 51 metropolitan areas with more than 1 million people, notes demographer Wendell Cox, suburban areas were less unequal (measured by the GINI Coefficient) than the core cities in 46 cases.
In the coming year, suburbanites should demand more respect from Washington, D.C., from the media, the political class and from the planning community. If people choose to move into the city, or favor density in their community, fine. But the notion that it is the government’s job to require only one form of development contradicts basic democratic principles and, in effect, turns even the most local zoning decision into an exercise in social engineering.
As America’s majority, suburbanites should be able to deliver a counterpunch to those who seem determined to destroy their way of life. Irrespective of race or generation, those who live in the suburbs—or who long to do so—need to understand the mounting threat to their aspirations Once they do, they could spark a political firestorm that could reshape American politics for decades to come.
This piece first appeared at Real Clear Politics.
Joel Kotkin is executive editor of NewGeography.com and Roger Hobbs Distinguished Fellow in Urban Studies at Chapman University, and a member of the editorial board of the Orange County Register. He is also executive director of the Houston-based Center for Opportunity Urbanism. His newest book, The New Class Conflict is now available at Amazon and Telos Press. He is also author of The City: A Global History and The Next Hundred Million: America in 2050. He lives in Orange County, CA.
Suburbs photo courtesy of BigStockPhoto.com.
How To Justify Spending $8M On Something Nobody Wants
The Minneapolis-St. Paul Metropolitan Council is gambling $8.7 million on a project to alleviate pedestrian congestion that might exist in 5 to 10 years if we’re somehow able to build two additional light rail lines and they are operating at full capacity for 10 days a year.
That’s like buying flood insurance on the house you have yet to buy.
The below $8.7 million piece of public infrastructure is intended to create a more safe passageway for travelers at the Downtown East station during Vikings home games. It’ll serve west and northbound train passengers and other pedestrians looking to enter a new football stadium. It is deemed this will be an important pedestrian overpass once all four major light rail lines completed.
Download the Downtown East Plan Met Council PowerPoint here [PDF].
Those reading this should have at least two questions:
- How did this come to be a thing?
- Why is it all of a sudden getting $8.7 million?
I pay particularly close attention to local projects. I read blogs, forums and newspapers daily. I know and follow local decision-makers on social media, track development proposals, and pay attention to those boring committees few care about. I also work in the industry and talk to other people who work and follow the industry across related professions. It’s fair to say that I have a very good idea of what’s going on in the Twin Cities and the transportation and development needs of the community.
Never once have I heard of this project until a few days ago. And now, out of the blue, we’re dropping $8.7 million on a bridge that’ll be needed 10 days a year starting in 2019.
I wrote a blog post last year titled The Politics of Dumb Infrastructure. It was well received, and is even being used as required reading in an undergrad planning course in California. In the article I theorize as to why we make bad decisions when it comes to receiving other people’s money on transit projects;
It’s the orderly, but dumb system that makes planners and politicians play to a bureaucratic equation that is supposed to guide officials towards the best alternative. Only it never actually works out that way and it usually forces smart people into making highly compromised and less-than-ideal decisions.
The pedestrian bridge is different. It may deal with Federal grants, but is also come from local and regional coffers. Regardless, this project is being pushed forward. According to the Star Tribune,
“The transit agency will likely devote $6 millon from its coffers for the project (this figure could be offset by federal grants), with the Minnesota Sports Facilities Authority (which oversees stadium construction) ponying up $2 million, and the rest coming from bonds issues by the Met Council.”
Before we go any further, I think we need to ask a complex question.
How Did We Get Here?
The new $1 billion Green Line is done and the $1.1 billion Vikings Stadium is underway. They combine to represent over $2 billion of investment. Our local leaders are concerned, as they should be, that these pieces of infrastructure be as perfect as possible.
To quote a former Governor (one who wasn’t a professional wrestler),
“All too often, the human tendency is to compound one big mistake with a series of additional mistakes in the hope that somehow the results will improve. This appears to be the case with the Vikings stadium.”
Politicians are attracted to big, transformitive projects, so it seems only natural that our leaders, who have expelled a great amount of political capital, want to see every inch of it succeed. Even if that means throwing good money after bad.
How We Justify It All
An engineer at the Met Council, likely under much political pressure, noticed something: based on 2019 projections, during peak hours on Minnesota Vikings game days, there will be only a 120 second headway between trains. This will likely not be enough time to manage safe pedestrian crossings. The proposed solution is the bridge.

Please note the skyway attached to the State-mandated parking structure.
The pedestrian bridge makes some sense. Based on the projections, there will be long lines and delays during this period; and building a bridge for pedestrians certainly isn’t an unreasonable response. The Met Council’s Transportation Committee appears to be interested in the idea.
Let’s look at these assumptions: they assume that there will be two additional light rail lines in full operation, both of which have not yet even been either fully allocated money or constructed. Basically, the Met Council is gambling $8.7 million that there might be a problem in 5 years if we’re somehow able to build two additional light rail lines and they are operating at full capacity for 10 days a year.
To reiterate: Four (4) LRT lines being in operation (Blue, Green, SW & Bottentieu) and that Vikings game attendees hitting a 40% transit mode share. All of things don’t currently exist. It also assumes, more importantly, that if there is congestion people will not find an alternative route or change their travel behavior. This isn’t to say we can’t plan ahead. We should. But, we should be more realistic in our projections and our priorities.
Where Are Our Priorities?
Why did this project get fast-tracked while other smaller, more “everyday” projects never see the light of day? And, when smaller projects get the public’s attention, why do they struggle to find funding? These are merely a question of priorities.
As Nick Magrino (at streets.mn) has asked so often, “why are we embarrassed by the bus?” He writes,
“… I can’t shake the feeling that many of the expensive transit improvements we get in the Twin Cities are thought up by people who don’t actually use transit. Which is why we end up with Northstar, the Red Line, and so on.”
A bridge like this seems like such a low priority, especially when we have legitimate transportation needs. For example, THIS is a bus stop on a heavily used transit line near the center of Minneapolis.
It’s not that a pedestrian bridge is a terrible idea. Under the projections, at some point in the future, it seems maybe reasonable. But, why is the Met Council prioritizing and fast-tracking this, whereas things like bike lanes, bus shelters, and potholes get ignored? I say this because you could build 40 miles of protected bike lanes for the same price tag.
Projects can take on a life of their own. There is no traditional process to getting things done. In this pedestrian overpass, you have the right person with the right slideshow presenting it to the right people at the right time. From here, you have the Met Council employees and political-appointed representatives who have monies at their disposal. The proposal, while not perfect, seems reasonable enough. And, we’ve just spent $2 billion on infrastructure, so we need to make it right. The presentation looks good, so why not go for it?
What Would Your City Do With $8.7 Million?
Imagine if the City of Minneapolis was given $8.7 million that could only be used on downtown pedestrian and/or transit projects. What would they do? The answer is: not a pedestrian bridge to be used during 10 sports games a year.
So, why are we doing it?
The answer is that we can get money from elsewhere to do the things we don’t need to do. But, when it comes to doing the simple things that we need to do, well, that money isn’t available from elsewhere. The pedestrian bridge is a bad idea (right now) that’s made worse when you think of the countless thousands of more useful public investments we could be making.
The truth is that the people and the City of Minneapolis don’t even care about it. It’s not on their radar. It’s the people who control infrastructure and transportation dollars who care about this. If given the opportunity to allocate these dollars elsewhere, it’s fair to say thatliterally everyone locally would divert them elsewhere.
Our priorities get skewed and we misallocate resources most when our funding comes from elsewhere. In fact, it is precisely why Minneapolis has the below. All of which the City of Minneapolis will be tearing down in 30 years …

Note: This is also next to a proposed park called “The Yard” that neither the City of Minneapolis nor it’s Park Board want to maintain. Yet, somehow it’s still a thing.
This post originally appeared in Strong Towns on September 9, 2014. Content licensed under a Creative Commons Attribution-Share Alike 3.0 Unported License.
Find more from Nathaniel M. Hood at his blog: nathanielhood.com
Identifying Black Urbanists
There are black urbanists. There are African-Americans who have invested their life’s work toward the betterment of cities. They haven’t always gotten the exposure and acknowledgement that others have received, but they have nonetheless contributed to an improved understanding of how cities work, especially in an African-American context.
Today, I’m putting forth a nomination list of ten individuals whose work may not conventionally fall in the realm of urbanism as it’s known today, but certainly stands out as urban-oriented. And why is that? The work of the people listed below doesn’t fall in the fields or disciplines most people associate with today’s urbanists — architects, landscape architects, urban designers, economists, and enlightened public works officials or policymakers. The ten I’m nominating as leading black urbanists tend to have sociological or activist backgrounds, often rooted in the Chicago School of sociology, which emphasizes the study of human interactions as opposed to the impacts of design, economy or policy on the built environment. And of course, the human interactions they most frequently observed were those of African-Americans within major cities.
Here they are, in (roughly) chronological order.
W. E. B. DuBois. As a sociologist, historian, civil rights activist and founder of the NAACP who was the first African-American to earn a doctorate (from Harvard, in sociology), DuBois’ work as an activist is well-known. However, DuBois rose to prominence in 1899 with the publication of The Philadelphia Negro. The study, which helped to cement the field of sociology as an academic discipline, examined the form and function of Philadelphia’s black community, which operated nearly completely out of the context of other urban communities. DuBois’ study was among the first to openly say that discrimination was at the heart of problems within isolated black urban communities.
Horace Cayton, Jr./ St. Clair Drake. Cayton and Drake followed up the work of DuBois with their own Northern city sociological study, Black Metropolis: A Study of Negro Life in a Northern City. Using Chicago’s Bronzeville neighborhood as their laboratory, Cayton and Drake provided not only a “generalized analysis of black migration, settlement, community structure, and black-white race relations in the early part of the twentieth century, but also tell us what has changed in the last hundred years and what has not.” Cayton was the grandchild of America’s first elected African-American senator who later went on to become a sociologist, newspaper columnist and author. Drake was a sociologist and anthropologist who later founded the African-American Studies program at Stanford University. The two met at the University of Chicago and produced their famed study.
John Hope Franklin. As an historian at several institutions throughout his career, Franklin did not specialize in cities per se. However, in works such as From Slavery to Freedom, first published in 1947, and his lecture series Racial Equality in America, he more than touches upon the African-American experience in cities, and how discrimination shapes the experience of black residents, and indeed the entire city.
Gordon Parks. A photographer, writer and filmmaker, Parks specialized in documenting the everyday lives of African-Americans, especially in cities. His work often made a statement on the conditions of blacks in cities, and forced viewers to reflect on their condition:


Dorothy Mae Richardson. Richardson was a community activist who fought against redlining in her neighborhood in Pittsburgh, PA. Richardson challenged local Pittsburgh banks to issue conventional loans for mortgages and housing rehabs in her Central North Side neighborhood. That led to the founding of Neighborhood Housing Services in Pittsburgh, and the national group now known as NeighborWorks America, one of the nation’s leading community development institutions.
Rev. Dr. Calvin Butts. Rev. Dr. Butts is the pastor of Abyssinian Baptist Church in New York, but in this context is more well-known as the founder and chairman of Abyssinian Development Corporation in New York as well. Founded in 1989, ADC is one of many community development corporations in New York and across the country that have sought to fill the investment void — for housing, for commercial development, for community services — in distressed communities. In ADC’s case, the organization is credited with bringing in more than $500 million in housing and commercial development to New York’s Harlem neighborhood since 1989.
William Julius Wilson. Following in the earlier sociological tradition of the study of blacks in cities, Wilson is sociology professor at Harvard University. Wilson is the author of many works, but perhaps his most influential include The Truly Disadvantaged: The Inner City, The Underclass and Public Policy, which once again brought African-American community isolation to the forefront, and When Work Disappears: The World of the New Urban Poor, which examines the impact of job loss on poor communities. More recently, Wilson published More Than Just Race: Being Black and Poor in the Inner City, which more closely links urban poverty with discriminatory practices whose impacts linger today.
Geoffrey Canada. Canada is credited with vastly expanding the role of a traditional family-oriented social service agency to the Harlem Children’s Zone, an organization that tightly tracts the academic success and family support of all families within a 24-block area in Harlem. The program is resource-intensive, but it is credited with stemming the tide against poverty in Harlem.
Mary Pattillo. Pattillo is a professor of sociology and African-American Studies at Northwestern University. She’s added two important works that illustrate how blacks operate in today’s urban environment. In 1999 she published Black Picket Fences: Privilege and Peril for the Black Middle Class, which documents how the black middle class has a far more difficult time achieving “escape velocity” from the ills of the inner city, and Black on the Block: The Politics of Race and Class in the City, which illustrates how a uniquely African-American version of gentrification emerged in Chicago’s North Kenwood-Oakland neighborhood on the South Side.
So there’s ten black urbanists. I know there are many more; some who work with lots of notoriety as they address issues like police brutality, housing, public transit, environmental justice, food deserts and the like. And there are others who toil in anonymity, working in block clubs, CDCs and other organizations, working steadfastly to make their community a better place.
I made a statement three years ago that takes a shot as to why there are “no prominent black urbanists” today:
“I believe no nationally prominent black urbanist has emerged in large part because of differing worldviews held by whites and blacks. Very, very, very broadly speaking, with many caveats, I believe whites have a history of believing they can impact cities, while blacks have a history of believing that cities impact them.”
By that I mean that I see many white urbanists surveying the urban landscape and developing rather abstract solutions that flow downward into actual policy, while many black urbanists assess conditions on the ground and develop solutions that they believe will rise up into actual policy. I hope at some point the two can meet and work together.
This post originally appeared at Corner Side Yard on July 7, 2015.
Pete Saunders is a Detroit native who has worked as a public and private sector urban planner in the Chicago area for more than twenty years. He is also the author of “The Corner Side Yard,” an urban planning blog that focuses on the redevelopment and revitalization of Rust Belt cities.
Top photo: Google Earth view of Chicago’s Bronzeville neighborhood, on the South Side lakefront. Source: Google Earth.