Category: Urban Issues

  • Praying in the Streets: Ritual as an Urban Design Problem

    “[T]he city as World icon is being destroyed, not by being secularized (it was always secular at base with some sacral potencies shooting through it from every angle) but by being radically profaned. The city has become the playground not of Wisdom but the battleground of savages, as in Belfast and Beirut. The city’s sacral potentialities have been removed and invested in the sovereign individual. Its central workshop, where radical transactions with reality used to summon a citizenry to meet in peace, was given notice that its lease was up. The center gave way to parking lots and bus stops; discourse fractured, politics increasingly issued from the mouths of ideological gurus, and the sovereign individual was relegated to suburban sprawls focused on the centers of consumption called shopping malls. Here anxiety and frustration mounted as identity waned.”

    – Aidan Kavanagh, o.s.b., On Liturgical Theology, New York: Pueblo Publishing Company, 1984, p. 26.

    The church and the city

    The Benedictine monk Aidan Kavanagh, who straddled two worlds as both a monk and a Yale divinity professor, proposes that we understand the Church as originally and centrally an urban phenomenon. He translates civitas as “workshop” and “playground,” the space in which social, philosophical, and even scientific questions are worked out by humans in contact with their God, “the locale of human endeavor par excellence.”

    By the fifth century A.D., Christian worship in the great cities of Jerusalem, Antioch, Alexandria, Rome, and Constantinople had become not just one service, but an “interlocking series of services” that began at daybreak with laudes and ended at dusk with lamp-lighting and vespers. Only the most pious participated in all the services, but everyone participated in some. The rites “gave form not only to the day itself but to the entire week, the year, and time itself,” says Kavanagh.

    Perhaps just as important as the transformation of time was the transformation of space, for the mid-morning assemblages and processions appropriated the entire neighborhood as space for worship. Participants met in a designated place in some neighborhood or open space, and proceeded to the church designated for the day, picking up more participants as they went, and “pausing here and there for rest, prayer, and more readings from the Bible.” The Eucharist itself was a “rather rowdy affair of considerable proportions,” kinetic and free of stationary pews.

    Kavanagh contrasts this with modern worship, which he characterizes as “a pastel endeavor shrunk to only forty-five minutes and consisting of some organ music, a choral offering, a few lines of scripture, a short talk on religion, a collection, and perhaps a quick consumption of disks or pellets and a beverage.”

    The American urban design pattern

    Kavanagh identifies several influences weakening the urban Church as civitas. The many churches developed many different liturgies, resulting in what he calls “liturgical hypertrophy.” These were flattened and standardized, shrunk to centrally-manageable size and legible doctrinal authority, by the English Act of Uniformity of 1549 and the Council of Trent by 1614. At the same time, printed books ushered in the new literary consciousness, eroding the power of community ritual consciousness for European Christians.

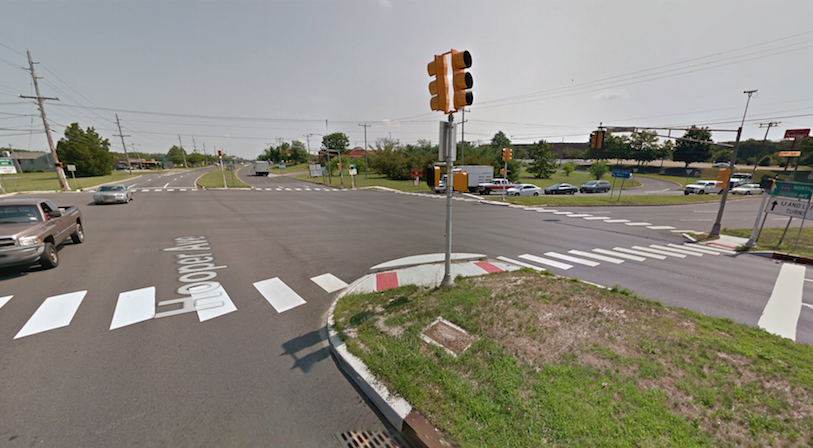
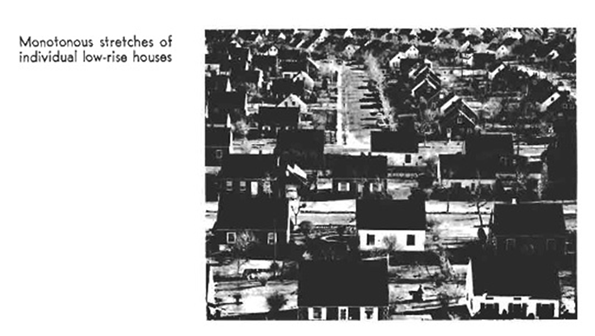
    But ancient religious practices (and their modern elaborations) are still performed in Europe; processions may still be seen winding through the streets of cities and small towns. Except for the occasional Palm Sunday procession, they are all but absent in the United States. The American urban design pattern — increasingly spreading even to small towns — is forbidding to the kind of religious practice that transforms space and time.

    The American urban design pattern is characterized by, first, an orientation toward the automobile above all else; second, toward consumption as the main activity besides work; and third, toward efficient human storage. Human activities other than consumption and “being stored” – as in day cares, schools, prisons, offices, nursing homes, and “housing units” themselves – are made difficult and uncomfortable by the physical built environment itself. Religious activity and social activity, two main components of human flourishing that transform local environments, are increasingly rare and emptied of transformative power.

    A Pattern Language (Christopher Alexander, Sara Ishikawa, and Murray Silverstein, New York: Oxford University Press, 1977) is a humane vision of urban and architectural design, focused on the activities of human flourishing. The authors present 253 interlocking patterns, from macro (Pattern 8, Mosaic of Subcultures) to micro (Pattern 251, Different Chairs — because people come in different sizes!), demonstrating how physical space constrains or facilitates the activities of peopling.

    A secular book, it does not offer any patterns for churches, though it offers Sacred Space and Holy Ground. Alexander et al. hope that merely offering conducive space will allow proper ritual to spontaneously develop. Certainly, the absence of such space precludes such rituals.

    A typical pattern is Pattern 88, the Street Café: “The street café provides a unique setting, special to cities: a place where people can sit lazily, legitimately, be on view, and watch the world go by.” These occur all over Europe, but are rare in the United States. In my old neighborhood in Hollywood, California, there were sidewalk cafés, but people drove from distant neighborhoods, parked their cars, and sat mostly watching automobile traffic. An analogy can be drawn to the city church with a parking lot: its ability to transform space, to claim the city as its own for its own activities, is limited. This kind of café becomes more a place of human storage than for the positive activity of being on view and watching the world go by. Churches, and the religious activity centered on them, may face the same constraint.

    Praying in the streets

    One of Alexander et al.’s patterns is Pattern 63: Dancing in the Street, a poignant pattern given center stage in Barbara Ehrenreich’s book Dancing in the Streets: A History of Collective Joy. When the physical pathways of connection are reserved for driving, they are closed off from normal, healthy human activities. Much fearful (and regulatory) attention has been paid in recent years to the Muslim practice of praying in the streets in European cities such as Paris and Nice; we can respectfully observe, at least, that faith allows them to transform profane space into space for ritual observance. Still, this practice has not been translatable into the United States; it occurs in New York City, only once a year, with proper permits acquired beforehand.

    American streets are not places where ritual, either religious or secular, is easily performed. Only in cloistered communities, set apart from the flows of American life, is this possible, as in the Orthodox Jewish communities of New York and Los Angeles. There, people (importantly) walk to temple, and participate in an “interlocking series” of rituals throughout the Sabbath. During the numerous Great Awakenings in the United States, open space was transformed into religious space through its key ritual, the revival; but this was a temporary transformation, and has not survived in contemporary ritual.

    The reinvigoration of religious and social ritual — allowing people to flourish, rather than merely consume and be stored — is as much an urban design problem as a social problem. But there is another characteristic of American civic life, other than its distinctive urban design pattern, that makes praying in the streets so rare: our studied indifference and polite disattention, our lack of perceptible solidarity, summarized by Randall Collins thus:

    “Public interaction is an equality without much solidarity, an enactment of personal distance mitigated by a tinge of mutual politeness and shared casualness. Goffman calls it the order of civil disattention. As Goffman notes, this is not merely a matter of sheer indifference, since one needs to monitor others at a distance to avoid contact with them when they are close, ranging from little maneuverings of sidewalk traffic to avoid physical collision, to averting eyes and controlling micro-gestures in order not to intrude into the privacy of their personal space.”

    – Randall Collins, Interaction Ritual Chains, Princeton University Press, 2005, at p. 280. Citation removed, emphasis mine.

    Waiting for builders and designers to provide good spaces for social and religious ritual is unlikely to be an effective strategy. What would it take for Americans to simply, impolitely use what space there is for these purposes? Americans flood the streets over sports team victories; I saw a crowd of young people pour into a busy street in Hollywood on the night the Obama victory was announced in 2008, out of pure tribal joy. The sustained occupations of public space in recent years (e.g. Occupy Wall Street) have been ugly and unsustainable, but demonstrate a willingness to break through politeness to use public space in new ways. Rather than permanent squatting, imagine a beautiful, rhythmic occupation, one of weekly repetition, of mass praying in the streets with no political goals at all.

    This piece was first published by Front Porch Republic.

    Sarah Perry studied urban planning at MIT and is a housewife in San Antonio, Texas. She is currently a guest blogger-in-residence at Ribbonfarm.

    Trinity Church in Manhattan photo by Wikimedia Commons user Griffindor.

  • The Argument for Less Infrastructure

    What would our neighborhoods look like if we voluntarily reduced the amount of infrastructure? This isn’t a purely academic question. As municipal, state, and federal budgets get squeezed there’s going to be a point at which we have no choice but to stop building new roads and even reduce the amount of maintenance on the roads we already have. We could approach this situation with dread and a sense of loss, or we could embrace it as an opportunity to get a better quality of life for a whole lot less money.

    I grew up in New Jersey. Like most states the New Jersey Highway Trust Fund is just about bankrupt this year. Unless the gas tax is raised all revenue will go exclusively to debt service. If revenue were to drop below a certain point, due to lower gas prices or lower demand for gas, there won’t be enough money to service the debt either. We’re likely to see triage one way or another.

    Screen Shot 2015-01-23 at 6.13.43 PM
    Google

    Screen Shot 2015-01-23 at 6.11.19 PM
    Google

     Screen Shot 2015-01-23 at 6.01.27 PM
    Google

    Screen Shot 2015-01-23 at 7.02.56 PM
    Google

     Screen Shot 2015-01-23 at 7.05.13 PM
    Google

    This is the historic Water Witch subdivision above Sandy Hook that was first built in 1895, not too far from New York City. Twenty five years ago I had friends who bought an old house here when the neighborhood was only beginning to come back after a long period of decline. Back then the houses were old and in varying states of disrepair. My friends saw the potential and started renovating their place and helped spearhead a revitalization of the neighborhood. These days it’s a posh address with rather expensive homes. But notice the narrow gravel roads.

    Screen Shot 2015-01-23 at 6.10.03 PM
    Google

     Screen Shot 2015-01-23 at 6.10.28 PM
    Google 

    Screen Shot 2015-01-23 at 5.59.30 PM
    Google

    Water Witch is a private community, although it isn’t “gated” in the contemporary sense. That means the HOA members pay to maintain the roads not the government. This is a really important distinction. When people believe their property tax money entitles them to certain things they often have high expectations. They tend to have a very different attitude when they know they’re going to be writing a check directly for the level of service they ask for. This difference in who pays for the roads leads to different outcomes. Back in the late 1980’s I was privy to HOA meeting debates where some members demanded that the roads be paved. They were tired of the ruts, mud puddles, and problems of snow removal. The dirt roads were one of the things that had kept property values depressed for decades. So a consulting engineer was brought in and explained exactly what it would cost to pave the roads. It would be many millions of dollars divided by the forty two homes in the community. That conversation came to a halt instantly. So much for paved roads at Water Witch. The compromise was to maintain the gravel roads to a slightly higher standard with annual adjustments that were far more cost effective. The resulting bucolic country lanes twist up the hill and provide a feeling of retreat from both the nearby city as well as the surrounding suburban sprawl. It also ensures that no one will ever be temped to speed since the roads won’t physically allow it. This keeps the neighborhood safe for pedestrians and cyclists. And it also happens to be more ecological as an extra bonus.

    156508764-M-1
    Justin Tinapay Photography 

    156522759-M-1
    Justin Tinapay Photography 

    RachChris-r075-1
    Justin Tinapay Photography

    Now, there were some people in the HOA that didn’t even want to pay for the annual gravel upgrades. These weren’t what you would call poor people, but no one wants to pay for anything if it isn’t absolutely necessary. It was suggested that the community clubhouse could be rented out for special events to generate the needed revenue to pay for road maintenance. Other people objected. Why live in a private community if an army of strangers would come marching in day and night? So the HOA found a sweet spot. The clubhouse would be rented for only twelve events per year between April and October. Valets would be hired at the expense of the renters to manage traffic. Those twelve days would bring in enough money to pay for the road work each summer. It was a reasonable compromise and a good financial deal for everyone. The fact that Water Witch was distinctive and countryfied compared to the unrelenting highways and strip malls of most of New Jersey made it that much more desirable for people looking for a unique event space. People pay extra for charm.

    Screen Shot 2015-01-23 at 7.03.20 PM
    Google 

    Screen Shot 2015-01-23 at 7.01.54 PM
    Google

    By the way, notice how some people have paved their private driveways with asphalt or stone while the HOA roads and the parking lot at the Clubhouse are gravel. It matters who’s responsible for paying for things and how those decisions are made.

    Screen Shot 2015-01-24 at 3.48.13 AM
    Google 

    Screen Shot 2015-01-24 at 3.47.51 AM
    Google

    Screen Shot 2015-01-24 at 3.45.56 AM
    Google 

    Screen Shot 2015-01-24 at 3.43.53 AM
    Google

    In contrast, here’s a newer upscale residential subdivision not far from Water Witch. Notice the massively wide paved roads and enormous cul-de-sac. I have to ask… What does all that paving really do for the neighborhood? You could land an Airbus A380 on this much tarmac. But what’s the point? You can be quite sure that when these roads become cracked and potholed the wealthy well-connected residents of these grand homes will mobilize and bang heads at the public works department. Somehow the government will be made to absorb the expense of repave things even if the (very high) property taxes from these specific homes doesn’t come close to covering the real cost of maintenance. Would these home owners accept a different standard if they were directly responsible for maintaining their own road?

    Screen Shot 1 2015-01-22 at 4.19.01 PM copy
    Google

     Screen Shot 2 2015-01-22 at 4.19.01 PM copy
    Google 

    Screen Shot 2015-01-24 at 7.09.20 AM
    Google 

    Screen Shot 2015-01-24 at 7.12.21 AM
    Google

    Now let’s look at a more reasonably priced home in a middle class neighborhood. This is my sister’s house in another part of the state. She and her family live in a respectable 1960’s tract house on a half acre lot. Look at the cul-de-sac in front of her place. It’s nearly a half acre as well. Look how tiny the parked cars are compared to the amount of pavement. Again, what exactly does the neighborhood get out of this arrangement other than a massive heat island effect in summer, a storm water runoff problem, and a lot of high speed traffic that puts children, pedestrians, and cyclists in danger? Think of all the ways that much land could be put to better use to add value to the neighborhood instead of just chipping away at the county budget.

    At a certain point hard choices are going to have to be made. The current political conversation involves questions about how to raise taxes while lowering levels of service. But there is another way. We could spend a whole lot less money both publicly and privately and still get a higher quality of life. I’m not sure we as a society are really ready to have that conversation.

    John Sanphillippo lives in San Francisco and blogs about urbanism, adaptation, and resilience at granolashotgun.com. He’s a member of the Congress for New Urbanism, films videos for faircompanies.com, and is a regular contributor to Strongtowns.org. He earns his living by buying, renovating, and renting undervalued properties in places that have good long term prospects. He is a graduate of Rutgers University.

  • Largest 1,000 Cities on Earth: World Urban Areas: 2015 Edition

    According to the just released 11th edition of Demographia World Urban Areas (Built-Up Urban Areas or World Agglomerations), there are now 34 urban areas in the world with more than 10 million residents, the minimum qualification for megacity status. Tokyo-Yokohama continues its 60 year leads the world’s largest urban area. Before Tokyo-Yokohama, New York had been the world’s largest urban area for 30 years. London‘s run, preceding that of New York, was much longer, at more than 100 years. Beijing, which was the first of today’s megacities to reach 1,000,000 population, held the title for 75 years before London, according to census and urban historian Tertius Chandler.

    Demographia World Urban Areas is the only regularly published compendium of urban population, land area and density data of urban areas with 500,000 or more population (defined in the Note below). The 2015 edition provides coordinated population, urban land area and density data for all 1,009 identified urban areas with at least 500,000 population. These urban areas account for approximately 52 percent of the world urban population.

    Largest Cities in 2015

    Tokyo-Yokohama grew to 37.8 million residents, the largest urban area population ever recorded (Figure 1). But second ranking Jakarta is moving up quickly, becoming the second urban area in history to exceed 30 million residents (30.6 million). Regrettably, Jakarta (Figure 2) is often left off world city top ten lists, because the continuous urbanization extending into the regencies (Figure 2) of Tangerang, Bogor, Bekasi and Karawang usually excluded (see The Evolving Urban Form: Jakarta). Regencies are national second level jurisdictions, within the provinces that make up Indonesia.

    Fast growing Delhi retained third position, rising to just under 25 million. Later this year, Delhi will be only the third urban area in history to exceed a population of 25 million. Surprisingly, Delhi is nearly 50 percent larger than Mumbai, which is commonly considered to be India’s largest urban area. The Census of India does not allow its urban areas to cross state boundaries, which has continued to result in an under-reporting of Delhi’s population. Demographia, and the United Nations, have been reporting a higher population level as a result of Delhi’s interstate urban extensions. Many urban areas extend across state, provincial or prefectural boundaries, such as New York, Ottawa, Tokyo-Yokohama, Mexico CityBuenos Aires, Manila, Seoul-Incheon, Cairo, Shanghai among  others.

    The developing world continued its increasing domination of world’s largest cities. This year, Manila passed Seoul-Incheon to become the world’s fourth largest urban area. Like Jakarta, Manila is often left off top ten lists of the world’s cities, because the continuous urbanization extending into the provinces of Cavite, Laguna, Bulacan and Rizal and are excluded (see The Evolving Urban Form: Manila).

    Seoul-Incheon is at risk to falling another position by 2016. At 24.9 million, Seoul-Incheon’s leads sixth ranked Shanghai by less than 70,000. The last four positions in the top ten are occupied by Karachi, Beijing, New York and Guangzhou-Foshan. Karachi’s position, however, is hard to quantify, because it has been nearly two decades since the last census and the current estimates could be unreliable. New York, along with Tokyo-Yokohama and Seoul-Incheon is only one of three high-income world cities in the top 10.

    Beijing and Guangzhou-Foshan are new entries to the top ten, having displaced Mexico City and Sao Paulo. These two Latin American cities have long been among the fastest growing in the world and were headed toward much higher rankings. However, their growth has slowed materially, and they are now ranked in the second 10. Nearby Campinas is now growing faster than Sao Paulo and Toluca is exceeding the percentage growth of Mexico City. There was a time that demographers expected Mexico City to become the largest city in the world. In 2000 and 2005, the United Nations ranked Mexico City as second only to Tokyo-Yokohama.

    As indicated in a recent article (World Megacities: Densities Fall as they Become Larger), the number of megacities rose from 29 to 34 (megacities are urban areas with more than 10 million residents). These include Tianjin and Chengdu in China, Lahore (Pakistan), Kinshasa (Democratic Republic of the Congo) and Lima (Peru). China now leads the world with six (Shanghai, Beijing, Guangzhou-Foshan, Shenzhen, Tianjin and Chengdu). The ten largest urban areas are shown in Figure 3 and detailed population data is in Table 1 of World Urban Areas.

    Urban Footprints and Urban Density

    The title of the world’s largest urban footprint — what some may call “sprawl” —- is held by the New York urban area. Often seen as the epitome of successful dense development (a characterization that applies only in its geographically much smaller core area), the New York urban area itself constitutes the least dense megacity in the world. New York covers nearly 4,500 square miles (11,600 square kilometers) and has a population density of 4,500 per square mile (1,800 per square kilometer). It is a surprise to many that even Los Angeles is more dense, the result of its much denser suburbs.

    Tokyo-Yokohama covers the second largest land area, at 3,300 square miles (8,500 square kilometers). There are now 29 urban areas covering 1,000 square miles or more (2,590 square kilometers). Not surprisingly, approximately one-half (15) of these are in the United States. Another five are elsewhere in the high income world, such as Paris. There are also eight developing world cities of 1,000 or more square miles, such as Jakarta, Bangkok and Sao Paulo. Urban land area data for all 1,009 cities is in Table 3 of World Urban Areas.

    Dhaka, the capital of Bangladesh, remained the most densely populated city, at 113,000 per square mile (4,500 per square kilometer). Detailed population density for the 1,009 cities is in Table 4 of World Urban Areas

    Where Urban Population is Growing

    Asia’s has more than half (57 percent) of the population in cities of 500,000 and more (Figure 4). This is more than four times the population of such cities in North America, five times that of Africa and Europe and approximately six times that of South America. With stagnant population growth in the high income world and declines in some nations, there is every reason to believe that urbanization in North America and Europe will continue to decline relative to that of Asia, Africa and South America.

    ——-

    Note: There are two generic definitions of cities: urban areas and metropolitan areas. Urban areas define the physical expanse of cities, which is the area of continuous urban development. The second definition for cities is economic. The economic city is the metropolitan area, which includes the urban area and economically connected territory outside the urban area. The economic relationship is usually determined by work trip data, the extent of commuting from outside to inside the urban area. Because metropolitan areas are always geographically larger than urban areas, they also always have more residents. The difference in geographical sizes can be substantial. The Paris urban area covers only 20 percent of the Paris metropolitan area, a figure close to that of US major metropolitan areas, where urban areas cover only 19 percent of the land in metropolitan areas. The paradox is that metropolitan areas virtually always have more rural land than urban land.

    Ideally, urban areas are not defined by local or regional government jurisdictional boundaries, since rural areas are often included in such jurisdictions, especially suburban jurisdictions. Urban development is not constrained by jurisdictional boundaries, nor are urban areas. This causes substantial confusion, because of a general lack of familiarity with urban area concepts, even among experts.

    Urban areas are called also called "population centres" (Canada), "built-up urban areas" (United Kingdom, "urbanized areas’ (United States), "unités urbaines" (France) and "urban centres" (Australia). The "urban areas" of New Zealand include rural areas, as do many of the areas designated "urban" in the People’s Republic of China, and, as a result, do not meet the definition of urban areas above.

    Whatever they are called, urban areas are simply the extent of development, which in most cases extends well beyond the boundaries of core municipalities. Demographia World Urban Areas uses the following definition for urban areas.

    An urban area is a continuously built up land mass of urban development that is within a labor market (metropolitan area or metropolitan region). As a part of a labor market, an urban area cannot cross customs controlled boundaries unless the virtually free movement of labor is permitted. An urban area contains no rural land (all land in the world that is not urban is considered rural).

    Photograph: Lujiazui business district (Pudong), Shanghai, with the nearly complete Shanghai Tower, second tallest building in the world (by author).

    Wendell Cox is principal of Demographia, an international public policy and demographics firm. He is co-author of the "Demographia International Housing Affordability Survey" and author of "Demographia World Urban Areas" and "War on the Dream: How Anti-Sprawl Policy Threatens the Quality of Life." He was appointed to three terms on the Los Angeles County Transportation Commission, where he served with the leading city and county leadership as the only non-elected member. He was appointed to the Amtrak Reform Council to fill the unexpired term of Governor Christine Todd Whitman and has served as a visiting professor at the Conservatoire National des Arts et Metiers, a national university in Paris.

  • The U.S. Cities Where Hispanics Are Doing The Best Economically

    Since 1980, the percentage of Americans who claim Hispanic heritage has grown from 6% to 17%. By 2040, Latinos will constitute roughly 24% of the population.

    Many Democrats no doubt see President Obama’s executive actions on immigration as a step not only to address legitimate human needs, but their own political future. But perhaps a more important question is how these new Americans will fare economically.

    We decided to look into which of America’s 52 largest metropolitan areas present Hispanics with the best opportunities. We weighed these metropolitan statistical areas by three factors — homeownership, entrepreneurship, as measured by the self-employment rate, and median household income  — that we believe are indicators of middle-class success. Data for those is from 2013. In addition, we factored in the change in the Hispanic population from 2000 to 2013 in these metro areas, to judge how the community is “voting with its feet.” Each factor was given equal weight. Our findings parallel our recent study of the economic fortunes of African-Americans, but with some important differences.

    Surviving Hard Times

    The recession was particularly tough on Hispanics, who suffered a 44% drop in household wealth from 2007 to 2010, compared to a 31% decline for African-Americans and 11% for whites. Lower home values are to blame for much of this – many young Hispanic families bought homes just before the recession hit, explains the Urban Institute, but because they generally had higher debt-to-asset ratios than other ethnic groups, the steep drop in housing prices resulted in a sharper decline in their wealth. Hispanics’ home equity dropped 49% over those years.

    The recession and the weak recovery have contributed to a change in the demographics of the U.S. Hispanic population – immigration has slowed while the U.S.-born Latino workforce has continued to expand at a brisk clip. In 2013, for the first time in almost two decades, the U.S.-born accounted for the majority of Hispanic workers in the country (50.3%), up from 43.9% in 2007, according to the Pew Foundation.

    During the recovery, U.S.-born Hispanics have made strong job gains, adding 2.3 million to the ranks of the employed from the fourth quarter of 2009 through the fourth quarter of 2013, compared with a loss of 37,000 jobs in the recession. But that has only slightly outpaced growth in the Hispanic working-age population.

    Hispanic unemployment has come down to 6.5%, but wages have been stagnant – Pew reports a slight gain in earnings of full-time Hispanic workers through the end of 2013, but that came as a result of the retreat of lower-paid illegal immigrants from the workforce.

    The Unexpected Place Where Latinos Have Done Best

    The prime U.S. cities for Latinos have long been New York, Miami, Chicago and Los Angeles. The Los Angeles metropolitan area alone has more than 5 million Latinos, including an estimated 1 million undocumented immigrants. Yet it no longer is necessarily the best place for them, ranking only a middling 32nd in our survey. L.A.’s once thriving industrial economy has been in a secular decline, and in the process thousands have lost employment. At the same time, construction work has been slow, another traditional source of employment. High housing costs have also put homeownership out of reach. A 2013 Fannie Mae study found that Latinos place greater emphasis on homeownership than the rest of the population.

    Given the diminished possibilities of buying a home or finding a decent job in the Los Angeles metropolitan area, Latinos have been flocking to the suburban periphery that encompasses much of adjacent Riverside and San Bernardino counties, also known as the Inland Empire, which ranks second in our survey. From 2000 through 2013, the Latino population in the area soared 74%, compared to a 15% population gain for Los Angeles.

    Not surprisingly, given its substantially lower home costs, roughly half those of Los Angeles, the Inland region has a relatively high Latino homeownership rate of 55.3%, compared to 37.7% in Los Angeles. Rates of self-employment are also higher than in L.A. (23.5% to 21.3%) and so too are median household incomes ($47,200 vs. $45,200). The metro area was devastated in the housing bust, but it’s coming back faster than the coastal economy. Although total employment is some 30,000 jobs below its 2007 level, California Lutheran University economist Dan Hamilton notes that Riverside-San Bernardino’s 2.2% job growth over the past year compares well with the 2.0% increase in Orange County and 1.3% in L.A.

    Latinos also fared middling in California’s other high-cost metro areas. San Jose ranks 22nd and San Francisco-Oakland ranks 25th.

    The same factors that make Riverside-San Bernardino a good place for Hispanics — lower housing costs and decent job growth — characterize most of the metropolitan areas that lead our list. That is particularly true of our No. 1 metro area, Jacksonville, Fla., which is just 40 miles north of St. Augustine, founded by the Spanish in 1565, making it the longest continuously settled city in what is now the United States.

    The metro area’s Hispanic homeownership rate of 55% is notably higher than the 43% average in the 52 largest U.S. metropolitan areas.  The median household income of $50,170 is also well above the major metro average of $41,740. Like many Florida cities, Jacksonville was hard-hit by the recession, but over the past year, the region has added close to 22,000 jobs. Jacksonville’s Hispanic population has grown 148% since 2000.

    Other Florida metro areas where Hispanics are prospering are Tampa-St. Petersburg (12th),  Orlando (13th), and Miami (16th).

    Not surprisingly, Latinos are also doing very well in a number of Texas cities. Like Florida, the state has relatively low housing prices, as well as a generally more buoyant economy, with strong growth in blue-collar fields such as construction, manufacturing and energy. The Lone Star State’s four big metro areas all place in the top 10, with Houston ranking fourth, followed by Dallas-Fort Worth (seventh), San Antonio (eighth) and Austin (ninth). They all are above average in terms of homeownership rates, self-employment and median household income.

    Like African-Americans, Latinos have done relatively well in No. 3 Baltimore, where their numbers have increased since 2000 by 175%, with a median household income of $59,940, second highest in the nation behind the adjacent Washington, D.C., area (No. 5), where the median household income for Hispanics is $65,736.

    Shifting Patterns

    In recent years, immigration overall has shifted to the Southeast away from many of the traditional “gateway” cities. Today the largest growth in foreign-born Americans is in the Southeast and Texas; since 2010 the old Confederacy attracted over 1.5 million foreign-born residents, more than the Northeast and Midwest together.

    None of the traditional gateway cities rank in the top 10 on our list. After Miami, the highest ranking of them is Chicago, at 18th, thanks to relatively lower home prices and a high Latino homeownership rate (51.4%).

    In contrast, New York, home to the country’s second largest Latino community after Los Angeles, ranks a poor 42nd. This reflects one of the lowest rates of Hispanic homeownership in the country, 26.5%, and modest population growth of roughly 29% since 2000, compared to an average of 96% for the 52 largest U.S. metro areas. New York Latino households earn a median of $42,980. That’s slightly above the 52 major metro median of $41,740, but given the sky-high housing costs in the Gotham area, it doesn’t go very far. In the Bronx, where the population is 55% Hispanic, roughly 30% of households are below the poverty line, the highest rate of any large urban county.

    As was the case with African-Americans, the metro areas at the bottom of our list are all faded industrial centers. Milwaukee ranks last, preceded by Providence, R.I. ; Hartford, Conn.; and Buffalo and Rochester, N.Y.

    Forging The American Future

    Identifying where Latinos are going, and doing well, is critical not just for them but the future of the country. One out of every four American children are Latino and since 2000 they have accounted for two-thirds of all net job gains made in the country. Latinos are also playing a key role in the recovery from the housing bust, accounting for 56% of all new owner households created between 2010 and 2013.

    What our research and migration trends suggest is that the geography of Latino opportunity is rapidly changing. The Latinization of America is gathering strength in parts of the South that offer a better deal for new Americans and their offspring than New York, Los Angeles or Chicago. You want a little salsa on those grits?

    BEST CITIES FOR HISPANICS/LATINOS
    Metropolitan Area Rank Score Home Ownership Rate Median Household Income Share of Total Self Employment Change in Population: 2000-2013
    Jacksonville, FL       1   80.3 54.9% $50,171 17.1% 148.2%
    Riverside-San Bernardino, CA       2   78.8 55.3% $47,196 23.5% 74.3%
    Baltimore, MD       3   74.0 47.5% $59,939 9.8% 175.3%
    Houston, TX       4   71.6 52.3% $43,020 22.9% 68.4%
    Washington, DC-VA-MD-WV       5   70.7 45.4% $65,736 11.0% 105.0%
    Virginia Beach-Norfolk, VA-NC       6   70.2 47.2% $50,197 9.8% 156.6%
    Dallas-Fort Worth, TX       7   66.8 50.0% $41,622 22.1% 70.3%
    San Antonio, TX       8   66.3 56.9% $42,377 23.3% 43.8%
    Austin, TX       9   65.4 44.6% $43,712 20.9% 83.4%
    St. Louis,, MO-IL       9   65.4 56.5% $50,570 7.8% 92.2%
    Sacramento, CA     11   63.9 43.9% $45,667 21.8% 66.1%
    Tampa-St. Petersburg, FL     12   63.5 49.4% $39,757 17.1% 100.4%
    Orlando, FL     13   61.5 46.7% $38,721 17.1% 128.1%
    Pittsburgh, PA     14   59.1 48.4% $55,108 7.3% 102.4%
    Salt Lake City, UT     14   59.1 49.5% $42,232 10.8% 78.3%
    Miami, FL     16   58.2 52.6% $41,547 17.7% 46.2%
    Las Vegas, NV     17   57.7 40.8% $42,789 16.8% 101.5%
    Chicago, IL-IN-WI     18   55.8 51.4% $45,349 11.1% 36.7%
    Oklahoma City, OK     19   55.3 48.5% $38,054 10.0% 121.4%
    Seattle, WA     20   53.4 35.6% $48,903 9.9% 112.4%
    Richmond, VA     21   52.4 41.8% $38,186 9.8% 196.1%
    San Jose, CA     22   51.9 38.8% $59,150 19.9% 23.7%
    San Diego, CA     23   51.4 38.6% $46,875 21.3% 40.8%
    Charlotte, NC-SC     24   51.0 42.9% $38,843 8.6% 174.6%
    Denver, CO     25   50.5 44.7% $42,071 13.5% 53.7%
    Phoenix, AZ     25   50.5 44.9% $38,704 19.9% 61.1%
    San Francisco-Oakland, CA     25   50.5 38.5% $56,269 19.8% 34.9%
    Cincinnati, OH-KY-IN     28   48.1 41.3% $42,271 6.8% 190.6%
    Atlanta, GA     29   47.6 42.8% $38,919 8.8% 116.9%
    Kansas City, MO-KS     29   47.6 47.1% $40,432 7.8% 90.7%
    New Orleans. LA     29   47.6 41.7% $46,146 8.2% 74.2%
    Los Angeles, CA     32   44.2 37.7% $45,202 21.3% 15.3%
    Raleigh, NC     33   43.8 39.6% $37,572 8.4% 177.7%
    Minneapolis-St. Paul, MN-WI     34   42.3 40.9% $42,764 7.6% 90.0%
    Detroit,  MI     35   41.8 61.5% $41,276 7.5% 39.8%
    Louisville, KY-IN     36   39.4 41.3% $35,571 6.5% 206.8%
    Philadelphia, PA-NJ-DE-MD     37   38.9 43.3% $36,365 8.9% 81.4%
    Memphis, TN-MS-AR     38   37.0 40.5% $32,041 8.1% 156.2%
    Portland, OR-WA     39   36.5 33.3% $40,486 9.6% 83.8%
    Nashville, TN     40   35.6 38.2% $36,458 7.3% 176.5%
    Grand Rapids, MI     41   35.1 47.7% $35,114 8.3% 54.4%
    New York, NY-NJ-PA     42   34.6 26.5% $42,981 13.3% 29.4%
    Birmingham, AL     43   32.7 40.3% $32,165 6.9% 174.1%
    Indianapolis. IN     43   32.7 35.5% $27,293 7.7% 195.5%
    Boston, MA-NH     45   31.7 24.5% $39,080 10.7% 65.6%
    Cleveland, OH     46   30.3 43.9% $38,762 7.6% 45.7%
    Columbus, OH     47   29.3 28.1% $38,520 6.9% 155.6%
    Rochester, NY     48   27.9 37.7% $26,315 12.2% 55.1%
    Buffalo, NY     49   25.0 33.8% $30,489 12.0% 50.8%
    Hartford, CT     50   24.5 29.9% $30,453 11.4% 54.7%
    Providence, RI-MA     51   21.2 23.8% $28,622 10.0% 64.5%
    Milwaukee,WI     52   19.2 34.7% $32,308 7.6% 68.3%
    Calculated from 2013 American Community Survey & EMSI data
    Analsys by Wendell Cox

    This piece first appeared at Forbes.

    Joel Kotkin is executive editor of NewGeography.com and Roger Hobbs Distinguished Fellow in Urban Studies at Chapman University, and a member of the editorial board of the Orange County Register. He is also executive director of the Houston-based Center for Opportunity Urbanism. His newest book, The New Class Conflict is now available at Amazon and Telos Press. He is also author of The City: A Global History and The Next Hundred Million: America in 2050.  He lives in Los Angeles, CA.

    Wendell Cox is principal of Demographia, an international public policy and demographics firm. He is co-author of the “Demographia International Housing Affordability Survey” and author of “Demographia World Urban Areas” and “War on the Dream: How Anti-Sprawl Policy Threatens the Quality of Life.” He was appointed to three terms on the Los Angeles County Transportation Commission, where he served with the leading city and county leadership as the only non-elected member. He was appointed to the Amtrak Reform Council to fill the unexpired term of Governor Christine Todd Whitman and has served as a visiting professor at the Conservatoire National des Arts et Metiers, a national university in Paris.

    Jacksonville photo by Don Dearing (Flickr: Jacksonville, FL) [CC BY-SA 2.0], via Wikimedia Commons

  • Military Memorials: Is This Really the Best We Can Do?

    I was researching material for a blog post about the town I grew up in (Toms River, New Jersey) and accidentally stumbled on something completely unrelated that I find deeply disturbing on multiple levels. It was a roadside memorial dedicated to a fallen soldier. I looked up his name and realized that he had gone to my high school and his family lived very near the house I had once lived in. United States Navy SEAL Denis Miranda was twenty four years old when he perished in Qalat, Afghanistan. He has two surviving brothers on active duty.

    Screen Shot 2015-01-18 at 1.38.54 AM
     Google

    Screen Shot 2015-01-18 at 1.57.25 AM
    Google

    Screen Shot 2015-01-18 at 1.39.40 AM
    Google

    Screen Shot 2015-01-18 at 1.39.13 AM
    Google

    Denis Miranda is currently being “honored” by a cheap metal highway sign at the back of a ShopRite supermarket next to the employee parking lot and a storm water retention ditch. The chain link fence behind the sign is used to pin up banners advertising cold beer on sale. It isn’t dignified enough to commemorate the death of a native son. What exactly is his mom supposed to think as she drives past this sign on the way home from church? Is it comforting? Do his father and brothers meet at the sign to have a solemn moment of prayer and remembrance while summer traffic backs up at the intersection waiting for the light to turn green? Is the placement of the sign meant to inspire passing motorists to think deep thoughts about the nature of war and patriotism? And what does this kind of monument say about the way our society values its fallen? What does it say about the fact that this might actually be the best spot in town to express public gratitude or collective loss?

    Screen Shot 2015-01-18 at 1.57.59 AM
     www.njrunforthefallen.org

    Then I realized there was an entire state wide trail of these memorial signs all along the New Jersey coast, each marker representing a veteran who never returned home. The tragedy of all those lost lives and family sacrifices worked on me and I got angry at the memorials themselves. Is this really the best we can do?

    NJ WAR DEAD
     The Star-Ledger Archive

    Screen Shot 2015-01-18 at 1.15.48 AM
    Google

    Screen Shot 2015-01-18 at 1.16.36 AM
    Google

    Screen Shot 2015-01-18 at 1.17.28 AM
    Google

    This is the sign commemorating the loss of Marine Private First Class Vincent Frassetto who died in Al Anbar Province, Iraq. His memorial is on the side of a cloverleaf intersection near the Ocean County Mall. This same roadside spot is also favored by people placing signs advertising rug sales and warnings about pedophiles who may be lurking in public places. Will anyone ever make a pilgrimage to this sign by parking on the edge of the mall and walking across the grassy cloverleaf with loved ones to ponder the life and death of Vincent Frassetto? Or is the public assumed to be too busy to get out of the car so we better catch them while they’re trapped at a red light? Again, the quality and location of the memorial simply isn’t in keeping with the scale of the sacrifice.

    1866432_orig
     marines.togetherweserved.com

    Screen Shot 2015-01-18 at 4.40.01 AM
    Google

    Screen Shot 2015-01-18 at 4.23.03 AM
    Google

    Major James Weis of the U.S. Marine Corps died in Helmand Province, Afghanistan. Here’s his home town roadside war hero monument. It got me thinking about the people who organized these memorials – all devoted and well intentioned no doubt. Did they truly believe that these arrangements were appropriate? Were the folks on the committee looking around for a sacred place of honor and decide, “Hey, how about we put these cheap highway signs next to the left hand turn lane by the muffler shop and the Krispy Kreme.”?

    So… where exactly should we put memorials to fallen veterans these days? What form should those monuments take? We used to live in the kinds of towns were there were obvious places to erect an obelisk or a bronze statue. Now most of us live in tract home subdivisions, work in office parks on the side of a highway, and shop at strip malls. Could it be that these flimsy sheet metal markers reflect our true values and who we really are? Am I the only one who thinks this is weird and distasteful?

    John Sanphillippo lives in San Francisco and blogs about urbanism, adaptation, and resilience at granolashotgun.com. He’s a member of the Congress for New Urbanism, films videos for faircompanies.com, and is a regular contributor to Strongtowns.org. He earns his living by buying, renovating, and renting undervalued properties in places that have good long term prospects. He is a graduate of Rutgers University.

  • World Megacities: Densities Fall as they Become Larger

    There is an impression, both in the press and among some urban analysts that as cities become larger they become more densely populated. In fact, the opposite is overwhelmingly true, as Professor Shlomo Angel has shown in his groundbreaking work, A Planet of Cities. This conclusion arises from the fact that, virtually everywhere, cities grow organically so that they add nearly all of their population on the urban fringe, which has considerably less expensive land. As their physical form of cities (the urban area) expands, the residents per unit of developed area generally falls.

    Previous Analysis

    Two years ago, we analyzed growth patterns among the 23 world megacities that had been described in the Evolving Urban Form series. Megacities are urban areas with more than 10 million residents. This article extends the analysis to the other 11 megacities that will be included in the soon to be published 11th edition of Demographia World Urban Areas.

    Sadly, historical data is simply not available for the most urban areas. Urban areas are designated in some countries, such as the United States, Canada, the United Kingdom, France, India, and the Scandinavian countries. The census authorities in only a few countries, such as the United States and France have produced reliable information over a number of decades.

    Perhaps the most notable historical international effort was that of Kenworthy and Laube, whose global project produced estimates from 1960 through 1990 for a number of urban areas. In some cases, academic efforts have produced consistent urban land area and urban population data for specific cities, such as Lahore, one of the new megacities described below.

    Estimating the Density Dynamics of Cities

    Where historic urban area data is not available, an effective alternative is to compare core area population growth to areas outside the core in the corresponding metropolitan areas. Areas outside the core typically have lower population densities and the addition of more people outside the cores will normally indicate that the urban density is falling. In some cases, this can be indicated by huge core area losses, such as has occurred for decades in London and Paris, as well as Osaka and Mexico City, described in the previous article (see Table).

    Table
    SUMMARY OF MEGACITY URBAN POPULATION TRENDS
    MEGACITY General Growth Pattern
    Bangkok 10 Years: 55% of growth outside core municipality
    Beijing 10 Years: 99% of growth outside core districts
    Buenos Aires 60 Years: 100%+ of growth outside core municipality
    Cairo 16 Years: 2/3 of growth outside core governate
    Chengdu 10 Years: 55% of growth outside core districts
    Delhi 10 Years: 90% of growth outside core districts
    Dhaka 10 Years: 50% of growth outside core municipalities
    Guangzhou-Foshan 10 Years: 75%+ of growth outside core districts
    Istanbul 25 Years: 100%+ growth outside core districts
    Jakarta 20 Years: 85% of growth outside core jurisdiction
    Karachi 20 Years: Estimated density decline 15%
    Kinshasa 20 Years 65% of growth outside core districts
    Kolkata 20 Years: 95% of growth outside core municipality
    Lagos 15 Years: 90% of growth outside core districts
    Lahore 40 Years: 70% urban density decline
    Lima 15 Years: 100%+ of growth outside core districts
    London 110 Years: core districts decline 30% (Inner London)
    Los Angeles 60 Years: 95% growth outside core municipality
    Manila 60 Years: 95% growth outside core districts
    Mexico City 60 Years: 100%+ of growth outside core districts
    Moscow 8 Years: 95% of growth outside core districts
    Mumbai 50 Years: 98% of growth outside core districts
    Nagoya 40 Years 90% of growth outside core municipality
    New York 56 Years: 45% urban area density decline
    Osaka-Kobe-Kyoto 50 Years: 95% of growth outside core municipalities
    Paris 50 Years: 25% urban area density decline
    Rio de Janeiro 10 Years: 95% of growth outside core districts
    Sao Paulo 20 Years: 2/3 of growth outside core municipality
    Seoul 20 Years: 115%+ of growth outside core municipality
    Shanghai 10 Years: 99% of growth outside core districts
    Shenzhen 10 Years: 70%+ of growth outside core districts
    Tehran 15 Years >95% of growth outside core districts
    Tianjin 10 Years: 85%+ of growth outside core districts
    Tokyo 50 Years: 95% of growth outside core municipalities


    Many core municipalities have been expanded to include areas that are functionally suburban, rather than the intense urbanization that was more usual in pre-automobile sectors of the city. This is not just an American phenomenon. In Canada, there are large areas of functional suburbanization (lower residential densities and majority automobile use for motorized transport) in core municipalities, such as Toronto, Ottawa, and Calgary. There are other examples elsewhere in the world, such as Auckland, London, and Rome.

    As a result, functional urban core and suburban characteristics are poorly defined by analyses using municipal jurisdiction boundaries (such as core municipalities versus suburban municipalities).
    Urban core populations and densities are best analyzed using functional urban core and suburban characteristics, such as higher residential densities and unusually high reliance on transit, walking and cycling, as opposed to automobiles.

    The use of census tracts for this finer grained analysis has been undertaken for the metropolitan areas of Canada by Gordon and Janzen. Following their general model, I have applied functional urban core and suburban characteristics at the Zip Code Tabulation Area (ZCTA) level in the United States, see From Jurisdictional to Functional Analysis of Urban Cores & Suburbs). A number of issues have been covered in articles (City Sector Model index). One article shows that, among the core municipalities of the major metropolitan areas, those with more than 1,000,000 population, only 42 percent of residents live in functionally urban core districts. Virtually the entire core municipality is functionally urban core in New York, Buffalo, and San Francisco. A number of core municipalities simply have no functional urban core (such as Phoenix and San Jose).

    Megacity Density Trends

    The previous article indicated that population densities were falling in each of the 23 megacities analyzed. A similar conclusion applies to the 11 additional megacities analyzed in this article. All of these trends are indicated in the table.

    Paris: It may come as a surprise that the ville de Paris (the core municipality) accounts for little more than one-fifth of the urban area population and less than 1/20th of the continuously built up land area. Further, the ville de Paris has experienced a population decline as significant as many American core municipalities, dropping from over 2.9 million in 1921 to 2.3 million today. The population density of the Paris urban has dropped by more than one-half since 1954 and by nearly 85 percent since 1900. The inner four districts (arrondissements) have lost nearly three-quarters of their population since 1861. The losses may have started earlier, but comparable earlier data is not available.

    London: The London urban area has just achieved megacity status. London forced much of its post-World War II population growth outside its newly created greenbelt following World War II. Between World War II and the 1990s, the London urban area lost population. Most, but not all of the London urban area is composed by the Greater London Authority (GLA), over which Ken Livingstone and Boris Johnson have famously presided.

    However there has been a significant population increase since the 1990s. The Greater London Authority recently celebrated a "peak population" day to note having exceeded its 1939 population peak.  Virtually all of London’s metropolitan area (Note 1) growth has occurred outside the greenbelt, in the exurban areas. Approximately 3.3 million residents have been added to the first ring counties abutting the greenbelt between 1951 and 2011. Inner London, which roughly corresponds to the pre-1964 London County Council area, lost more than 450,000 residents in the same period, while Outer London (also in the GLA and inside the green belt) gained more than 400,000.

    However, even with the greenbelt, today’s London urban area covers more land area. At the 2011 census, the London urban area had fallen to nearly 15 percent below the Kenworthy and Laube estimate for 1961. Since 1900, London’s density is estimated to have dropped by two-thirds. Inner London, which roughly corresponds to the pre-1964 London County Council area, remains approximately one-quarter below its 1901 population, even with recent growth. All of the GLA growth has been in outer London.

    Other Megacities: Pakistan’s two largest urban areas, Karachi and Lahore are growing at among the fastest rates in the world, averaging approximately three percent annually. Interpolation of data from academic papers indicates declining population densities in both cities.

    Lagos continues to grow rapidly. More than 90 percent of its recent growth has been in suburban districts, with their lower, but still high, densities. Kinshasa, one of the new megacities, has the fastest growth rate according to United Nations data. Kinshasa is growing over four percent per year, with nearly two-thirds of its recently reported growth outside the densest areas in the core districts.

    Tehran’s core districts are now experiencing only modestly increasing population. Nearly all growth (98 percent) has been outside the core districts.

    China has recently added two cities to the megacity list, Tianjin and Chengdu. Approximately 85 percent of Tianjin’s recent growth has been outside the core districts. In Chengdu, the areas outside the core districts have captured 55 percent of the growth.

    Over the past 40 years, 90 percent of Nagoya’s growth has been outside the core municipality.

    Lima is another new megacity. In Lima, core district population is declining and all growth has occurred in suburban districts over the latest 15 years for which there is data.

    The Limits to Urban Density Declines

    There are limits to urban density declines. As people become more affluent and car use increases, city densities decline toward those of automobile orientation. Once that has occurred, there may be modest density increases, but not sufficient to restore the much higher urban area densities from the past and now found only in pre-automobile urban cores.

    However, as lower and middle income cities, from Lagos to Sao Paulo grow and achieve greater affluence, urban growth is likely to continue to be on the lower density periphery.

    Note: The metropolitan area is the economic form of the city. The metropolitan area includes rural and urban territory from which commuters are drawn to employment in the principal urban area.

    Wendell Cox is principal of Demographia, an international public policy and demographics firm. He is co-author of the "Demographia International Housing Affordability Survey" and author of "Demographia World Urban Areas" and "War on the Dream: How Anti-Sprawl Policy Threatens the Quality of Life." He was appointed to three terms on the Los Angeles County Transportation Commission, where he served with the leading city and county leadership as the only non-elected member. He was appointed to the Amtrak Reform Council to fill the unexpired term of Governor Christine Todd Whitman and has served as a visiting professor at the Conservatoire National des Arts et Metiers, a national university in Paris.

    Photo: Depiction of Lagos built-up urban area

  • Bicycles and Race in Portland

    The flashpoint for the gentrification conversation along Portland’s North Williams revolves around the bicycle. The cultural appetite for what the creative class likes and enjoys is in stark contrast to that of the African-American community. “North Williams Avenue wasn’t hip back in the late 1970s. There was no Tasty n Sons. No Ristretto Roasters. No 5th Quadrant. Back then, it was the heart of the African American community. It was wonderfully colorful and gritty.” As the black community saw their own businesses close down through economic disinvestment, they weren’t replaced with new businesses that they regarded as desirable. In the several hours I spent today at Ristretto I have seen roughly a hundred patrons come in and go out, plus others sitting outside on the patios of one of several nearby restaurants. Only three were African-American. As I mentioned earlier, the buildings that surround this coffee shop are home to many African-American families. And yet these new businesses do not appeal to their cultural tastes.

    This all came to a head over a road project to reconfigure North Williams and Vancouver Avenue. Both are one-way roads a block apart that carry a high volume of bicycle traffic. Vancouver’s southbound traffic flows carry cyclists towards the Lloyd Center and downtown Portland and so sees its heaviest usage in the mornings. Williams on the other hand carries northbound traffic away from the city center which means its highest use is in the afternoons and evenings when bicycle commuters are heading away from the city center. But the focal point of all of this controversy is specifically tied to North Williams Avenue because this is where most of the new businesses are coming in.

    A New York Times article featured this stretch of road including one of the business owners who opened up the beloved Hopworks BikeBar. “North Williams Avenue [is] one of the most-used commuter cycling corridors in a city already mad for all things two-wheeled. Some 3,000 riders a day pass by Mr. Ettinger’s new brewpub, which he calls the Hopworks BikeBar. It has racks for 75 bicycles and free locks, to-go entrees that fit in bicycle water bottle cages, and dozens of handmade bicycle frames suspended over the bar areas. Portland is nationally recognized as a leader in the movement to create bicycle-friendly cities.” Other national newspapers and magazines have also picked up on all of the buzz happening along North Williams. In Via Magazine, Liz Crain writes, “With 3,000 commuters pedaling it every day, North Williams Avenue is Portland’s premier bike corridor. Visitors, too, find plenty worth braking for on two blocks of this arterial, including two James Beard Award–nominated chef-owned restaurants and a slew of hip shops and cafés.” Sunset Magazine has several features on North Williams including: “Go green on Portland’s North Williams Avenue: Enjoy a low-key urban vibe thanks to yoga studios, indie shops, and cafes.”

    With images of happy (white) hipsters pedaling bicycles, doing yoga, and eating gourmet food, the nation is given a taste of inner N/NE Portland that is not reflective of the reality of the neighborhood nor the tension surrounding gentrification. These magazines showcase things to see, do, and eat along North Williams with helpful hints like, “Scene: A low-key urban vibe, courtesy of yoga studios and green indie shops and cafes … Dress code: waterproof jacket and jeans with right leg rolled up … Native chic: A waterproof Lemolo bike bag … The Waypost: Creative types come to this coffeehouse for locally produced wine and beer, as well as live music, lectures, and classic-movie screenings.”

    However, not all of the residents are necessarily in favor of these changes taking place. And there are certainly other national media outlets who have picked up on the “other side” of the North Williams story. “Located in a historic African-American community, the North Williams businesses are almost exclusively white-owned, and many residents see bicycles as a symbol of the gentrification taking place in the neighborhood.”

    The tensions of racism and gentrification have culminated in ongoing debates over North Williams’ status as a major bicycle thoroughfare. Sarah Goodyear of The Atlantic Cities (CityLab) writes, “Sharon Maxwell-Hendricks, a black business owner who grew up in the neighborhood, has been one of the most vocal opponents to the city’s plan for a wider, protected bike lane. She can’t help but feel that the city seems only to care about traffic safety now that white people are living in the area. ‘We as human beings deserved to have the same right to safer streets years ago,’ she says. ‘Why wasn’t there any concern about people living here then?’” This picks us on the tension surrounding the North Williams project in general, and in particular the controversy surrounding repainting the traffic lanes to incorporate new designs which cater to the growing number of bicyclists who use this corridor.

    Goodyear goes on to lay out both sides of the controversy:

    Jonathan Maus, who runs the Bike Portland blog and has reported extensively on the North Williams controversy, thinks the city should have stood its ground and gone forward with the project, but wasn’t willing to do so in part because of the political weakness of scandal-plagued Mayor Sam Adams, who has been a strong biking advocate and is closely identified with the biking community.

    “There’s been too much emphasis on consensus,” said Maus. “I’m all for public process, but I also want the smartest transportation engineers in the country on bicycling to have their ideas prevail.”

    Maus, who is white, says the history of North Williams shouldn’t be dictating current policy, and that safety issues for the many people who bike on the street are urgent. “At some point as a city, you have to start planning to serve the existing population,” he said. “The remaining black community is holding traffic justice hostage. It’s allowing injustice in the present because of injustice in the past.”

    In light of this, why is North Williams the flashpoint for controversy? The tension and angst is about more than simply repainting a roadway; it embodies the most visual representation of gentrification in inner N/NE Portland. For longtime African-American residents, as expressed above by Maxwell-Hendricks, she and others felt that they had simply been neglected for decades. This negligence took the form of economics, housing, and general concerns of safety. Their frustration is that it wasn’t until middle-class whites began moving into the neighborhood that these issues began to be addressed and rectified. This notion of systemic racism helped created this area and these same forces are at play in gentrifying this once predominantly black neighborhood.

    The African-American community feels it has been slighted once again. The initial citizen advisory committee revealed the imbalance: “Despite North Williams running through a historically African American neighborhood, the citizen advisory committee formed for the project included 18 white members and only 4 non-white members.” This is why the push for safety along the North Williams corridor has caused such an uproar. “The current debate about North Williams Avenue––once the heart of Albina’s business district––is only the latest chapter in a long story of development and redevelopment.”

    For many in the African-American community the current debate over bike lanes along North Williams is simply one more example in a long line of injustices that have been forced upon their neighborhood. Beginning in 1956, 450 African-American homes and business were torn down to make way for the Memorial Coliseum. “It was also the year federal officials approved highway construction funds that would pave Interstates 5 and 99 right through hundreds of homes and storefronts, destroying more than 1,100 housing units in South Albina.” Then came the clearance of even more houses to make way for Emanuel Hospital. For more than 60 years, racism has been imbedded in the storyline of what has taken place along North Williams.

    For many, the North Williams project is more than repainting lines. As Maus reported, “A meeting last night that was meant to discuss a new outreach campaign on N. Williams Avenue turned into a raw and emotional exchange between community members and project staff about racism and gentrification.” In his article, Maus noted the painful history of Albina as the primary catalyst for the tension today.

    Lower Albina—the area of Portland just north and across the river from downtown through—was a thriving African-American community in the 1950s. Williams Avenue was at the heart of booming jazz clubs and home to a thriving black middle class. But history has not been kind to this area and through decades of institutional racism (through unfair development and lending practices), combined with the forces of gentrification, have led to a dramatic shift in the demographics of the neighborhood. The history of the neighborhood surrounding Williams now looms large over this project.

    It was at this meeting that a comment from one of those in attendance changed the entire trajectory of the evening as the conversation quickly moved away from the proposed agenda. One woman said, “We have an issue of racism and of the history of this neighborhood. I think if we’re trying to skirt around that we’re not going to get very far. We really need to address some of the underlying, systemic issues that have happened over last 60 years. I’ve seen it happen from a front row seat in this neighborhood. It’s going to be very difficult to move forward and do a plan that suits all of these stakeholders until we address the history that has happened. Until we address that history and … the cultural differences we have in terms of respect, we are not going to move very far.”

    The crux of the conflict is not about bicycles nor bike lanes nor even new businesses and amenities. It is about racism. The push for creating a more bikeable and bike-friendly commuter corridor has raised the ire of longstanding residents who had felt neglected and voiceless for decades. “The North Williams case study is an example of the City inadequately identifying, engaging and communicating with stakeholders.”

    Now that more whites are moving in are changes taking place. “Some question why the city now has $370,000 to pour into a project they say favors the bike community while residents for decades asked for resources to improve safety in those same neighborhoods. To the community, the conversation has polarized the issue: white bicyclists versus the black community.” But is this issue completely race-related? Portland has been and continues to expand its bicycle infrastructure throughout the city, not just in N/NE Portland. There are also several other main bicycle corridors that receive a high volume of bicycle commuters, but since they do not go through any ethnic neighborhoods they have not created this much controversy. This does not minimize the tension and angst over the North Williams project; nor does it downplay the role that racism has played throughout the history of that community.

    Note: Footnotes in the original text have been removed. Some hyperlinks have been added.

    This is a condensed chapter excerpt from The Bohemian Guide to Urban Cycling.

    Coffee and bicycles define Sean’s urban existence who believes the best way for exploring cities is on the seat of a bicycle as well as hanging out in third wave coffee shops. Sean is an urban missiologist who works in a creative partnership between TEAM as the Developer of Urban Strategy and Training and the Upstream Collective leading the PDX Loft.

  • Peak Oil, Yes and No

    I have an Australian friend who works on an oil drilling platform off the coast of Tasmania. He sent these photos from his phone. Pretty cool, huh? These photos got me thinking about the Peak Oil meme. For the uninitiated there are two camps on the subject.

    One camp says there’s an unlimited amount of oil, natural gas, and coal in the ground and new technology will always be able to bring it to market. Since global demand is insatiable there will always be money on the table to incentivize new supply. This camp tends to shrug off environmental concerns and puts people and economic growth first.

    unnamed-8

    The other camp says there’s a fixed amount of fossil fuel in the earth’s crust and at some point the cost and complexity of wrestling the last sour crumbs to the surface will hit a wall the market can’t bear. Concerns about environmental degradation and social justice loom large in this camp.

    When oil reached $147 a barrel in 2007 the Peak Oil folks felt victorious. They also insisted that record high fuel prices, not merely financial chicanery, precipitated the economic crash of 2008. Today fracking, shale oil, and new deep water discoveries have created a glut of supply with significantly lower energy prices. There’s currently a lot of, “We told you so” from the other side.

    My view on the subject is colored by my experiences growing up during the oil shocks of the 1970’s and the resulting economic repercussions. Those shocks were caused by geopolitics in the Middle East during the Yom Kippur War of 1973 and the Iranian Revolution of 1979. They had nothing to do with any physical lack of oil in the world – just supply chain disruptions. But those disruptions were devastating to my family in ways that many people don’t necessarily remember clearly today.

    Screen Shot 2014-12-14 at 12.14.06 AM

    My parents had just purchased their first home in suburban New Jersey the year before the oil crunch hit. I was seven years old. Like many young couples my parents had put every bit of their savings into the down payment and were stretched very thin in terms of the monthly payments. Everyone in our extended family was working class with middle class aspirations so home ownership was at the top of the must-have list. New York City was falling apart back then so they drove an hour and a half south until they found a four bedroom fixer-upper on a quarter acre lot in a good school district that they could afford. The house wasn’t perfect, but my folks were convinced that it could be improved over time with sweat equity. Their mortgage was $203 a month. At the time that was a heavy burden relative to their modest income. (Adjusted for inflation that would be the equivalent of $1,153 today.)

    Economy

    We had oil heat like most people in New Jersey back then. A 300 gallon tank in the back yard would keep the house warm for about a month. From early fall until late spring we burned up six tanks on average per year. When we first moved in heating oil sold for 24¢ a gallon. 24¢ x 300 gallons was $72 (or $409 today). That was the number that my parents used when they put together their household budget before buying the house. At the worst point in the oil crisis heating oil sold for $1.20 a gallon. That’s $360 a tank compared to the mortgage payment of $203 (or $2,045 vs. $1,153 in today’s dollars). Think for a moment about your own mortgage or rent. Now think about what would happen to your personal finances if your utility bill unexpectedly became almost double that sum for half the year.

    At exactly the same time that our household budget collapsed under the weight of that heating bill, the cost of nearly everything else also rose significantly. Oil is used in the manufacture and transport of just about everything from beef and milk to lawn mowers and toilet paper. As fuel prices rose that additional cost rippled through the entire economy at the precise moment people had the least ability to absorb the increases. Consumer demand for many discretionary items collapsed, people lost their jobs, and the overall result was a considerably lower standard of living. That process played out over an entire decade and did serious damage to my family.

    Today most heat in New Jersey comes from natural gas which is cheaper, cleaner, and produced domestically. Problem solved, right? Well… I’m not so sure.

    Screen Shot 2014-12-14 at 3.48.07 PM Google

    1l-image

    The US still imports large amounts of natural gas and oil from other parts of the world – primarily Canada and Mexico along with Venezuela, Columbia, Nigeria, and the Arab nations. These things are priced in a global market so in spite of the “America is the new Saudi Arabia” talk prices can become volatile based on events in other parts of the world. The Bakken shale oil coming out of North Dakota is priced right along with the oil coming out of that oil rig off the coast of Tasmania. If even a small amount of the global oil supply were to be choked off for any reason (the Strait of Hormuz gets shut down due to war, or the Ras Tanura oil terminal is disabled by terrorists) the price of oil would skyrocket worldwide. Natural gas is harder to transport across the seas so that market might appear to be more insulated than the oil market, but if the price of oil jumped it could cause more of those economic ripples that were so troublesome in the ’70s. If you’re unemployed due to an oil shock and you lose your home to foreclosure it may not help that domestic natural gas remains relatively affordable. Peak Oil doesn’t have to be real for me to be concerned about energy and my household security.

    I never ever want to find myself in a similar position as my parents so I organize my affairs as if Peak Oil is a legitimate possibility, regardless of the particulars. Listed below are some of my personal rules. Notice, this isn’t a conservative or a liberal list. There’s no mention of bomb shelters or gas masks or firearms to defend against zombies. Nothing on this list will make anyone poorer or less happy. If life continues to be endlessly prosperous and bountiful no one will be missing out on anything. And by the way, these are all things that our great-grandparents did as a matter of course.

    image

    Keep debt to an absolute minimum. Live below your means in a smaller less expensive place than you can actually afford. Get that mortgage paid off entirely as soon as possible. Unless you have six kids you don’t really need a 2,600 square foot house with a three car garage and a bonus room. Think about the debt you will take on for a fancy kitchen remodel so you can keep up with the Joneses – and then think about how nice it would be to not have a monthly payment of any kind instead. The fancy kitchen is fine if you can pay cash, but that old Formica might look a whole lot better in a mortgage free home. If the economy gets funky and you lose the house to foreclosure the bank could end up enjoying those granite counter tops while you pack your bags and move in with your crazy brother-in-law.

    Screen Shot 2014-12-14 at 4.03.26 PM Screen Shot 2014-12-14 at 4.04.35 PMIMG_3282 (800x600)

    Live in a place where you can actually walk or ride a bicycle to all of your daily needs including work, school, the doctor’s office, the post office… This doesn’t mean you have to give up your car or stop driving. It just means you’ll have options and flexibility. And this doesn’t have to be Manhattan. Lots of small rural towns and some older suburban areas still have these qualities. Don’t let the grand double height entry foyer out in the McMansion subdivision off the side of the highway distract you from what’s really important in life. It ain’t chandeliers. 

    Screen Shot 2014-12-14 at 2.27.04 PM Screen Shot 2014-12-14 at 2.26.13 PM


    unnamed-8


    Figure out how to keep the house heated and cooled with the minimum amount of fuel of any kind. Start with the low hanging fruit by adding lots of insulation. Then think about adding modest extra sources of heat such as a small south-facing greenhouse addition or a back up wood stove. If you have the money you could spring for some technological bells and whistles like solar panels, but that’s very last on the to-do list after the cheaper more effective conservation stuff is done. Remember, Denmark is the most energy efficient, most “green” nation on earth with 20% of it’s power coming from windmills, but the other 80% of their energy still comes from dirty old fossil fuels like coal. They just use it very sparingly. First get your household consumption way, way down. Then think about green power to supply what little you do use.

    unnamed-7 unnamed-13

    Find cost-effective ways to secure a plentiful supply of water that isn’t dependent on mechanical pumps or distant supplies that you have no control over. Rainwater catchment off your roof is one such option. Water security is especially important for people who live in a desert or a region that suffers from long periods of drought.

    51a9c926fb04d664dc00177e._s.fit_h.640_w.640_
    IMG_4847
    IMG_4850
    Pantry storage room


    Keep a really well stocked pantry to help ride out future difficulties. Mine can make a Mormon grandma blush. Maintaining a well stocked pantry is a sensible form of insurance and a hedge against future inflation, unemployment, or temporary shortages.

    Sebastopol with MaAntonia 046 (640x480) Screen Shot 2014-12-14 at 4.32.18 PMjjyfcxytr IMG_5381 (480x640) (2)
    IMG_5386 (480x640)
    Sebastopol with MaAntonia 039 (640x480) Sebastopol with MaAntonia 008 (640x480)

    Produce useful things. Plant a big veggie garden and some fruit trees.  Keep chickens. Keep honey bees. Keep meat rabbits. If you have enough space for a dog, then you have enough space for a couple of small dairy goats. If you’re a vegan pacifist you can adjust by ramping up the garden even more. If you’re a skilled hunter you can fill the freezer with venison.

    unnamed-9 unnamed-11 unnamed-12 unnamed-10

    Cook. (Nuking a tray of Lean Cuisine doesn’t count.) Learn to bake a loaf of bread from scratch. A pot of bean soup is ridiculously inexpensive and dead easy. If your kids will only eat pizza then learn how to make it at home. In fact, teach your kids how to make it themselves as a family project. This stuff isn’t rocket science. While you’re at it learn to sew or knit or do woodworking. These skills can be rewarding unto themselves as hobbies, and you never know when they might actually become necessary. 

    Screen Shot 2014-10-08 at 1.19.32 AM Screen Shot 2014-10-08 at 1.21.00 AM Screen Shot 2014-10-08 at 1.16.59 AM

    Get to know your neighbors and build relationships of trust with like-minded people in your community. These associations can be extremely helpful in a crisis. If Peak Oil never occurs you’ve lived a comfortable, affordable, secure life surrounded by good people. How cool is that?

    John Sanphillippo lives in San Francisco and blogs about urbanism, adaptation, and resilience at granolashotgun.com. He’s a member of the Congress for New Urbanism, films videos for faircompanies.com, and is a regular contributor to Strongtowns.org. He earns his living by buying, renovating, and renting undervalued properties in places that have good long term prospects. He is a graduate of Rutgers University.

  • Looking Back: The Ideal Communist City

    Over time, suburbs have had many enemies, but perhaps none were more able to impose their version than the Communist Party of the Soviet Union. In its bid to remake a Russia of backward villages and provincial towns, the Soviets favored big cities – the bigger the better – and policies that were at least vaguely reminiscent of the “pack and stack” policies so popular with developers and planners today.

    Some of this took the form of rapid urbanization of rural areas. Under Joseph Stalin’s rule in the Soviet Union from 1929 to 1953, scores of “socialist cities” were founded near new, expansive steel mills. These steels mills were built to speed up industrialization, in order to produce vast amounts of weaponry. These, notes historian Anne Applebaum, represented the Soviet communists “most comprehensive attempt to jump-start the creation of a truly totalitarian civilization”, by bringing the peasantry into the factories to grow Russia’s working class.   Built from the ground up, these factory complexes, notes Applebaum, “were intended to prove, definitively, that when unhindered by preexisting economic relationships, central planning could produce more rapid economic growth than capitalism”.

    As is sometimes asserted by urbanists today, the new socialist cities were about more than mere economic growth; they were widely posed as a means to develop a new kind of society, one that could make possible the spread of Homo sovieticus (the Soviet man). As one German historian writes, the socialist city was to be a place “free of historical burdens, where a new human being was to come into existence, the city and the factory were to be a laboratory of a future society, culture, and way of life”.

    Elements of High Stalinist culture was evident in these cities; the cult of heavy industry, shock worker movement, youth group activity, and the aesthetics of socialist realism. This approach had no room for what in Britain was called “a middle landscape” between countryside and city. Throughout Russia, and much of Eastern Europe, tall apartment blocks were chosen over leafy suburbs. Soviets had no interest in suburbs of any kind because the character of a city “is that people live an urban life. And on the edges of the city or outside the city, they live a rural life”. The rural life was exactly what communist leaders hoped their country would get away from, therefore Soviet planners housed residents near industrial sites so they could contribute to their country through state-sponsored work.

    With this assumption, Soviet planners made some logical steps to promote density. They built nurseries and preschools as well as theatre and sports halls within walking distance to worker’s homes.   Communal eating areas were arranged. Also, wide boulevards were crucial for marches and to have a clear path to and from the factory for the workers. The goals of the “socialist city” planners were to not just transform urban planning but human behavior, helping such spaces would breed the “urban human”.

    As is common with utopian approaches to cities, problems arose. Rapid development, the speed of construction, the use of night shifts, the long working days, and the inexperience of both workers and management all contributed to frequent technological failures. Contrary to the propaganda, there was a huge gap between the ideal of happy workers thriving in well-managed cities and the reality.  

    If today’s architects sometimes obsess over the quality of production and design, the Soviet campaign to expand dense urbanism was less aesthetically oriented. Less than a year after Stalin’s death, in December 1954, Nikita Khrushchev set a campaign to promote the “industrialization of architecture”. He spoke highly of prefabricated buildings, reinforced concrete, and standardized apartments. He did not care for appearances, instead focusing on just building housing because that is what the people need. Prefab tower blocks, called Plattenbau in German and panelaky in Czech and Slovak, were constructed all over the Soviet Union and their satellite states. Originally, these apartments were to house families working for the state.

    In 1957, a group of architecture academics from the University of Moscow published a book called the Novye Elementy Rasseleniia or “New Elements of Settlement”. This team of socialist architects and planners — Alexei Gutnov, A. Baburov, G. Djumenton, S. Kharitonova, I. Lezava, S. Sadovskij— became known as the “NER Group.”  In 1968, they were invited to the Milan Triennale by Giancarlo de Carlo to present their plans for an ideal communist city. In cooperation with a group of young urbanists, architects, and sociologists, they created an Italian edition of their book under the title Idee per la Citta Comunista.    

    Alexei Gutnov and his team set to create “a concrete spatial agenda for Marxism”. At the center of The Communist City lay the “The New Unit of Settlement” (NUS) described as “a blueprint for a truly socialist city“. Gutnov established four fundamental principles dictating their design plan. First, they wanted equal mobility for all residents with each sector being at equal walking distance from the center of the community and from the rural area surrounding them. Secondly, distances from a park area or to the center were planned on a pedestrian scale, ensuring the ability for everyone to be able to reasonably walk everywhere. Third, public transportation would operate on circuits outside the pedestrian area, but stay linked centrally with the NUS, so that residents can go from home to work and vice versa easily. Lastly, every sector would be surrounded by open land on at least two sides, creating a green belt.

    Gutnov did acknowledge the appeal of suburbia — “…ideal conditions for rest and privacy are offered by the individual house situated in the midst of nature…”, but rejected the suburban model common in America and other capitalist countries. Suburbs, he argued, are not feasible in a society that prioritizes equality, stating, “The attempt to make the villa available to the average consumer means building a mass of little houses, each on a tiny piece of land. . . . The mass construction of individual houses, however, destroys the basic character of this type of residence.”

    The planner’s main concern was ensuring social equality. This was seen in their preference of public transportation over privately owned vehicles, high-density apartment housing over detached private homes, and maximizing common areas. These criticisms of suburban sprawl have some resonance in the   writings by planners advocating “smart growth” today. Both see benefits to high density housing. For one, they argue it is more equitable so everyone, no matter what social class they belong too, can live in the same type of buildings. Some New Urbanists do also like the idea of mixed-income communities. In addition, they both see their ideal community utilizing mixed-use developments, with assuring people easy access to public services such as day care, restaurants, and parks, creating less of a need for private spaces. Similarly, New Urbanists also claim that their planned developments would foster a better sense of community.

    Source: Gutnov, Alexi, Baburov, A., Djumenton, G., Kharitonova, S., Lezava, I., Sadovskij, S. The Ideal Communist City. George Braziller: New York. 1971.

    Of course, it is easy to go too far with these analogies. Even at their most strident, new urbanists and smart growth advocates do not enjoy anything like monopoly of power than accrued to Communist leaders. And also, not all the ideas of new urbanists, and even the creators of the Ideal Communist City, are without merit. The ideas of walkability, close access to amenities and services, are adoptable even in privately planned, suburban developments. But the dangers of placing ideology before what people prefer are manifest, whether in 20th Century Russia or America today.

    Alicia Kurimska is a research associate at the Center for Opportunity Urbanism and Chapman University’s Center for Demographics and Policy. She is the co-author of “The Millennial Dilemma: A Generation Searches for Home… On Their Terms” and deputy editor of New Geography, a website focusing on economics, demographics, and policy.”

    Lead photo of Krushchev-era apartment buidlings in Estonia, “EU-EE-Tallinn-PT-Pelguranna-Lõime 31” by Dmitry GOwn work. Licensed under Public Domain via Wikimedia Commons.

  • International Housing Affordability in 2014

    The just released 11th Annual Demographia International Housing Affordability Survey shows the least affordable major housing markets to be internationally to be Hong Kong, Vancouver, Sydney, along with San Francisco and San Jose in the United States. Honolulu, which should reach 1,000,000 population this year (and thus become a major metropolitan market) was nearly as unaffordable as San Francisco and San Jose. An interactive map in The New Zealand Herald illustrates the results.

    Rating Housing Affordability

    The Demographia International Housing Affordability Survey uses the "median multiple" price-to-income ratio. The median multiple is calculated by dividing the median house price by the median household income. Following World War II, virtually all metropolitan areas in Australia, Canada, Ireland, New Zealand, the United Kingdom and the United States had median multiples of 3.0 or below. Since that time, housing affordability has been seriously retarded in metropolitan areas that have been subjected to urban containment policies. This includes virtually metropolitan areas of the United Kingdom, Australia, New Zealand and some markets in the United States and Canada.

    Housing affordability ratings are indicated in Table 1.

    Table 1
    Demographia International Housing Affordability Survey 
    Housing Affordability Rating Categories
    Rating Median Multiple
    Severely Unaffordable 5.1 & Over
    Seriously Unaffordable 4.1 to 5.0
    Moderately Unaffordable 3.1 to 4.0
    Affordable 3.0 & Under


    Table 2 summarizes housing affordability ratings for the 86 major metropolitan areas in the nine nations covered. Apart from China (Hong Kong), the least affordable nation among the major markets is New Zealand, at 8.2, followed by Australia at 6.4. Both nations (and Hong Kong) are rated severely unaffordable. 

    Table 2
    Housing Affordability Ratings by Nation: Major Markets (Over 1,000,000 Population)
     Nation     Seriously Unaffordable (4.1-5.0) Severely Unaffordable (5.1 & Over)    
           
    Affordable (3.0 & Under)  Moderately Unaffordable (3.1-4.0) Total Median Market
     Australia 0 0 0 5 5 6.4
     Canada 0 2 2 2 6 4.3
     China (Hong Kong) 0 0 0 1 1 17
     Ireland 0 0 1 0 1 4.3
     Japan 0 1 1 0 2 4.4
     New Zealand 0 0 0 1 1 8.2
     Singapore 0 0 1 0 1 5
     United Kingdom 0 1 10 6 17 4.7
     United States 14 23 6 9 52 3.6
     TOTAL 14 27 21 24 86 4.2


    Least Affordable Major Markets

    Hong Kong registered the highest median multiple out of the 86 major markets and also in the history of the Survey, at 17.0. Vancouver reached 10.6. Sydney had its worst recorded housing affordability, with a median multiple of 9.8. Adjacent metropolitan areas San Francisco and San Jose had median multiples of 9.2, while Honolulu’s median multiple was 9.0. The ten least affordable major metropolitan areas are shown in Figure 1. In nine of these markets, housing was affordable before adoption of urban containment policy (Hong Kong data is not available).

    Affordable Major Markets

    All of the affordable major markets are in the United States. This includes perhaps the most depressed market, Detroit as well as Atlanta, which has spent most of the last three decades as the fastest growing larger metropolitan area in the high income world. At the same time, Atlanta has consistently been among the most affordable. Detroit’s median multiple is 2.0, while Atlanta’s is 2.9.

    Comparing Demographia Results to The Economist and Kookmin Bank

    This year’s edition includes a comparison of housing affordability multiple data from The Economist’s survey of 40 metropolitan areas in China and Kookmin Bank’s survey of major metropolitan areas in South Korea. The least affordable major markets are in China, New Zealand and Australia, all with severely unaffordable median multiples. The most affordable major markets are in the United States and Korea, both rated as moderately unaffordable (Figure 2).

    Perspective

    Hugh Pavletich, of performanceurbanplanning.com and I have published each of the annual editions, which began in 2005. The perspective of the Demographia International Housing Affordability Survey is that domestic public policy should, first and foremost be focused on improving the standard of living and reducing poverty. This requires policies that facilitate both higher household incomes and lower household expenditures (other things being equal). Housing costs are usually the largest component of household expenditure and it is therefore important that public policy both encourage and preserve housing affordability.

    Housing Affordability and Urban Containment Policy

    However, in recent years, land use policy has not been focused on this concern. Conventional urban theory sees urban containment as a necessity. Yet, urban containment policies are associated with the loss of housing affordability, due principally to their rationing of land for development. This effect is consistent with basic economics – restricting supply of a desired good tends to drive up prices – that has been long established.

    Some of the most important contributions have come from Sir Peter Hall, et al (see The Costs of Smart Growth Revisited), Paul Cheshire at the London School of Economics (New Zealand Seeks to Avoid "Generation Rent") and William Fischel at Dartmouth University (The Consequences of Smart Growth). Donald Brash, former governor of the Reserve Bank of New Zealand attributed the housing affordability losses to "the extent to which governments place artificial restrictions on the supply of residential land" in his introduction to the 4th Annual Edition.

    The Importance of Urban Expansion

    This year’s introduction is provided by Dr. Shlomo Angel, leader of the New York University Urban Expansion Program. Dr. Angel reminds us that "where expansion is effectively contained by draconian laws, it typically results in land supply bottlenecks that render housing unaffordable to the great majority of residents."

    He describes the Urban Expansion Program is "dedicated to assisting municipalities of rapidly growing cities in preparing for their coming expansion, so that it is orderly and so that residential land on the urban fringe remains plentiful and affordable." Urban Expansion Program teams are already working with local officials in Ethiopia and Colombia to achieve this goal. Angel’s previous work documented the association between urban containment policy in Seoul and large house price increases relative to incomes (see Planet of Cities).

    Policies seeking the same goals of plentiful and affordable land on the urban fringe are just as necessary in high income world metropolitan areas.

    As time goes on, the negative consequences of urban containment policy on housing affordability and the standard of living have been increasingly acknowledged. Christine Legarde, managing director of the International Monetary Fund said that "supply-side constraints will require further measures to increase the availability of land for development and to remove unnecessary constraints on land use." in a recent statement on housing affordability in the United Kingdom.

    Similarly a recent feature article in The Economist (see PLACES APART: The world is becoming ever more suburban, and the better for it) noted that the only reliable way to stop urban expansion was to stop them forcefully (such as through urban containment policy). Yet, The Economist continued, "But the consequences of doing that are severe" and cites the higher property prices that have been the result:"

    The Economist continued to note the effect of the policy on households: "It has also forced many people into undignified homes, widened the wealth gap between property owners and everyone else…"

    Wendell Cox is principal of Demographia, an international public policy and demographics firm. He is co-author of the "Demographia International Housing Affordability Survey" and author of "Demographia World Urban Areas" and "War on the Dream: How Anti-Sprawl Policy Threatens the Quality of Life." He was appointed to three terms on the Los Angeles County Transportation Commission, where he served with the leading city and county leadership as the only non-elected member. He was appointed to the Amtrak Reform Council to fill the unexpired term of Governor Christine Todd Whitman and has served as a visiting professor at the Conservatoire National des Arts et Metiers, a national university in Paris.

    Photo: Exurban London