I’m a longtime advocate of walkable, mixed-use, mixed-income, transit-served neighborhoods. But lately I’ve been having impure thoughts about suburbia. Let me explain.
What often passes for a neighborhood in America is a low grade assemblage of chain convenience stores, big box outlets, franchise muffler shops, multi-lane highways, and isolated cul-de-sacs. Even when it’s physically possible to walk or bike from Point A to Point B it’s not pleasant, safe, or convenient. I bet there are big parts of the town you live in that look like this.
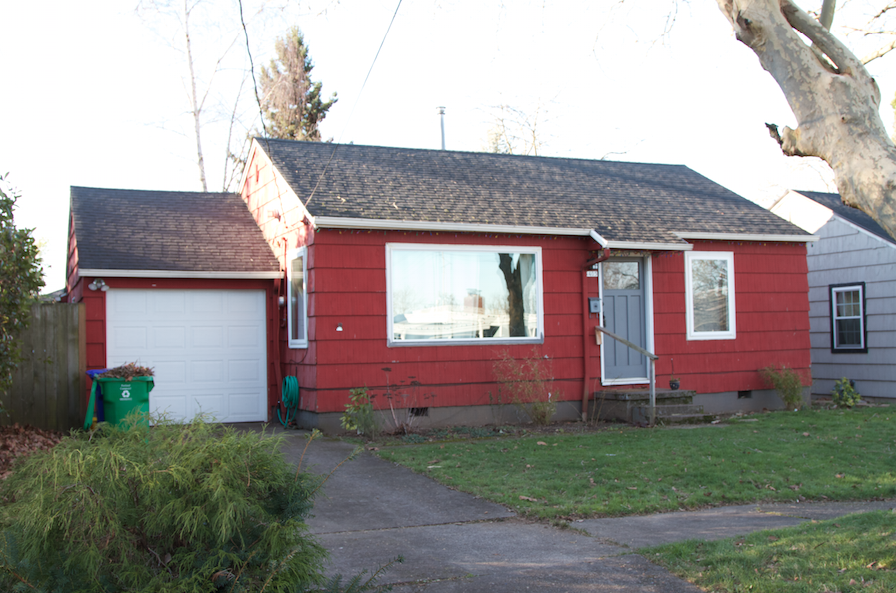
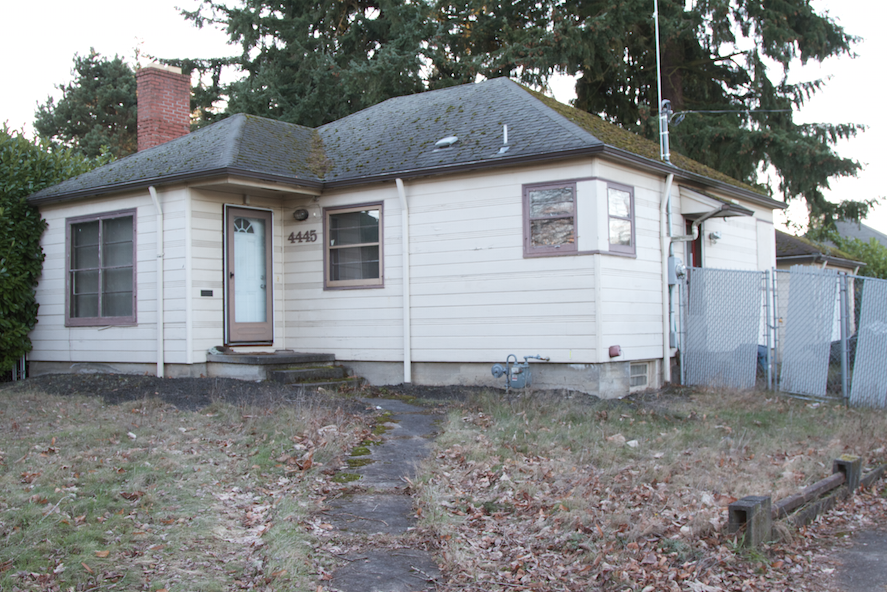
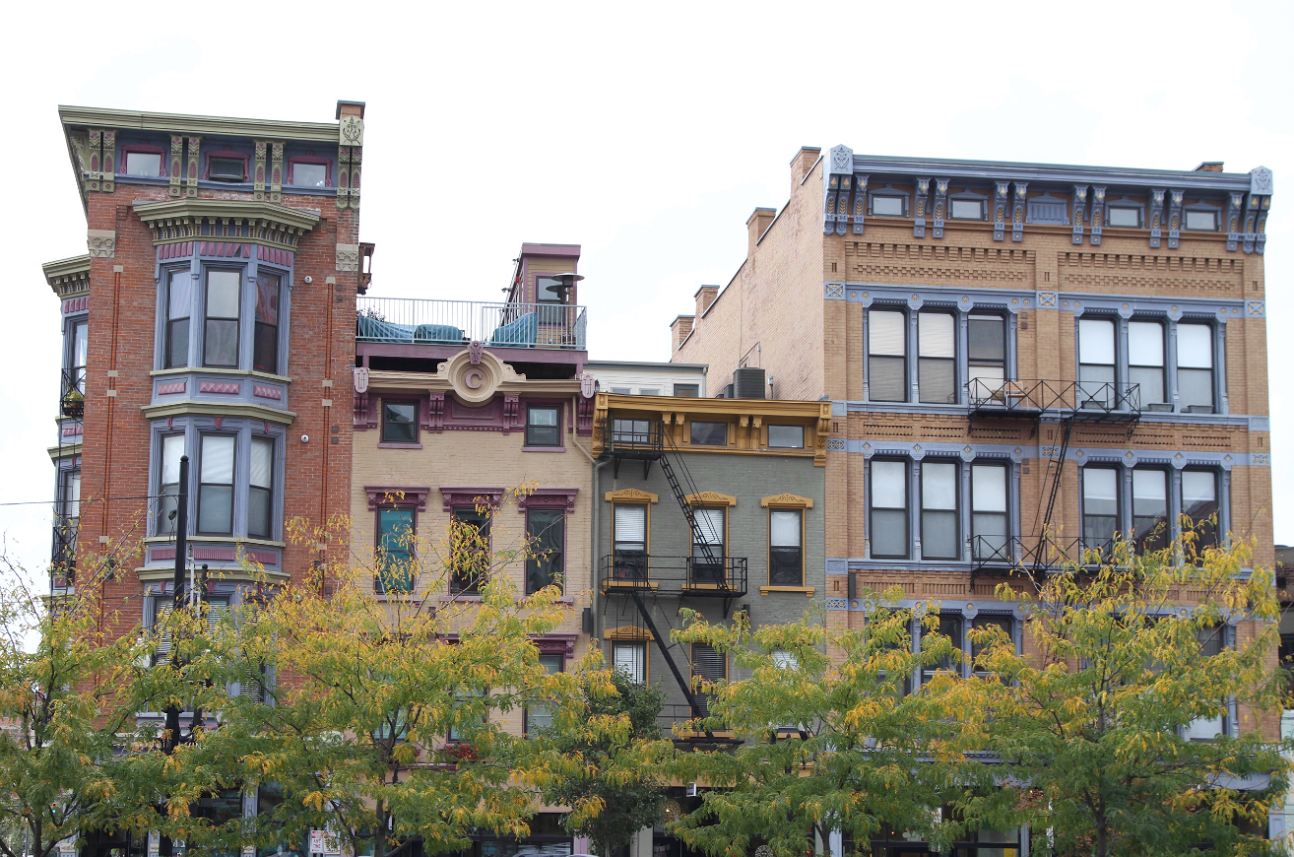
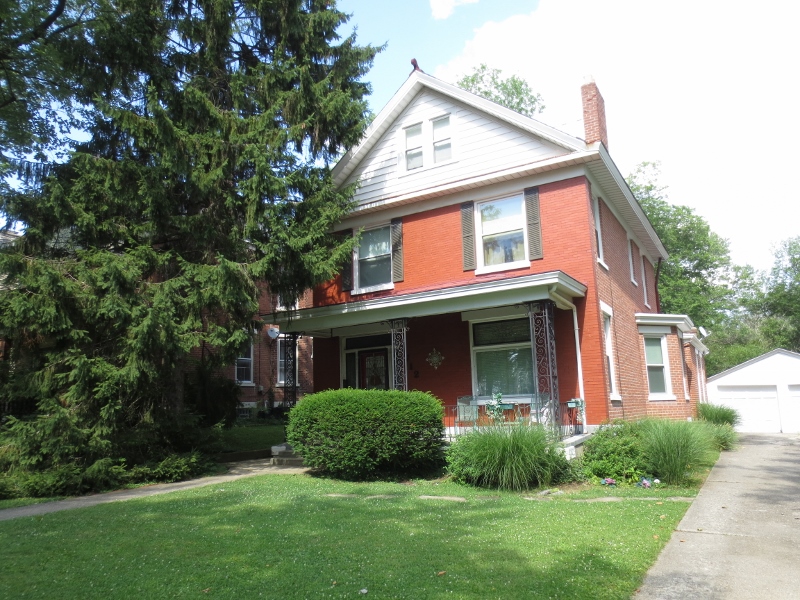
Here’s what’s happened to the housing stock in previously desirable post war suburbs. They’ve aged and were passed over in favor of new development farther out on the edge of town. The homes are out of fashion. They’re too small. They don’t have the right modern features. There are questions about the quality of the local schools. And there’s a general perception that the kinds of people who remain may not make good neighbors. These properties sell at significantly lower prices relative to the larger region. It’s often assumed that they’re unlikely to appreciate in value so they’re considered a poor investment.
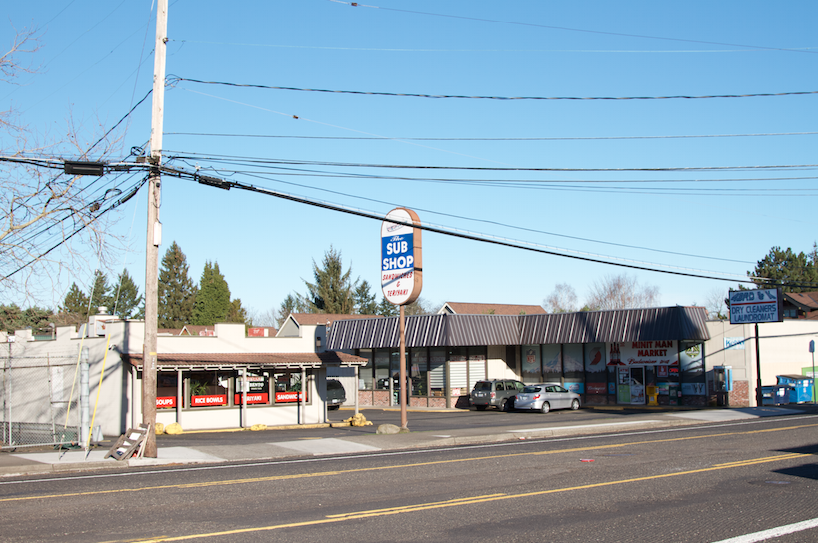
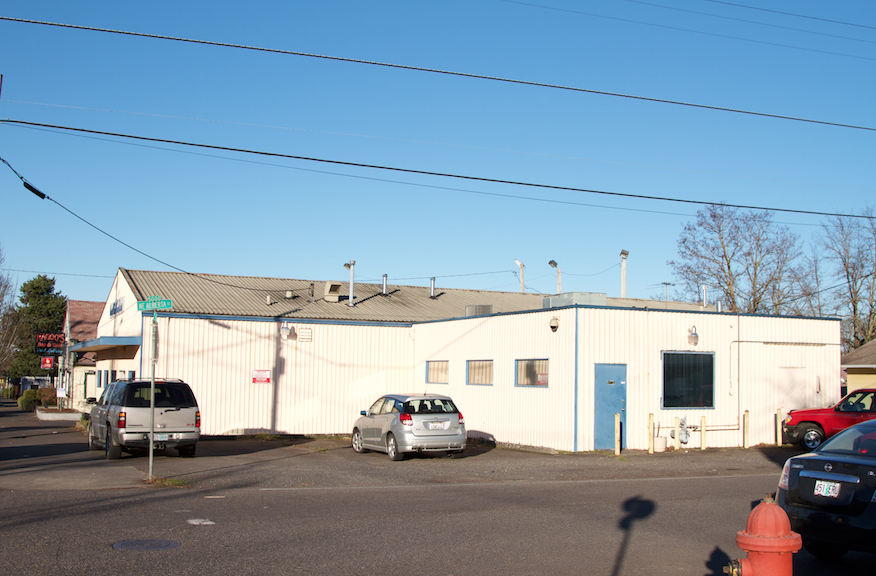
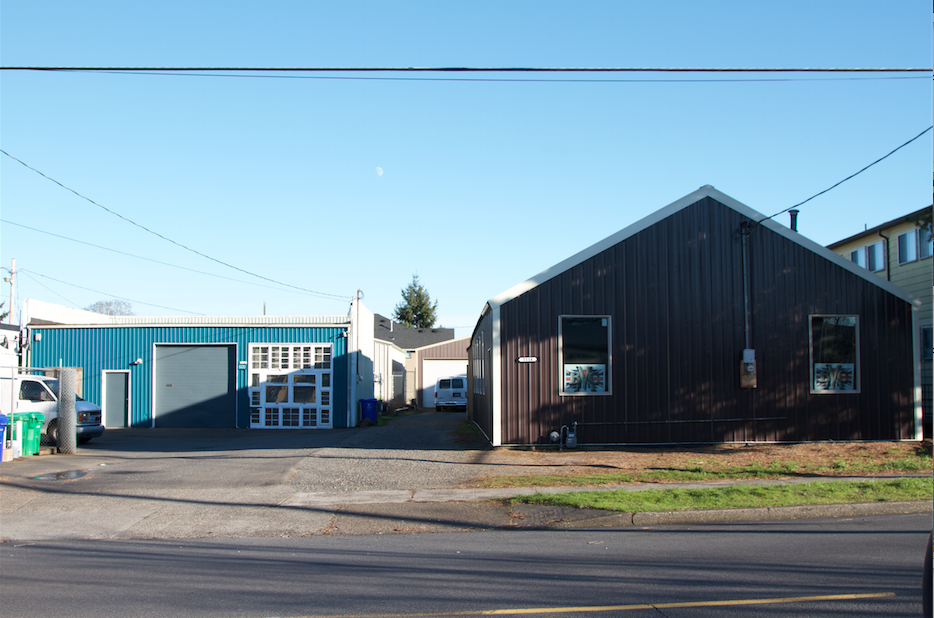
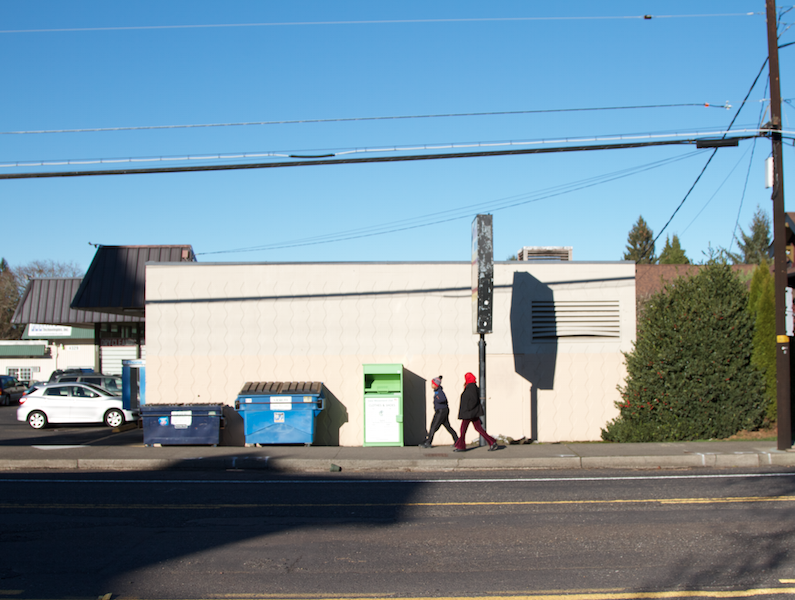
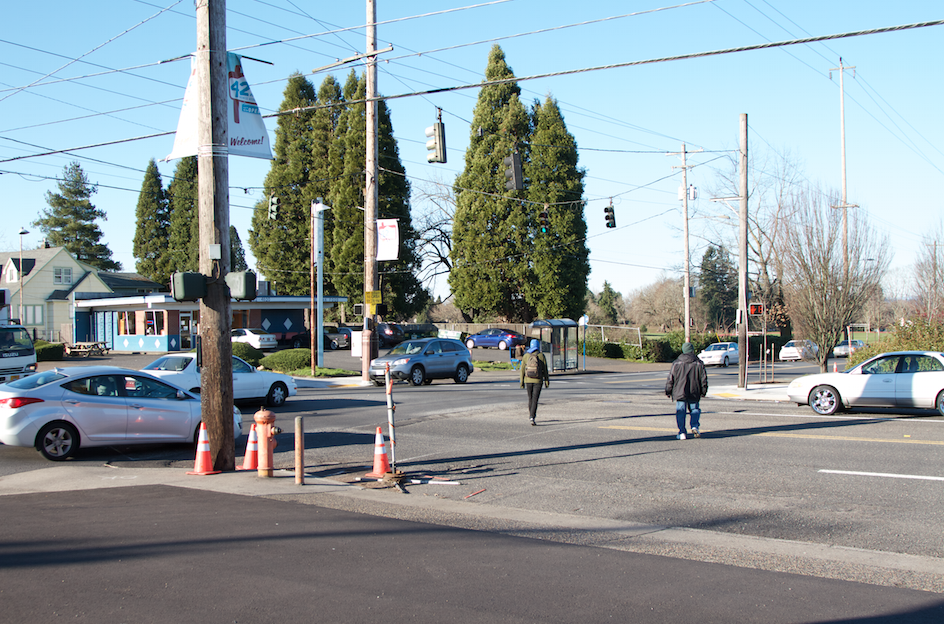
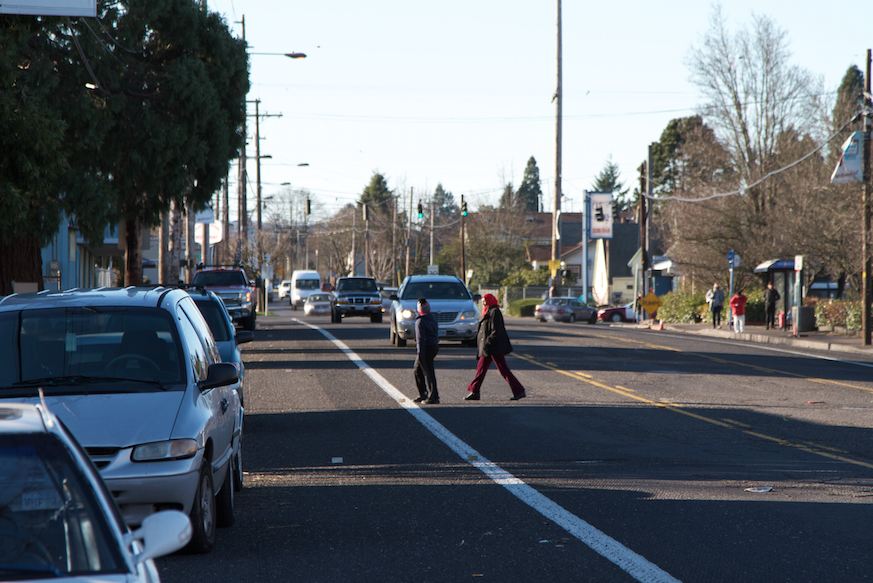
This is what the commercial building stock is like. Cheap disposable plywood and cinder block boxes and industrial sheds set behind a patch of asphalt parking lot. These photos happen to be of Portland, Oregon, but they could be from a thousand other places. They’re all the same. This actually looks a lot like where I grew up in New Jersey.
Sure, the sleek new Pearl District and Historic Pioneer Square are fashionable and urbane. But the vast majority of people will never live there. Most of Portland, like most of America, is sprawl. Forget what you’ve heard about urban growth boundaries, streetcars, and jack booted liberal thugs who make you live in a shoebox apartment and take away your car. The reality on the ground is that most of Portland is indistinguishable from everyplace else.
But here’s the fascinating thing to me – and the source of my recent epiphany about aging sprawl. I always assumed that these neighborhoods would all devolve into the new slums – and many certainly are doing that. Ferguson, Missouri anyone? But it doesn’t have to go that way. These forgotten suburban neighborhoods can just as easily be the new sweet spots for small enterprise and a renewed middle class.
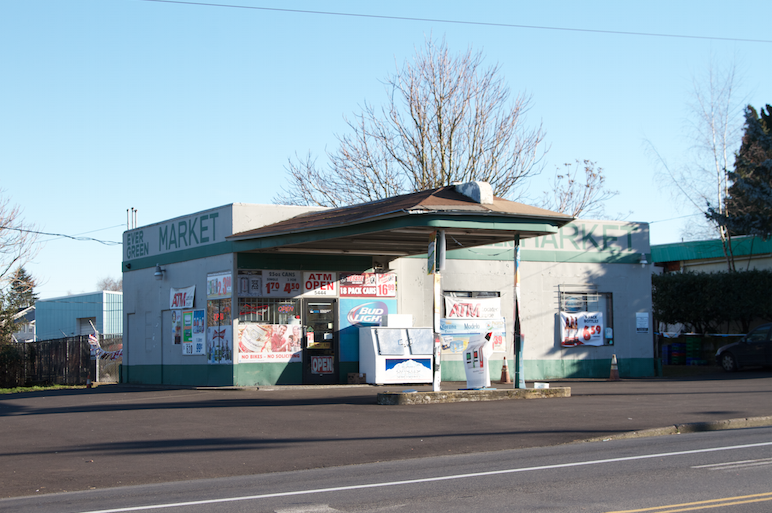
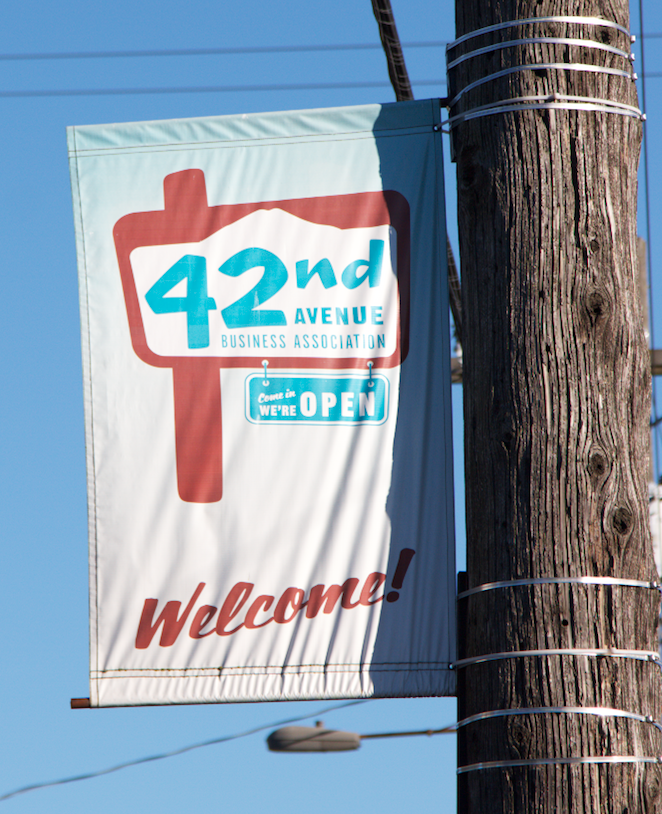
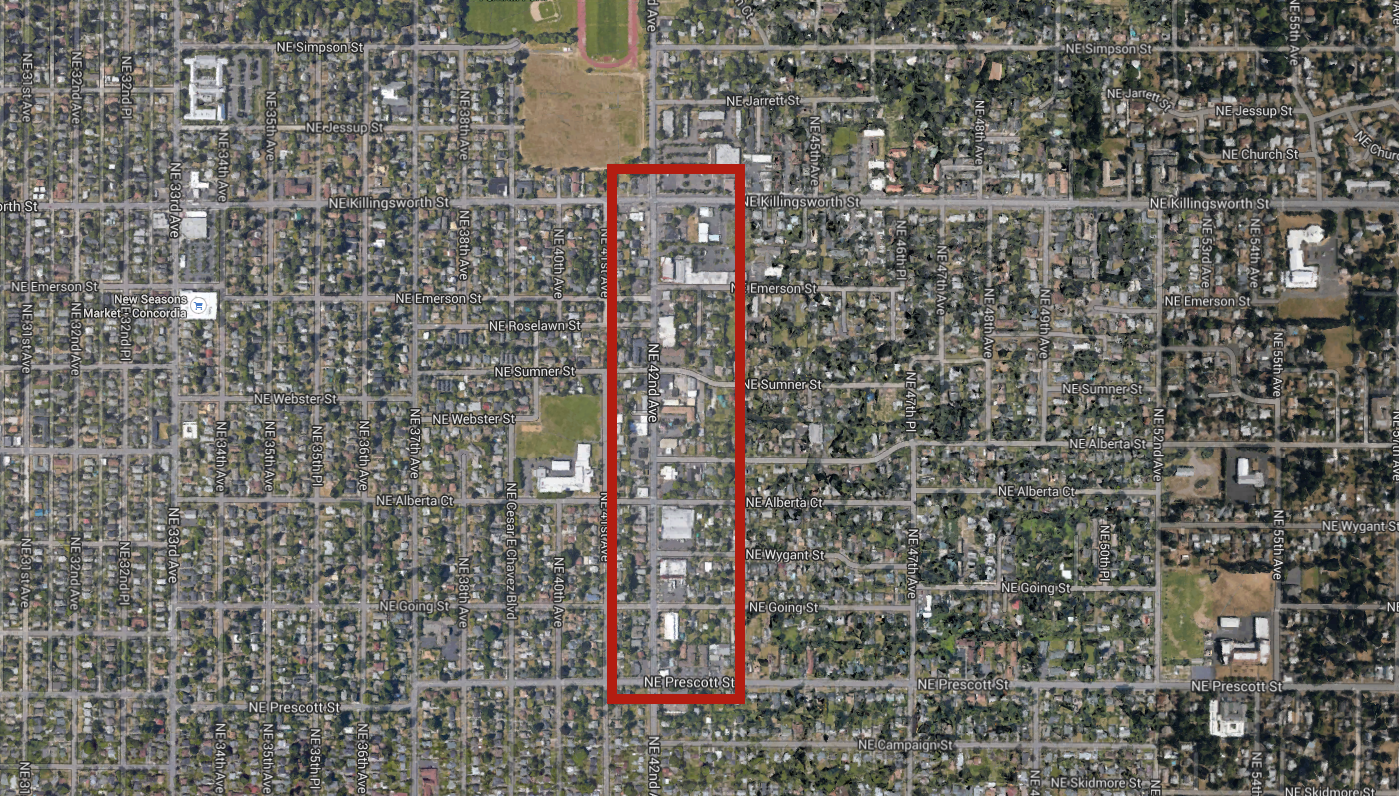
I stumbled on the intersection of 42nd Avenue and Killingsworth (see all photos above) and thought, “What a crap hole.” But then I started to poke around for a couple of weeks. There’s more going on than immediately meets the eye.
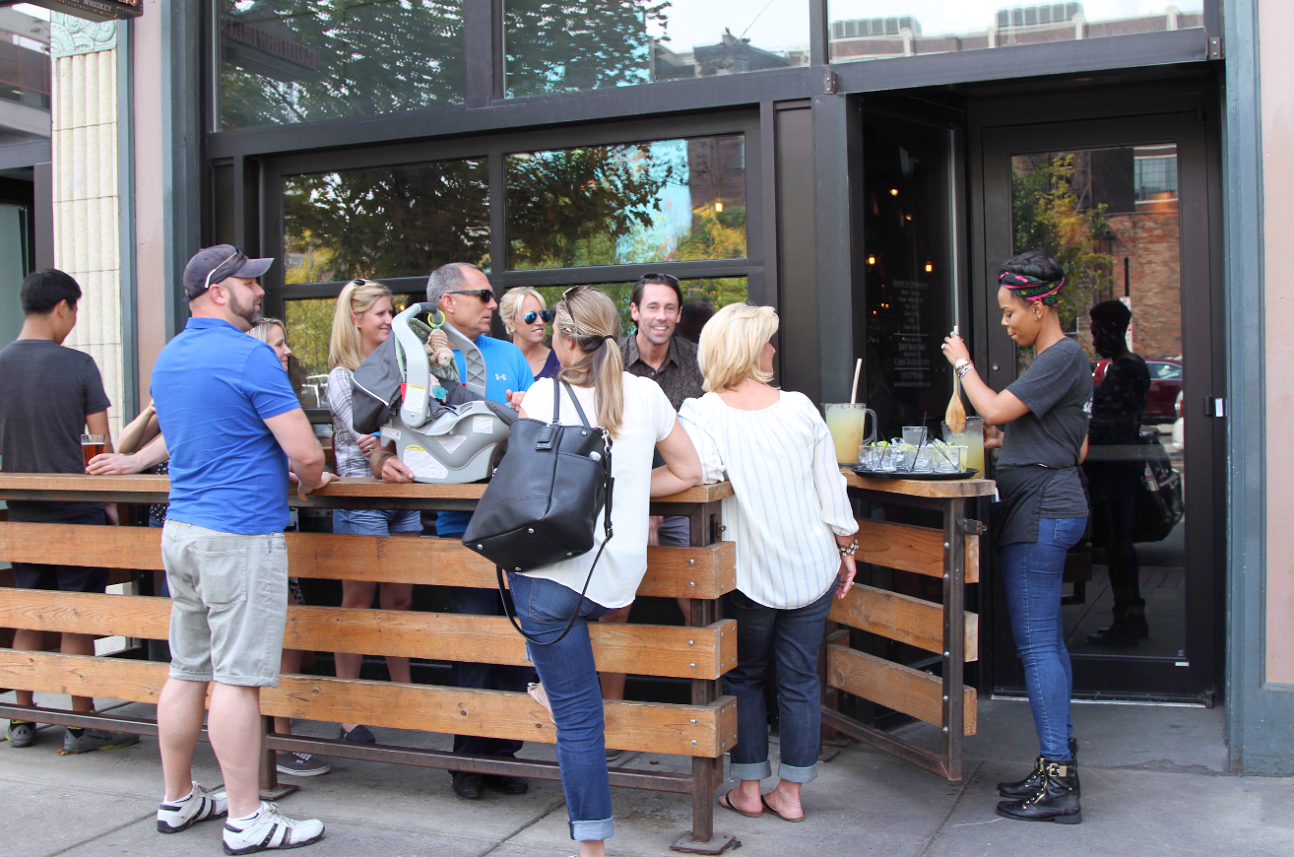
Here’s the deal. In the 1970’s and 80’s the cheapest real estate was in America’s abandoned downtowns and industrial zones. They were colonized by people looking for freedom – economic freedom from high rents and mortgages, as well as regulatory freedom to do as they wished without the Upright Citizen’s Brigade shutting them down. Now those places have all been picked over by high end developers and transformed into luxury “lifestyle” centers. The same is true of many close-in historic streetcar suburbs like Portland’s Alberta Arts District here. So if you either can’t afford, or simply don’t want, the premium city condo or the deluxe outer suburb McMansion… where do you go to do your own thing on a tight budget?
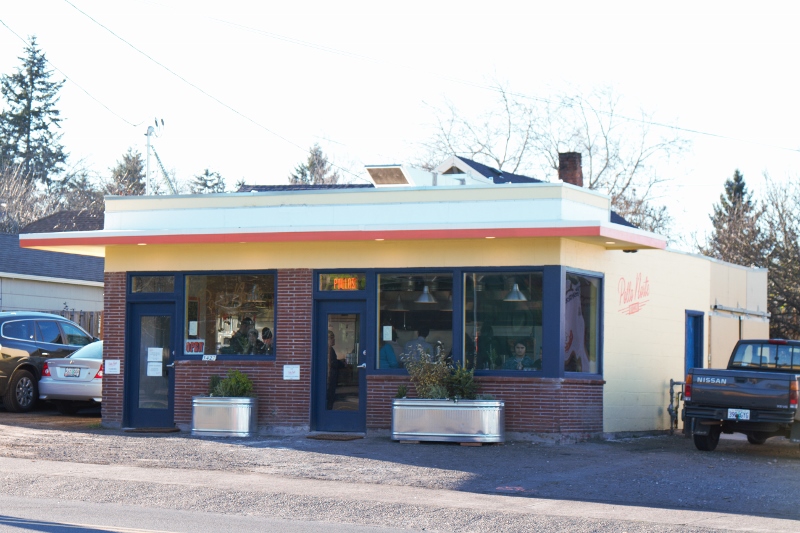
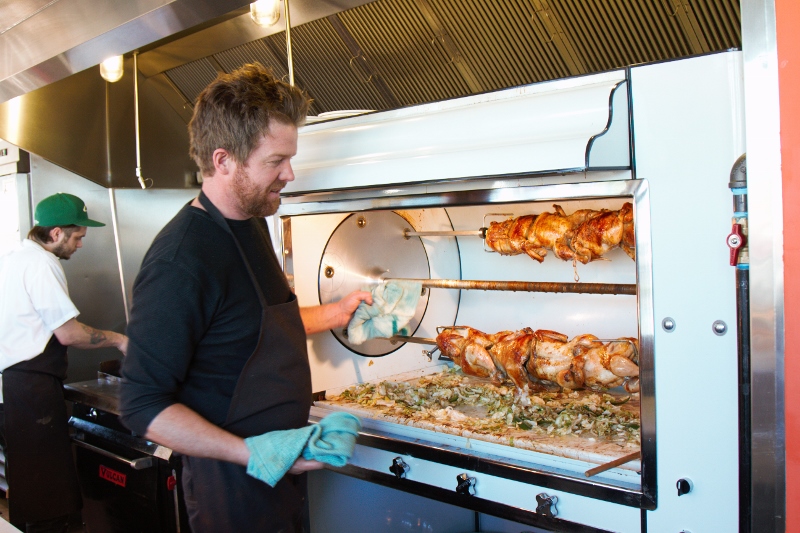
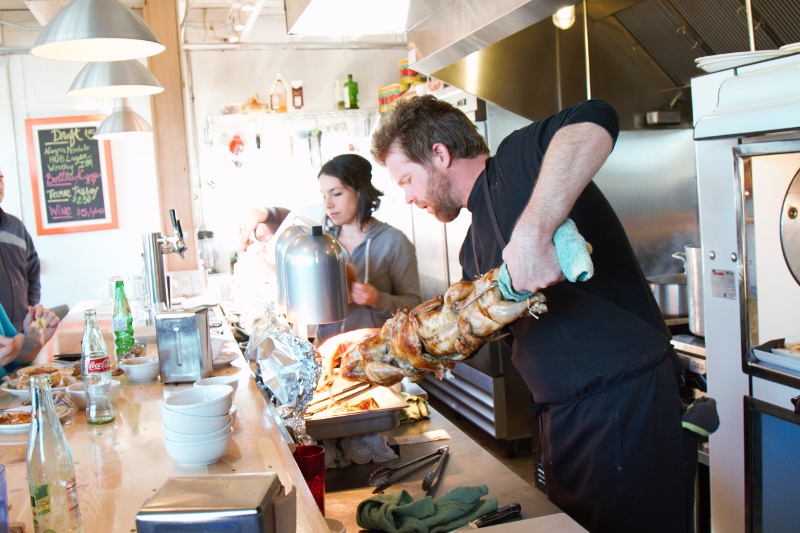
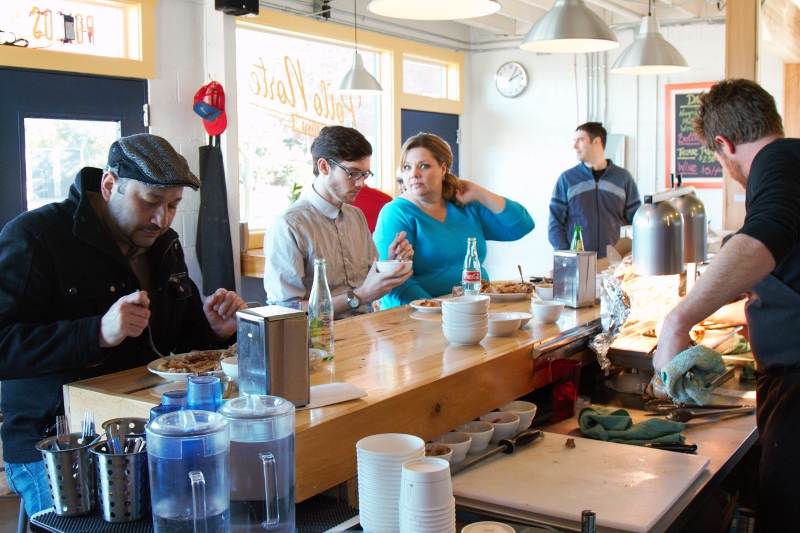
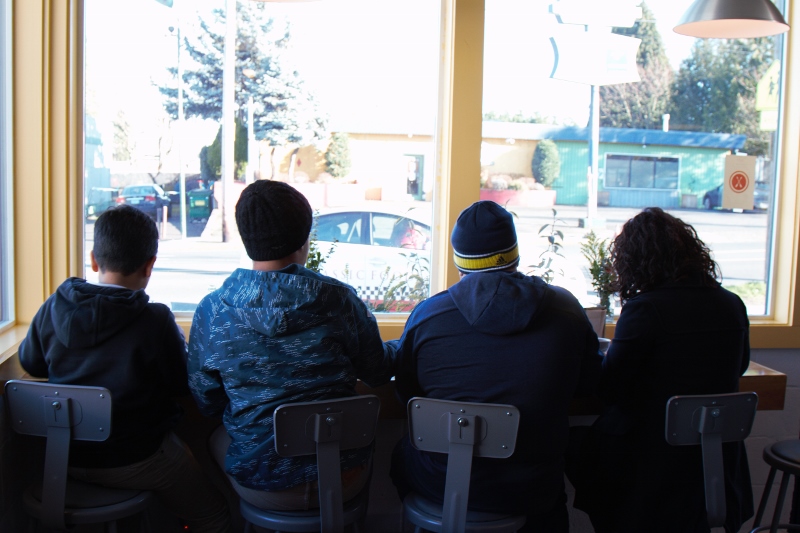
This is Pollo Norte here on a miserable intersection where two busy roads collide. A friend brought me here for take away dinner one night and the food was simple, but spectacularly good and it was served by charming people. We arrived at 6:30 on a Tuesday and the place was packed. We were lucky to get the last whole chicken and some side dishes just as they sold out. The place is open until ten but they were overwhelmed by many more customers than they expected. This was their first month in business and they couldn’t keep up with demand. Aside from the great food, the customers all seemed to know each other and were in good spirits even though there wasn’t enough food to go around. They were celebrating the success of a great new local spot. Good beer and companionship were their consolation prizes. Now the owners need to ramp up production and work with their local suppliers to obtain more of the organic free range ingredients in keeping with their mission statement about quality and regional sustainability. This is a good problem for a new business to have.
 Google
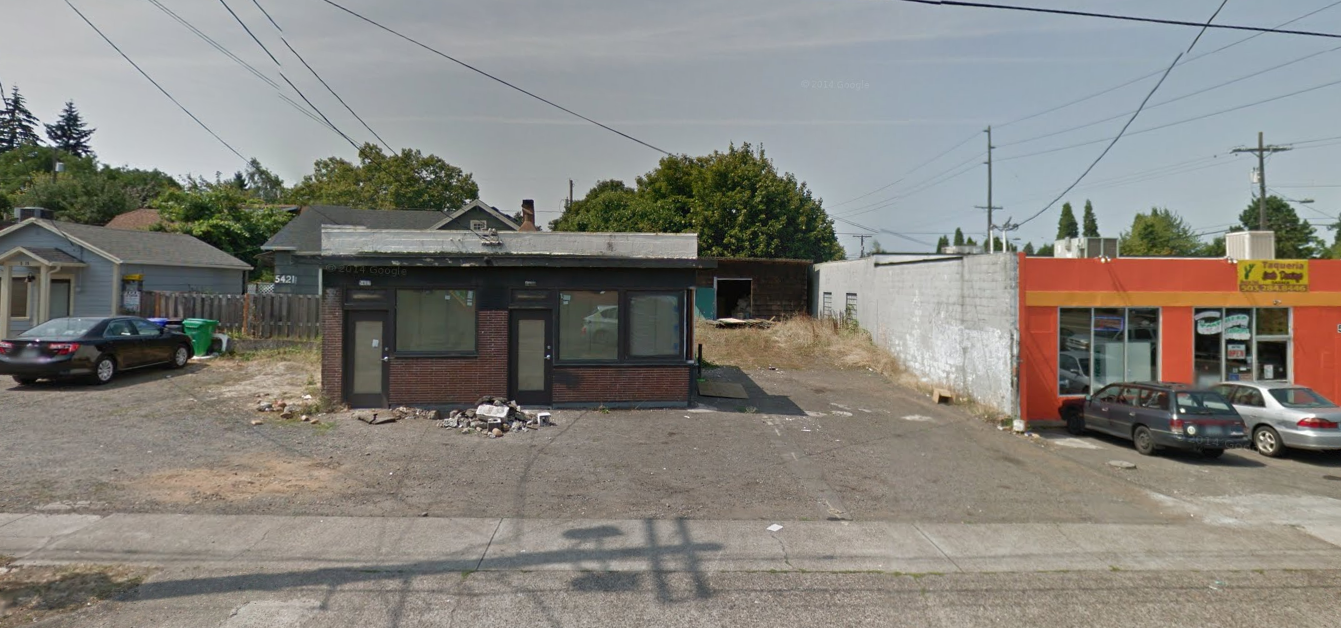
By the way, I pulled this image off Google Street View. This is what the building looked like before the Pollo Norte folks scrubbed it clean, gave it some paint, and infused it with new life. It’s still a piece of crap concrete block bunker, but these buildings can be reinvented to good purpose with the right attitude and community support.
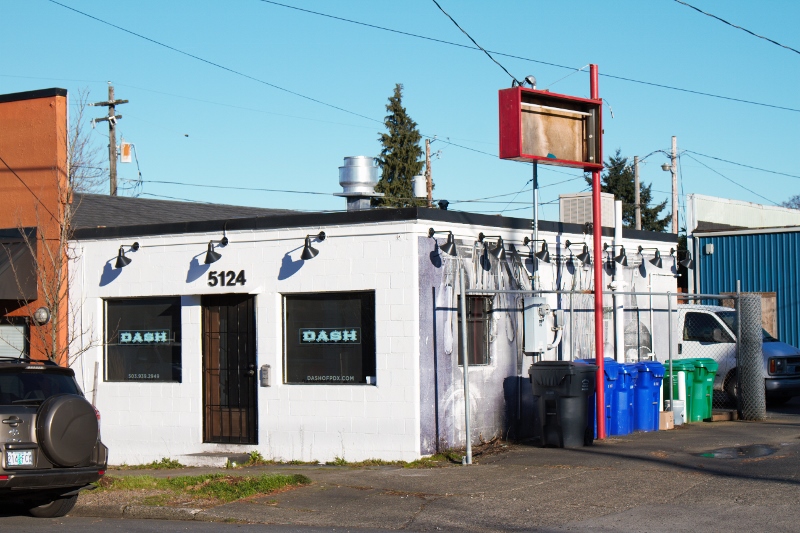
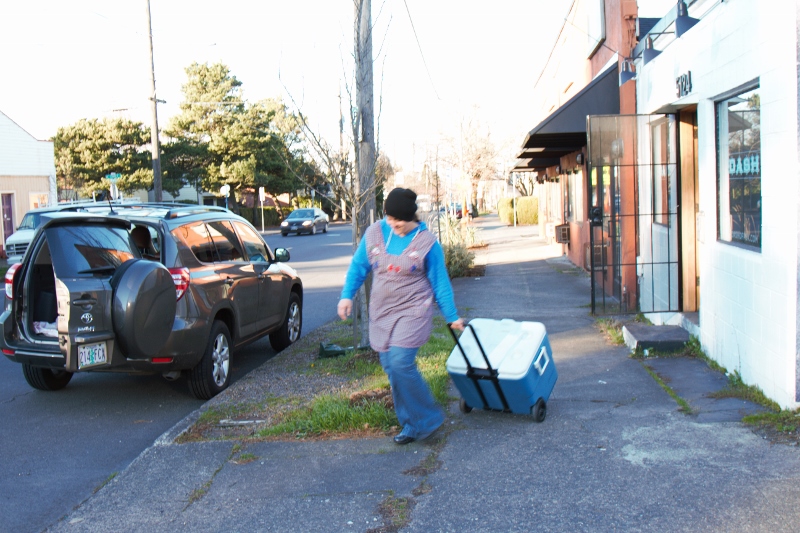
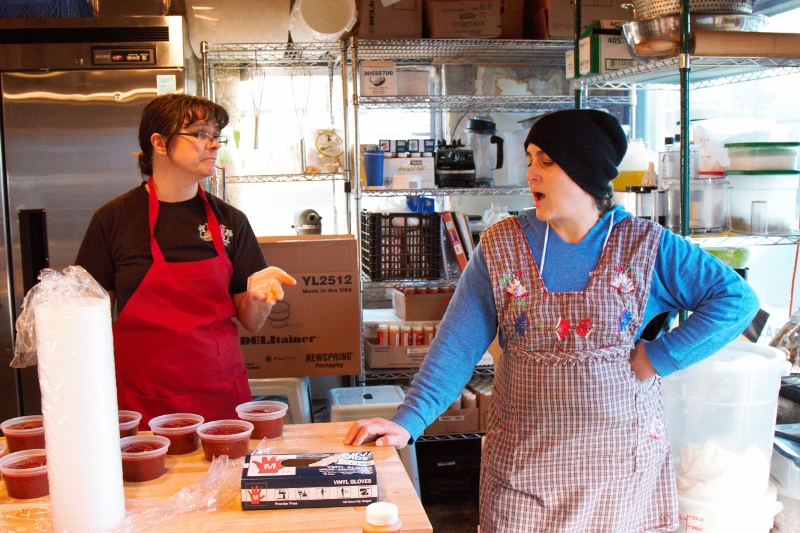

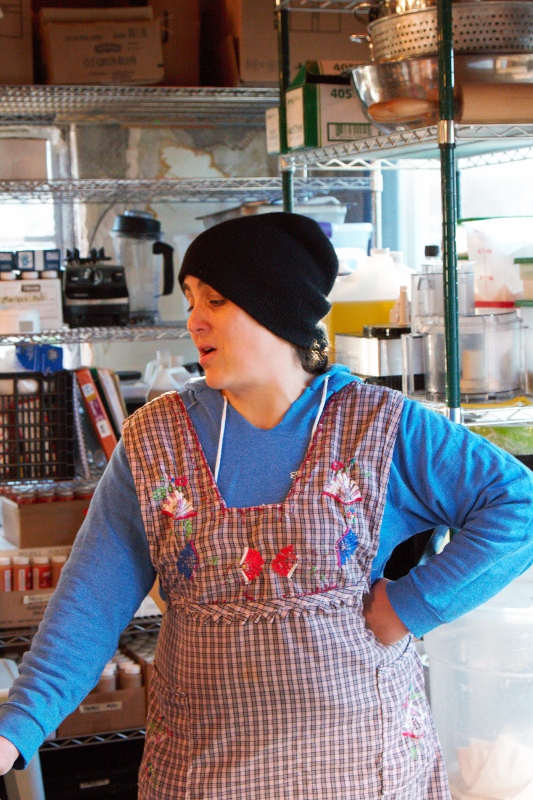
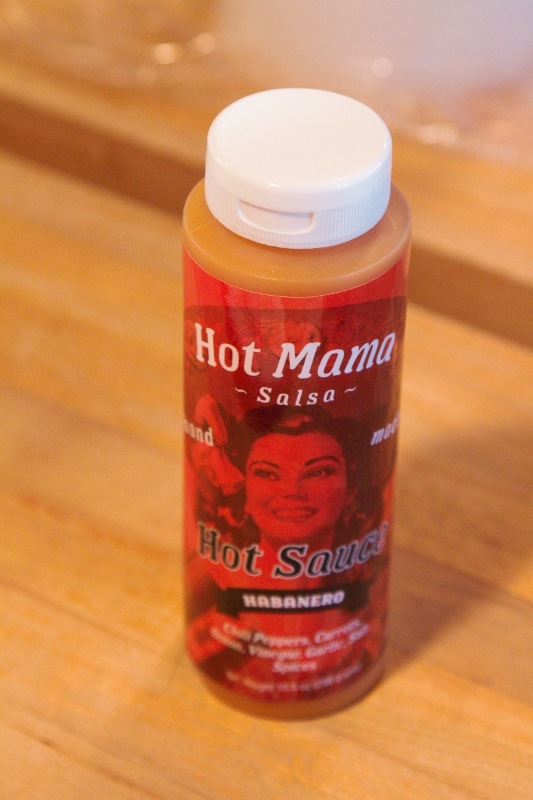
Here’s another tiny concrete bunker a few blocks down the road. It’s owned by a woman who runs a 550 square foot commercial kitchen called Dash here. She rents out space to a variety of small scale producers who need an inspected facility in order to comply with health codes. When I dropped in I was able to speak with Nikki Guerrero as she was readying her Hot Mamma Salsa for market in local shops. here. Nikki started out selling small batches of salsa at farmers markets and now has expanded to several local grocers. She’s successful enough to support herself with the salsa. I don’t think Dash was intentionally organized as an incubator per se, but it serves as the next step up after people are ready to graduate from home cooking (Oregon has a cottage food law here) and street vending. This is not only profitable for the woman who owns the building and cost-effective for people who rent space, but it also cultivates community among various small business people as they share the space. The beauty of this business model is that any cheap ugly building in any uninspiring location can work so long as zoning and NIMBYs don’t get in the way. When your neighbors are industrial sheds and no name convenience stores you don’t get any push back.
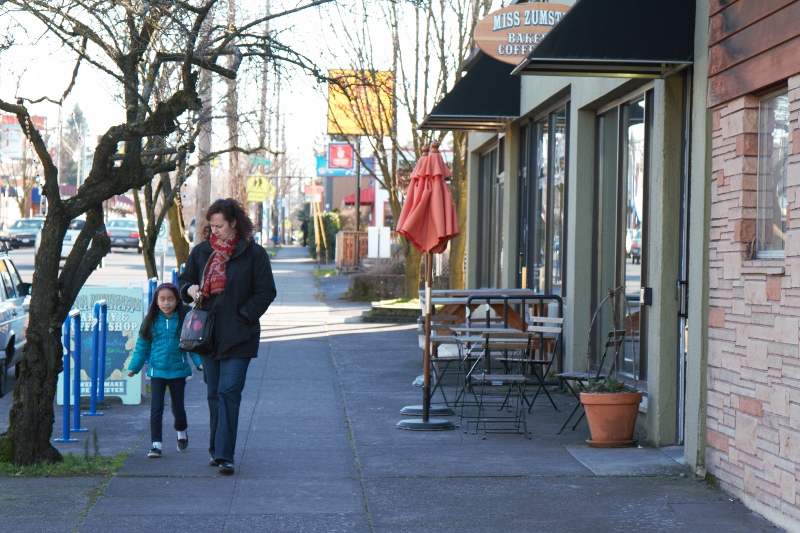
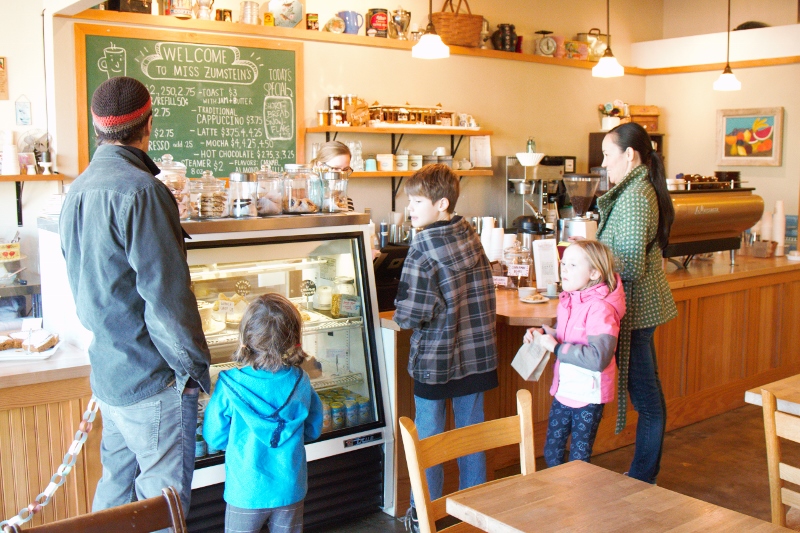
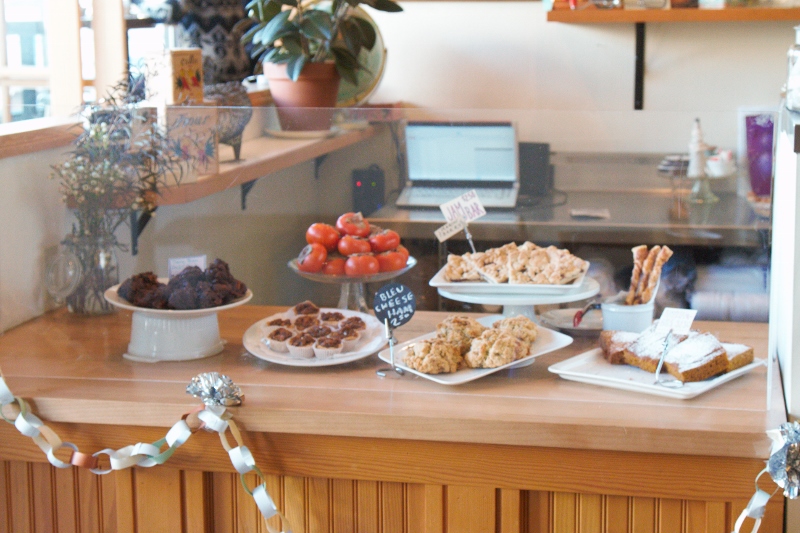

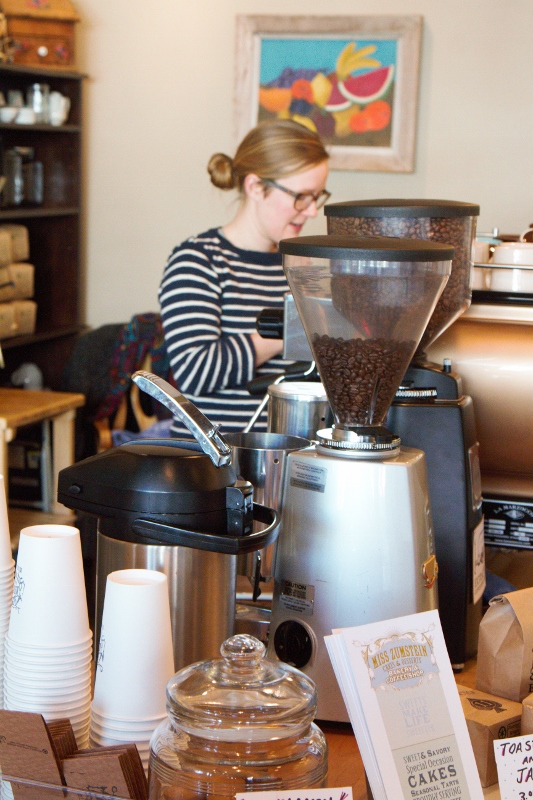

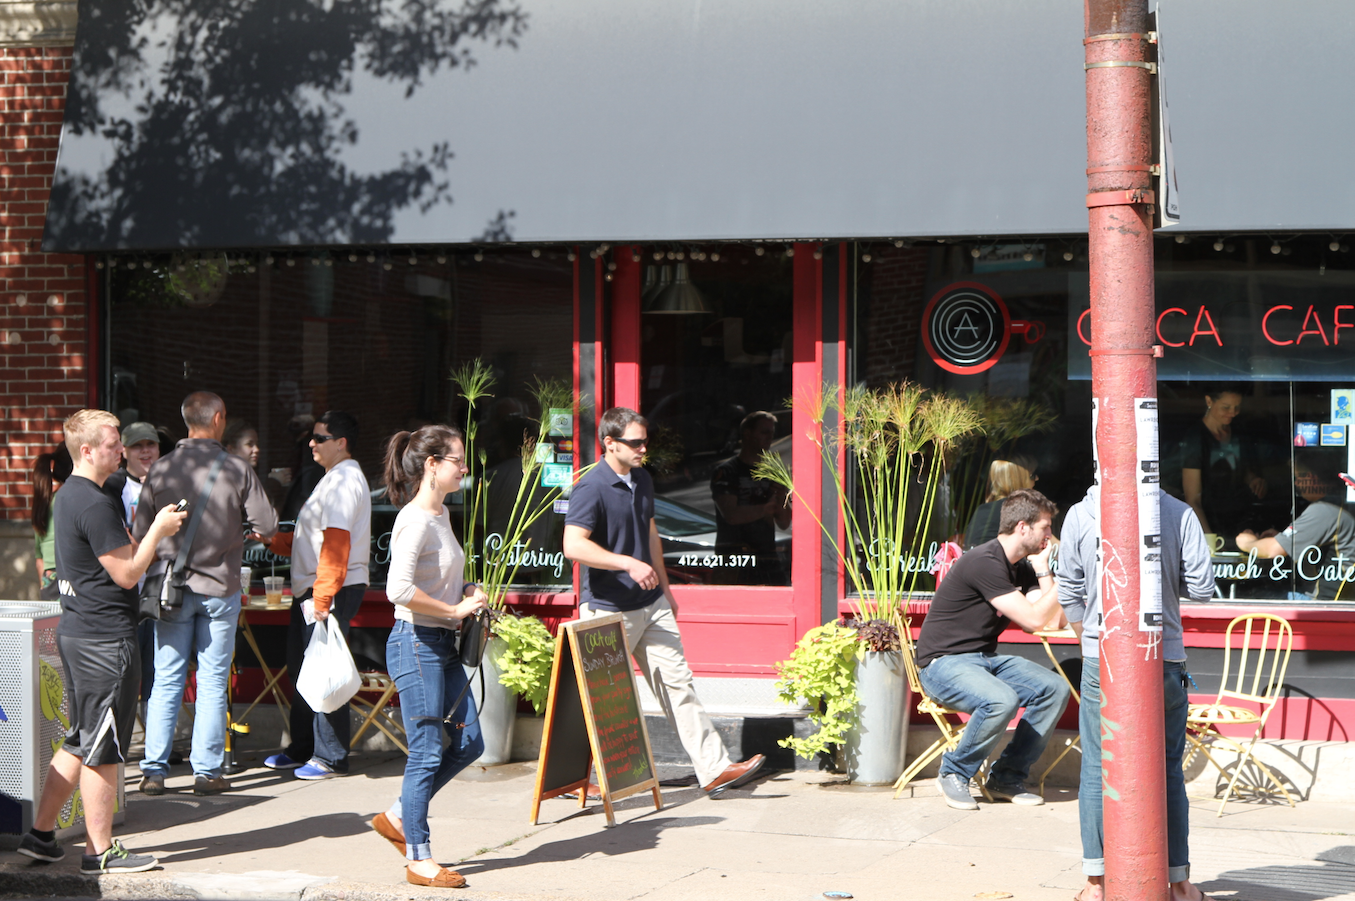
Miss Zumstein’s Bakery across the street here is owned by Anja, a native Portlander who finds it difficult to afford property in the trendy parts of town now that the city has become much more expensive than in her girlhood. She recently opened her bakery/cafe on 42nd Ave. because so many of her friends have recently colonized the neighborhood. Price has pushed people into places to live that they wouldn’t necessarily have chosen otherwise. Now the big task at hand is how to make the ugly traffic corridor a proper walkable Main Street on a tight budget. She said the new Pollo Norte is a great indication of the kinds of small independent businesses she’s working with to carve out a new business zone in an otherwise not-so-great location. Anja was very supportive of the people at Dash (Hot Mama Salsa et al) and was thrilled that a new bicycle shop opened up nearby. Cheap ugly space and lots of enthusiastic like-minded people are their primary resources.

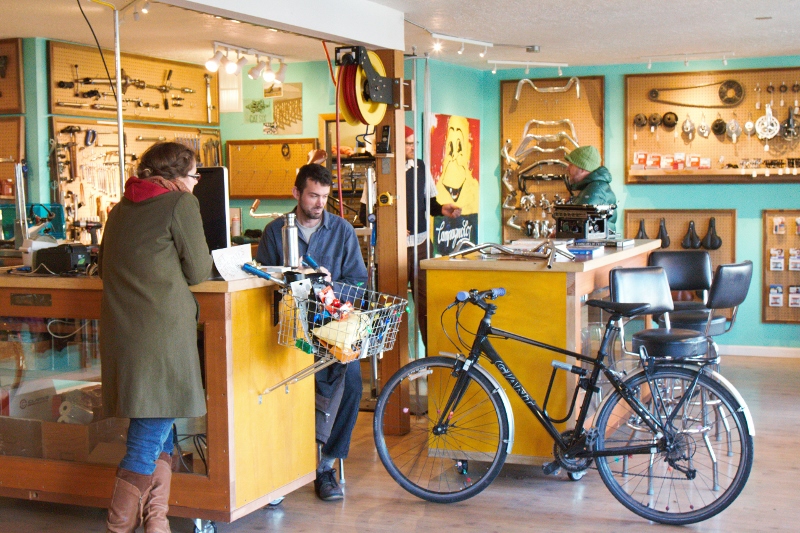
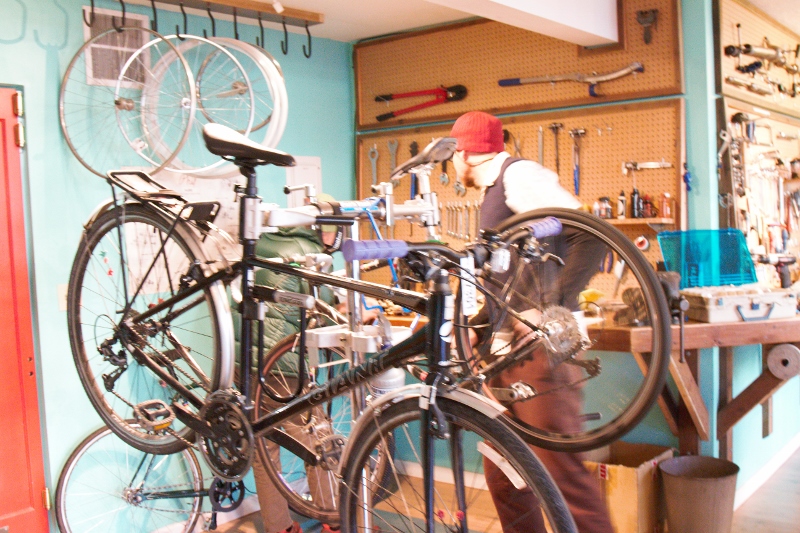
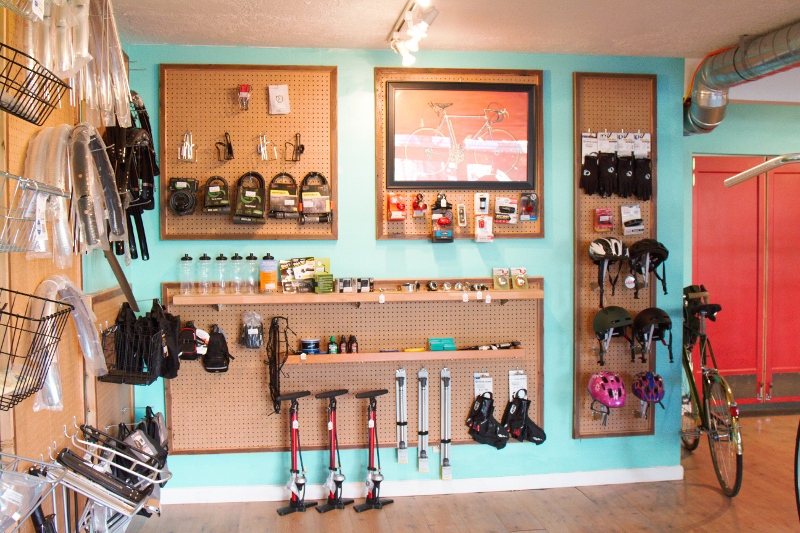
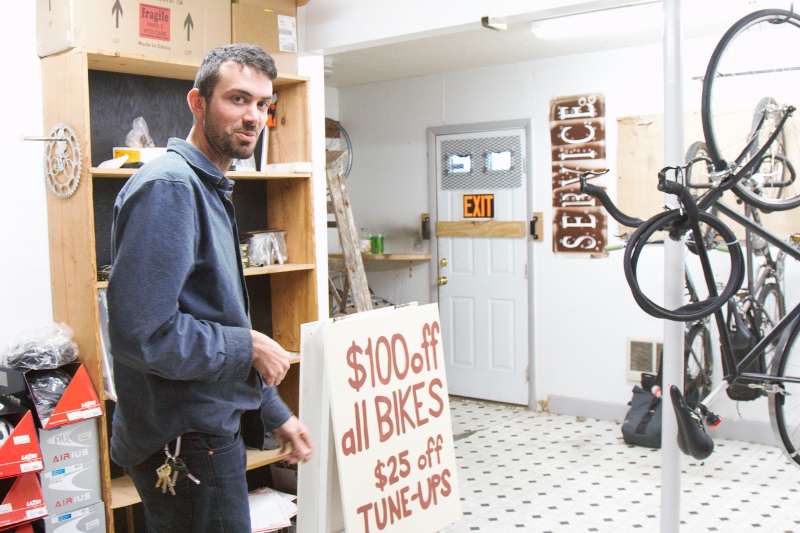
This is Cat Six Bikes here. Two bike guys just opened up shop seven months ago. They were working for someone else in a more established neighborhood and finally decided to do their own thing. There are so many cyclists in Portland that if there’s a three mile stretch without a bike shop it’s actually a problem for a lot of people who need parts and service. They identified this location, realized it was more affordable than other more fashionable parts of town, and decided to fill the need.
They almost rented the building that the Pollo Norte people are in now, but the current location was ultimately a better deal. The dentist who owns the building and runs his practice next door provided a deep discount on the rent because he lives in the immediate neighborhood and wanted to help establish more independent businesses in the area. The alternative probably would have been a check cashing place or a cell phone outlet. The guys were able to pull together their business and populate their initial stock and equipment for $10,000 which they had in savings. There was no need for a loan. They’re both handy and were able to do the carpentry and interior work for the shop themselves.
 Google
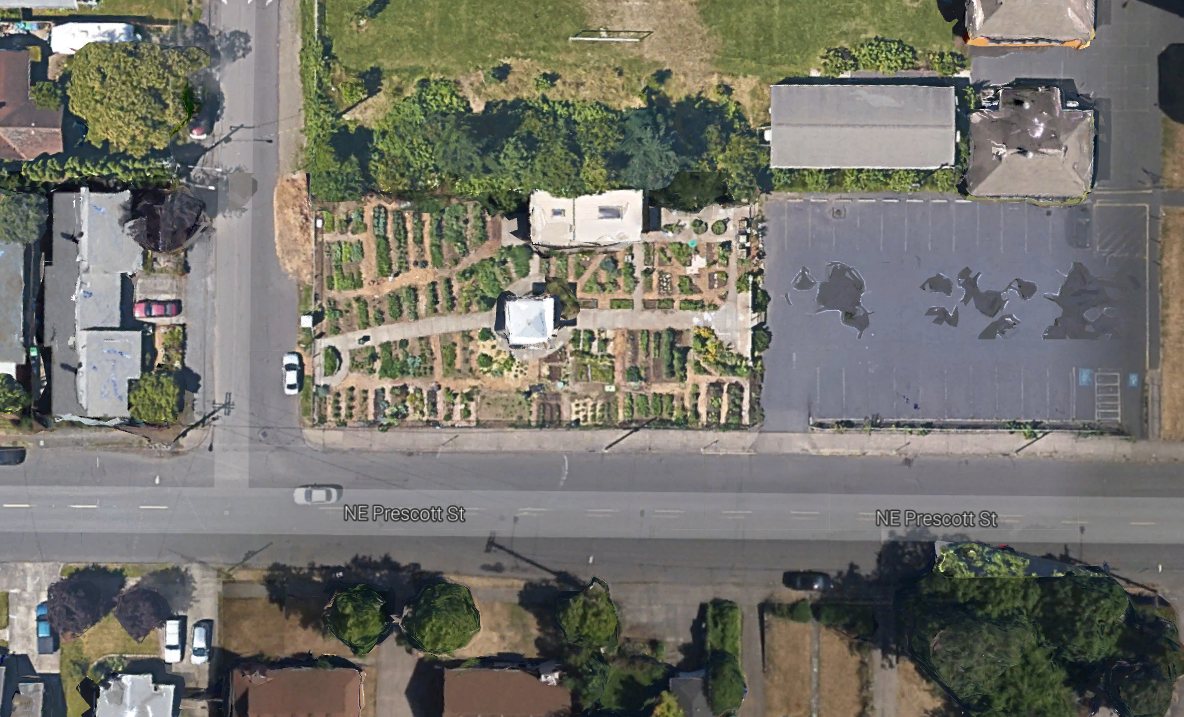 Google
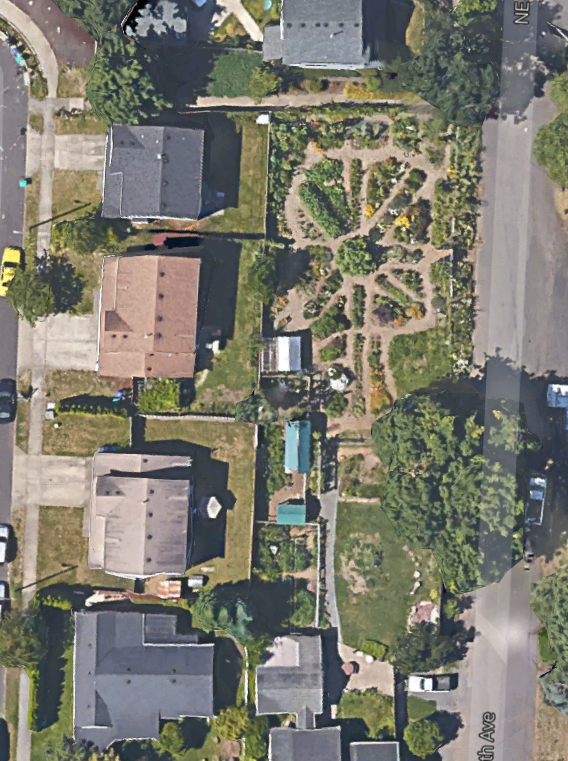
Google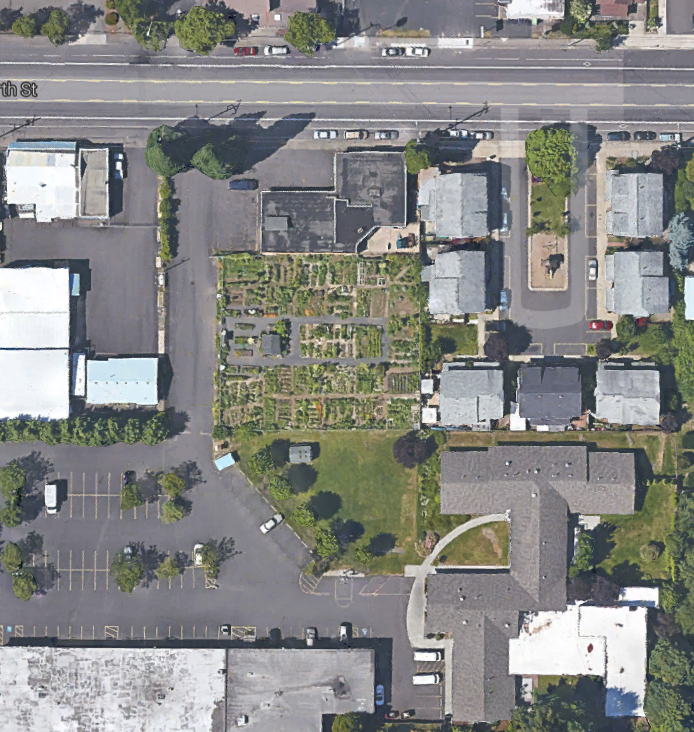 Google
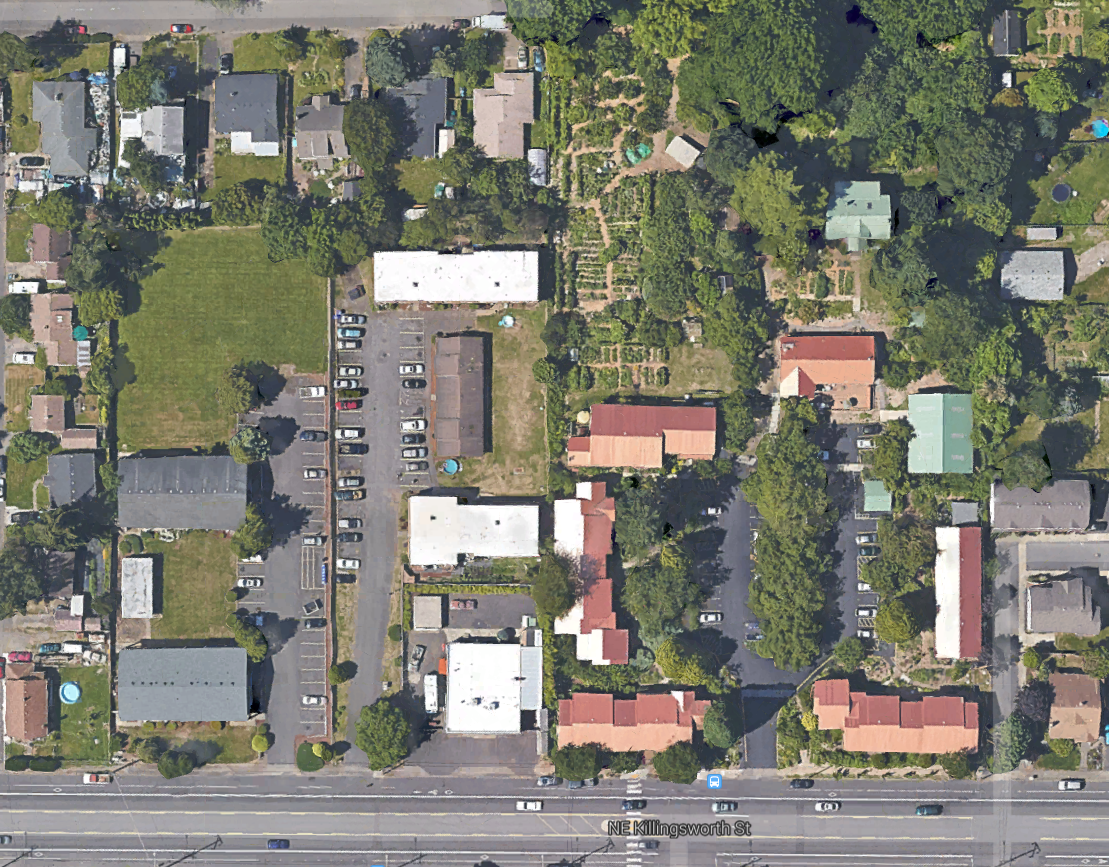 Google
 Google
 Google
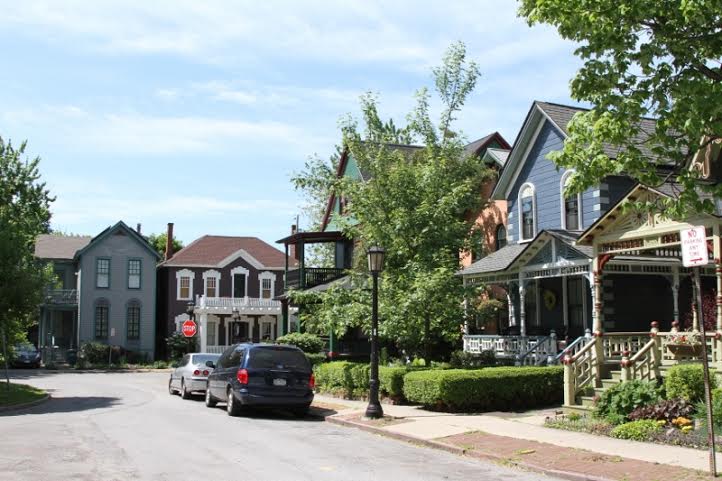
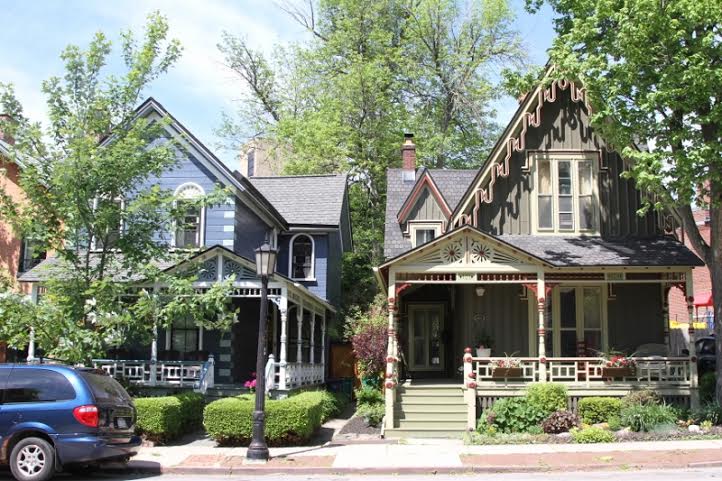
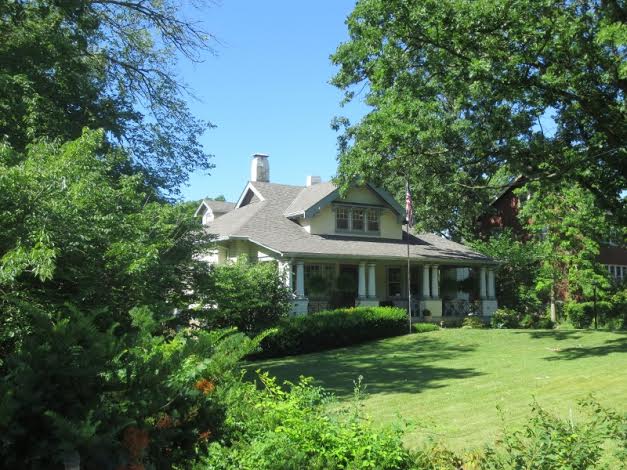
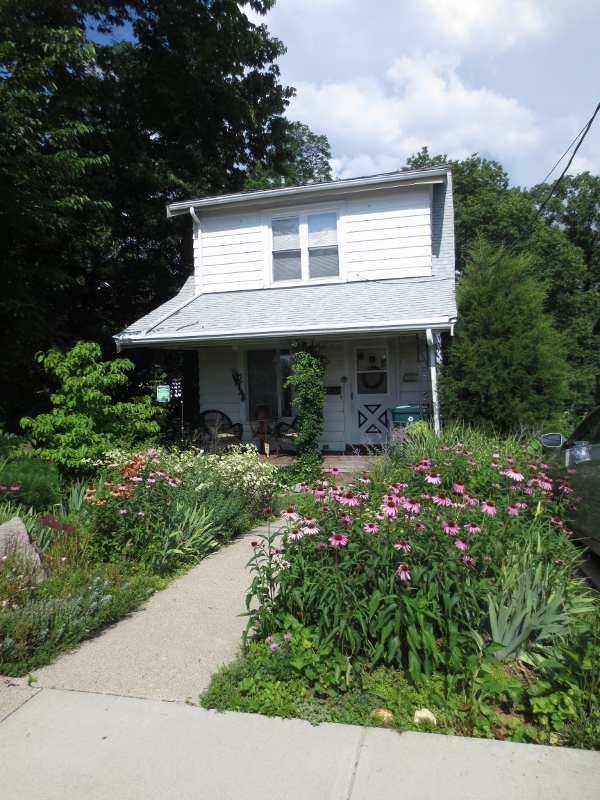
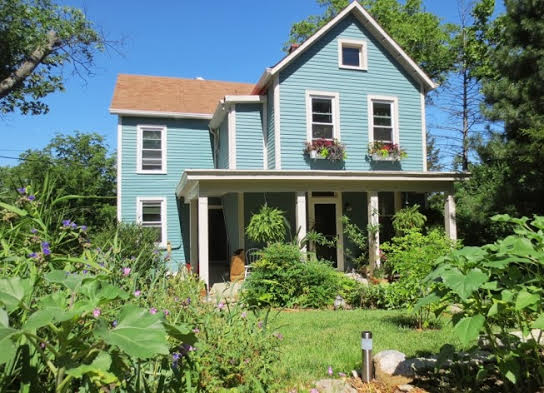
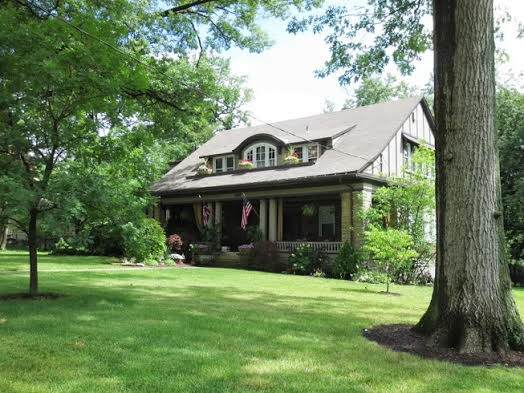
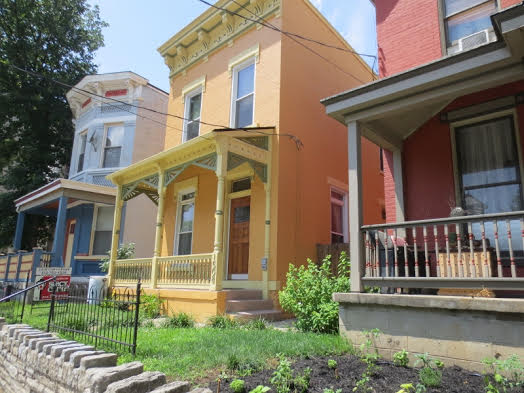
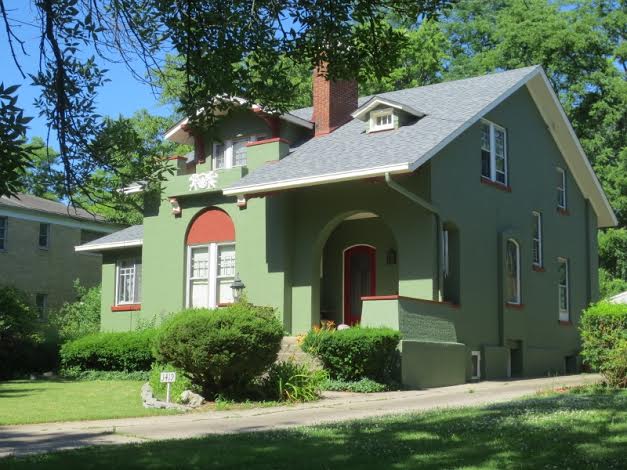
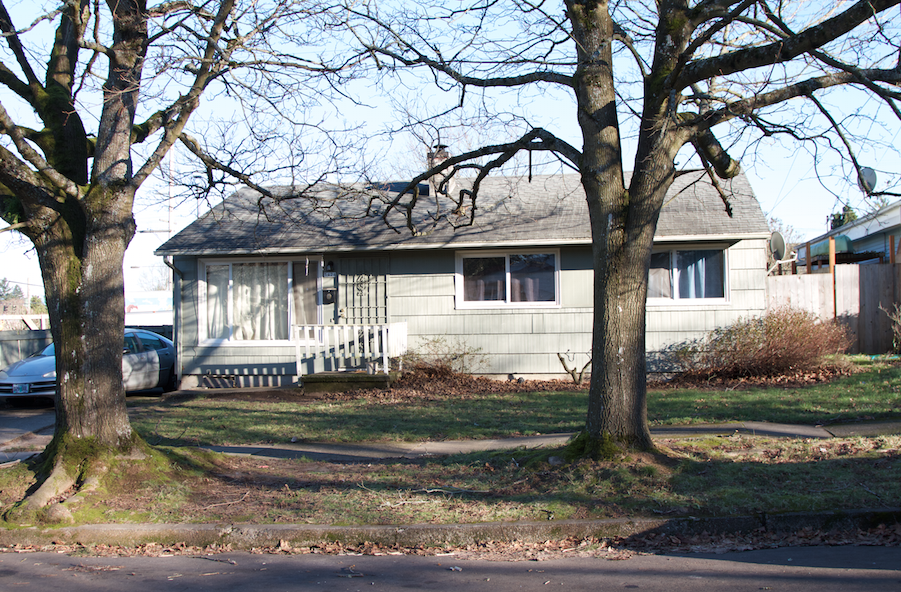
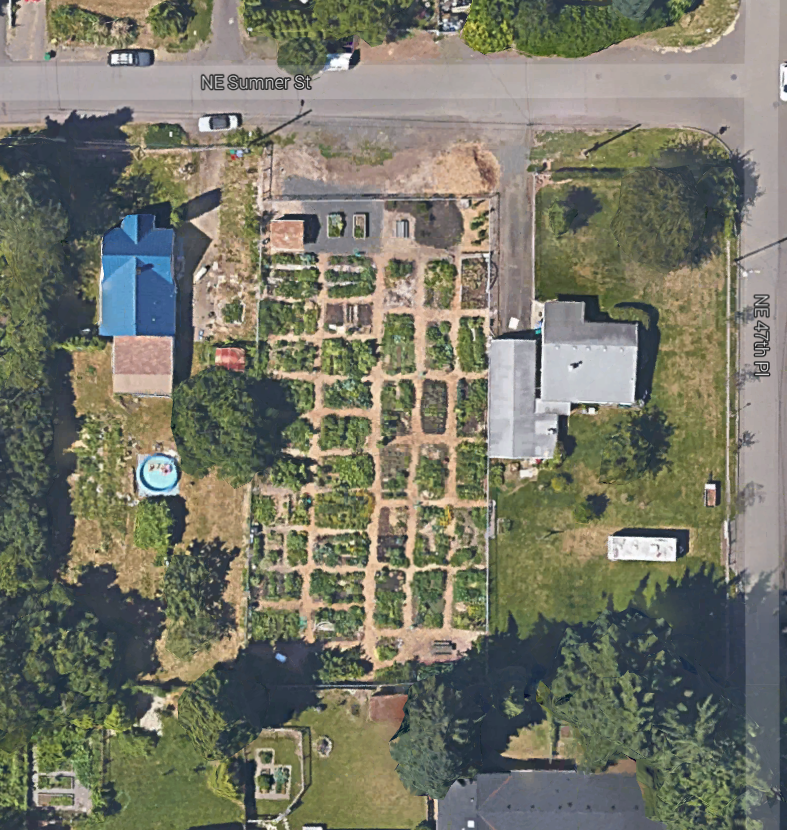
But here’s the other thing they mentioned that got me exploring the rest of the neighborhood. The guys share a house – one lives with his girlfriend upstairs and the other lives downstairs. The house is nearby in the Cully neighborhood where little post war homes often have pretty large lots. Many neighbors do varying degrees of urban agriculture – some for a livelihood. This is absolutely not an option in the city center.
Of course they ride their bikes to work since things are relatively close compared to the far more disbursed newer suburbs far from the downtown core. They were confident that over time they would be able to convince the city to implement road diets that would calm car traffic and make it safer and more pleasant to walk and ride bikes in the area. The primary factor in their favor is that highway expansion and car-oriented improvements are fantastically expensive, while bike infrastructure is ridiculously cheap. They also decided that what the neighborhood lacks in big city urban amenities it makes up for in gardening and door-to-door domestic community as well as significantly lower cost. Many of their friends had already moved to the area so they weren’t alone.

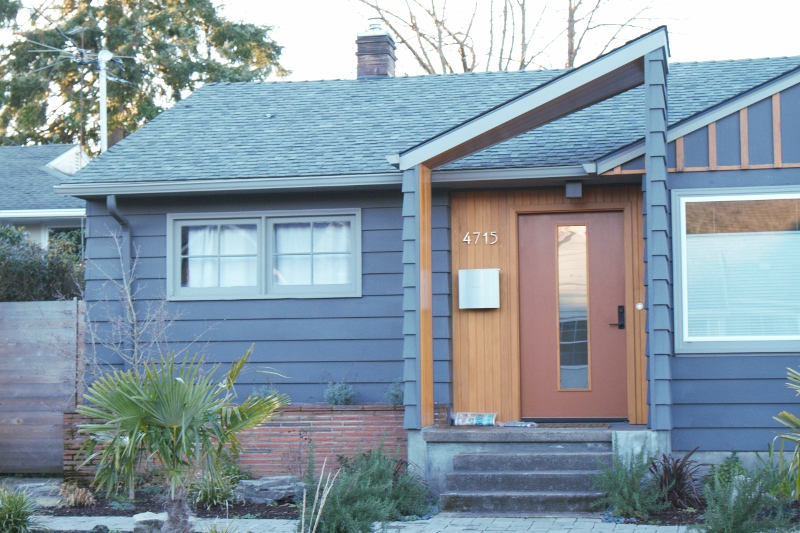
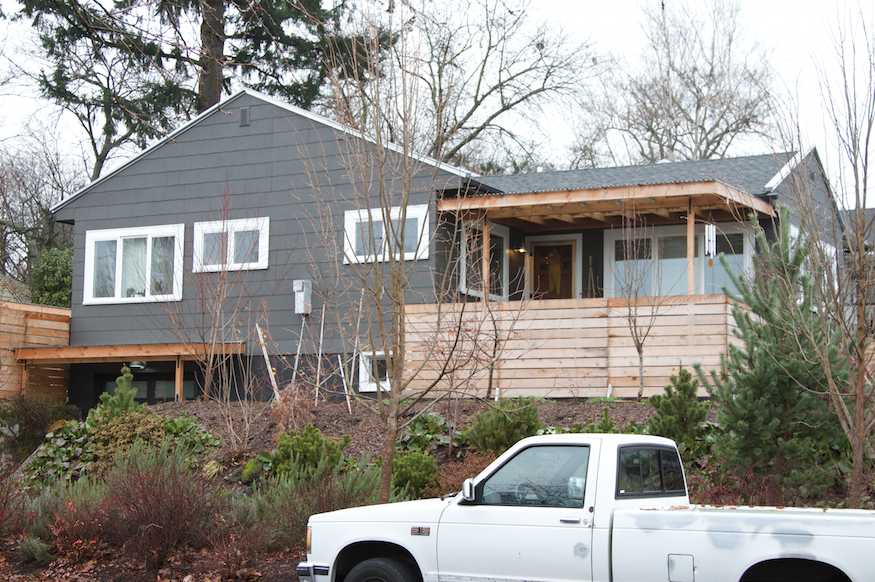
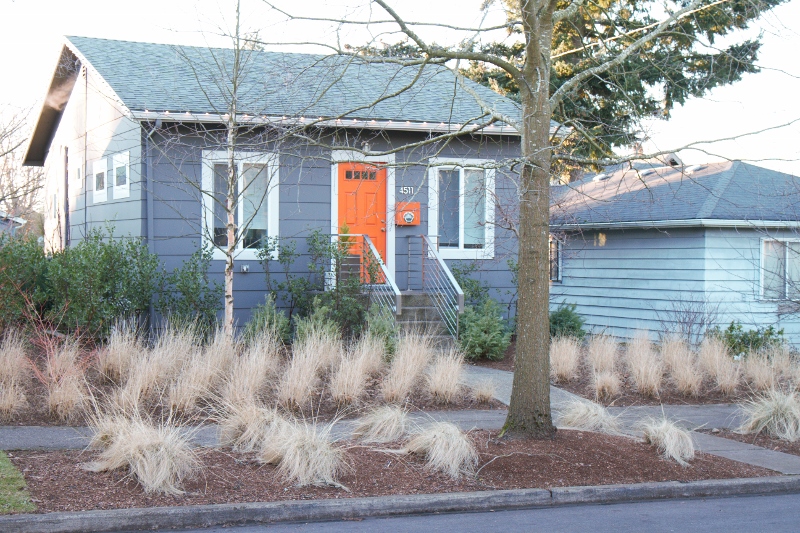
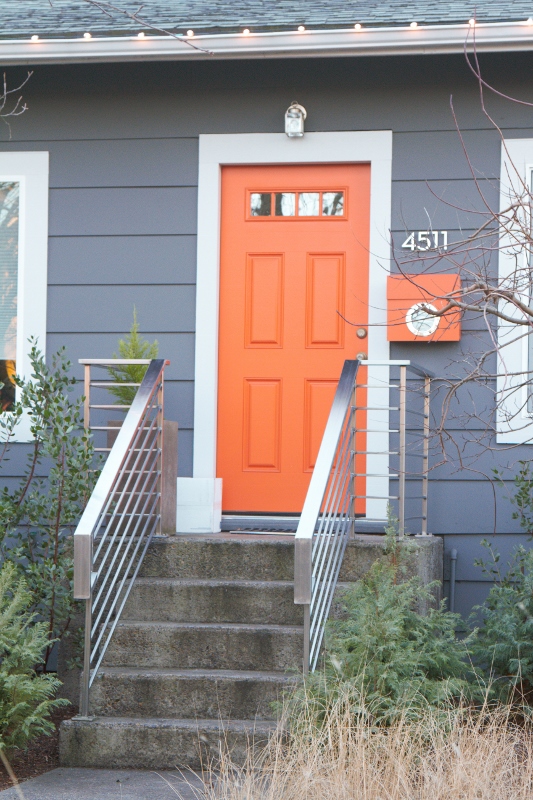
And what about all those tragic little post war ranch homes? Well, it turns out that they’re radically less expensive than either a condo downtown or a McMansion in the newer suburbs. With a little love they can be transformed into something to be proud of. They’re bigger than an apartment, they have a garden, and they’re a whole lot closer to the city center. They’re also a short walk or bike ride to the emerging 42nd Ave, business cluster.
I’m not saying that all, or even most, aging suburbs will blossom. But it’s at least a possibility. The real question to me is… what pushes a neighborhood down vs. what lifts it up? So far what I’m seeing is that a dead downtown contributes to even deader close in neighborhoods. A thriving downtown attracts more people to the city and creates an economic incentive for people to get creative with the reinvention of not-so-fabulous nearby areas. So if you want your struggling suburb to succeed, support your downtown.
John Sanphillippo lives in San Francisco and blogs about urbanism, adaptation, and resilience at granolashotgun.com. He’s a member of the Congress for New Urbanism, films videos for faircompanies.com, and is a regular contributor to Strongtowns.org. He earns his living by buying, renovating, and renting undervalued properties in places that have good long term prospects. He is a graduate of Rutgers University.