Category: Urban Issues

  • Global City Framework

    Global cities are like that famous quip on obscenity: we know one when we see it. But the definitions of global cities are incredibly varied and there doesn’t seem to be a consensus or well-defined way to think about. I looked at the criteria used in various prominent studies back in 2012 and found them highly divergent. Only the Sassen based one appeared to have a robust definition and theoretical basis, but it’s a pretty narrow definition. While it’s very important and useful, I don’t think it fully captures what the average person or urbanist thinks of on the topic.

    In wrestling with the global city idea while working on the global city study I did some research for, I put together this framework to help organize our thinking.

    Global City Framework

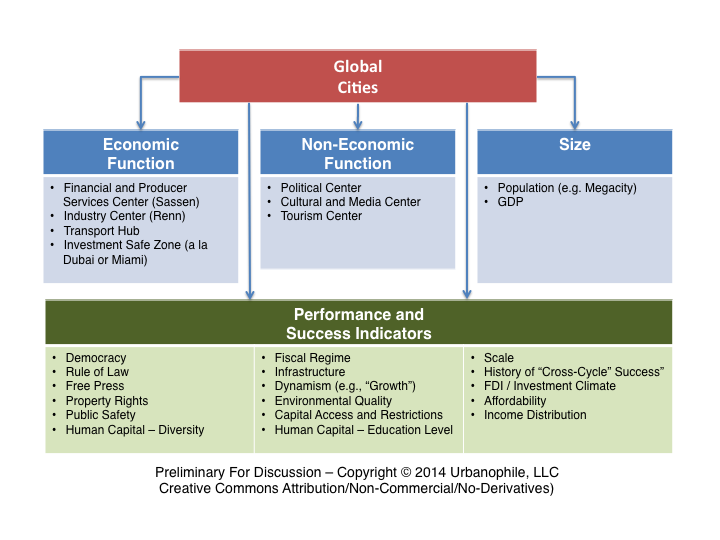
    This framework seeks to capture in a structured manner all the ways people talk about global cities that I’m aware of.

    There are three basic categories of criteria people use in defining global cities: economic function, non-economic function, and size.

    Economic Function

    Some, like Sassen, define global cities by economic function. In her case, just being a financial center isn’t enough. You need to be producing financial services products specifically related to the global economy, not just making mortgages domestically. I list “Financial and Producer Services Center” as a shorthand for this. In all of these definitions, when I say a “center” I’m referring to a center of global or regional (e.g., European or Latin American) significance, not simply a domestic center.

    If I have a contribution to the global city definition genre, it’s my contention that places like the Bay Area (tech) or Paris (fashion and luxury) that are important global or regional epicenters of an important 21st century macroindustry are also global cities in a powerful sense by virtue of that.

    The idea of being a transport hub for goods or services is self-explanatory, though I’ll note that simply being a goods distribution hub (such as a global air freight hub like Memphis) doesn’t necessarily imply a high value, high wage economy.

    Lastly, and perhaps this is one I made some contributions to as well, is the idea of a “safe zone” for investing or parking capital. Much of the world is volatile economically and only has a dubious attachment to the rule of law and property rights. Hence wealthy people in those countries like to stash their cash in places where they consider it safe. Where I would distinguish this from a simple offshore account as in the Caymans is that this investment often includes real estate, and the rich folks in question often establish a personal base there. New York and London as the paradigmatic global cities obviously fall into this category, but I’m more thinking of regional hubs like Dubai, Miami, and Singapore. These places have established themselves as premier business (and in some cases cultural) hubs for their regions.

    Non-Economic Functions

    These are other aspects of a city’s function that I see as not directly economic, though obviously there are economic impacts. Most of these perhaps could be subsumed under being in an industry epicenter, but since global city surveys often call them out separately, I will as well.

    The first item is being an important global political capital like Washington, Moscow or Beijing. Enough said.

    Another important dimension is being a cultural and media center. Los Angeles profoundly affects the world because of its entertainment machine and the media that goes along with it. (By contrast, Mumbai may be a huge film center, but serves largely a domestic and Indian ethnic audience). Obviously the English language cities have a big advantage here in terms of media, though cities like Paris have a powerful cultural role.

    Lastly, being a global tourism center is another dimension. Which places draw foreign visitors? You might want to read Nicole Gelinas’ recent taken on international tourism’s affect on New York. NYC attracts a third of all foreign visitors to the United States.

    Size

    Lastly, many surveys include measures that are purely about size, such as total GDP. The rhetoric about megacities (those with more than 10 million people) shows a fascination with size as well.

    Success and Performance Indicators

    Beyond the categories that define what global cities are, I include a horizontal layer talking about how to think about whether they are successful. I think there’s a big debate that can be had about whether these are performance indicators or selection criteria. Obviously more global city surveys want to pick highly performing cities, so these are part of their evaluation matrix. I myself originally included diversity and educational attainment (talent hub) on the non-economic function list.

    I won’t go through these as they are pretty self-explanatory. I’d be interested to see where you all would put these, and what you’d add to or drop from the list.

    By the way, in that global city survey I worked on, we decided to look purely at economic function, though pulling across media hub and treating that as an industry. We felt that taking this sort of view was a gap in the existing inventory of ratings, and also perhaps the most important way to think about global cities.

    This is a concept in development, so please share your thoughts.

    Aaron M. Renn is an independent writer on urban affairs and the founder of Telestrian, a data analysis and mapping tool. He writes at The Urbanophile, where this piece originally appeared.

    Hong Kong photo by BigStockphoto.com

  • Measuring Economic Growth, by Degrees

    In this information age, brains are supposed to be the most valued economic currency. For California, where the regulatory environment is more difficult for companies and people who make things, this is even more the case. Generally speaking, those areas that have the heaviest concentration of educated people generally do better than those who don’t.

    Nothing more illustrates this trend than the supremacy of the Bay Area over Southern California in the past five years. Since the 2007-09 recession, the Bay Area has recovered all of its jobs, as has San Diego, but Los Angeles-Orange and the Inland Empire, although improving, lag behind.

    Overall, the San Jose and San Francisco areas boast shares of college graduates at around 45 percent, compared with a 34 percent average for the 52 largest U.S. metropolitan areas. The San Diego area clocks in at 34.6. In comparison, the Los Angeles-Orange County area has roughly 31 percent college graduates while the San Bernardino-Riverside area has the lowest share of four-year degrees – 20 percent – of any large region in the country – this is worse even than backwaters like Memphis, Tenn., and Birmingham, Ala.

    Dividing this region by counties shows Orange County well in the lead, with 37.6 percent college-educated, well above Los Angeles County’s 30 percent.

    Recent Trends

    To see where these metrics are headed, Mark Schill, an analyst with the Praxis Strategy Group (www.praxissg.com), was asked to identify the share growth of bachelor’s degrees in the country’s largest metropolitan areas during 2000-13. The share of the adult population with college educations rose by 6.8 percent in San Jose and 6.4 points in the San Francisco-Oakland region. Some regions did better, including Boston, Pittsburgh, Grand Rapids, Mich., Baltimore, New York and St. Louis. All these were considerably above the national average increase of 5.2 percent.

    In contrast, most areas of Southern California have shown more meager growth in their educated workforces. Los Angeles, overall, enjoyed a very average increase of 5.2 percent. San Diego, despite its high-tech reputation, notched a 5 point jump while the Inland Empire increased by 3.8 points, one of the lowest performances in the country. The biggest gainer in the Southland was Orange County, where the share of educated workers grew by a healthy 6.3 percent.

    Whither young, educated workers?

    The picture, particularly for the Inland Empire, is not totally bleak. In a recent survey conducted by Cleveland State University, there have been some promising developments in the growth of younger educated workers. This key cohort, notes researcher Richey Piiparinen, appears to follow a very different path than do older educated workers, with many seeking out careers in less-expensive locales.

    Indeed, looking at educated growth among 25-34-year-olds from 2010-13 finds that the most rapid expansion is taking place in unlikely places, such as the areas around Nashville, Tenn., Orlando, Fla., and Cleveland, all which experienced increases of roughly 20 percent or more. This is better than twice the growth rate in such noted “brain centers” as San Jose and San Francisco, which were around 10 percent, and New York at 9 percent. The Los Angeles-Orange County area saw a similar increase.

    The reasons for these surprising, and somewhat encouraging results, particularly for the Inland Empire, may vary. One thing, of course, is the low base from which the area starts. After all, until the past decade, the employment profile of the Inland Empire favored manufacturing, logistics and construction, all fields not dependent on large contingents of highly educated workers.

    Another critical factor may well be price, as we saw in our surprising findings on millennials. Simply put, many of the areas attractive in the past to educated workers have become extraordinarily expensive – as demonstrated by San Francisco-based writer Johnny Sanphillippo – while some more affordable locales have become “sweet spots” for younger educated people, particularly as millennials enter their family formation years.

    County, city breakdowns

    The Southland, of course, is a vast region, and even every county contains hosts of cities that are very different from each other. In terms of counties, the biggest gains – albeit from a smaller base – took place in the Inland Empire, notably Riverside, which saw a 93 percent jump in its educated population since 2000. Orange County saw a 37.6 percent gain, ahead of Los Angeles’ roughly 36 percent gain.

    More intriguing, and revealing, is the distribution of college degrees by city areas. Here, the supremacy of a few areas is very clear. In three Southland communities, more than 60 percent of the adult populations have college degrees: Santa Monica, Newport Beach and Irvine. Yorba Linda, Pasadena and Redondo Beach all boast rates close to, or above, 50 percent.

    Obviously, these towns are something of outliers in the region. Los Angeles, by far the region’s largest city, has roughly 31 percent of its adults with college degrees. Many communities do far worse, most of all, Compton, where less than 6 percent have four-year degrees. Hesperia, Southgate, Lynwood and Victorville have educated percentages under 10 percent.

    Adjacent communities sometimes have radically different rates of education. Santa Ana, for example, abuts Irvine, but has an educated population of barely 12 percent. And while some areas have shown meager growth in their share of educated residents, several areas have seen double-digit percentage increases, including Burbank, Yorba Linda, Rancho Cucamonga and Santa Monica.

    Implications

    As the Southland economy evolves, it makes sense to look at those areas most likely to have more of the educated workers that high-end industries need. These increasingly are clustered in a few places, such as Irvine, Newport Beach, Rancho Cucamonga and Costa Mesa, that are both suburban in form but tend to have better schools than much of the region. These areas also tend to have lower-than-average unemployment rates. Educated people tend to migrate, for the most part, to areas where others of their ilk are concentrated, and often where their children have the best chance at a decent education.

    These statistics and trends suggest that our leaders, in education and politics, need to focus on reality. It is dubious that many communities throughout the Southland will develop large shares of educated people in the immediate future. Indeed, given the quality of public education throughout most of the region, it seems almost inevitable that much of the region will lag in terms of skills well into the next decade.

    This means that local leaders cannot expect to duplicate in the near future the success of places like Boston, the Bay Area, or even Pittsburgh. Instead, there needs to be a two-pronged attempt to address this issue. One is to boost preparatory and higher education throughout the region, which will allow for Southern California to better compete at the highest-end of employment.

    But the other strategy, not to be discounted, is a full-scale commitment to skills training for those unlikely to earn bachelor’s degrees. This also means taking measures allowing the industries that would employ such workers – largely manufacturing, logistics, medical and business services – to flourish, so this training will have rewards. The Southland’s already large educated population is one key to its future, but finding a decent work environment for those without a four-year degree merits equal, if not greater, emphasis.

    This piece first appeared at the Orange County Register.

    Joel Kotkin is executive editor of NewGeography.com and Roger Hobbs Distinguished Fellow in Urban Studies at Chapman University, and a member of the editorial board of the Orange County Register. His newest book, The New Class Conflict is now available at Amazon and Telos Press. He is author of The City: A Global History and The Next Hundred Million: America in 2050. His most recent study, The Rise of Postfamilialism, has been widely discussed and distributed internationally. He lives in Los Angeles, CA.

    Graduation image by BigStockPhoto.com.

  • Exodus of the School Children

    The urban cores of the nation’s 52 major metropolitan areas (over 1 million population) lost nearly one-fifth of their school age population between 2000 and 2010. This is according an analysis of small area age group data for children aged 5 to 14 from Census Bureau data, using the City Sector Model. Over the period, the share of 5 to 14 age residents living in the functional urban cores declined from 15.0 percent to 12.0 percent (Figure 1).

    The City Sector Model

    The City Sector Model analysis avoids the exaggeration of urban core data that necessarily occurs from reliance on the municipal boundaries of core cities (which are themselves nearly 60 percent suburban or exurban, ranging from as little as three percent to virtually 100 percent). It also avoids the use of the newer "principal cities" designation of larger employment centers within metropolitan areas, nearly all of which are suburbs, but are inappropriately joined with core municipalities in some analyses. The City Sector Model" small area analysis method is described in greater detail in Note 1 below (previous articles are listed in Note 2). The approach is similar to the groundbreaking work of David Gordon, et al at Queen’s University for Canadian metropolitan areas.

    School Age Losses

    The urban core school-age population dropped from approximately 3.40 million in 2000 to 2.73 million in 2010, for a loss of 670,000 (Figure 2). Much has been made about the affinity of the Millennial generation for the urban cores. Despite this, our small area analysis indicated that the percentage of 20 to 29 year olds living in the functional urban cores declined between 2000 and 2010, with 88 percent of the growth in suburbs and exurbs (see Dispersing Millennials). Coincidentally, over the period, there was a reduction of two school age children in the urban cores for every additional resident aged 20 to 29 (Figure 3).

    A loss was also sustained in the earlier suburbs (with median house construction dates between 1946 and 1979). The school-age population declined slightly more than 1 million in the earlier suburban areas. In 2000, 45.3 percent of school age children lived in the earlier suburbs, a figure that declined to 40.5 percent in 2010.

    Virtually all of the gain in 5 to 14 age residents was in the later suburban areas (a median house construction dates of 1980 or later) and exurban areas. Overall, these two city sectors added 1.9 million school-age children, while the urban cores and the earlier suburban areas experienced a reduction of 1.7 million, for a reduction of approximately 10 percent.

    The largest increase was in the newer suburban areas (median house construction dates of 1980 or later), where 1.47 more school-age children lived in 2010 than in 2000. This represented an increase of approximately 30 percent. Exurban areas have a more modest increase of 310,000 school-age children, up 8.3 percent from 2000.

    Losses in the Largest Urban Cores

    All of the large urban cores in the metropolitan areas experienced losses in school aged children from 2000 to 2010. Among the 24 urban cores with more than 100,000 residents, Washington (-5.5 percent) and Seattle (-8.4 percent) came the closest to retaining their 2000 school age numbers in 2010.  Seven large urban cores experienced losses of at least 30 percent. Baltimore’s loss was approximately 30 percent. Los Angeles joined rust belt cities St. Louis, Rochester and Cleveland at 33 percent to 34 percent and Detroit at 38 percent. New Orleans had the largest loss (-70.2 percent), owing in part to population loss from the disastrous hurricanes (Figure 4).

    Finally, in all of the 52 metropolitan areas, the later suburban and exurban areas (combined) retained more of their school age children than the urban cores and earlier suburbs. There were gains in 45 of the later suburban and exurban areas.

    Better Schools: The Necessary (But Maybe Not Sufficient) Condition

    One of the issues of most interest among urban analysts has been whether urban cores will be able to retain the share of Millennials that they have attracted. The functional urban cores seem likely to maintain their attraction for younger adults, so long as the cores sustain their improved living environment (such as much lower crime rates than before and continued investment by retailers and other commercial business to support the new populations).

    However, the continuing exodus of people with school-age children described seems to indicate that young adults tend to move to the suburbs and exurbs around the time their children enroll in school. Suburban and exurban schools often provide better educations than urban core schools. The Editorial Projects in Education found that high school graduation rates were 77.3 percent in suburban school districts, compared to 59.3 percent in "urban" school districts (Note 3). There are other difficulties as well, such as having sufficient defensible outdoor space for children to play and for parents to feel secure. But education seems likely to be the most important consideration.

    Of course, in urban areas the highly affluent can enroll their children in private schools. The alternative of private schools can be overly expensive, inducing households to relocate to school districts with higher quality education. According to research by Chief Economist Jed Kolko of Trulia: “Private school enrollment in the lowest-rated school districts is more than four times as high as private school enrollment in the highest-rated school districts after adjusting for neighborhood demographic differences."

    A balanced broad age distribution of households, including those with children of school age, is not likely to be achieved in urban cores unless Millennials are retained in substantial numbers. Once having moved, the chances of their returning are slim, because households move less frequently as they move up the age scale.

    Note 1: The City Sector Model allows a more representative functional analysis of urban core, suburban and exurban areas, by the use of smaller areas, rather than municipal boundaries. The more than 30,000 zip code tabulation areas (ZCTA) of major metropolitan areas and the rest of the nation are categorized by functional characteristics, including urban form, density and travel behavior. There are four functional classifications, the urban core, earlier suburban areas, later suburban areas and exurban areas. The urban cores have higher densities, older housing and substantially greater reliance on transit, similar to the urban cores that preceded the great automobile oriented suburbanization that followed World War II. Exurban areas are beyond the built up urban areas. The suburban areas constitute the balance of the major metropolitan areas. Earlier suburbs include areas with a median house construction date before 1980. Later suburban areas have later median house construction dates. 

    Urban cores are defined as areas (ZCTAs) that have high population densities (7,500 or more per square mile or 2,900 per square kilometer or more) and high transit, walking and cycling work trip market shares (20 percent or more). Urban cores also include non-exurban sectors with median house construction dates of 1945 or before. All of these areas are defined at the zip code tabulation area (ZCTA) level.

    Note 2: The City Sector Model articles are:
    From Jurisdictional to Functional Analyses of Urban Cores & Suburbs
    The Long Term: Metro American Goes from 82 percent to 86 percent Suburban Since 1990
    Beyond Polycentricity: 2000s Job Growth (Continues to) Follow Population
    Urban Cores, Core Cities and Principal Cities
    Large Urban Cores: Products of History
    New York, Legacy Cities Dominate Transit Urban Core Gains
    Boomers: Moving Farther Out and Away
    Seniors Dispersing Away from Urban Cores
    Metropolitan Housing: More Space, Large Lots
    City Sector Model Small Area Criteria

    Note 3: This report (which was prepared with support from the America’s Promise Alliance and the Bill and Melinda Gates Foundation) provides graduation rates using the US Department of Education "local codes." This typology generally defines "urban" school districts as those in core cities as well as other principal cities (such as Arlington, Texas and Mesa, Arizona). Most of the population of core cities and principal cities is classified as functionally suburban (see: Urban Cores, Core Cities and Principal Cities). Further, the typology classifies some districts as suburban that have large urban components (such as Las Vegas, Miami, Louisville and Honolulu), which is necessary because of county level school districts that include both urban cores and suburban areas. As a result the functionally suburban component of urban districts is overstated and the functionally suburban component of suburban districts is understated. Because urban graduation rates tend to be less than suburban rates, both of these factors seem likely to overstate the "urban" graduation rates and understate the "suburban" graduation rates.

    Wendell Cox is principal of Demographia, an international public policy and demographics firm. He is co-author of the "Demographia International Housing Affordability Survey" and author of "Demographia World Urban Areas" and "War on the Dream: How Anti-Sprawl Policy Threatens the Quality of Life." He was appointed to three terms on the Los Angeles County Transportation Commission, where he served with the leading city and county leadership as the only non-elected member. He was appointed to the Amtrak Reform Council to fill the unexpired term of Governor Christine Todd Whitman and has served as a visiting professor at the Conservatoire National des Arts et Metiers, a national university in Paris.

    Photo: School buses in suburban Atlanta (by author)

  • What will our Latino Future Look Like?

    President Obama’s amnesty edict, likely to be the first of other such measures, all but guarantees California’s increasingly Latino future. But, sadly, for all the celebration among progressives, the media, Democratic politicans and in the Latino political community, there has been precious little consideration about the future of the newly legalized immigrants, as well as future generations of Latinos, in the state.

    Although some publications, notably the New York Times, regard California as something of a model for the integration of the undocumented, the reality on the ground is far less attractive. Even as Latinos, now the state’s largest ethnic group, gain greater influence culturally and politically, many are falling into a kind of racial caste system.

    California has roughly one-third of the country’s undocumented immigrants and, in some locales – notably, Los Angeles – they constitute roughly one in 10 residents – or some 1 million people – 85 percent of them from either Mexico or Central America. As of now, these residents, longtimers and recent arrivals, pose, among other things, a potential challenge to local governments trying to serve a new base of largely poor, and generally poorly educated, migrants.

    Today, public agencies in Los Angeles County, notes former county supervisor Pete Schabarum, are facing a “an already impossible fiscal dilemma” and now will need to spend an additional $190 million, without hope of federal compensation, on the newly legalized population. The stress on other key institutions, such as schools and hospitals, will also grow, particularly if more foreign nationals, suspecting the likelihood of amnesty, are encouraged to come here.

    In the past, we could have looked with confidence at this new population as a net plus. But that may no longer be so much the case, given the current economic direction of California. It has become increasingly difficult in the state for many industries – such as agriculture, manufacturing, construction and logistics – that traditionally have employed Latino immigrants. In contrast, the one industry favored by Sacramento’s political class – the technology firms synonymous with Silicon Valley – has not engendered much progress for Latinos, whose incomes there have dropped while those of whites and Asians have grown.

    Perhaps most alarming, few among California’s Latino politicians have a strategy to reverse these trends. Rising Latino figures, such as newly elected Senate President Pro Tem Kevin de Leon, have chosen to link themselves with gentry liberals, such as billionaire environmentalist Tom Steyer. They have embraced the gentry’s regulatory and energy agenda – cap and trade, subsidies for “renewable” energy and hostility toward suburban housing – which conflicts directly with the economic interests of Latino voters, particularly those benefiting from President Obama’s immigration directives.

    This stance may make de Leon the toast of the town in San Francisco, Marin County, Malibu and other white gentry havens. He recently celebrated his elevation to the Senate’s top post with an opulent party at the Disney Concert Hall in Downtown Los Angeles, an event derided by the liberal Sacramento Beeas an “ostentatious display” and a “special interests ball.” Not so worthy of celebration are the economic conditions facing many of his constituents. Large swaths of his district, such as East Los Angeles, suffer high rates of unemployment.

    One key here has been the decline of manufacturing – down 34 percent statewide the past 15 years – as Latino politicians seem to barely shrug as employers flee ever-higher taxes, regulatory constraints and higher electricity prices. Manufacturing, which accounts for a larger share than any other sector of the region’s economic output, has lost more than 300,000 jobs in the Los Angeles area since 2001.

    Another key blue-collar sector, construction, is up 12 percent, but is far from recovering the 40 percent of jobs it lost statewide during the recession.

    These losses have taken away many of the traditional avenues for upward mobility. As a result, some predominately Latino communities, from the Central Valley to Compton, suffer double-digit unemployment. Overall, the Latino unemployment in California is above 10 percent while the rate in pro-industry Texas is under 7 percent. Latinos in California are also considerably less likely to own their own business than their Lone Star State counterparts.

    Long-term California Latinos’ prospects are most undermined by the ailing state education system, whose reform is generally opposed by the Latino political class. The new state Senate leader, like many other Latino politicians, spent much of their careers working for, and then reaping rich support from, public-sector unions, notably the all-powerful California Teachers Association. Not surprising, de Leon proudly backed the successful CTA candidate in the recent race for state superintendent of schools.

    The unions and politicians may have gained by this association, but not so a great many Latino youngsters. A recent article in the National Journalnoted Latinos in the same San Jose neighborhood that produced Cesar Chavez still suffer terrible schools, with one-third of third-graders unable even to read. Amazingly, California’s Latinos are even underperforming their Texas counterparts, despite lower school funding in the Lone Star State.

    This belies the common assumption among progressives, here and elsewhere, that the Golden State is an exemplar of social progress while the Lone Star State is a reactionary backwater that is toxic for both immigrants covered by President Obama’s decrees and legal Latino residents. Compared with the Los Angeles Unified School District, the Houston Independent School District, faced with similar demographics, has twice won the Broad Education Prize and, in relative terms, seems a model of flexibility and innovation.

    Equally important, the newcomers face daunting challenges entering the property-owning middle class. Due in part to regulatory restraints, less than two in five Latinos in Los Angeles or San Francisco own their home, compared with large majorities of Latino homeowners in places like Phoenix and Houston.

    It now takes more than 12 times the median Latino household income to buy a home in the Bay Area and more than nine times in the Los Angeles-Orange County area. In contrast, the multiple is roughly three in metropolitan areas such as Dallas-Fort Worth, Houston, Phoenix and Atlanta.

    The rise of housing prices in the state, as well as meager income gains, have managed to reduce the percentage of Latinos getting new mortgages from almost half in 2006 to 22 percent today.

    Given these trends, one would assume that politicians representing California Latinos would favor policies that would spur growth in housing as well as other blue-collar industries. Yet, as these industries have faded, identity politics, instead, have ascended, particularly since the passage of Proposition 187 in 1994, which aimed to limit access to public services by illegal immigrants. Stanford political scientist Gary Segura suggests that upwardly California Latino voters were shifting toward the GOP until Republican Gov. Pete Wilson’s immigrant-bashing Prop. 187 campaign all but obliterated this trajectory.

    This explains how California increasingly diverges both from the experience of other immigrants over the past century, and what is occurring today in some other states. In Georgia, Kansas and Nevada, as well as Texas, upward of 40 percent of Latino voters this year supported GOP candidates, compared with more than 70 percent lockstep support for Democrats in California.

    The problem here is not party per se – traditional Democrats historically combined liberal views with a strong pro-growth economic orientation. But we now see a shift within California Latino politicians away from support for broad-based growth and toward a greater reliance on redistribution and increased dependence on government. This approach may hurt their constituents but conveniently aligns with the preferences of wealthy white liberals in Marin County, San Francisco and other gentry locales, whose interest is to restrain economic growth.

    One has to wonder, in my case as a non-Latino Californian here for over four decades, where this will all lead. One consequence could be to increase the state’s already large population living in poverty and boost California’s share of welfare recipients, roughly a third of the national total. The potential long term for a dangerous cocktail of racial and class resentment is not hard to envision.

    Latino voters, and all Californians, must demand something better. A good start would be a greater emphasis on broad-based economic growth, which could provide a ladder to the middle class for more Latinos, including the undocumented. But this requires political leaders who are focused less on appealing to San Francisco billionaires and more on the interests of ordinary Californians, many of them Latino. This could turn the presidential directive on immigration into something that builds a better future rather than becoming just another measure to institutionalize further poverty and patterns of dependence.

    This piece first appeared at the Orange County Register.

    Joel Kotkin is executive editor of NewGeography.com and Roger Hobbs Distinguished Fellow in Urban Studies at Chapman University, and a member of the editorial board of the Orange County Register. His newest book, The New Class Conflict is now available at Amazon and Telos Press. He is author of The City: A Global History and The Next Hundred Million: America in 2050. His most recent study, The Rise of Postfamilialism, has been widely discussed and distributed internationally. He lives in Los Angeles, CA.

    Photo by chadlewis76

  • Towns With a Past, Towns With a Future

    Over the last fifty or sixty years most towns have been dedicated to accommodated cars in order to cultivate business and permit people to live better more convenient lives. For new developments out in a former corn field this was effortless since everything was custom built with the automobile in mind. But older towns that had been built prior to mass motoring were at a distinct disadvantage.

      Screen Shot 2014-12-04 at 12.57.53 AM Screen Shot 2014-12-05 at 1.15.13 AM Screen Shot 2014-12-05 at 1.16.43 AM

    In order to keep up with changing times older neighborhoods, particularly older Main Street business districts, did whatever possible to retrofit themselves. The roads were widened, sidewalks were narrowed, street trees were removed, obsolete buildings were torn down to make way for parking lots, new zoning regulations and building codes were introduced to ease traffic and ensure abundant free parking. Unfortunately for many historic towns there simply was no contest. New strip malls and office parks could provide endless free parking and massively wide roads. If you add in the competition from big box national chains and the politics of race and class driving people across municipal borders for lower taxes and segregated school districts… Main Street never had a chance. The irony is that the more towns tried to accommodate cars the less pleasant they became.

    Screen Shot 2014-12-03 at 10.31.41 PM Screen Shot 2014-12-03 at 7.00.56 PM Screen Shot 2014-12-05 at 1.06.03 AM
    Screen Shot 2014-12-03 at 10.33.08 PM Screen Shot 2014-12-05 at 12.31.52 AM
    Screen Shot 2014-12-05 at 12.32.11 AM
    Screen Shot 2014-12-03 at 11.14.20 PM Google Earth

    This is a Google Earth image of the area around Cheviot, Ohio. The people of Cheviot self-identify with the fictional 1950’s TV town of Mayberry made famous by The Andy Griffith Show. It really is a lovely place, but it effectively has no business district anymore thanks to the Western Hills Plaza Shopping Center half a mile away which straddles Green Township and the Westwood district of suburban Cincinnati. Harrison Avenue, Cheviot’s century old Main Street, is circled at top right. Western Hills Plaza is circled at bottom left. The Home Depot, Target, Kroger, and Dillard’s make it impossible for mom and pop shops on Harrison Avenue in Cheviot to sustain themselves. Half the shops are empty and the others limp along. It’s a shame, because Cheviot is a charming town full of great old commercial buildings and solid housing stock. It’s a good town full of good people. The German Catholics who settled and built this part of Ohio have managed to hold on to a fair-to-middling set of arrangements through the worst years of decline, but the town is a shadow of its former self. It has excellent bones, but the flesh is sagging through no fault of its own.

    Screen Shot 2014-12-03 at 11.22.36 PM Screen Shot 2014-12-03 at 6.47.29 PM IMG_9387 (800x600) Screen Shot 2014-12-05 at 1.12.50 AM

    However, Cheviot has one thing that Western Hills Plaza doesn’t – a walkable, bikable, fine-grained pleasant neighborhood. That may not sound like much, but it’s more than nearly anyplace built after 1950 anywhere in North America can boast. Cheviot is an actual town, not just mindless suburban sprawl. That’s a rare commodity these days and a lot of people are hungry for it. Just about every home in Cheviot is within a five or ten minute walk of the old business district, local public schools, library, churches, and parks. It has become unusual in America for people to live in this kind of environment and it’s coming back in fashion with increasing demand and limited supply. There’s an opportunity here for people with the right attitude.

    Screen Shot 2014-12-04 at 1.09.07 AM Screen Shot 2014-12-04 at 1.08.19 AMGoogle Earth

    In contrast let’s say that you lived here on this cul-de-sac in Green Township and you wanted to go to one of the fast food places directly behind your back fence. This is the route you’d need to take.

    Screen Shot 2014-12-04 at 1.10.14 AM Google Earth

    If you’re used to driving everywhere everyday you might not think twice about hopping in the car. In fact, you might not even realize that the Burger King and KFC are so close. But if you were somehow forced to walk one day you might be surprised at how hard it would be given all the walls, fences, and drainage ditches that stand between you and your fast food. And the walk would be a miserable and potentially dangerous experience. The highway and its cavalcade of concrete and plastic bunkers is so wretched when you aren’t in a car that developers and city planners go out of their way to keep homes as isolated and buffered as possible. This radical separation of uses makes perfect sense in a car-oriented environment. Who wants to look out at a highway strip mall from the back yard? But it’s Hell on foot. And don’t even think of riding a bike. You’ll either get hit by a speeding car or attract the attention of the local police who will immediately identify you as a deviant. Being a pedestrian or cyclist in this environment constitutes “probable cause”. You must be unsavory if you lower yourself to such desperation here. Sitting at a bus stop in this setting is no joy either.

    Screen Shot 2014-12-04 at 12.51.28 AM Screen Shot 2014-12-04 at 12.53.48 AM Screen Shot 2014-12-04 at 12.23.18 AM Screen Shot 2014-12-04 at 12.55.51 AM IMG_9626 Screen Shot 2014-12-05 at 1.14.48 AM

    So here’s the challenge of the next few decades. The aging sprawl in Green Township and similar nearby post war suburbs like White Oak, Sharonville, and Deer Park on the edge of Cincinnati aren’t aging well. Their roads and sewer systems are right at the point where they need complete overhauls and there’s no money for any of it. Don’t expect Columbus or Washington to send big checks because they’re broke too. The housing stock in these places is neither charming in a Norman Rockwell sort of way, nor sufficiently Mad Men modern. Their roofs, windows, kitchens, baths and furnaces all need replacing right about now and there isn’t a lick of insulation in most of them. Fifty years ago these suburbs were white middle class havens with their backs to inner city decay and race riots.

    IMG_6149 (800x533) IMG_6126 (800x533) IMG_6164 (800x533) IMG_6155 (800x533) IMG_6128 (800x533)

    Now newer more prosperous suburbs Like Mason and Beavercreek farther out attract wealthier residents looking for larger homes with all the latest bells and whistles along with premium public schools and lower taxes. Green Township has less than half the average family income of Mason. Homes in Green Township and other similar areas sell for $75,000 although many homes can be found for considerably less. Mason homes sell for north of $250,000 with many at much higher price points. Meanwhile downtown Cincinnati and Over-the-Rhine are rapidly gentrifying as people who prefer an urban environment reinvigorate long abandoned neighborhoods. The poor are being displaced in the process and they’re going to have to live somewhere. Given the trajectory of these shifts it isn’t looking good for the so-so suburbs in the middle distance. We can expect more “Fergusons” on the horizon although the particulars are unknowable at this time. This economically induced migration won’t be good for the poor either. They just spent the last few generations sucking up the desiccated crumbs of 19th Century industrialism and now they’re being shunted off to the stale left overs of 20th Century sprawl just in time for it to die.

    Screen Shot 2014-12-05 at 1.06.38 AM Screen Shot 2014-12-05 at 1.07.09 AM Screen Shot 2014-12-05 at 1.13.14 AM Screen Shot 2014-12-05 at 1.08.55 AM  IMG_9203 (800x600) IMG_9191 (800x600) IMG_9197 (1024x768) (800x600) Screen Shot 2014-12-05 at 1.14.02 AM Screen Shot 2014-12-05 at 1.11.41 AM Screen Shot 2014-12-05 at 1.05.23 AM Screen Shot 2014-12-05 at 1.09.52 AM Screen Shot 2014-12-05 at 1.11.59 AM Screen Shot 2014-12-05 at 1.11.18 AM

    But there’s hope for some of these places. Pressed up against both Cheviot and Green Township is Westwood, a former streetcar suburb that also uses Harrison Avenue (the old streetcar route) as its long-lost Main Street. Westwood was once an independent town, but was annexed by Cincinnati a hundred years ago. It fell out of favor beginning in the 1950’s when the streetcar was ripped up and shiny new subdivisions and shopping centers were built-in places like Green Township. Moving children out of Cincinnati public schools to another jurisdiction a mile away was one of the primary motivations as racial tensions in the city grew. Taxes were also lower in the new suburbs. (Is any of this ringing a bell?) Cincinnati has recently figured out that it can’t compete with Mason or Beavercreek for that particular share of the upscale suburban real estate market, but it’s looking at the success of Over-the-Rhine and wondering what the family friendly conservative Republican Catholic version of revitalization might look like in Westwood. In other words, what can parts of Cincinnati provide in the way of a value-added “product” or “experience” in their century old neighborhoods of single family homes that Mason can’t. There’s a chance that Westwood’s competitive advantage might just be walkability and historic charm. The city adopted a form based code for this part of Westwood and has been investing money in the schools and parks with plans to create a town square in what is now an awkward triangular intersection next to the Carnegie library. There are also existing businesses and subtle interdependent institutions that simply don’t exist out in new suburban locations. If you want your cello or violin repaired you’re not going to find that sort of thing at the mall between the food court and the Sunglass Hut. A more pedestrian oriented Westwood with unique family oriented destinations and activities could be an engine that pulls the area in a better direction. Sooner or later all those Hipsters downtown are going to start getting married and having kids and their going to want a house with a patch of garden. There could be an advantage to having that life three miles from downtown instead of twenty-two miles out in Mason. On the other hand, Westwood could simply languish and be dragged down by the failing sprawl that surrounds it. It could go either way. Time will tell.

    John Sanphillippo lives in San Francisco and blogs about urbanism, adaptation, and resilience at granolashotgun.com. He’s a member of the Congress for New Urbanism, films videos for faircompanies.com, and is a regular contributor to Strongtowns.org. He earns his living by buying, renovating, and renting undervalued properties in places that have good long term prospects. He is a graduate of Rutgers University.

  • School Buses: America’s Largest Transit System

    Reminiscent of the late Rodney Dangerfield’s lament, America’s network of school buses get "no respect." The thousands "yellow buses" are buried without a mention in the most important tables of the US Department of Transportation’s National Transportation Statistics. Neither the terms "school" nor "school bus" appear in tables summarizing the number of vehicles (Table 1-11), vehicle travel (Table 1-35), passenger travel (Table 1-40) and others. At the same time, there is far more complete information on virtually every other transportation mode.

    School Buses: A Large Transportation System

    This would not be surprising if the school bus system was small or insignificant. It is anything but.  This point was made in a National Association for Pupil Transportation (NAPT) white paper:

    "School bus carriers operate the largest mass transportation fleet in the country. Each day, 480,000 yellow school buses travel the nation’s roads. Compare that to transit, with 140,000 total vehicles, 96,000 of which are buses; to the motor coach industry, with 35,000 buses; to commercial airlines, with 7,400 airplanes; and to rail, with 1,200 passenger cars. In fact, our school bus fleet is 2.5 times the size of all other forms of mass transportation combined."

    By at least that measure, the school bus system is the largest mass transportation system in the nation.

    Comparing School Bus and Transit

    The NAPT white paper (above) indicates that there are many more school buses than transit vehicles. School buses compare favorably to transit in other measures as well.

    According to the American School Bus Council (ASBC), school buses transported an average of 26 million elementary and secondary students daily in 2010 (see the ASBC summary of environmental benefits). This is 52 million one way trips. Approximately 55 percent of the nation’s enrollment travels to and from school on school buses.

    By comparison, our analysis of Federal Transit Administration data for 2010 indicates that all transit services (subway, commuter rail, light rail, bus, paratransit, etc.) carried approximately 25 million one-way trips on the average weekday in 2010 (adjusted to eliminate transfers between vehicles on the same passenger trip, using an American Public Transportation Association estimate). On school days, it turns out that school buses carry more than twice as many passengers as transit passengers (Figure 1).

    ASBC estimates the average one-way school bus trip at five miles. This means that every day, pupils travel approximately 260 million miles. The school bus advantage over transit is somewhat less in passenger miles than passengers, because transit trips are longer. School bus passengers travel approximately 50 percent more miles than transit weekday passengers travel (approximately 170 million miles).

    The annual differences in school bus and transit use are much less. This is because school bus service is provided only an average of 180 days annually, approximately one-half the 365 days that transit service operates. Based on the American School Bus Council estimate, the annual number of one-way school bus trips by students is estimated at 9.4 billion in 2010. By comparison, annual transit passenger journeys (excluding transfers) were an estimated at under eight billion in 2010.

    Transit, however, carries passengers farther than school buses each year. With its 365 day per year operation, transit carried 52 billion transit passenger miles in 2010, approximately 10 percent more than the 47 billion passenger miles traveled on school buses.

    School Bus Data

    Without a centralized digital data collection system, there is no readily available school bus data below the state level. Thus, unlike transit (with its National Transit Database), development of school bus information on a metropolitan area level would be time consuming and expensive and is not regularly done. Industry publications, such as School Bus Fleet and School Transportation Newsprovide detailed information but only at the state level.

    State and Local School Bus Ridership

    School bus services are provided nearly everywhere in the United States, in both urban and rural areas. Most school bus service is provided by local school authorities (school districts). According to NAPT, about two-thirds of the service is provided directly by school transportation departments, while the other one-third is provided by private contractors ("outsourced").

    Based on information in School Bus Fleet, all the top 10 states have school bus ridership of more than 1,000,000 one-way pupils every school day. New York has the highest ridership, at nearly 4,000,000. Texas has more than 3,000,000 daily riders, followed by Pennsylvania, Indiana, Illinois, Georgia and Florida, all with more than 2 million daily riders (Figure 2).

    The school districts with the highest pupil ridership are concentrated in the Northeast and South, which include nine of the 10 most patronized systems. The strong southern representation is largely due to the county level school districts, which are larger than the more local school districts typical in the rest of the nation.

    Based on School Bus Fleet data, the New York City school district carries more passengers than any other, with nearly 310,000 daily trips. Fairfax County (Virginia), Gwinnett County (Georgia), Charlotte Mecklenburg (North Carolina), Clark County (Nevada) and Montgomery County (Maryland) also carry more than 200,000 daily passengers (Figure 3).

    The Largest Transit System

    With the national school bus fleet nearing 500,000 vehicles, the state of New York has the largest number, at nearly 45,000, according to School Bus Fleet. Texas ranks second with 40,000 school buses, while Illinois, California and Pennsylvania have between 20,000 and 30,000 buses. The combination of just a few states can exceed the national total of transit buses (60,000).

    On any given school day, school buses are the largest transit system in the nation.

    Wendell Cox is principal of Demographia, an international public policy and demographics firm. He is co-author of the "Demographia International Housing Affordability Survey" and author of "Demographia World Urban Areas" and "War on the Dream: How Anti-Sprawl Policy Threatens the Quality of Life." He was appointed to three terms on the Los Angeles County Transportation Commission, where he served with the leading city and county leadership as the only non-elected member. He was appointed to the Amtrak Reform Council to fill the unexpired term of Governor Christine Todd Whitman and has served as a visiting professor at the Conservatoire National des Arts et Metiers, a national university in Paris.

    Photo: School buses in suburban Atlanta (by author)

  • Overselling America’s Infrastructure Crisis

    60 Minutes ran a segment recently called “Falling Apart” that was another alarmist take on the state of American infrastructure. I’ll embed here but if it doesn’t display for you, click to CBS News to watch (autoplay link).

    We’ve seen this story before. America’s infrastructure is falling apart and we need to spend many billions on upgrades, but politicians won’t agree because they are too craven.


    There’s some truth to this point of view. The problem is that it’s oversold using the worst examples. It also gives short shrift to the many infrastructure upgrades that we have been making. And it ignores how people and businesses make capital purchase decisions in the real world.

    First, I’m not surprised to see that 60 Minutes spent a lot of time in Pennsylvania. In my experience, Pennsylvania is in a class by itself when it comes to infrastructure. Drive something like I-70 from Washington to the Ohio state line and prepare to be appalled. Pittsburgh legitimately has a massive infrastructure maintenance overhang. Philly too. And much of the infrastructure there was under built to begin with. The Schuylkill Expressway goes down to two lanes each way, for example. Similarly, 60 Minutes is right about some of the obsolete bridges on Amtrak’s Northeast Corridor. They may have easily included other high profile embarrassments like LaGuardia Airport or Penn Station. Or they might have taken a look at state of decay of Rhode Island’s bridges.

    There are clearly some high profile legacy items that need to be addressed. But that neglects the other side of the coin, namely that there’s a ton of major infrastructure that has been upgraded.

    60 Minutes includes some footage of Chicago. Clearly there’s a need for bigtime investment there. But in the last 20 years or so IDOT reconstructed completely many of the major freeways in the area like the Kennedy and Dan Ryan. The Tollway Authority widened virtually the entire system and implemented open road tolling, vastly reducing congestion. Similarly the CTA opened the brand new Orange Line, did major work to renovate the Green and Pink Lines, just did major infrastructure upgrades on the south branch of the Red Line, and expanded capacity on the Ravenswood. They’ve also gone from tokens and cash to electronic fare collection. At least one new commuter rail line was opened (the North Central line). The O’Hare Modernization program is underway with new runways already online and a significant reduction in congestion there. A new terminal was also built and the existing terminals given some refreshes.

    Is there a lot to do in Chicago? Undoubtedly. But let’s give credit for what has already been done.

    It’s the same elsewhere. Nicole Gelinas notes that New York has invested $123 billion in the transit system in the last 30 years. That’s not chump change. The third water tunnel is now online there as well. Indianapolis built an ultra-modern airport terminal complex that’s up to international standards. Many other airports like DTW, SJC, SFO, etc. have built major new terminals or seriously upgraded their acts. There have actually been a lot of investments in port infrastructure to get ready for post-Panamax ships.

    I’m told even Pennsylvania has done a good job of starting to address its infrastructure problems. The Philadelphia airport is actually quite nice these days, for example.

    So we’ve actually done a lot already that 60 Minutes doesn’t give us credit for.

    But what’s more, the presence of infrastructure that’s at or near the end of its useful life isn’t necessarily a bad thing anyway. Would it make sense for every single car on the road to be brand new? Of course not. Most cars ultimately end up getting driven till the wheels fall off. And that makes perfect sense. Why would you junk an asset that still has lots of service life left? We reallocate ownership of a lot of those cars during their lifespan, but we try to get the max out of their useful life.

    It’s similar in our homes. How many of us replace a furnace at the first sign of rust? Yes, sometimes we do a complete upgrade or refresh of a kitchen or bathroom, but most of the time we don’t replace major household systems like furnaces or roofs until they appear to be at a point where paying for repairs when they break appears to be futile in light of the asset age. It makes sense to pay $400 to replace a starter that fails when the car has 125,000 miles. It’s more questionable when the transmission goes out at 175.

    The fact that some issues or incidents with infrastructure can cause temporary closure or disruption is exactly how most personal capital assets work. A part goes out on our car. It needs to be towed and fixed. And it’s out of commission during that period. That’s annoying, disruptive, and costly. But does it mean that we should all go out and buy a brand new car? I don’t think so. And that’s certainly not how people behave in the real world. Obviously you have to build in a margin of safety on items like bridges where a failure would be catastrophic, but the same general principle applies. We shouldn’t wait for them to fail before replacement, but we do and should get the full useful life out of them.

    Why would we expect our government to spend our money on its capital assets in a manner differently from how we spend our money on our own personal possessions? This explains why the public is much more skeptical of spending on infrastructure than the infrastructure lobby would like. It’s to be expected that some percentage of our infrastructure will perpetually be at or near end of life, as that’s the nature of the capital asset life cycle.

    What’s more, when we replace a furnace or car, most of us don’t go out and buy Cadillacs. We buy something that fits the budget. Unfortunately, this mindset doesn’t seem to penetrate the public sector, where a significant amount of infrastructure is gold plated and priced at a level far out of line with international comparisons. The big problem in New York isn’t a lack of investment in transit. It’s the fact that the region has just about the highest transit capital costs in the world. Wonder why Madrid and Calgary have nice train systems? Among other reasons, they were very cost-efficient in their design and construction. Rather than more money, maybe we should first try some reform in our broken system of building stuff that results in lengthy project timelines and out of control costs.

    So there are some things that need to be taken care of and we need to do that. But scaremongering about dangerous bridges isn’t the right answer. And where I see the biggest infrastructure needs are on local streets and bridges, where federal and state dollars are least likely to be applicable. It’s no surprise to me that most of the pothole ridden, bombed out streets we drive on are local city streets, where they are the maintenance responsibility of an entity that lacks the large, dedicated infrastructure revenue streams available to the state and federal governments. But that’s a topic I’ll have to explore in a future post.

    Aaron M. Renn is an independent writer on urban affairs and the founder of Telestrian, a data analysis and mapping tool. He writes at The Urbanophile, where this piece originally appeared.

  • Good Enough Urbanism: Faster, Cheaper, Smarter

    There’s plenty of blight out there. Inner city blight, failing suburban blight, long lost rural small town blight… empty storefronts, boarded up buildings, dead streets. There’s simply no government program that’s going to bring these places back to life. No Wall Street investment scheme is likely to revive these places. Developers have no economic incentive to do anything with these buildings. Banks are risk averse and will not fund investments here. However, many of these forlorn spots exist within otherwise populated and potentially healthy neighborhoods. They may have been passed over when a nearby highway was extended or bled dry by big box stores and chain restaurants. But they could be pressed into service once again if enough people colonize them in creative ways – assuming the local authorities hold back on the usual mindless code enforcement.

    Screen Shot 2014-12-02 at 2.33.40 AM Screen Shot 2014-12-02 at 2.17.26 AM Screen Shot 2014-12-02 at 2.17.11 AM

    I’ve heard many local economic development people and city planners tell me they can’t force people to do anything they don’t want to do. True enough. But, man can they shut people down in a hurry for a whole lot of ridiculous minutiae for no good reason. So towns need to ask themselves if they want to continue to deteriorate for the sake of adhering to all the accumulated and often archaic rules that may not even make sense anymore, or if they want reinvestment and vitality. Keep in mind, this sort of reinvention may not exactly look like a Gap, a Starbucks, or a Nordstrom, but that doesn’t mean it isn’t employing people and creating an environment that can start turning a neighborhood around.

    unnamed-14 unnamed-12 5 2

    Wherever I go I seek out examples of people who carve out a little business or useful community space in the midst of an otherwise uninspiring environment. Here are a few examples. Have you ever dreamed of opening up a shop of some kind? Many people do. But then you start to think about the high rent in a good part of town, and the regulations… The need for a handicap accessible public bathroom, a federally inspected commercial kitchen, insurance, a dozen pieces of paper covered in stamps from who-knows-what bureaucracies: permits, licensing fees, certifications, public notifications… Just thinking about the process stops most people cold. And then they find themselves working as an assistant manager at a chain for slightly above minimum wage.

    Screen Shot 2014-12-02 at 2.15.08 AM Screen Shot 2014-12-02 at 2.16.14 AM
    Screen Shot 2014-12-02 at 2.15.35 AM Screen Shot 2014-12-02 at 2.15.24 AM

    These folks just skipped the whole asking-for-permission part and started working on a shoestring budget. They gave the garage a fresh coat of pain, got some inexpensive second hand furniture, flung open the doors, put out a sign, and started selling flowers. If the business fails they haven’t lost much – and at least the garage is finally clean and organized. If the shop is successful they can eventually work their way up to the full ADA, OSHA, and DOT gold standard with minimum parking ratios and energy efficiency compliance. But that can come later. Towns have to choose. Do they want to tolerate this sort of thing or shut it down immediately? It tends to come down to the “property values” folks objecting to the “trashy” nature of such establishments. In the end it’s all a matter of self-selecting populations agreeing on what is acceptable in their neighborhood and what isn’t. Some places will roll with it and others won’t. Fair enough.

    Screen Shot 2014-12-02 at 2.31.03 AM Screen Shot 2014-12-02 at 2.28.41 AM Screen Shot 2014-12-02 at 2.29.41 AM 
    Screen Shot 2014-12-02 at 2.30.12 AM

    Screen Shot 2014-12-02 at 2.28.58 AM Screen Shot 2014-12-02 at 2.29.20 AM Screen Shot 2014-12-02 at 2.28.33 AM Screen Shot 2014-12-02 at 2.28.13 AM Screen Shot 2014-12-02 at 2.28.03 AM Screen Shot 2014-12-02 at 2.29.34 AM

    Here’s a small town coffee shop with a big mostly vacant gravel parking lot that’s been set up as a family gathering place. People can come here, get a sandwich, something to drink, a pastry, and linger with other people from the neighborhood. The shipping containers are both secure storage for the cafe’s supplies, as well as the walls of an outdoor play area for kids. The picnic tables, shade structures, bicycle racks… none of it is expensive. A liability lawyer and insurance adjuster could have a field day with this place. But so far there have been no deaths or mutilations – except for out on the highway in front. But those folks were in cars and had nothing to do with the coffee shop or playground. (I don’t see the county shutting down the highway.)

    Screen Shot 2014-12-07 at 3.03.59 AM Screen Shot 2014-12-07 at 3.03.12 AM Screen Shot 2014-12-07 at 2.59.01 AM Screen Shot 2014-12-07 at 2.59.31 AM Screen Shot 2014-12-07 at 3.00.52 AM

    Screen Shot 2014-12-07 at 3.01.32 AM
     Screen Shot 2014-12-07 at 2.59.11 AM

    Around the corner from my apartment there’s a German Lutheran church that puts on a beer garden in their parking lot at Christmas. There’s a mix of expatriate Germans (in jeans and T-shirts) and local German-Americans (in lederhosen and fedoras) along with the usual San Francisco Hindus, Buddhists, and seriously lapsed Catholics (that would be me), but all are welcome. The beer, bratwurst and kitsch oompah band are all pretty good.

    Screen Shot 2014-12-03 at 7.22.42 PM Screen Shot 2014-12-07 at 3.44.27 AM
     Screen Shot 2014-12-07 at 3.43.32 AM Screen Shot 2014-12-03 at 7.22.28 PM Screen Shot 2014-12-07 at 3.45.10 AM

    This is Alfonso’s Cafe. It’s basically a shed in an old parking lot in a not-so-great suburban location. He set out some patio furniture, potted plants, and a shade structure and he manages to earn a respectable living. No one will ever confuse Alfonso’s place with a Parisian cafe, but it gets the job done and truly makes his neighborhood a better place compared to a dead parking lot. It’s Good Enough Urbanism. If all goes well Alfonso may eventually graduate to something bigger and more substantial. If he had to start with the entire armature of a full scale restaurant he may never have been able to pull together the money to get started. Alfonso’s Cafe is actually an in-between step, one level above a push cart or food truck, but one step down from something bigger and fancier.

    My point is that many of the just-scraping-by locations are ripe for reinvention as incubators for small family owned mom and pop businesses if the local authorities cut folks some slack. Not everything will work, but there isn’t much to lose in trying.

    John Sanphillippo lives in San Francisco and blogs about urbanism, adaptation, and resilience at granolashotgun.com. He’s a member of the Congress for New Urbanism, films videos for faircompanies.com, and is a regular contributor to Strongtowns.org. He earns his living by buying, renovating, and renting undervalued properties in places that have good long term prospects. He is a graduate of Rutgers University.

  • Two Chicagos, Defined

    Years ago, when I first started working as a planner for the City of Chicago, my primary responsibility was working with community organizations that received Community Development Block Grant (CDBG) funding for commercial revitalization activities.  This being CDBG funding, our work was constrained to areas of the city where 51% or more of households earned less than the median household income for the Chicago metro area.  In the early 1990’s, this hardly interfered with our work — outside of the Gold Coast, the Near North Side, Lincoln Park, Lakeview and a few parts of the Northwest and Southwest sides, we were able to grant CDBG funding to virtually the entire city.

    Fast forward twenty years.  Chicago’s transition from Rust Belt Capital to Global City has been unparalleled.  Where there once had been large swaths of middle-class, working-class and impoverished neighborhoods, with high-income enclaves, there are now nearly as many high-income neighborhoods as there are of the other three.  Perhaps someone who moved to Chicago post-1995 and lives in one of the up-and-coming areas is vaguely aware of this, but anyone who was here before then is quite right to be astounded.

    Despite Chicago’s transformation, it’s been pretty well-documented that not all parts of the city have benefited.  The battle over the closing of nearly 50 schools, mostly located in the city’s poorer South and West side neighborhoods, brought this to light, as did Chicago’s high-profile murder and violent crime rates through 2013 (which, to date in 2014, have gone down dramatically).  Inequalities and disparities became evident in both areas; University of Chicago graduate student and blogger Daniel Kay Hertz brought the disparities to light with his analysis of violent crime in Chicago.  As he said in his piece:

    Over the last twenty years, at the same time as overall crime has declined, the inequality of violence in Chicago has skyrocketed. There have always been safer and more dangerous areas here, as there are everywhere; but the gap between them is way, way bigger now than it used to be.

    Over the last two decades a new but undefined paradigm has emerged, the one of “Two Chicagos”.  This is probably best explained once again by Dan Hertz, who recounted an overheard conversation on the L:

    I was on the train earlier this week, and two white men got on and asked their neighbors, who were two black women, how to get to a hotel. The women told them. And then began a sort of stock conversation that Chicagoans have with tourists: How do you like the weather, ha ha? The men, who were from Atlanta, did not like it. Have you been on a subway before? Yes, but not often. Would you come back? Oh, yes. We love Chicago, the men said.

    The men reached their station, and left.

    One woman said to the other: I hate it when people say that – I love Chicago. No, you don’t. You love downtown and the North Side. The other woman said, Uh huh. 

    That is a frequent sentiment of those who live on the other side of the invisible divide in Chicago.  But what, exactly, is that divide?  Where are the boundaries?  Exactly how deep are the difference?

    I took a stab at trying to figure this out.

    I compared some socio-economic statistics for the 56 zip codes in Chicago against medians and averages for the entire Chicago metro area (Indiana and Wisconsin excluded).  The differences are stark.

    Let’s start by looking at maps of the areas of examination.  Here is the seven-county Illinois portion of Chicago’s metro area, with Chicago etched in:

    I gathered data for all suburban municipalities and all City of Chicago zip codes within this area, for five variables — population, non-white population percentage, median household income, and median home value, and bachelor’s degree or more for persons 25+.  The data comes from the 2011 U.S. Census American Community Survey.  After collecting that data, I established an “average of medians” or “average of averages” to get a baseline for the metro area, and an understanding of how jurisdictions or zip codes would compare to one another.  One fairly big caveat — an average of medians or average of averages weighs all jurisdictions equally, skewing the numbers higher due to the number of small but well-to-do suburban municipalities.  So while the 2011 actual median household income for the seven-county area overall was $61,491, the average of medians was $74,731.  But since all data is expressed this way, differences are negated.

    Next, I looked for Chicago zip codes that were above the metro area average in at least one of three categories — median household income, median home value, and bachelor’s degree or more for persons 25+.  These are the higher income neighborhoods that can be called “Global Chicago”.  Within the city, they look like this, in yellow:

    Most Chicagoans would recognize this as the wealthier parts of the city.  It stretches from the far Northwest Side eastward to the lake, south to downtown and continuing south before ending in the Hyde Park neighborhood on the South Side.  Again, I included all zip codes that were above the metro average for at least one of the three categories I examined, so not all communities are the same.  Hyde Park, for example, is here because it has high educational attainment, but is below the average for income and home value.  The same applies to Rogers Park and Edgewater on the city’s northern border with Evanston.  Jefferson Park, Norwood Park and Sauganash, on the other hand, located on the Northwest Side, rank highly in home value but lower for income and educational attainment.

    Taken together, you can see how “Global Chicago” compares with the Illinois portion of the metro area, the metro area excluding Chicago to give you Suburban Chicago, and the balance of the city beyond “Global Chicago” that I’ve called “Rust Belt Chicago”:

    The differences are indeed stark.  “Global Chicago” is on par with the Chicago suburbs and the metro area overall in terms of income, and has a lower percentage of minority residents compared to the metro area.  Interestingly, “Global Chicago” has a much higher home value and educational attainment when compared to the metro area overall or the ‘burbs.  Meanwhile, “Rust Belt Chicago” lags far behind.  “Rust Belt Chicago” has a large majority-minority population, has an income nearly one-half as much as the suburban households, and has only one-third as many college graduates as “Global Chicago”.

    I decided to take this analysis a little further and determine if there is a core to “Global Chicago”, and how it would compare to the rest of the city.  I collected data for zip codes that exceeded the metro average in two or more of the three categories.  That produced this map:

    And this table:

    Here, a “Super Global Chicago” compares favorably with the ‘burbs in terms of income, but far exceeds it in terms of home value and educational attainment.  Including some of the peripheral areas of the previous “Global Chicago” with the previous “Rust Belt Chicago” to produce an “Average Chicago” leads to some gains, but it still lags far behind the other slices of the metro area.

    Right now, the CNN series “Chicagoland” is doing its best to illustrate the “Two Chicagos” meme, highlighting blues festivals and Stanley Cup championship celebrations on one end of town and school closures and endless crime on another.  However, these maps and tables may do a far better job of demonstrating the impact of past and current practices and policies on the city’s landscape.  In fact, I think Chicago’s example is one that will serve as a model, for better or worse, for other cities across the nation.

    In reality I see the “Two Chicagos” meme as overplayed.  Chicago may be better understood in thirds — one-third San Francisco, two-thirds Detroit.

    This post originally appeared at Corner Side Yard on March 18, 2014.

    Pete Saunders is a Detroit native who has worked as a public and private sector urban planner in the Chicago area for more than twenty years.  He is also the author of “The Corner Side Yard,” an urban planning blog that focuses on the redevelopment and revitalization of Rust Belt cities.

    Chicago photo by Bigstock.

  • Cities: Better for the Great Suburbanization

    Where Cities Grow: The Suburbs

    The massive exodus of people from rural areas to urban areas over the past 200 years has been called the "great urbanization." For more than two centuries, people have been leaving rural areas to live in cities (urban areas). The principal incentive has been economic. But most of this growth has not taken place close to city centers, but rather on or beyond the urban fringe in the suburbs (and exurbs). Appropriately, The Economist magazine refers to the urbanization trend as the "great suburbanization," in its December 6, 2014 issue (PLACES APART: The world is becoming ever more suburban, and the better for it).

    The preponderance of suburban growth is evident in high income world metropolitan areas. For decades, nearly all growth in nearly all cities has been in the suburbs. Some notable examples are London, Toronto, San Francisco, Portland, Tokyo, Zürich, and Seoul. The dominance of suburban growth is also evident in the major cities of the less developed world, from Sao Paulo and Mexico City, to Cairo, Manila, Jakarta, Beijing, and Kolkata (see the Evolving Urban Form series). The Economist describes the substantial spatial expansion of residences and jobs in Chennai (formerly Madras), a soon-to-be megacity in India.

    Growing Cities Become Less Dense

    The Economist quotes New York University geographer Shlomo Angel, whose groundbreaking work (such as in Planet of Cities) indicates that "almost every city is becoming  less dense." Angel also shows that, contrary to the popular perception of increasing densities, cities become less dense as they add more population. This extends even to the lowest income cities, such as Addis Abeba (Ethiopia), where the population has increased more than 250 percent since the middle 1970s, while the urban population density has declined more than 70 percent. The rapidly growing cities of China exhibit the same tendency, where, according to The Economist: "Mr. Angel finds that population densities tend to drop when Chinese cities knock down cheaply built walk-up apartments and replace them with high towers."

    Suburbs in the United States

    In the United States, The Economist says that more than half of Americans live in suburbs. In fact, this is an understatement, owing to the common error of classifying "principal cities" as urban core, when many are, in fact, suburban. The Office of Management and Budget established the "principal cities" designation to replace the former "central city" versus suburb classification. This was in recognition of the fact that employment patterns in US metropolitan areas had become polycentric, with suburban employment centers, which along with central cities were designated as "principal cities."

    The absurdity of using "principal cities" as a synonym for central cities is illustrated by the broad expanses of post-1950 suburbanization now classified, with genuine core cities like New York or Chicago, as principal cities such like Lakewood, New Jersey (New York metropolitan area), Hoffman Estates (Chicago), Mesa (Phoenix), Arlington (Dallas-Fort Worth), Reston (Washington) and Hillsboro (Portland). In fact more than 85 percent of major metropolitan area (over 1 million population) residents live areas that are functionally suburban or exurban according to our small area analysis ("City Sector Model").

    Urban core growth rates have improved since 2010, which is an encouraging sign. Yet, core city jurisdictions account for less than 30 percent of metropolitan area growth, as Richard Morrill has shown. The Economist points out factors that could prevent this long overdue improvement from being sustained in the future.

    • Schools are "still often dire in the middles of cities," according to The Economist. Any hope of keeping most young families as they raise children seems impossible until core cities take on the politically challenging task of school reform.
    • The Economist also notes the huge government employee pension obligations of some large core cities, suggesting the necessity of cutting services or raising taxes. "Both answers were likely to drive residents to nearby suburbs, making the problem worse. No number of trams, coffee shops or urban hipsters will save cities that slip into this whirlpool." The Economist specifically cites Chicago and New York, but could have added many more examples both in this country and outside.

    Limiting Sprawl and Limiting Opportunity

    The Economist is refreshingly direct in its characterization of attempts to stop urban spatial expansion ("urban sprawl"). "Suburbs rarely cease growing of their own accord. The only reliable way to stop them, it turns out, is to stop them forcefully. But the consequences of doing that are severe."  The Economist: chronicles the experience of London, with its "greenbelt" ("urban growth boundary"): "Because of the green belt London has almost no modern suburban houses and very high property prices."

    The social consequences have been massive. "The freezing of London’s suburbs has probably aided the revival of inner-London neighbourhoods like Brixton. It has also forced many people into undignified homes, widened the wealth gap between property owners and everyone else, and enriched rentiers." Housing is typically the largest share of household expenditures and raising its price reduces discretionary incomes, while increasing poverty. In London, The Economist says that "To provide desperately needed cheap housing, garages and sheds there are being converted into tiny houses," quoting historian John Hickman who calls them “shanty towns”.

    Higher house prices and lower discretionary incomes are not limited to London. Among the 85 major metropolitan areas covered in the 10th Annual Demographia International Housing Affordability Survey, all 24 of those with "severely unaffordable" housing have London-style land-use regulation or similar land use restrictions. These financial reverses are not limited to suburban households, since urban containment policies are associated with substantial house price increases in urban cores as much as in suburbs.

    "Doom Mongering" About the Suburbs

    Oblivious to this revealed preference for residential and often commercial suburban location, many retro – urbanists, including many well placed, have viewed the suburbs with "concern and disdain," according to The Economist. Since the Great Financial Crisis, The Economist notes that this has turned to "doom-mongering."

    The Economist summarily dismisses suburban doom doctrine: "Those who argue that suburbia is dying are wrong on the facts; those who say it is doomed by the superiority of higher-density life make a far from convincing case."

    The Future

    In the editorial leader, The Economist, suggests: A wiser policy would be to plan for huge expansion. Acquire strips of land for roads and railways, and chunks for parks, before the city sprawls into them.

    The Economist adds: This is not the dirigisme (government planning) of the new-town planner—that confident soul who believes he knows where people will want to live and work, and how they will get from one to the other. It is the realism needed to manage the inevitable.

    The Economist continues that the suburbs have worked well in the West and are spreading, concluding that: We should all look forward to the time when Chinese and Indian teenagers write sulky songs about the appalling dullness of suburbia.

    Wendell Cox is principal of Demographia, an international public policy and demographics firm. He is co-author of the "Demographia International Housing Affordability Survey" and author of "Demographia World Urban Areas" and "War on the Dream: How Anti-Sprawl Policy Threatens the Quality of Life." He was appointed to three terms on the Los Angeles County Transportation Commission, where he served with the leading city and county leadership as the only non-elected member. He was appointed to the Amtrak Reform Council to fill the unexpired term of Governor Christine Todd Whitman and has served as a visiting professor at the Conservatoire National des Arts et Metiers, a national university in Paris.

    Photo: Suburban Ho Chi Minh (Saigon), by author