Category: Urban Issues

  • Diverging Fortunes in Portland

    A recent New York Times Magazine had a story on Portland that featured Yours Truly. I recapitulated a few observations I’ve had over the years, including that it’s truly remarkable how a small city like Portland has captured so many people’s imagination, and also that “people move to Portland to move to Portland.”

    A Portland writer named Steve Duin appears to have had an aneurysm over the piece and, among other things, criticized my statement about why people move to Portland, saying:

    She quotes Aaron Renn, an urban-affairs analyst, who insists that while Los Angeles attracts starlets and New York the financiers, “People move to Portland to move to Portland,” as if the city is a space between Pacific Avenue and Park Place on the Monopoly board, not a vibrant, creative, accessible and accommodating urban scene.

    Which only proves that he completely missed the point. All I’m saying is what he’s saying in different words, namely that people move to Portland for its lifestyle and amenities. This is exactly what every Portland booster claims, namely that what they’ve created is attractional. I’m simply pointing out the obvious: people move to Portland primarily for lifestyle and leisure, not career or economic reasons. People move to Portland because they want to live there.

    Portland’s economy has actually picked up of late. Its unemployment fell below the national average in 2013 after having been above it for 14 straight years. But I want to highlight a disconnect between a couple measures of economic performance.

    I’ve written many times that Portland has done very well in terms of per capita GDP. In fact, from 2001 to 2013 (the maximum range of data available from the feds), Portland was #1 out of all 52 large metros in the US in its percentage increase in real per capita GDP.

    On the other hand, looking at how much of that economic value ends up in people’s pockets tells a different story. From 2001 to 2012 (I don’t think 2013 has been released yet), Portland only ranked 40th out of 52 in its percentage increase on this metric. Portland declined from a per capita income of 104.9% of the US average in 2001 to 98.6% in 2012.

    I threw this divergence into a quick chart:


    portland-gdp-vs-persinc

    It would be interesting to dig into these numbers. I did a quick back of the envelop calculation of total GDP growth by industry. Only a few industry totals are available, but the biggest gainer was Manufacturing, up 300%. Education, Health, and Social Assistance were #2, followed by Professional and Business Services. Natural Resources, Retail. Information, and FIRE were at the bottom.

    Speaking of San Jose, I see an even more remarkable divergence there. It was #2 in per capita GDP growth over the 2001-2013 time frame. Looking at the overall Bay Area total real GDP, it increased by 30.1% from 2001 to 2013. Keep in mind I’m using the inflation adjusted figured here, so there’s no inflation in that metric. But at the same time the Bay Area lost 2.4% of its jobs.

    The Bay Area grew its economy by almost a third while shedding over 75,000 jobs. Pretty remarkable.

    Aaron M. Renn is an independent writer on urban affairs and the founder of Telestrian, a data analysis and mapping tool. He writes at The Urbanophile, where this piece originally appeared.

    Portland Oregon” by Jamidwyer – Own work. Licensed under Public domain via Wikimedia Commons

  • New Commuting Data Shows Gain by Individual Modes

    The newly released American Community Survey data for 2013 indicates little change in commuting patterns since 2010, a result that is to be expected in a period as short as three years. Among the 52 major metropolitan areas (over 1 million population), driving alone increased to 73.6% of commuting (including all travel modes and working at home). The one mode that experienced the largest drop was carpools, where the share of commuting dropped from 9.6% in 2010 to 9.0% in 2013. Doubtless most of the carpool losses represented gains in driving alone and transit. Transit grew, increasing from a market share of 7.9% in 2010 to 8.1% in 2013 in major metropolitan areas; similarly working at home increased from 4.4% to 4.6%, an increase similar to that of transit (Figure 1). Bicycles increased from 0.6% to 0.7%, while walking remained constant at 2.8%.

    Transit: Historical Context

    Transit has always received considerable media attention in commuting analyses. Part of this is because of the comparative labor efficiency (not necessarily cost efficiency) of transit in high-volume corridors leading to the nation’s largest downtown areas. Part of the attention is also due to the "positive spin" that has accompanied transit ridership press releases. An American Public Transportation Association press release earlier in the year, which claimed record ridership, have evoked a surprisingly strong response from some quarters: For example, academics David King, Michael Manville and Michael Smart wrote in the Washington Post:"We are strong supporters of public transportation, but misguided optimism about transit’s resurgence helps neither transit users nor the larger traveling public." They concluded that transit trips per capita had actually declined in the past 5 years. 

    Nonetheless, transit remains well below its historic norms. The first commute data was in the 1960 census and indicated a 12.6% national market share for transit for the entire U.S. population. By 1990, transit’s national market share had dropped to 5.1%. After dropping to 4.6% in 2000, transit recovered to 5.2% in 2012. But clearly the historical decline of transit’s market share has at least been halted (Figure 2).

    Even so, in a rapidly expanding market, many more people have begun driving alone than using transit. More than 47 million more commuters drive alone today than in 1980, while the transit increased about 1.4 million commuters over the same time period.

    The largest decline occurred before 1960. Transit’s work trip market share was probably much higher in 1940, but the necessary data was not collected in the census, just before World War II and the great automobile-oriented suburbanization. In 1940, overall urban transit travel (passenger miles all day, not just commutes) is estimated to have been twice that of 1960 and nearly 10 times that of today.

    Transit’s 2010-2013 Trend

    To a remarkable extent, transit continues to be a "New York story." Approximately 40% of all transit commuting is in the New York metropolitan area. New York’s 2.9 million transit commuters near six times that of second place Chicago. Transit accounts for 30.9% of commuting in New York. San Francisco ranks second at 16.1% and Washington third at 14.2%. Only three other cities, Boston (12.8%), Chicago (11.8), and Philadelphia (10.0%) have transit commute shares of 10% or more. 

    From 2010 to 2013, transit added approximately 375,000 new commuters. Approximately 40% of the entire nation’s transit commuting increase occurred in the New York metropolitan area. This was included in the predictable concentration (80%) of ridership gains in the transit legacy metropolitan areas, which are the six with transit market shares of 10% or more. Combined, these cities added 300,000 commuters, 89%, on the large rail systems that feed the nation’s largest downtown areas.

    Perhaps surprisingly, Seattle broke into the top five, edging out legacy metropolitan areas (Figure 3) Philadelphia and Washington. Seattle has a newer light rail and commuter rail system. Even so, the bulk of the gain in Seattle was not on the rail system. Approximately 80% of its transit commuter growth was on non-rail modes. Seattle has three major public bus systems, a ferry system and the newer Microsoft private bus system that serves its employment centers throughout the metropolitan area. All of the new transit commuters in eighth ranked Miami were on non-rail modes, despite its large and relatively new rail system. New rail city Phoenix (10th) also experienced the bulk of its new commuting on non-rail modes (93%). Rail accounted for most of the gain in San Jose (9th), with a 58% of the total  The transit market shares in Miami, San Jose and Phoenix are all below the national average of 5.2%.

    Outside the six transit legacy metropolitan areas, gains were far more modest, at approximately 75,000. Seattle, Miami, San Jose, and Phoenix accounted for nearly 60,000 of this gain, leaving only 15,000 for the other 42 major metropolitan areas, including Los Angeles, which had a 5,000 loss. Los Angeles now has a transit work trip market share of 5.8%, below the 5.9% in 1980 when the Los Angeles County Transportation Commission approved the funding for its rail system (the result of my amendment, see "Transit in Los Angeles"). Los Angeles is falling far short of its Matt Yglesias characterization as the "next great mass-transit city."

    Since 2000, the national trend has been similar. Nearly 80% of the increase in transit commuting has been in the transit legacy metropolitan areas, where transit’s share has risen from 17% to 20%. These areas accounted for only 23% of the major metropolitan area growth since 2000. By contrast, 77% of the major metropolitan area growth has been in the 46 other metropolitan areas, where transit’s share of commuting has remained at 3.2% since 2000. There are limits to how far the legacy metropolitan areas can drive up transit’s national market share.

    Prospects for Commuting

    At a broader level, the new data shows the continuing trend toward individual mode commuting, as opposed to shared modes. Between 2010 and 2013, personal modes (driving alone, bicycles, walking and working at home) increased from 82.3% to 82.7% of all commuting. Shared modes (carpools and transit) declined from 17.7% of commuting to 17.3%. These data exclude the "other modes" category (1.2% of commuting) because it includes both personal and shared commuting. None of this should be surprising, since one of the best ways to improve productivity, both personal and in the economy, is to minimize travel time for necessary activities throughout the metropolitan area (labor market).

    Wendell Cox is principal of Demographia, an international public policy and demographics firm. He is co-author of the "Demographia International Housing Affordability Survey" and author of "Demographia World Urban Areas" and "War on the Dream: How Anti-Sprawl Policy Threatens the Quality of Life." He was appointed to three terms on the Los Angeles County Transportation Commission, where he served with the leading city and county leadership as the only non-elected member. He was appointed to the Amtrak Reform Council to fill the unexpired term of Governor Christine Todd Whitman and has served as a visiting professor at the Conservatoire National des Arts et Metiers, a national university in Paris.

    Photograph: DART light rail train in downtown Dallas (by author)

  • The Sick Man Of Europe Is Europe

    The recent near breakup of the United Kingdom — something inconceivable just a decade ago — reflects a deep, pervasive problem of identity throughout the EU. The once vaunted European sense of common destiny is decomposing. Other separatist movements are on the march, most notably in Catalonia, Flanders and northern Italy.

    Throughout the continent, public support for a united Europe fell sharply last year. Opposition to greater integration has emerged, with anti-EU parties gaining support in countries as diverse as the United Kingdom, Greece, Germany and France.

    The new reality is epitomized by France’s ascendant far-right political figure, Marine Le Pen, who is now leading in many polls to win the next presidential election. “The people have spoken loud and clear … they no longer want to be led by those outside our borders, by EU commissioners and technocrats who are unelected,” she declared recently. “They want to be protected from globalization and take back the reins of their destiny.”

    These attitudes suggest that the EU could be devolving from a nascent super-state to something that increasingly resembles the Holy Roman Empire, a fragmented landscape of small, unimportant states wrapped in a unitary, but ephemeral crepe. This challenges the view of some Americans, particularly but not only on the left, who see Europe as a role model for the U.S.

    Not long ago progressive authors like Jeremy Rifkin could project the European Union to be one of the world’s great and admirable powers. Today, Rifkin’s 2005 tome “The European Dream,” and a host of similar tracts, seem absurd amid growing political unrest and spreading economic stagnation.

    Economic Decline

    Some pundits, such as Paul Krugman, routinely describe Europe’s approach to economic, environment and social policy as more enlightened than America’s. Wherever possible, progressives push for European-style action in areas such as curbing carbon emissionsand rapidly converting to “green” energy.

    Yet these policies are not working. The one large relatively fast-growing economy in Europe (excluding Turkey) is Poland.

    Several years ago Germany and the Netherlands were exemplars as opposed to the much-disdained PIGS (Portugal, Italy, Greece and Spain). But German growth rates have plummeted, going negative in the last quarter, along with France and Italy. More stagnation is likely as energy costs surge and key export markets, notably in Russia and China, begin to contract. Today, the “sick man” of Europe is not any one country, or collection of countries; the “sick man of Europe” is Europe.

    Europe’s poor economy stems in large part from policy. The strong welfare state so admired by progressives here has also made Europe a very expensive place to do business. High taxes and welfare costs, long tolerable in an efficient economy like Germany, have a way of catching up with companies and countries. This has been particularly notable after the financial crisis; since 2008 the unemployment rate has shot up 5 percentage points while dropping steadily in the Untied States.

    The European-wide embrace of “green” energy policies has been tough particularly for manufacturers. Under Chancellor Merkel, Germany has embraced a massive shift to green energy that has helped raise electricity costs for companies by 60% over the past five years to double the rates in the United States.

    The Russians, Europe’s one relatively inexpensive energy source, may have calculated that, in the long run, China may prove a better customer than the Europeans. Ironically, some European countries, including Germany, have been forced to boost their use of coal, certainly not much of a climate change win, to make up for shortfalls created by shuttering nuclear plants and overreliance on often erratic green energy.

    Ultimately, high energy prices tend to fall most painfully on the middle and working classes in the form of higher electricity bills. Some may see their jobs threatened as European employers look forlower-cost alternatives, such as in the energy rich South and middle of the United States.

    Demographic Disasters

    The young are arguably the biggest losers in Europe’s decline. Even though birthrates are very low throughout much of Europe from Germany, Italy and Spain to the eastern countries, those now coming into the workforce face extraordinarily high levels of unemployment, topping 50% in some places. It’s no wonder that some are dubbing them a “lost generation.”

    The combination of low birth rates and declining prospects contribute to rising concerns about immigration. Immigration has always been a more contentious issue in Europe, where many countries are dominated by a single ethnic group and the residents prefer something closer to homogeneity. This nativism has been painfully evidenced in recent decades from everything from the violent breakup of Yugoslavia and the far more civilized dismantling of Czechoslovakia to assaults on the Roma in France, the Czech Republic, Greece and other countries.

    In Britain, the anti-immigrant and anti-EU U.K. Independence Party’s recent strong showing in the European Parliament elections reflected this concern. Diversity in London, which by some counts has the world’s largest concentration of immigrants, thrills London’s media and business communities but stirs great resentment, particularly among working and middle-class voters. The fact that by some estimates that most new jobs generated in the recovery have gone to immigrants has not warmed sentiments.

    A Region Without Meaning

    Chancellor Merkel has noted that “multi-culturalism” in Germany has “utterly failed.” Muslims in Europe drifting to ISIS is just one reflection of the continent’s weakness. The slow integration of immigrants into the economy, even in relatively prosperous, enlightened countries like Sweden, reflects also the inability of Europeans to integrate the newcomers who could help provide a workforce and consumer base in the future.

    Perhaps the greatest challenge to Europe is not demographics, economics or energy, but one of identity. In highly secularized Europe, Christianity, which bound the continent around some similar values, is increasingly rarely practiced or believed. More Czechs, for example, believe in UFOs than in God. Outside of some vaguely anti-American, neo-druid communitarianism among some, there’s not much holding Europeans together.

    All this suggests that Americans would do better than look to Europe for future solutions to our own problems. However attractive the European model may seem to our pundit class, the reality on the ground shows something more to be avoided than embraced.

    This piece originally appeared at Forbes.

    Joel Kotkin is executive editor of NewGeography.com and Distinguished Presidential Fellow in Urban Futures at Chapman University, and a member of the editorial board of the Orange County Register. His newest book, The New Class Conflict is now available at Amazon and Telos Press. He is author of The City: A Global History and The Next Hundred Million: America in 2050. His most recent study, The Rise of Postfamilialism, has been widely discussed and distributed internationally. He lives in Los Angeles, CA.

  • Millennials: A Powerful, Suburban Living Generation

    The latest survey data on the  living preferences of the Millennial generation (born 1982-2003) once again validates the picture of a cohort  that, contrary to urban legend, actually prefers the suburbs, even as they prepare to shape the suburbs in their own image. We and others have previously made this data-based point on this website. The results of the survey challenges the often wishful thinking of academics and ideologues who yearn for a more urbanized, denser America. 

    The Demand Institute commissioned the Nielsen company, to survey 1000 Millennial households about where and how they plan to live over the next five years, The results suggest a major transformation of the country’s housing markets is about to take place that will benefit those who know and understand Millennials and respond to their desires.

    There are 13.3 million households headed by Millennials today. During the next five years that number is projected by the Demand Institute to increase by over 60% to 21.6 million as many Millennials take their first steps toward marriage and family formation. While only 30% of the 18-29 year olds interviewed were now married, seven out of ten said they expected to be within the next five years. A majority (55%) also anticipate becoming parents during this period. As a result, 71% of those interviewed said, that over the next five years, they planned on moving to a  better home or apartment; about half expect to “own, not rent” their new home.   

    This burst of family formation, of course, is quite typical for thirty-year olds, a plateau that millions of Millennials will reach in the next half-decade. And, rather than diverge from the pattern, Millennials are following it in their own way. This is good news long term for the economy since their major lifestyle changes will lead to a burst of spending by Millennials. The Demand Institute’s report suggests that, between now and 2018 the generation will spend $1.6 trillion on home purchases and $600 billion in rent. The big questions are where will they spend all that money and what will they spend it on?

    The Suburbs is the clear answer to the first question. Forty-eight percent of the Millennials interviewed said they planned on moving to the suburbs, while only 38% said they would be moving into large urban areas.  A scant 14% planned to move to rural environments.

    The type of suburban living these Millennials favor, however, is a little different than many of the developments builders are planning to offer. Sixty-one percent say they are looking for more space in their next home than they currently enjoy. An additional 24% want at least the same amount of space. A mere 15% express a desire to live in less space, something often assumed by retro-urbanists, in a presumably more crowded urban environment. Furthermore, although substantial numbers prefer having major amenities within walking distance, most Millennials say they are willing to take a “short drive” to restaurants (54%), grocery stores (61%), and even shopping centers (57%). This suggests that new “walkable” suburbs, including large planned developments on the fringe and Millennial-“gentrified” close in suburbs, all with single family homes, are likely to be the places that benefit most from this wave of Millennial family formation and spending on housing.  

    The single biggest barrier to the country enjoying this burst of new spending remains the Millennial generation’s unique burden of student debt. While three-fourths of Millennials believe home ownership is both an important long term goal and a good investment, only 36% believe they will be able to buy their next home, rather than rent. The impact of student debt on this purchasing decision can clearly be seen in the current behavior of 30-35 year old Millennials.  Only half of those with student debt now own homes, while two-thirds of those lucky enough to graduate college without such debt are home owners. This clearly indicates that student debt reform is the single most important issue facing realtors and home builders future success. It should be their priority in Washington.

    In the meantime, there may be some creative ways to confront this problem; 69% of the four-in-ten Millennials who believe they could not qualify for a traditional mortgage are open to leasing a new home with an option to buy it later.  

    The results of this survey make it clear that the nation’s housing future remains in its suburbs. Those communities which can offer Millennials the type of lifestyle they desire will be rewarded with growth. Those that cling to outdated notions of what constitutes urban or suburban living will find it difficult to compete for the Millennial generation’s housing dollar and the vibrant economic activity that will flow from their choices.

    Morley Winograd and Michael D. Hais are co-authors of the Kindle book Millennial Majority, along with Millennial Momentum: How a New Generation is Remaking America and Millennial Makeover: MySpace, YouTube, and the Future of American Politics and fellows of NDN and the New Policy Institute.

  • Metro Area Gross Domestic Product

    The Bureau of Economic Analysis is out with the preliminary numbers for 2013 metro area GDP (see the press release). Here is a spreadsheet with per capita GDP data for all large metros.

    We’ve now got enough data that it’s worthwhile to start tracking the trend vs. a 2010 base instead of 2000. With that, here are the top ten large metros by real per capita GDP:

    Rank Metro Area 2013
    1 San Jose-Sunnyvale-Santa Clara, CA 100,115
    2 San Francisco-Oakland-Hayward, CA 78,844
    3 Seattle-Tacoma-Bellevue, WA 74,701
    4 Boston-Cambridge-Newton, MA-NH 74,643
    5 Washington-Arlington-Alexandria, DC-VA-MD-WV 73,461
    6 Houston-The Woodlands-Sugar Land, TX 72,258
    7 New York-Newark-Jersey City, NY-NJ-PA 69,074
    8 Portland-Vancouver-Hillsboro, OR-WA 68,810
    9 Hartford-West Hartford-East Hartford, CT 66,870
    10 Salt Lake City, UT 62,008

    San Jose cracks the $100,000 barrier, though that’s in part to the Bay Area being split into two metros, and the base year for constant dollar calculations getting switched from 2005 to 2009. But still impressive.

    This list is similar to what we’ve seen before. But how are things changing? Let’s look at the top ten large metros for percent change in their real per capita GDP from 2010 to 2013:

    Rank Metro Area 2010 2013 Pct Change
    1 Houston-The Woodlands-Sugar Land, TX 63,816 72,258 13.23%
    2 San Jose-Sunnyvale-Santa Clara, CA 89,806 100,115 11.48%
    3 Portland-Vancouver-Hillsboro, OR-WA 63,025 68,810 9.18%
    4 Columbus, OH 50,370 54,493 8.19%
    5 Grand Rapids-Wyoming, MI 41,248 44,482 7.84%
    6 Charlotte-Concord-Gastonia, NC-SC 51,819 55,802 7.69%
    7 Oklahoma City, OK 45,993 49,441 7.50%
    8 Salt Lake City, UT 57,790 62,008 7.30%
    9 Nashville-Davidson–Murfreesboro–Franklin, TN 50,464 54,112 7.23%
    10 Detroit-Warren-Dearborn, MI 46,314 49,653 7.21%

    A full map of this metric is below.

    percent-change-per-capita-gdp-2010-2013
    Percent change in real per capita GDP, 2010-2013.

    Houston’s #1 showing is very impressive. This is a per capita value remember, so they aren’t on top just by virtue of adding lots of people. And they are in the top ten for 2013 per capita, so it’s not like they started on a low base or something.

    Portland and San Jose continues their strong showing in this metric (more on these metros to come next week). Two metros in Michigan made the top ten, though some of that I’d speculate must come from the auto industry recovery, meaning it’s cyclical in nature.

    I’ll throw in the total real GDP figures as well, but obviously these heavily align to population. Here are the ten biggest metro GDPs in 2013 (amounts in millions of dollars):

    Row Geography 2013
    1 New York-Newark-Jersey City, NY-NJ-PA 1,377,989
    2 Los Angeles-Long Beach-Anaheim, CA 775,967
    3 Chicago-Naperville-Elgin, IL-IN-WI 550,793
    4 Houston-The Woodlands-Sugar Land, TX 456,177
    5 Washington-Arlington-Alexandria, DC-VA-MD-WV 437,085
    6 Dallas-Fort Worth-Arlington, TX 413,627
    7 Philadelphia-Camden-Wilmington, PA-NJ-DE-MD 358,091
    8 San Francisco-Oakland-Hayward, CA 356,081
    9 Boston-Cambridge-Newton, MA-NH 349,652
    10 Atlanta-Sandy Springs-Roswell, GA 288,175

    And the top ten in total real GDP growth percentage, 2010-2013.

    Rank Metro Area 2010 2013 Pct Change
    1 Houston-The Woodlands-Sugar Land, TX 379,595 456,177 20.17%
    2 San Jose-Sunnyvale-Santa Clara, CA 165,435 192,184 16.17%
    3 Austin-Round Rock, TX 86,546 98,126 13.38%
    4 Portland-Vancouver-Hillsboro, OR-WA 140,717 159,266 13.18%
    5 Charlotte-Concord-Gastonia, NC-SC 115,229 130,318 13.09%
    6 Oklahoma City, OK 57,856 65,246 12.77%
    7 Nashville-Davidson–Murfreesboro–Franklin, TN 84,572 95,124 12.48%
    8 Dallas-Fort Worth-Arlington, TX 368,015 413,627 12.39%
    9 Salt Lake City, UT 63,090 70,719 12.09%
    10 San Antonio-New Braunfels, TX 80,101 89,463 11.69%

    Richard Florida posted some thoughts on this data over at City Lab. I’m less bothered than he is by Washington, DC’s poor performance, however. Much like Detroit’s cyclical upswing, I think short term turbulence in DC from the sequester and fiscal challenges was to be expected.

    Aaron M. Renn is an independent writer on urban affairs and the founder of Telestrian, a data analysis and mapping tool. He writes at The Urbanophile.

  • Why Suburbia Irks Some Conservatives

    For generations, politicians of both parties – dating back at least to Republican Herbert Hoover and Democrat Franklin Roosevelt – generally supported the notion of suburban growth and the expansion of homeownership. “A nation of homeowners,” Franklin Roosevelt believed, “of people who own a real share in their land, is unconquerable.”

    Support for suburban growth, however, has ebbed dramatically, particularly among those self-styled progressives who claim FDR’s mantle. In California, greens, planners and their allies in the development community have supported legislation that tends to price single-family homes, the preference of some 70 percent of adults, well beyond the capacity of the vast majority of residents.

    Less well-noticed is that opposition to suburbs – usually characterized as “sprawl” – has been spreading to the conservative movement. Old-style Tories like author-philosopher Roger Scruton do not conceal their detestation of suburbia and favor, instead, European-style planning laws that force people to live “side by side.” Densely packed Paris and London, he points out, are clearly better places to visit for well-heeled tourists than Atlanta, Houston or Dallas.

    There may be more than a bit of class prejudice at work here. British Tories long havedisliked suburbs and their denizens. In a 1905 book, “The Suburbans,” the poet T.W.H. Crossland launched a vitriolic attack on the “low and inferior species,” the “soulless” class of “clerks” who were spreading into the new, comfortable houses in the suburbs, mucking up the aesthetics of the British countryside.

    Not surprisingly, many British conservatives, like Scruton, and his American counterparts frequently live in bucolic settings, and understandably want these crass suburbanites and their homes as far away as possible. Yet, there is precious little concern that – in their zeal to protect their property – they have also embraced policies that have engendered huge housing inflation, in places like greater London or the San Francisco Bay Area, that is among the most extreme in the high-income world.

    Of course, the conservative critique of suburbia does not rest only on aesthetic disdain for suburbs, but is usually linked to stated social and environmental concerns. “There’s no telling how many marriages were broken up over the stress of suburb-to-city commutes,” opines conservative author Matt Lewis in a recent article in The Week. In his mind, suburbs are not only aesthetically displeasing but also anti-family.

    What seems clear is that Lewis, and other new retro-urbanist conservatives, are simply parroting the basic urban legends of the smart-growth crowd and planners. If he actually researched the issue, he would learn that the average commutes of suburbanites tend to be shorter, according to an analysis of census data by demographer Wendell Cox, than those in denser, transit-oriented cities. The worst commuting times in America, it turns out, to be in places such as Queens and Staten Island, both located in New York City.

    Other conservatives also point to the alleged antisocial aspect of conservatism, a favored theme of new urbanists everywhere. A report co-written by the late conservative activist Paul Weyrich supported forcing “traditional designs for the places we live, work and shop,” which “will encourage traditional culture and morals,” such as community and family.

    Once again, however, a serious examination of research – as opposed to recitation of planners’ cant – shows that suburbanites, as University of California researchers found, tend to be more engaged with their neighbors than are people closer to the urban core. Similarly, a 2009 Pew study recently found that, among the various geographies in America, residents in suburbia were more “satisfied” than were either rural or urban residents.

    In working against suburbia, these conservatives are waging a war on middle-class America, not necessarily a smart political gambit. Overall, conventional suburban locations are home to three-quarters of the metropolitan population. And even this number is low, given that large parts of most large American cities – such as Los Angeles, Phoenix, Dallas, Kansas City and Houston – are themselves suburban in character, with low transit use and a housing stock primarily made up of single-family residences built during the auto-dominated postwar period. Only approximately 15 percent of residents in major metropolitan areas actually live in dense, transit-oriented communities.

    Given these numbers, one might think conservatives would take issue with progressive plans to circumvent preferences and market forces by constraining suburban and single-family home growth. They might spot a strategic opening to secure the urban periphery, the one area still up for grabs in American politics. In contrast, the blue core cities and red countryside have, for the most part, chosen sides, and both return huge consistent majorities to their preferred party.

    Lured by their own class prejudice, some conservatives nevertheless seem willing to abandon market forces, a supposed conservative virtue. In reality, imposing Draconian planning is not even necessary for the growth of density. In places that are have both liberal planning regimes and economic growth, such as Houston and Dallas, there has been a more rapid increase in multifamily housing than in such cities such as Boston, Los Angeles, San Francisco or New York. The cost is just much lower.

    Unfortunately, few mainstream conservatives apparently bother to study such things, and, as prisoners of the conventional wisdom, embrace the notion that, on economic grounds, suburbs are becoming irrelevant. Some, such as the libertarian economist Tyler Cowen, suggest that a stagnating post-recession America has to adjust to what has been described as a “new normal” of declining expectations.

    With middle-class opportunity seen as largely moribund, many financial interests see America becoming a “rentership” society; for these rent-seeking capitalists, the death of suburbs would be not only morally correct, but also economically advantageous.

    It’s hard for me, even as a nonconservative, to see how this trajectory works for the Right.

    Renters, childless households, highly educated professionals, as well as poor service workers, clustering in dense cities are not exactly prime Republican voters. Without property, and with no reasons to be overly concerned with dysfunctional schools, the new urban population tilts increasingly, if anything, further to the left.

    Meanwhile, the middle-class homeowner, and those who aspire to this status, increasingly find themselves without a party or ideology that champions their interests. In exchange for the approval of the cognitive elites in the media, in academia and among planners, conservatives will have, once again, missed a chance to build a broad popular coalition that can overcome the “upstairs, downstairs” configuration that increasingly dominates the Democratic Party.

    Yet, there remains a great opportunity for either party that will appeal to, and appreciate, the suburban base. Conservative figures such as Ronald Reagan and Margaret Thatcher understood the connection between democracy and property ownership and upward mobility. Much the same could be said for traditional Democrats, from Roosevelt and Harry Truman, all the way to Bill Clinton.

    For all their faults, suburbs represent the epitome of the American Dream and the promise of upward mobility. That they can be improved, both socially and environmentally, is clear. This is already happening in new, mostly privately built, developments where the “ills” of suburbia – long commute distances, overuse of water and energy – are addressed by building new town centers, bringing employment closer to home, the use of more drought-resistant landscaping, promoting home-based business and developing expansive park systems. This seems more promising than following a negative agenda that seeks simply to force ever-denser housing and create heat-generating concrete jungles.

    The abandonment of the suburban ideal represents a lethal affront to the interests and preferences of the majority, as well as their basic aspirations. The forced march towards densification and ever more constricted planning augurs not a return to old republican values, as some conservatives hope, but the transformation of America from a broadly based property-owning democracy into something that more clearly resembles feudalism.

    This piece originally appeared at The Orange County Register.

    Joel Kotkin is executive editor of NewGeography.com and Distinguished Presidential Fellow in Urban Futures at Chapman University, and a member of the editorial board of the Orange County Register. His newest book, The New Class Conflict is now available at Amazon and Telos Press. He is author of The City: A Global History and The Next Hundred Million: America in 2050. His most recent study, The Rise of Postfamilialism, has been widely discussed and distributed internationally. He lives in Los Angeles, CA.

  • Paving Over Hunan? The Portland Model for China

    For two centuries, people have crowded into urban areas, seeking higher standards of living than prevail in the rural areas they abandoned. Nowhere is this truer than in China. In just four decades, it has risen from 17.4 percent to 55.6 percent urban, adding nearly 600 million city residents. This has been accomplished while lifting an unprecedented number of people out of poverty.  

    Yet in the future, China faces tough urbanization challenges. The United Nations forecasts that another 200 million residents will be added to the cities by 2035, increasing the urban population by nearly another one-third.

    Los Angeles Style Suburbs in China?

    For years, western planners have sought to impose their visions of the future on China’s cities (see: China Should Send the Western Planners Home). There are more recent rumblings from Britain. Writing in The Guardian, Bianca Bosker finds considerable fault with Chinese cities. In criticizing China’s perceived copying of US and European models, her article conveys an impression that detached housing (called "villas in China) makes up a large part of China’s suburbs, as in the United States ("Why Haven’t China’s Cities Learned from America’s Mistakes?" with an intriguing subtitle "Faceless estates. Sprawling suburbs. Soulless financial districts … are in vogue in China").

    Having traveled widely within all but two of China’s 25 largest cities, I would have to disagree. You have to look hard to find detached housing in China. This is quite unlike the case in US suburbs, as well as those of Japan, Britain, France, Germany, Canada, Australia and elsewhere.

    In fact, the suburban areas of Chinese cities are largely high-rise and mid-rise multi-family buildings, with their attendant high densities. Detached housing has accounted for between 4 and 6 percent of new housing floor space. The actual percentage of detached units is probably smaller, since their average floor space of detached housing is greater. The type of housing in the photographs at the bottom of the article (Figures 2 through 6) is typical of China’s suburbs.

    Bosker also criticizes about China’s "towers in the park" high-rise development, noting that "The desire to escape sardine conditions in these superblocks, where greenery often consists of sickly shrubs gasping between six-lane roads, has in turn multiplied the number of land-devouring compounds like Rancho Santa Fe." In fact, villa developments like Rancho Santa Fe, nearby Shanghai’s Honquiao Airport, are very high income enclaves, and small. Rancho Santa Fe itself occupies less than 90 acres and the gross average lot size is approximately one-quarter acre (1/10 hectare), smaller than the average middle income suburban lot in the United States. No ordinary “tower in the park" resident can afford to move to the pricey villa developments.

    California’s High Urban Densities

    The article also condemns the "urban sprawl" of Los Angeles and California (this is nothing new).  However, the reality is that Los Angeles is the most dense major urban area in the United States (and thus the least sprawling) and nearly as dense as Toronto. Further, California has the highest urban density of any state, leading even New York. The average urban density of the state and even that of smaller California cities, such as Fresno, Stockton, Modesto and Salinas, is more than that of urban planning Nirvana Portland (below).

    Los Angeles: Land of Gridlock?

    The article calls Los Angeles the "land of gridlock," and there is no doubt that its traffic is intense. Yet, Los Angeles ranks only in a 20th place tie with Paris out of 125 cities in the latest Tom Tom Traffic Index. Traffic is worse in Brussels and Rome, almost as bad in London and far worse in places like Moscow, Istanbul, Rio de Janeiro, Mexico City and Sao Paulo. In spite of the traffic congestion, Los Angeles has the shortest work trip travel times of any world megacity for which there is data, the result of its dispersed residential and employment pattern (call it "sprawl" if you like).

    In Los Angeles, suburban residents have shorter work travel times than people living in the urban cores, which is the general situation among US major metropolitan areas (more than 1,000,000 population). This is to be expected, since lower densities are associated with less traffic congestion and shorter travel times.

    Paving Over Hunan?

    Ms. Bosker suggests that China may be poised to follow the "Portland model." A planner is quoted: “Portland is a really great model.” That, I would suggest, depends on your perspective.

    The Portland model has its philosophical roots in the British Town and Country Planning Act of 1947. As early as 1973, Sir Peter Hall and his colleagues characterized the Act having had the "reverse effect" an important policy goal, to benefit less affluent households, by virtue of the house price escalation that ensued.

    Portland has drawn an urban growth boundary around the city beyond which development is generally prohibited, and within which there is insufficient space to maintain competitive land prices. Portland has also has sought to attract people out of their cars by both building an extensive light rail system and   loath to provide new highway capacity to meet demand.

    After more than 30 years of its urban containment ("smart growth") policy, Portland’s urban density remains at only 1,350 per square kilometer (3,500 per square mile), less than one-quarter that of China’s cities with more than 500,000 population (5,750 per square kilometer/14,900 per square mile). Los Angeles is twice as dense as Portland. Portland’s urban density is closer to that of the world’s most sprawling large urban area, Atlanta, than it is to that of Los Angeles. Planning whipping boy Houston is only 15 percent less dense than Portland.

    To equal Portland’s density, Chinese cities would need to expand their footprints by 210,000 square kilometers (80,000 square miles). This would require the equivalent of paving over Hunan province (Figure 1), the state of Minnesota or the combination of England and Scotland.

    Portland is no model to copy, unless all you care about is inputs (like light rail and not building freeways and suburban housing). The outputs tell a completely different story. In 1980 (the last data before the first light rail line was opened) 65.1 percent of commuters drove alone to work. By 2012, that figure had increased to 70.8 percent. Transit was down from 8.4 percent to 6.0 percent. Approximately one-quarter as many people worked at home as commuted by transit in 1980 (2.2 percent). By 2012, more people in the Portland metropolitan area worked at home than rode transit (6.4 percent).

    This is not surprising. Portland’s "model" transit system (now with five light rail lines) can get the average commuter to only 8 percent of the jobs in 45 minutes. This is not very attractive in contrast to travel by automobiles, which provides access to virtually 100 percent of the jobs in less time (30 minutes).

    Meanwhile, Portland’s anti-highway policies have been rewarded with some of the most rapidly increasing traffic congestion in the United States. In the early 1980s, Portland ranked 47th worst out of the 101 US urban areas ranked by the Texas A&M Transportation Institute. By 2011, Portland’s traffic congestion had deteriorated to sixth worst, a stunning failure for a city with a population that doesn’t even rank the top 20. Meanwhile, Houston, castigated for its wide freeways, has improved from the worst traffic congestion in the middle 1980s to four positions better than Portland (10th), despite adding having added three times as many new residents as Portland.

    American Cities

    If outputs are more important than inputs (which I suggest is true), then US cities do very well. They have the highest incomes in the world, occupying 36 of the top 50 positions in gross domestic product per capita. They have some of the most affordable housing in the world, if cities following the Portland model are excluded. They have shorter work trip commutes and less traffic congestion than their peers in other high income world nations. And, they are poised for huge progress in environmental protection. The US Department of Energy forecasts large reductions in gross greenhouse gas emission from the national automobile fleet in the coming decades.

    Overwhelmingly, the growth of cities happened because rural residents sought higher standards of living and an escape from lower incomes and poverty, in rural areas. Few, if any moved to cities for wise urban planning, for "soulful financial districts" or to commute by light rail. Overall, US city outputs correspond very well with the purpose of cities — which is why they attracted residents.

    China: Setting its Own Course

    No one could have predicted China’s urban progress that was to follow in the decades following Deng Xiao Ping’s assumption of power. China’s cities have provided for their growing number of citizens. By that standard, both Chinese and American cities have done very well. China has charted its own urbanization course and seems likely to do so in the future. It is unlikely to seek to follow the advice of western critics whose plans fail the needs of their own citizens, much those in a complex, rapidly changing place like China.

    Top photograph: Suburban development, Changsha, Hunan. (All photographs by author).

    Wendell Cox is principal of Demographia, an international public policy and demographics firm. He is co-author of the “Demographia International Housing Affordability Survey” and author of “Demographia World Urban Areas” and “War on the Dream: How Anti-Sprawl Policy Threatens the Quality of Life.” He was appointed to three terms on the Los Angeles County Transportation Commission, where he served with the leading city and county leadership as the only non-elected member. He was appointed to the Amtrak Reform Council to fill the unexpired term of Governor Christine Todd Whitman and has served as a visiting professor at the Conservatoire National des Arts et Metiers, a national university in Paris.

  • Brooklyn is Getting Poorer

    I’m trying to make more of an effort, whenever I write or talk about gentrification, to point out that the real issue is larger: that gentrification is only one aspect of income segregation – specifically, the part where the borders between rich and poor neighborhoods shift – and that the real problem is that we have such sharply defined rich and poor neighborhoods to begin with.

    I might also throw in that income segregation used to be much less severe.

    Anyway, one problem with our obsession with gentrification as the end-all of urban equity issues is that it discourages us from talking about other important things happening in our cities. In some instances, gentrification has become such a dominating narrative that it has completely erased broader trends that we really ought to be concerned about.

    Case in point: Brooklyn is getting poorer.

    Does that shock you? Were you under the impression that all of Brooklyn was in the process of becoming one giant pickle boutique? That would be forgivable, given that nearly every article filed from Brooklyn for a decade or so has been about gentrification. But no.

    I recently ran across a post from data-crunching blog extraordinaire Xenocrypt, which noted that from 1999 to 2011, median household income in Brooklyn fell from $42,852 to $42,752. That’s not a huge drop, obviously. The national median income fell from $56,000 to $50,000, so Brooklyn is actually catching up, sort of, to the country as a whole. But it still got poorer in absolute terms.

    Moreover, if you map (as Xenocrypt did) the borough’s neighborhoods by change in median income, you get a really striking picture:


    Credit: Xenocrypt.blogspot.com

    …which is that, indeed, a good three-fifths or so of Brooklyn is actually getting poorer. Have you read any articles about that? No, I will wager that you have not. Neither have I. I strongly suspect that is because they don’t exist – at least not in any outlet that might be considered mainstream.

    And what about housing prices?


    Brooklyn Gentrification Map: Increase, Decrease in Home Values 2004 vs. 2012
    Credit: http://www.citylimits.org/

    So in large parts of Brooklyn, real estate prices are falling.

    I have nothing particularly intelligent to say about this – these maps were news to me – except that it’s maybe the most dramatic example I’ve seen yet of just how limiting our fixation on gentrification is. I mean that both in a sort of journalistic sense, in that we’re being deprived of an accurate sense of what is actually going on in our cities, as well as from an advocate’s perspective: how can we claim to be working for fairer, more equitable, etc., cities, if we’re ignorant of their most basic economic and demographic changes?

    This post originally appeared in City Notes on May 3, 2014. Daniel Hertz is a masters student at the Harris School of Public Policy at the University of Chicago.

    Lead photo: “BK” by Theeditor93Own work. Licensed under CC BY-SA 3.0 via Wikimedia Commons.

  • Southern California Becoming Less Family-Friendly

    The British Talmudic scholar Abraham Cohen noted that, throughout history, children were thought of as “a precious loan from God to be guarded with loving and fateful care.” Yet, increasingly and, particularly, here in Southern California, we are rejecting this loan, and abandoning our role as parents.

    This, of course, is a process seen around the high-income world, and even in some developing countries. But, here in America, some regions are moving in this post-familial direction faster than others, and, sadly, Southern California, for the most part, is leading the trend.

    Historically, Southern California, as a lure first for domestic migrants and, later, for foreign immigrants, has been an incubator of families. As recently as 2000, the proportion of population ages 5-14 in Los Angeles and Orange counties stood at 16 percent, the sixth-highest level among the nation’s 52 largest metropolitan areas. Thirteen years later, that proportion had dropped to 12.8 percent, ranking 33rd. The area experienced a 20 percent drop in its share of youngsters, the largest decline among U.S. metro areas.

    Of course, not everywhere in Southern California has experienced such a precipitous shift. The Inland Empire, which stands apart in census data, remains a relative bastion of familialism, with 15.3 percent of the population between ages 5-14. Yet even the Inland Empire is slipping somewhat, from having the highest percentage of children to a ranking of fourth, and experiencing a 17 percent decline in children’s share of the population, the fourth-largest percentage drop in the nation.

    If we try to focus even more closely, the patterns of decline, and the few bright spots, become more clear. Using 2010 U.S. Census data for specific regions (more up-to-date numbers are not yet available at the local level), it’s clear where much of this loss is concentrated.

    The most precipitous declines have been in the inner city, notably Central Los Angeles, which experienced a net loss of 87,000 youngsters from 2000-10. Although their rate of loss was not as severe as in the core, other, once family-rich parts of the region – the San Fernando and San Gabriel valleys, Santa Ana/Anaheim, Long Beach and Whittier-Southeast Los Angeles County – all posted double-digit percentage drops in children.

    Only a few areas of Southern California experienced growth in the number of children. Much of the growth was in the vast, outer suburbs and exurbs – places such as the Victor Valley, San Bernardino, Perris-Temecula, Santa Clarita-Antelope Valley and Riverside-Moreno Valley, as well as decidedly more upscale Irvine-South Orange County.

    In a sense, these numbers tell several stories. To be sure, high housing prices seem to have a direct impact on family formation, pushing people further out to the periphery or, in some cases, out of the region entirely. Overall, according to recent analysis of census data, high-cost areas tend to repel families; almost all the most expensive areas in the country, such as the Bay Area, New York and Boston, have all experienced strong drops in numbers of children.

    This has resulted, as demographer Ali Modarres has demonstrated, in a gradual emptying out of families from the poor, but still expensive, inner core of Los Angeles. These areas tend to be heavily immigrant, and once were seen as the generators of a new generation of Angelenos. Now, however, as Modarres suggests, these areas are also “getting old,” with grandparents remaining but the new generation headed to other locales within or beyond the region. This process, he notes, has been accelerated by a decline in immigration to the region, particularly among Latinos, who long settled in these areas.

    Housing prices are not the only determinant. Prices are even higher in the Bay Area, which has seen a falling number of children, but not as severe as in Los Angeles.

    One likely explanation is the Southland’s relatively weak economy, which continues to create jobs sluggishly, and an unemployment rate, particularly in Los Angeles County, well above the state and national averages. High prices repel families, but this is particularly true in a region generating relatively little economic opportunity.

    There are other factors, particularly for middle-class families, who tend to have more choice where to locate. One seems to be education. For example, Irvine-South Orange County does well in this regard, but its housing costs are beyond the budgets of most other than upper-middle-income households, which tend to be Asian or non-Hispanic white. Irvine has a national reputation for excellent schools, a major lure to families who wish to avoid the expense of private education.

    For some in Southern California, particularly those pushing high-density and rental housing, these shifts may be considered a boon. After all, households with children, even more than most people, tend to prefer single-family homes and tend to embrace the notion of ownership. Single people are more likely to choose – by preference or because of cost – rental properties. The vision of Southern California as primarily dominated by high-density rentals correlates with requirements of state law and plans of the Southern California Association of Governments.

    At the same time, the economic languor of this region may make many of these bold designs untenable. People without decent – or any – employment do not make ideal tenants any more than they constitute potential homeowners. Given the high costs of high-density construction, this suggests that many units will be rentable only by aging former homeowners or by several families sharing a unit.

    Sadly, the decline in homeownership and the single-family housing market may contribute long term to the region’s continued relative economic eclipse. Single-family home construction is among the most reliable contributors to local economic growth and job creation. In contrast, each multifamily unit constructed contributes 60 percent less to the GDP.

    More important still, the loss of families presages a future that we can already see in many European and east Asian countries. There is the development of an aging, inner core, made up largely of retirees, both poor and affluent, sprinkled among areas dominated by young, mostly childless, people. Over time, this leads to a less-dynamic region, as the workforce and consumer base shrinks, and politics shift emphasis from economic growth to redistribution. Meanwhile, many of the poor and working-class families are forced out toward the furthest periphery, often far from employment and relatives.

    Can this process be reversed? Certainly a stronger economy, with more middle-wage jobs, might encourage people to have families, and give them the incentive, as well as the wherewithal, to buy a house. It would provide parents, and potential parents, with the notion that they can create a new generation with reasonable economic prospects.

    The other key factor is a radical reordering of our education systems. It is clear from the data that areas with good schools, such as Irvine, continue to attract families, even at very high housing price points. If middle-class families feel they can access a decent public education in the older, settled areas, such as the San Fernando Valley, L.A.’s Westside or North Orange County, they might be more willing to put down roots in these places, which would help create the greater stability generally associated with families, especially homeowners.

    Sadly, political leadership in most of Southern California and Sacramento seems blissfully unaware of these trends, or the potential danger to the area’s economic, as well as its demographic, vitality. Perhaps a region dominated by aging populations, and fewer families, by nature tends to look backward and neglect the kind of infrastructure investment, including in education, that families and business require.

    A resurgent hipster economy may not require much economic growth, or changes in the political system, but the region’s families need a thorough reversal in course if this region hopes to retain its appeal as an incubator of future generations.

    This piece originally appeared at The Orange County Register.

    Joel Kotkin is executive editor of NewGeography.com and Distinguished Presidential Fellow in Urban Futures at Chapman University, and a member of the editorial board of the Orange County Register. His newest book, The New Class Conflict is now available at Amazon and Telos Press. He is author of The City: A Global History and The Next Hundred Million: America in 2050. His most recent study, The Rise of Postfamilialism, has been widely discussed and distributed internationally. He lives in Los Angeles, CA.

    Baby photo by Bigstock.

  • Baby Boomtowns: The U.S. Cities Attracting The Most Families

    With the U.S. economy reviving, birth rates may be as well: the number of children born rose in 2013 by 4,700, the first annual increase since 2007. At the same time new household formation, after falling precipitously in the wake of the Great Recession, has begun to recover, up 100,000 this June from a year before.

    This impacts the economy strongly in such areas as single-family home construction, the supply of labor and consumer demand.

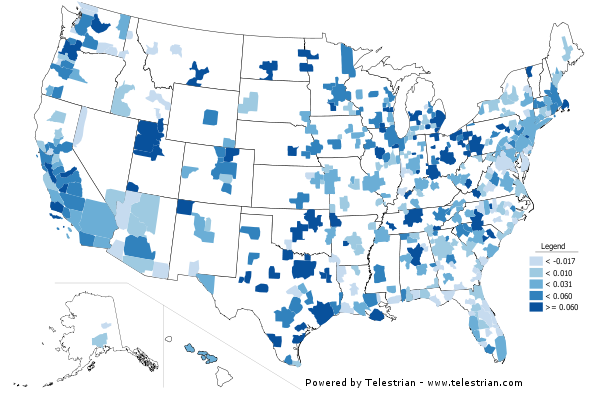
    For cities, being family friendly may become increasingly important as the large millennial generation starts entering their 30s, the primary years for raising children. In order to identify the parts of the country where new families are being formed most rapidly, we turned to demographer Wendell Cox. He crunched the data on the changes in the number of 5- to 14-year-olds since 2000 in the nation’s 52 largest metropolitan statistical areas.

    We picked this age range because it encompasses when parents often move due to such issues as school quality, the cost of housing and long-term economic security. A toddler can do quite well in a small apartment, but when it’s time to go to school, or if the parents decide to have a second or a third child, many parents are forced to make what are often difficult and long-lasting choices about where to live.

    Baby Boomtowns

    Virtually all the metro areas where there has been the strongest growth in families from 2000 to 2013 are highly suburban, highly affordable and located in the South and Intermountain West. If they also have a strong economy, like top-ranked Raleigh, N.C., they are even more attractive. In concert with strong net in-migration, the number of children in the Raleigh metro area between the ages of 5 and 14 grew by 63,600 from 2000-13, or 55.7%. That’s roughly 10 times the national growth rate of 0.5% for this demographic.

    The same combination of affordable housing and economic growth has helped No. 2 Austin, Texas, where there were 86,200 more children in 2013 than in 2000, growth of 49.3%, as well as  No. 4 Charlotte, N.C. (+82,100, 32.9%).

    Several of the high-ranked metro areas on our list are housing bubble hot spots that experienced rapid population growth in the first half of the last decade but then stalled out in the Recession.  No. 3 Las Vegas posted 35% growth among 5 to 14 year olds from 2000 to 2010. Since 2010 its child population has expanded at a modest 2.3% rate. A similar pattern can be observed in No. 5 Phoenix.

    In most of the top 10 metro areas on our list kids in the age range we looked at account for over 14% of the total population, compared to a national average of 13%. The city with the largest share of kids is No. 12 Salt Lake City, where 16.2% of the residents are between the ages of 5 and 14.

    The Great American Kiddie Desert

    The largest declines in the 5 to 14 cohort since 2000 have almost all occurred in the large coastal metropolitan centers, led by Los Angeles, 46th out of the 52 cities on our list, where the child population has dropped by 303,000, or 15.3%, since 2000. In the New York metro area (40th), the number of 5- to 14-year-olds fell by 238,000.

    Economics alone does not explain this. Some of these metro areas, notably New York and Boston (38th, -8%), have done fairly well in the aftermath of the Great Recession. Yet they are only doing marginally better in attracting families than the (mostly) hard-hit metro areas at the bottom of our list: Buffalo and Rochester, N.Y. , Pittsburgh and Detroit. (New Orleans actually ranked last behind Buffalo, but that’s a function of population flight due to Hurricane Katrina.)

    So why are otherwise thriving areas losing families? One possible explanation may come from cultural and political factors. As Austrian demographer Wolfgang Lutz has pointed out, an increasingly childless society creates “self reinforcing mechanisms” that make childlessness, singleness and one-child families increasingly predominant. In this process, which is further advanced in Japan, much of East Asia and throughout large parts of Europe, civic priorities often favor adult cultural amenities over things like parks and schools that are more important to families. Many areas that are increasingly child-free also often embrace density-oriented land use policies that lead to less affordable housing.

    Of course, there’s a steady drumbeat in the media proclaiming that families with children are returning to dense cities and expensive regions. In reality, the numbers don’t add up.  Among the 10 large metro areas with the lowest percentage of children are New York, Boston and San Francisco-Oakland, where the percentage of 5- to 14-year-olds is 11.5%, the lowest in the nation except for Pittsburgh (10.8%).

    All else being equal, high housing prices, particularly for single-family homes, drive people with young children away. Across the country, the biggest decline in child populations found in the 2010 Census took place in the urban core and close-in suburbs of expensive metro areas, while net increases were counted almost exclusively in further out suburbs. In Los Angeles, the central city and older suburbs have had large declines in children while almost all family growth has occurred in suburbs like the Inland Empire , Irvine , the Antelope Valley and Valencia.

    A Different Kind Of Divide?

    Much has been written about the various divides — political, racial, cultural, religious — afflicting the country. The geography of family formation poses yet another. In some parts of the country families appear to be proliferating, notably the Southeast and Intermountain West. In others, mostly in coastal California and the Northeast, they seem to be becoming rarer.

    To some extent, this parallels the “red” and “blue” divide, but not entirely. Some bluish regions have enjoyed growth in their 5 to 14 population, most notably No. 2 Austin, although this is helped largely by the booming Texas economy and liberal land regulation, particularly in the burgeoning suburban ring. Only three others slipped into the top 20 of our list: Denver (13th), greater Washington, D.C. (17th),  and Portland, Ore. (20th). Washington’s government driven job growth is doubtless a factor. Denver and Portland are more than 90% suburban and exurban, and boast housing that is relatively affordable compared to the Bay Area, Los Angeles or New York.

    Far more than politics, the interplay of economics and affordability tend to drive family migration. Take San Francisco-Oakland (33rd), which has had a robust economy over the past five years, but high housing prices have slowed the growth of families. Since 2000, the number of 5- to 14-year-olds in the metro area has dropped 2.7%.  A recent real estate survey showed a million dollars would buy only 1,500 square feet in San Francisco, 2,000 in Boston, 2,198 in Washington and roughly 2,300 in either New York or Los Angeles. In contrast, that amount of money could purchase over 10,000 square feet in Houston and 8,850 in Raleigh.

    Perhaps more important, high housing prices also make moving into a desirable area — particularly one with good schools — very difficult. In some core cities like Los Angeles, generally only the wealthiest areas have reliably decent public schools. In other parts of the country, you can still purchase a nice house for under $250,000 and be close to excellent schools. Unless the more expensive urban areas can expand their educational choices, many families will continue to look elsewhere for the critical combination of affordable housing and decent education for their children.

    Ultimately, these metro areas, so favored in the media, will face increased competition from those that can better attract young families. Even most hipsters eventually grow up, start a family, seek to buy a house and aspire to a middle-class life. Places that can attract young families will have several things going for them compared to their increasingly child-free rivals: a growing adult labor force, an expanding consumer market and a spur to the local construction industry. If demography is destiny, nowhere is this more likely the case.

    No. 1: Raleigh, N.C. MSA

    Rise In No. Of Children Aged 5-14, 2000-13: 55.7%
    No. Of Children Aged 5-14, 2013: 177,886
    Percentage Of Children Aged 5-14 In Total Population, 2013: 14.6%

    No. 2: Austin, Texas

    Rise In No. Of Children Aged 5-14, 2000-13: 49.3%
    No. Of Children Aged 5-14, 2013: 261,199
    Percentage Of Children Aged 5-14 In Total Population, 2013: 13.9%

    No. 3: Las Vegas

    Rise In No. Of Children Aged 5-14, 2000-13: 39.0%
    No. Of Children Aged 5-14, 2013: 275,663
    Percentage Of Children Aged 5-14 In Total Population, 2013: 13.6%

    No. 4: Charlotte, N.C.

    Rise In No. Of Children, 2000-13: 32.9%
    No. Of Children, 2013: 331,956
    Percentage Of Children In Total Population, 2013: 14.2%

    No. 5: Phoenix, Ariz.

    Rise In No. Of Children, 2000-13: 29.3%
    No. Of Children, 2013: 633,123
    Percentage Of Children In Total Population, 2013: 14.4%

    No. 6: Dallas-Ft. Worth, Texas

    Rise In No. Of Children, 2000-13: 28.2%
    No. Of Children, 2013: 1.05 million
    Percentage Of Children In Total Population, 2013: 15.4%

    No. 7: Atlanta, Ga.

    Rise In No. Of Children, 2000-13: 26.1%
    No. Of Children, 2013: 808,811
    Percentage Of Children In Total Population, 2013: 14.6%

    No. 8: Houston, Texas

    Rise In No. Of Children, 2000-13: 25.8%
    No. Of Children, 2013: 965,259
    Percentage Of Children In Total Population, 2013: 15.3%

    No. 9: Nashville, Tenn.

    Rise In No. Of Children, 2000-13: 22.7%
    No. Of Children, 2013: 237,119
    Percentage Of Children In Total Population, 2013: 13.5%

    No. 10: Orlando, Fla.

    Rise In No. Of Children, 2000-13: 22.6%
    No. Of Children, 2013: 288,091
    Percentage Of Children In Total Population, 2013: 12.7%

    This piece originally appeared at Forbes.

    Joel Kotkin is executive editor of NewGeography.com and Distinguished Presidential Fellow in Urban Futures at Chapman University, and a member of the editorial board of the Orange County Register. His newest book, The New Class Conflict is now available at Amazon and Telos Press. He is author of The City: A Global History and The Next Hundred Million: America in 2050. His most recent study, The Rise of Postfamilialism, has been widely discussed and distributed internationally. He lives in Los Angeles, CA.