Category: Urban Issues

  • Urban Renewal Needs More than ‘Garden City’ Stamp to Take Root

    Every few years the ideals of Ebenezer Howard’s garden city utopia are resurrected in an attempt by the UK government to create new communities, and address the country’s housing crisis. Sometimes this takes the form of new towns or eco-towns, and sometimes proposals for an actual garden city are put forward – as in the last budget.

    Rather than just rolling out this romantic terminology, we should take a closer look at garden city ideals and how they can be adopted to make the proposed Ebbsfleet development a success.

    Several years ago my colleague Michael Edwards presciently forecast the current problems in the Thames Gateway where Ebbsfleet falls, with a dominance of private development that does little to provide for local employment and walkable communities.


    Ebenezer Howard’s utopian vision

    He outlined the need to return to funding principles similar to the garden city model, where development trusts retain freeholds on the land. This model, based on investment in infrastructure and services, is a fundamental principle that shifts from short-term returns to a long-term relationship created between the collective or public landowner and local inhabitants.

    Lessons From History

    Despite the fact that the garden city was a highly influential model throughout the first half of the 20th century, ultimately leading to the establishment of some key settlements in the UK, US and elsewhere in the world, it has had few genuine successes. After World War II, similar utopian dreams of creating model communities, with decent housing surrounding a well-designed centre, met with the reality. British reformer William Beveridge famously summed them up for having “no gardens, few roads, no shops and a sea of mud”.

    You’d be forgiven for thinking that past lessons would be applied to the next generation of housing. But, even the post-war housing plans – though inspired by the garden city movement of the interwar periods – failed to plan the new housing in relation to transport, employment and public services such as shops and schools. While UK government reports have tried to draw lessons from both their positive and negative aspects, they have also been criticised in more recent reports, for lacking a sense of community – although it should also be said that “community” takes time to develop and cannot be “designed” as such.

    Many of the challenges of creating new communities are bound up in the spatial separation between newcomers and older inhabitants, a lack of social infrastructure, such as doctor’s surgeries and schools, and difficulties that stem from long commutes, such as lower net income and the strain this has on families. Ruth Durant found this in her 1939 study of Burnt Oak on the outskirts of London.

    Early post-war new towns were similarly criticised for their very slow build-up of health services, higher schooling, cultural facilities and decent shopping facilities, although some did better with the provision of local employment, due to many people moving to the towns with a local job linked to their housing. With shifts in the industrial economy, such beneficial connections between home and work (one of the tenets of the garden city) reduced over time.

    Modern Twist

    The challenges today are slightly different, however. People live more mobile and fragmented lives and are arguably less likely to be tied to place as was the case for the primarily working-class (and manual labouring) communities of the past. This poses the risk that community will be lost because of how transient people can be.

    But increased mobility and social interaction don’t have to be mutually exclusive. Indeed, a lack of mobility is the worst problem that can be imposed on a community: both work and leisure must be accessible to people. Plus, with the advent of the internet and grass-roots activism, connections can traverse space more easily. This has allowed movements such as the Transition Network, which brings communities together around sustainable issues, to blossom.

    Adapting to Change

    UCL’s EPSRC funded Adaptable Suburbs project has studied the evolution of London’s outer suburban towns over the past 150 years, providing some clues on what has made for the relative success of the original garden cities over other planned settlements. It is clear that their success has been dependent on excellent transport connections, coupled with the provision of local employment and access to employment at a commutable distance.

    Also important is the provision of a mixed-use town centre, giving a destination for a wide variety of activities in addition to retail: community activities, schools, leisure and cultural uses. Centres work well when connected to the street network, accessible by foot, bicycle, public and private transport. This multi-functional design has helped even the smallest of centres to sustain themselves through the most recent economic recession.

    A recent government report, “Understanding High Street Performance”, also found that successful town centres are “characterised by considerable diversity and complexity, in terms of scale, geography and catchment, function and form … [as] a result, the way in which they are affected by and respond to change is diverse and varied”.

    It is almost impossible to predict how society will change in the future, particularly as new technologies have the power to change how people connect and build community. But what is evident is that here lies another essential aspect of building successful communities: in allowing for places to adapt to change.

    This needs to be a foundational aspect of the government’s new cities – simply invoking the phrase “garden city” is not enough. By building places with sufficient flexibility of buildings, infrastructure and uses, coupled with links that allow for local and wider-scale trips to take place, with the necessary long-term financial investment, we can start to create places that will successfully weather the future.

    This article was originally published on The Conversation.

    Dr Laura Vaughan is Professor of Urban Form and Society at the Bartlett, University College London. She has been researching poverty and prosperity in cities, suburbs and the space between them for the past dozen years using space syntax – a mathematical method for modelling social and economic outcomes. Her edited book ‘Suburban Urbanities’ is due to come out in UCL Press in 2015.

    Photo: Which way are the flower beds? Matt BuckCC BY-SA

  • The Cities Stealing Jobs From Wall Street

    When we think about American finance, the default image is of a pinstriped banker on Wall Street. But increasingly financial services is shifting away from the traditional bastions of money.

    In an analysis of recent and longer-term employment trends, we have identified the large cities –those with over 450,000 jobs – that are gaining jobs in financial services, a sector that employs 7.9 million people nationwide.  Overwhelmingly, the fastest growth has been in cities not associated with high finance, but largely low-cost Sun Belt cities, which account for seven of the top 10 large metro areas on our list.

    View the Best Cities for Manufacturing Jobs 2014 List

    In first place: Phoenix-Mesa-Glendale, Ariz., where financial employment has expanded 12.3% since 2008 and a remarkable 7.2% last year. Close behind in second through fourth are San Antonio-New-Braunfels, Texas, Austin-Round Rock-San Marcos, Texas, and Nashville-Murfreesboro-Franklin, Tenn. These metro areas have advantages beyond just warmer weather; all are places with affordable housing and no state income taxes.

    The three metro areas outside the Sun Belt in our top 10 also enjoy lower levels of taxation and housing prices. St. Louis, Mo. (fifth), Salt Lake City (seventh), and Richmond, Va. (ninth), have begun to bulk up on financial jobs, largely to the detriment of the traditional money centers New York (44th), San Francisco (48th), Boston (55th), Los Angeles (57th) and Chicago (61st). Despite the current stock market boom, and good times for large banks, financial services employment in these cities has been stagnant in recent years. Since 2008, New York has lost 3.8% of all its finance-related jobs, while Los Angeles’ financial sector has shed 7% of its jobs and Chicago 6.7%.

    Why Financial Services  Are Moving

    Current financial trends—accelerated By TARP and “too big to fail” regulations—have ledto a growing concentration of banking and financial services in the six largest money-center banks.  In the first five years of the Obama administration the share of financial assets held by the top six banks soared 37% to account for two-thirds of all bank assets.

    But as we have seen in other industries, that domination of market share don’t necessarily drive employment growth where the big banks are headquartered. Increasingly we are seeing the rise of what urban analyst Aaron Renn describes as the “executive headquarters,” where only elite employees and their support staff remain while the vast majority of jobs migrate to lower-cost places.

    Given the advances in telecommunications technology, many of the core functions of banks can be conducted anywhere. Why have a midlevel salesperson or mortgage loan processor occupy expensive Manhattan office space when they could function as effectively from much cheaper space in Phoenix, Saint Louis or Richmond?

    Pundits like to speak about “face to face” contact as critical in financial services. This may be true for putting together mergers or IPOs, or to concoct the latest derivative, but it doesn’t matter in taking care of customer questions, monitoring credit cards or administering offices in suburban strip malls.

    The People Advantage

    These smaller cities have advantages for both the financial institutions and their employees. For one thing, the cost of employees is much lower. According to salary reporting website Payscale.com, the median financial manager in New York or San Francisco costs $90,724 to $98,783, respectively; while one in Phoenix costs only $77,467.

    But this is not just good for the companies. Employees who make less in St. Louis, Phoenix or Dallas often live far better than their counterparts who earn higher salaries in the traditional money centers. One big reason is housing costs, which are a third to half cheaper in the top cities on our list than in places like Boston (2013 median home price of $375,900) New York ($465,700), or San Francisco ($679,200).  Compare that to $183,600 in top-rated Phoenix or $171,000 in San Antonio-New Braunfels.  Even in Austin, with its surging growth in technology and its role as state capital and home to a huge public university, the median home costs a relatively affordable $222,900, according to the National Association of Realtors.

    Sometimes it‘s not just lower costs. If you are servicing Spanish-language customers, for example, a location in San Antonio, Phoenix or Austin with their large Spanish-speaking workforces might prove convenient. If you are interested in trade finance, Texas, now the leading export state, might prove attractive. Firms concentrating on mortgages might also see advantages in locating in places like Nashville, Phoenix, Austin, Dallas and San Antonio, which are all expected to add many more households, according to a recent Pitney Bowes  survey, than much slower-growing locales in California or the Northeastern seaboard.

    And then there is the unique case of Salt Lake, another emerging financial powerhouse. Mormons’ linguistic skills have attracted loads of big international companies, such as Goldman Sachs, who need people capable of conversing in Lithuanian, Chinese and Tongan. Goldman has 1,400 employees in Salt Lake City, making it the investment bank’s sixth largest location worldwide.

    Future Trends

    People tend to see the growth of the biggest banks as confirming the notion that economic opportunity will continue to be concentrated in our elite, expensive cities. Yet in reality urban growth patterns seem to suggest that these cities cannot easily accommodate mid-skill or middle-management jobs. So even as decision-making remains ensconced in New York,  Boston  or Chicago, the flow of the vast majority of financial jobs should continue to head outward.

    This competition may become all the greater if, as Deloitte predicts, financial service employment begins to spike with a long-term economic recovery. Nor will the emerging financial states be satisfied long-term with the bottom end of the financial employment pool. Palm Beach, Fla., for example, has set up an office to lure hedge funds out of the New York area, touting warm weather and much lower taxes.

    Increasingly, some New York financial institutions are starting movemore critical roles to lower-cost areas, like investment advisory and technology jobs. Places like St. Louis, where the industry has grownand approaches critical mass, seem to be in position to make a serious bid for higher-end  jobs.

    Although no one expects Phoenix or Salt Lake City to overtake Manhattan as the financial center of the world, over time we can expect these cities to develop into important banking centers. Just as the move of automakers to the Southeast and tech companies to Austin, Salt Lake City and Raleigh remade the economic map of those industries, the shift of financial services to the new centers might eventually do the same in that sector as well.

    View the Best Cities for Manufacturing Jobs 2014 List

    This story originally appeared at Forbes.

    Joel Kotkin is executive editor of NewGeography.com and Distinguished Presidential Fellow in Urban Futures at Chapman University, and a member of the editorial board of the Orange County Register. He is author of The City: A Global History and The Next Hundred Million: America in 2050. His most recent study, The Rise of Postfamilialism, has been widely discussed and distributed internationally. He lives in Los Angeles, CA.

    Michael Shires, Ph.D. is a professor at Pepperdine University School of Public Policy.

    Photo: robotography

  • Dallas: A City in Transition

    I was in Dallas this recently for the New Cities Summit, so it’s a good time to post an update on the city.

    I don’t think many of us realize the scale to which Sunbelt mega-boomtowns like Dallas have grown. The Dallas-Ft. Worth metro area is now the fourth largest in the United States with 6.8 million people, and it continues to pile on people and jobs at a fiendish clip.

    Many urbanists are not fans of DFW, and it’s easy to understand why. But I think it’s unfair to judge the quality of a city without considering where it is at in its lifecycle. Dallas has been around since the 1800s, but the metroplex is only just now starting to come into its own as a region. It is still in the hypergrowth and wealth building stage, similar to where a place like Chicago was back in the late 19th century. Unsurprisingly, filthy, crass, money-grubbing, unsophisticated Chicago did not appeal to the sophisticates of its day either. But once Chicago got rich, it decided to get classy. Its business booster class endowed first rate cultural institutions like the Art Institute, and tremendous efforts were made to upgrade the quality of the city and deal with the congestion, pollution, substandard housing, and fallout from rapid growth, which threatened to choke off the city’s future success. At some point in its journey, Chicago reached an inflection point where it transitioned to a more mature state. One can perhaps see the 1909 Burnham Plan as the best symbol of this. In addition to addressing practical concerns like street congestion, the Burnham Plan also sought to create a city that could hold its own among the world’s elite. And you’d have to argue the city largely succeeded in that vision.

    The DFW area is now at that transition point. They realize that as a city they need to be about more than just growth and money making. They need to have quality and they need to address issues in the system. Much like Burnham Plan era Chicago, this perhaps makes DFW a potentially very exciting place to be. It’s not everyday when you can be part of building a new aspirational future for a city that’s already been a successful boomtown. The locals I talked to were pretty pumped about their city and where it’s going.

    How true this is I don’t know, but some people have attributed a change in mindset to the loss in the competition to land Boeing’s headquarters. Boeing ended up choosing Chicago over Dallas. In part this was because Chicago bought the business with lavish subsidies that far outclassed what Dallas put on the table. But it was also because Boeing saw Chicago as a more congenial environment for global company C-suite and other top executives to be, both from a lifestyle perspective and that of access to other globally elite firms and workers available in Chicago.

    Meanwhile, the cracks in the DFW growth model were becoming apparent, especially in the core city of Dallas. Ten years ago the Dallas Morning News ran a series called “Dallas at a Tipping Point: A Roadmap For Renewal.” This series was underpinned by a report prepared by the consulting firm Booz Allen. This report is well worth reading by almost anyone today as it is a rare example of a city that was able to get insight and recommendations from the type of tier one strategy firm used by major corporations. Booz Allen was direct in their findings, though perhaps with a bit of hyperbole in the Detroit comparison:

    Dallas stands at the verge of entering a cycle of decline…On its current path, Dallas will, in the next 20 years, go the way of declining cities like Detroit – a hollow core abandoned by the middle class and surrounded by suburbs that outperform the city but inevitably are dragged down by it.
    ….
    If the City of Dallas were a corporate client, we would note that it has fallen significantly behind its competitors. We would warn that its product offering is becoming less and less compelling to its core group of target customers…We would further caution the management that they are in an especially dangerous position because overall growth in the market…is masking the depth of its underlying problems. We would explain that in our experience, companies in fast growing markets are often those most at risk because they frequently do not realize they are falling behind until the situation is irreversible.

    Put into the language of business, we would note that Dallas is under-investing in its core product, has not embraced best practices throughout its management or operations, and is fast becoming burdened by long term liabilities that could bankrupt the company if the market takes a downturn.

    The city responded in a number of ways, some of which were similar to Chicago at its inflection point. Many of these involve various urbanist “best practices” or conventional wisdom type trends.

    By far the most important of these was adopting modern statistically driven policing approaches. As crime plummeted in places like New York during the 1990s, Dallas did not see a decline of its own. But with the expansion of police headcount and adoption of new strategies by new police chief David Kunkle in 2004 – and no doubt some help from national trends – crime fell steeply during the 2000s. The Dallas Morning News says that the city’s violent and property crime rates fell by a greater percentage than any other city with over one million residents over the last decade. In 2013, Dallas had its overall lowest crime rate in 47 years.

    This is critical because nothing else matters without safe streets. I’ve had many a jousting match with other urbanists on discussion boards about where crime falls on the list of priorities. In my view it’s clearly #1 – even more so than education. It’s simply a prerequisite to almost any other systemic good happening in your cities. Students can’t learn effectively if they live and attend school in dangerous environments, for example. NYU economist Paul Romer made this point forcefully in his New Cities keynote, saying that fighting crime is the most important function of government and that if you don’t deliver on crime control your city will go into decline. Fortunately, Dallas seems to have gotten the message.

    But there’s been attention to physical infrastructure as well. The area has built America’s largest light rail system (which was in the works since the early 1980s).


    Dallas Area Rapid Transit (DART) light rail train. Source: Wikipedia

    Both the city and region remain fundamentally auto-centric, however, and this is unlikely to change.

    There’s been a significant investment in quality green spaces. A major initiative called theTrinity River Project is designed to reclaim the Trinity River corridor through the city as a recreational amenity. This is underway but proceeding slowing. Among the aspects of the project is a series of three planned signature bridges designed by Santiago Calatrava. The only one completed is the Margaret Hunt Hill Bridge.


    The Margaret Hunt Hill Bridge in Downtown Dallas. Designed by Santiago Calatrava. Source: Wikipedia

    The single bridge tower is quite an imposing presence on the skyline. However, the size of the bridge creates an awkward contrast with the glorified creek that is the Trinity River. It looks to me like they significantly over-engineered what should have been a fairly straightforward flood plain to span just so they could create a major structure.

    Another green space project – and the best thing I saw in my trip to Dallas – is Klyde Warren Park, which is built on a freeway cap. About half the cost came from $50 million donations. I’ll be going into more detail on this in my next installment, but here’s a teaser photo:


    Klyde Warren Park. Source: Wikipedia

    The Calatrava bridge shows that Dallas has embraced the starchitect trend. This was also on display in the creation of the Dallas Arts District. Complementing the Dallas Museum of Art are a billion dollars worth of starchitect designed facilities including Renzo Piano’s Nasher Sculpture Center, IM Pei’s symphony center, Norman Foster’s Winspear Opera House, and OMA’s Wyly Theatre.


    Dee and Charles Wyly Theatre. Designed by OMA’s Joshua Prince-Ramus (partner in charge) and Rem Koolhaas

    This arts district – which naturally Dallas boasts is the world’s largest – along with the other major investments that were funded with significant private contributions show a major advantage Texas metros like DFW and Houston have: philanthropy. These are new money towns on their way up and local billionaires are willing to open their wallets bigtime in an attempt to realize world class ambitions, exactly the way Chicago’s did all those decades back.

    By contrast many northern tier cities are dependent on legacy philanthropy, such as foundations set up in an era when they were industrial power houses. This is a dwindling inheritance. What’s more, what wealthy residents they do have are as likely to be taking money out of their cities through cash for cronies projects than they are to be putting it in. Thus they can be a negative not positive influence.

    This shows the importance of wealth building in cities. Commercial endeavors can appear crass or greedy at times, and deservedly so. But without wealth, you can’t afford to do anything. There’s a reason Dallas could build America’s largest light rail system – it had the money to do so. Similarly with this performing arts district. To be a city of ambition requires that a place also be an engine of wealth generation.

    I’m sure that Dallas’ moneyed elite are well taken care of locally and exert outsized influence on decision making. I don’t want to make them out to be puristic altruists. But they’ve shown they are willing to open their wallets in a serious way, something that’s not true everywhere.

    This is a flavor of what Dallas has been up to. It’s too early to say whether the city will make the same transition Chicago did. Its greatest challenge also awaits some time in the future. When DFW’s hypergrowth phase ends and the city must, like New York and Chicago before it, reinvent itself for a new age, that’s when we will find out if DFW has what it takes to join the world’s elite, or whether it will fade like a flower as Detroit and so many other places did.

    Toyota did just announce it’s moving 3,500 jobs to north suburban Plano. But corporations have long seen Dallas a place for large white collar operations. Boeing was what I call an “executive headquarters” – a fairly small operation consisting of only the most senior people. I haven’t seen Dallas win any of these as of yet.

    The Dallas Morning News takes a somewhat mixed view on the city itself. They just did a special section called “Future Dallas: Making Strides, Facing Challenges,” the title of which sums it up. Dallas has put a lot of pieces on the board and made major progress on areas like crime, but it’s failed to make a dent in others, such as Booz Allen’s call to make the city more attractive to middle class families. Poverty is actually up since then, and the city is increasingly unequal in its income distribution. Dallas is not unique in that, but that’s cold comfort.

    Despite gigantic regional growth, the city’s population has been nearly flat. Despite the vaunted Texas and DFW jobs engine, Dallas County has lost about 100,000 jobs since 2000. The core is clearly continuing in relative decline, and the Dallas County job losses are particularly troubling. I’m no believer in this idea that everybody is going to abandon the suburbs and head back to the city. But as former Indianapolis Mayor Bill Hudnut put it, you can’t be a suburb of nowhere. If the core loses economic vitality, the entire DFW regional will take a hit to its growth.

    Aaron M. Renn is an independent writer on urban affairs and the founder of Telestrian, a data analysis and mapping tool. He writes at The Urbanophile, where this piece originally appeared.

    Dallas photo by Bigstock.

  • New York, Legacy Cities Dominate Transit Urban Core Gains

    Much attention has been given the increase in transit use in America. In context, the gains have been small, and very concentrated (see: No Fundamental Shift to Transit, Not Even a Shift). Much of the gain has been in the urban cores, which house only 14 percent of metropolitan area population. Virtually all of the urban core gain (99 percent) has been in the six metropolitan areas with transit legacy cities (New York, Chicago, Philadelphia, San Francisco, Boston, and Washington).

    In recent articles, I have detailed a finer grained, more representative picture of urban cores, suburbs and exurbs than is possible with conventional jurisdictional (core city versus suburban) analysis. The articles published so far are indicated in the "City Sector Articles Note," below.

    Transit Commuting in the Urban Core

    As is so often the case with transit statistics, recent urban cores trends are largely a New York story. New York accounted for nearly 80 percent of the increase in urban core transit commuting. New York and the other five metropolitan areas with "transit legacy cities" represented more than 99 percent of the increase in urban core transit commuting (Figure 1). This is not surprising, because the urban cores of these metropolitan areas developed during the heyday of transit dominance, and before broad automobile availability. Indeed, urban core transit commuting became even more concentrated over the past decade. The 99 percent of new commuting (600,000 one-way trips) by transit in the legacy city metropolitan areas was as well above their 88 percent of urban core transit commuting in 2000.

    New York’s transit commute share was 49.7 percent in 2010, well above the 27.6 percent posted by the other five metropolitan areas with transit legacy cities. The urban cores of the remaining 45 major metropolitan areas (those over 1,000,000 population) had a much lower combined transit work trip market share, at 12.8 percent.

    The suburban and exurban areas, with 86 percent of the major metropolitan area population, had much lower transit commute shares. The Earlier Suburban areas (generally median house construction dates of 1946 to 1979, with significant automobile orientation) had a transit market share of 5.7 percent, the Later Suburban areas 2.3 percent and the Exurban areas 1.4 percent (Figure 2).

    The 2000s were indeed a relatively good decade for transit, after nearly 50 years that saw its ridership (passenger miles) drop by nearly three-quarters to its 1992 nadir. Since that time, transit has recovered 20 percent of its loss. Transit commuting has always been the strongest in urban cores, because the intense concentration of destinations in the larger downtown areas (central business districts) that can be effectively served by transit, unlike the dispersed patterns that exist in the much larger parts of metropolitan areas that are suburban or exurban. Transit’s share of work trips by urban core residents rose a full 10 percent, from 29.7 percent to 32.7 percent (Figure 3).

    There were also transit commuting gains in the suburbs and exurbs. However, similar gains over the next quarter century would leave transit’s share at below 5 percent in the suburbs and exurbs, because of its small base or ridership in these areas.

    Walking and Cycling

    The share of commuters walking and cycling (referred to as "active transportation" in the Queen’s University research on Canada’s metropolitan areas) rose 12 percent in the urban core (from 9.2 percent to 10.3 percent), even more than transit. This is considerably higher than in suburban and exurban areas, where walking and cycling remained at a 1.9 percent market share from 2000 to 2010.

    Working at Home

    Working at home (including telecommuting) continues to grow faster than any work access mode, though like transit, from a small base. Working at home experienced strong increases in each of the four metropolitan sectors, rising a full percentage point or more in each. At the beginning of the decade, working at home accounted for less work commutes than walking and cycling, and by 2010 was nearly 30 percent larger.

    The working at home largest gain was in the Earlier Suburban Areas, with a nearly 500,000 person increase. Unlike transit, working at home does not require concentrated destinations, effectively accessing employment throughout the metropolitan area, the nation and the world. As a result, working at home’s growth is fairly constant across the urban core, suburbs and exurbs (Figure 4). Working at home has a number of advantages. For example, working at home (1) eliminates the work trip, freeing additional leisure or work time for the employee, (2) eliminates greenhouse gas emissions from the work trip, (3) expands the geographical area and the efficiency of the labor market (important because larger labor markets tend to have greater economic growth and job creation, and it does all this without (4) requiring government expenditure.

    Driving Alone

    Despite empty premises about transit’s potential, driving remains the only mode of transport capable of comprehensively serving the modern metropolitan area. Driving alone has continued its domination, rising from 73.4 percent to 73.5 percent of major metropolitan area commuting and accounting for three quarters of new work trips. In the past decade, driving alone added 6.1 million commuters, nearly equal to the total of 6.3 million major metropolitan area transit commuters and more than the working at home figure of 3.5 million. To be sure, driving alone added commuters in the urban core, but lost share to transit, dropping from 45.2 percent to 43.4 percent. In suburban and exurban areas, driving alone continued to increase, from 78.2 percent to 78.5 percent of all commuting.).

    Density of Cars

    The urban cores have by far the highest car densities, despite their strong transit market shares. With a 4,200 household vehicles available per square mile (1,600 per square kilometer), the concentration of cars in urban cores was nearly three times that of the Earlier Suburban areas (1,550 per square mile or  600 per square kilometer) and five times that of the Later Suburban areas (950 per square kilometer). Exurban areas, with their largely rural densities had a car density of 100 per square mile (40 per square kilometer).

    Work Trip Travel Times

    Despite largely anecdotal stories about the super-long commutes of those living in suburbs and exurbs, the longest work trip travel times were in the urban cores, at 31.8 minutes one-way. The shortest travel times were in the Earlier Suburbs (26.3 minutes) and slightly longer in the Later Suburbs (27.7 minutes). Exurban travel times were 29.2 minutes. Work trip travel times declined slightly between 2000 and 2010, except in exurban areas, where they stayed the same. The shorter travel times are to be expected with the continuing evolution from monocentric to polycentric and even "non-centric" employment patterns and a stagnant job market (Figure 5).

    Contrasting Transportation in the City Sectors

    The examination of metropolitan transportation data by city sector highlights the huge differences that exist between urban cores and the much more extensive suburbs and exurbs. Overall the transit market share in the urban core approaches nine times the share in the suburbs and exurbs. The walking and cycling commute share in the urban core is more than five times that of the suburbs and exurbs. Moreover, the trends of the past 10 years indicate virtually no retrenchment in automobile orientation, as major metropolitan areas rose from 84 percent suburban and exurban in 2000 to 86 percent in 2010. This is despite unprecedented increases is gasoline prices and the disruption of the housing market during worst economic downturn since the Great Depression.

    —————————-

    Wendell Cox is principal of Demographia, an international public policy and demographics firm. He is co-author of the "Demographia International Housing Affordability Survey" and author of "Demographia World Urban Areas" and "War on the Dream: How Anti-Sprawl Policy Threatens the Quality of Life." He was appointed to three terms on the Los Angeles County Transportation Commission, where he served with the leading city and county leadership as the only non-elected member. He was appointed to the Amtrak Reform Council to fill the unexpired term of Governor Christine Todd Whitman and has served as a visiting professor at the Conservatoire National des Arts et Metiers, a national university in Paris.

    Photograph: DART light rail train in downtown Dallas (by author)

    —————————-

    City Sector Note: Previous articles in this series are listed below:
    From Jurisdictional to Functional Analyses of Urban Cores & Suburbs
    The Long Term: Metro American Goes from 82 percent to 86 percent Suburban Since 1990
    Functional v. Jurisdictional Analysis of Metropolitan Areas
    City Sector Model Small Area Criteria

  • Is Brazil Still the Country of the Future?

    Not long ago, Brazil was riding high. It was feted as one of the “BRIC” nations destined to be the next world economic powers. The commodities boom had its natural resources and agricultural sectors humming. The press – for example, Monocle magazine’s swooning over Brazil’s push to boost its diplomatic presence – was adoring. And Rio was awarded the 2014 World Cup and the 2016 Olympics, two events that were intended to both serve as a catalyst for further development, and also as a coming out party of sorts for the country.

    The World Cup is underway, but otherwise things haven’t quite worked out as Brazil thought they would. The average citizen of the country is upset at the vast sums being spent on international events that don’t benefit them. The last two years have featured riots, strikes, and various other expressions of unrest. Economic growth in the country has collapsed. In a special section last September, the Economist asked, “Has Brazil Blown It?

    Late last month the McKinsey Global Institute issued a major report on the country called “Connecting Brazil to the World: A Path to Inclusive Growth.” At 104 pages, it’s massive, but a must read for anybody interested in South America’s giant.

    And it’s a somewhat depressing read as well. Though there are immense strengths and opportunities for the future, Brazil has big problems too, most of them longstanding, and which hobble its aspirations.

    Brazil is the 7th largest economy in the world and the 7th leading destination for foreign direct investment. But it’s 95th in per capita GDP, 114th in the quality of its infrastructure, and 124th in its level of ease in trading across borders. Its export sector is also heavily commodity dependent, particularly oil. Ranked only 43rd in global connectedness on McKinsey’s index, they estimate a potential boost of 1.25% (presumably percentage points) to annual GDP growth from improvements on that measure alone.

    Three particular items jumped out at me from the study. One is the “custo Brasil” – the Brazil cost, so notorious it gets its own Wikipedia entry. A variety of factors from bureaucracy to the tax regime to an uncertain legal climate, poor infrastructure, crime, and corruption make the cost of doing business in Brazil very pricey indeed.

    The second is the very low rate of investment in the economy. Brazil’s gross investment rate as a percentage of GDP is 18%, compared with 26% in Chile, 29% in Mexico, 40% in India, and 49% in China. Conversely, government consumption is at 22% in Brazil vs. 12% in Chile and Mexico, 13% in India, and 14% in China. Private consumption is similar in the countries except for China, which is notably lower. This probably helps explain the poor state of the infrastructure in the country.

    The third is something I have personal experience with, namely protectionist trade barriers designed to create and sustain domestic industries in sectors like autos and computers. I suspect these rules were modeled on Japan, and more lately China, which used rules and business practices to build successful local champions. But in Brazil this has rendered its industry sclerotic. In effect, cars sold in Brazil have to be made in Brazil, ditto for computers, etc. This is where my personal experience comes in. When we were doing global PC procurement, Brazil was always a special case and our vendors had to have special Brazil made PCs for domestic use. This may not be an actual rule, but tariffs produce a de facto barrier. While this technique may have worked in Japan, it’s clear that it failed in Brazil. As the exception that proves the rule, McKinsey uses the example of regional jet manufacturer Embraer as a counterfactual. That company was privatized and opened to global competition. The result is that its got tough itself and is now an industrial champion for Brazil.

    There are tons of statistics in the study that are worth scanning just to see. Brazil is consistently benchmarked against Chile and Mexico in Latin America, as well as fellow BRICs India and China. The comparisons aren’t pretty.

    Reading a lot about the country in the last year, I put its problems into three categories: poor governance, geographic disadvantage, and scale disadvantage.

    1. Poor Governance
    Most of the issues pointed out by McKinsey fall squarely under the heading of poor governance. The contrast with nearby Chile could not be more plain across every dimension: corruption, the rule of law, investment, public sector debt, tax burden, infrastructure, regulation, etc.

    Latin America seems to prefer two sorts of governments these days. One is a right wing nationalist heir to the military juntas of the past, best exemplified by the Kirchner regime in Argentina. The other are left wing populist-nationalist movements like Venezuela that tend to feature a streak of anti-Americanism. Both of these have produced pitiful results.

    Brazil is a sort of lite version of the latter. Lula da Silva was a charismatic labor activist who led strikes and was jailed by the previous military dictatorship in his youth. Post-democratization, he went into politics. After moderating some of his more radical views, he was elected president on a reform agenda. While he had some success and was arguably and improvement on his predecessors, he ultimately failed to deliver on material changes in governance. His hand picked successor Dilma Rousseff has not been as effective and is in an electoral struggle for another term.

    In line with the nationalist streak of this governing type, one of Da Silva’s primary concerns was Brazil’s amour-propre. As one of the world’s largest countries, he found it self-evident that Brazil should be treated as a great power. He lobbied for Brazil to have a permanent seat on the UN Security Council. He and others responded in kind to any affront to the nation’s pride, such as requiring American and only American visitors to be finger printed after the US imposed a fingerprinting requirement on foreign visitors. He sought out diplomatic coups where ever he could find them, which included cozying up to unsavory characters like Mahmoud Ahmadinejad who thinks Israel should be destroyed and that Iran has no gays (presumably because he has them executed when he can find them).

    Da Silva forgot that there’s more to being a great power than being a big country – you’ve got to earn it. And as a very popular politician he did not seize his moment of opportunity to truly grasp the nettle of reform.

    Meanwhile nearby Chile is one of the Latin American governments that’s followed a different model. It’s been run by center-left governments more or less the entire time since the restoration of democracy, and they’ve delivered on a good governance model that has taken them to effectively developed country status. Chile is now even a member of the OECD. Chile is basically the Minnesota of Latin America, and the results demonstrate it. This should show Brazil the size of the prize if the get their act together.

    2. Geographic Disadvantage
    Brazil is simply a long way from major developed markets. This puts it at a geographic disadvantage versus many other countries. Current airplanes cannot make a non-stop flight from Brazil to East Asia, arguably the most important emerging part of the world. It’s even a long haul from the United States, with relatively few gateway cities vs. say major European capitals. Brazil is time-zone advantaged with the US, however. It also speaks Portuguese instead of Spanish, which imposes a linguistic handicap.

    3. Scale Disadvantage
    Brazil is a big country, geographically and in population. Size can be an advantage, but it also makes reform difficult as it’s hard to turn a battleship. Brazil’s population of 200 million is more than ten times that of Chile.

    Brazil’s two principal cities, São Paulo and Rio de Janeiro, are also megacities. São Paulo in particular is huge, and at north of 20 million people (more than the entire country of Chile) is the 10th largest city in the world. I recently wrote that it’s unlikely the world’s emerging megacities will turn the corner in eliminating dysfunction. Their problems are just too huge and their national growth rate too low. Though I’d consider this more hypothesis than conclusion at this point, my rule of thumb is that a megacity can only achieve escape velocity from pervasive dysfunction if they are a major city in a country that is the world’s current rising economic (or historically imperial) power.

    Brazil is not that country, and two mega cities will be a drag on growth. Although São Paulo is an important emerging global city – 23rd in the world in a forthcoming report I helped create – I’m told that both São Paulo and Rio are growing more slowly than secondary cities in the country. A previous McKinsey study threw cold water on the idea that megacities are an advantage, noting their under performance by saying:

    It is a common misperception that megacities have been driving global growth for the past 15 years. In fact, most have not grown faster than their host economies, and MGI expects this trend to continue. Today’s 23 megacities—with populations of 10 million or more—will contribute about 10 percent of global growth to 2025, below their 14 percent share of global GDP.

    In contrast, 577 middleweights—cities with populations of between 150,000 and 10 million, are seen contributing more than half of global growth to 2025, gaining share from today’s megacities.

    So I’m not surprised that it’s Curitiba, not one of the megacities, that’s where the innovative BRT revolution was begun. If I were looking to invest in Brazil, I’d be looking at this next tier of cities. Nor is it surprising that Santiago, Chile (population 5.4 million) has had great success in modernizing given its more moderate size.

    Plain and simple the degree of difficulty is higher in Brazil because of the size.

    Brazil is also a very racially diverse country with a number of challenges resulting from its history of oppression. Brazil had more slaves than any other country in the world and was the last New World colony/nation to abolish it. If slave reparations are on the agenda in the United States, how much more so similar issues in Brazil? Again, contrast with Chile, which never had very many slaves and abolished slavery in 1818. With the exception of a relatively few indigenous peoples on reservations, Chileans largely perceive themselves as ethnically homogenous, though with some skin tone based status (moderately sized…historically racially homogenous…Minnesota?)

    Which is to say that it’s tough to entirely fault Brazil for not living up to the example of Chile. Its degree of difficulty is much higher. And its geography hamstrings its global interaction.

    Nevertheless, solving the governance challenges to address the real issues Brazil faces remains the top agenda item. McKinsey has laid out a number of good suggestions, the real question is whether or not Brazil’s socio-political system can produce the ability to implement them.

    Aaron M. Renn is an independent writer on urban affairs and the founder of Telestrian, a data analysis and mapping tool. He writes at The Urbanophile, where this piece originally appeared.

    Photo: Ponte estaiada Octavio Frias – Sao Paulo by Marcosleal

  • America’s New Industrial Boomtowns

    David Peebles works in a glass tower across from Houston’s Galleria mall, a cathedral of consumption, but his attention is focused on the city’s highly industrialized ship channel 30 miles away. “Houston is the Chicago of this era,” says Peebles, who runs the Texas office of Odebrecht, a $45 billion engineering firm based in Brazil. “In the sixties you had to go to Chicago, Cleveland and Detroit. Now Houston is the place for new industry.”

    With upward of $35 billion of new refineries, chemical plants and factories planned through 2015 for Houston and the surrounding Gulf Coast, companies like Odebrecht, which runs chemical plants and is working on a new freeway in the area, have converged on the nation’s oil and gas capital. They are part of the reason why the Texas metropolis ranks first on our list of the best large cities for manufacturing.

    Houston, with 255,000 manufacturing jobs, is not yet the country’s largest industrial center; it still lags behind the longtime leaders Los Angeles, with 360,000 manufacturing jobs, and Chicago, home to 314,000. But it is clearly on a stronger trajectory. Since 2008, Houston’s manufacturing workforce has expanded 5% while Los Angeles has lost 13% of its industrial jobs and Chicago’s factory workforce has shrunk 11%.

    View the Best Cities for Manufacturing Jobs 2014 List

    Why Manufacturing Matters

    Whether America is on the path to a sustainable industrial expansion or is just seeing a weak bounce back has been widely debated, but the recent numbers are impressive. Since 2010 the U.S. has added 647,000 manufacturing jobs. New energy finds have led to the construction and expansion of pipelines and refineries, and has sparked foreign industrial investment reflecting electricity costs that are now well below those in Europe or East Asia. Besides Houston, also ranking high on our big cities list are two other energy towns, No. 5 Oklahoma City and No. 10 Ft. Worth, Texas. Our mid-sized cities list is led by Lafayette, La., with nearby Baton Rouge in 11th place.

    Evangelists of the “information economy” may think that industrial jobs are passé, as epitomized by a recent Slate article that recommended that working-class people from places like Detroit should move to areas like Silicon Valley or Boston where they can make money cutting the hair and walking the dogs of high-tech magnates. But the notion that U.S. manufacturing is doomed, and that the jobs are of lower quality than those in high-tech centers, is largely bogus; even in Silicon Valley the majority of new projected jobs are expected to pay under $50,000 annually. In contrast manufacturers pay above-average wages, in some cases due to unionization, but in many others because of the increasing sophisticated skills required by today’s factories.

    Although we will likely never see a boom in factory employment on the scale experienced in the last century, the demand for blue-collar skills is projected to increase in future years. Among all professions for non-college graduates, manufacturing skills are most in demand, according to a study by Express Employment Professionals. By 2020, according to BCG and the Bureau of Labor Statistics, the nation could face a shortfall of around 875,000 machinists, welders, industrial-machinery operators, and other highly skilled manufacturing professionals.

    Southern Comfort

    Our research suggests that much of this growth will be in metro areas in the South and the Great Plains that are known for friendly business climates. New industrial investment is tending to go to places that are largely non-union, and feature lower taxes and light regulation. Epitomizing this trend is the No. 2 city on our large metro area list, Nashville-Murfreesboro-Franklin, Tenn., where manufacturing employment is up 6% since 2008. Nashville has become a hotbed for foreign investment in manufacturing, with the expansion of the Nissan facilities in nearby Smyrna, as well as a host of suppliers.

    This is occurring, in part, because some large companies are shifting production to America from China in response to rising Chinese wages as well as sometimes unpredictable business conditions there.

    Investment inflows, both from overseas and domestic companies, have boosted other standout southern industrial hubs, as well as the smaller metro areas on our mid-sized city list, notably Mobile, Ala. (third place), with its expanding industrially oriented port, and No. 14 Charleston-North Charleston-Summerville, S.C., which has been a beneficiary of major new foreign investment as well as the expanded presence of U.S. aerospace giant Boeing. The South also is home to our No. 1 small manufacturing city, Florence-Muscle Shoals, Ala.

    The Resurgence of the Rust Belt

    The progress is not confined to the Sun Belt. The resurgence of the U.S. auto industry has revived the economy of Warren-Troy-Farmington Hills, Mich., also known as “automation alley.” The home to many parts suppliers, engineering and tech support for the car industry, this area has enjoyed an impressive 12.7 percent growth in manufacturing jobs since 2008, placing it third on our big cities list.

    Detroit, the center of the auto industry, ranks a respectable 16th on our big city list, but the big improvements in the Rust Belt are occurring in mid-sized cities such as Lansing-East Lansing, Mich. (eighth), Grand Rapids (ninth) and Ft. Wayne, Ind. (10th).

    But arguably the strongest Rust Belt recovery has occurred in Elkhart-Goshen, Ind., third on our small cities list. Since 2008 Elkhart’s industrial employment — much of it in the recreational vehicle industry — has expanded 30%, one of the most dramatic employment turnarounds of any place in America. Unemployment has fallen to 5% from a recession high of 20.2%.

    Western Exposure

    The South and the Great Lakes may be America’s industrial heartland, but there are several strong pockets in the West. One region that is doing particularly well is the Pacific Northwest, led by Seattle-Bellevue-Everett, which has experienced 11% manufacturing employment growth since 2010.

    Boeing is key here, but the Pacific Northwest’s industrial expansion has also been fueled by low electricity rates, largely due to the area’s strength in hydroelectricity. Portland-Vancouver-Hillsboro OR-WA (11th) is usually associated more with hipsters, but manufacturing growth has taken off, particularly with the expansion of Intel’s large semiconductor facility in suburban Hillsboro.

    Another Western industrial hotspot is Utah, a state with low energy costs and business friendly regulation. Salt Lake City, 12th on our large metro area list, has enjoyed a 5.7% increase in industrial jobs since 2010. Growth has been even stronger in two other Utah cities, Provo -Orem and Ogden-Clearfield, which rank fifth and seventh, respectively, on our mid-sized cities list.

    One surprising place where manufacturing is making a mild comeback is in the Bay Area, which for years has exported high-tech manufacturing jobs to places like Utah as well as the rest of the world. Despite ultra-expensive electricity, high labor costs and some of the world’s most demanding environmental laws, San Jose (13th on our big metros list) San Francisco-San Mateo-Redwood (15th) have posted solid industrial growth after years of decline. Yet both remain below their 2008 levels, and may find new growth difficult once the current tech bubble collapses.

    Laggards

    Two of the worst performers on this list are the big metro areas that have for decades been the country’s largest industrial hubs, Los Angeles-Long Beach-Glendale (55th) and Chicago-Joliet-Naperville (56th). It appears they lack the cost competitiveness and specialized focus of America’s ascendant industrial regions.

    Another clear loser is the Northeast, which accounts for seven of the eight lowest ranked big metro areas. Since 2008, Philadelphia (62nd) has lost 21% of its once-large industrial job base, while New York City, which has been losing industrial jobs for decades, ranks 45th. Here, too, high costs and regulation are a factor, as well as the loss of industrial know-how resulting from long-term erosion of their manufacturing bases.

    Of course, some information age enthusiasts may argue that losing such jobs is something of a badge of honor, since “smart” regions do not focus on the gritty business of making things. Yet if you look across the country, you can see that many of the strongest local economies, from Houston and Nashville to Seattle, have taken part in the U.S. industrial resurgence. It seems this is one party more worth joining than avoiding.

    View the Best Cities for Manufacturing Jobs 2014 List

    This article first appeared at Forbes.com.

    Joel Kotkin is executive editor of NewGeography.com and Distinguished Presidential Fellow in Urban Futures at Chapman University, and a member of the editorial board of the Orange County Register. He is author of The City: A Global History and The Next Hundred Million: America in 2050. His most recent study, The Rise of Postfamilialism, has been widely discussed and distributed internationally. He lives in Los Angeles, CA.

    Houston skyline photo by Bigstock.

  • Composite Traffic Congestion Index Shows Richmond Best

    It is important that traffic congestion be controlled sufficiently to facilitate a more competitive metropolitan economy. Each year, three organizations produce traffic congestion reports, Tom Tom, INRIX and the Texas Transportation Institute of Texas A&M University (TTI). These reports use  different methods to estimate the excess time lost in traffic congestion during peak travel periods (morning and evening week day "rush hours").   

    The excess travel time is estimated relative to the travel time that would be expected if there were no congestion (if all traffic were free flowing). Economists caution that achieving free flow conditions at all times would require excessive investment. Yet, the standard metric used by the three indexes are useful for comparing the intensity of traffic congestion between metropolitan areas even without knowing the level at which economic efficiency is optimized.

    There is generally strong correlation between the three indexes, though there are important differences. For example, the TTI report uses data from INRIX, yet agrees with INRIX on only six of the most congested 11 US major metropolitan areas (over 1 million population). The most substantial difference is in San Francisco, which INRIX (and Tom Tom) ranked as the second most congested major metropolitan area, far worse than the TTI ranking of 20th.

    The findings from the three traffic congestion indexes are synthesized into a composite congestion index in this article. Because the TTI’s latest index is 2011, composite index covers 2011 through 2013 (for methodology, see Note 1).

    Worst Traffic Congestion in 2011-2013

    The "10 worst traffic congestion" list includes some of the largest metropolitan areas, those with the highest urban population densities and a few smaller metropolitan areas with special traffic congestion inducing conditions (Figure 1).

    Los Angeles has the worst traffic congestion in each of the three indexes (44.4% excess travel time). This is consistent with the now 30 year history of TTI, which has typically shown Los Angeles to have the worst traffic congestion. This is not surprising, since Los Angeles is the densest urban area in the nation, ahead of second place San Francisco by 10 percent and New York by 30 percent. Traffic congestion has been made worse by cancellation of planned freeways and freeway segments in the Los Angeles area, such as the Beverly Hills Freeway, the Slauson Freeway, the Reseda Freeway, the La Cienega Route 170 freeway, the South Pasadena "missing link" and others (Note 2).

    Austin ranked second in traffic congestion (34.5%). This may be surprising, since Austin is not among the largest major metropolitan areas, though it is among the fastest growing. In the middle 1950s, when the final plans for the interstate freeway system were completed, Austin was much smaller and only a single interstate route was justified. Later, opposition to freeway development led to increased congestion. In more recent years the Austin freeway system has been augmented by new toll roads, though roadway improvements have not been sufficient to deal with the rapidly rising demand.

    Not surprisingly, San Francisco (34.4%), with the second highest urban density among major metropolitan areas, ranked third in traffic congestion. New York (33.4%), with its higher than average density and dense core area ranked fourth in traffic congestion. Seattle ranked fifth (32.4%), despite its somewhat lower urban density. Seattle’s long and relatively narrow north-south urban form and modest north-south freeway capacity is an important contributor to its intense traffic congestion. As in the case of Los Angeles, some planned freeways were canceled, which has also exacerbated traffic congestion.

    San Jose is a smaller major metropolitan area, yet has the sixth worst traffic congestion in the nation (32.2%). There are two principal contributing factors, its proximity to much larger San Francisco and the third highest urban density of the major metropolitan areas, 10 percent above New York.

    Washington (31.3%) and Boston (29.7%) have the seventh and eighth worst traffic congestion respectively. In each case, core areas have little freeway capacity (in part because of freeway cancellations in both cities).

    Houston, which had the worst traffic congestion the nation during the middle 1980s, now ranks much better, at ninth (28.3%). Houston’s improvement has occurred because of the roadway expansions opened concurrent with some of the fastest population growth in the high income world over the past three decades.

    Portland, like San Jose and Austin is not among the larger major metropolitan areas. Yet Portland ranked 10th in traffic congestion (28.2%). Portland’s policies, such as densification, have contributed to this; these include a cancelled freeway and a preference for light rail over highway capacity expansion. According to the TTI index, Portland has seen its peak period congestion ranking rise from 47th worst (out of 100) in the middle 1980s to 6th worst in 2011.

    Least Traffic Congestion in 2011-2013

    The major metropolitan areas with lower levels of congestion tend generally to be smaller and to have lower urban population densities (Figure 2).

    Richmond is the least congested major metropolitan area in the nation (8.7%), and has experienced growth since 2000 that is greater than average. Kansas City had the second least traffic congestion (10.9%), while nearly stagnant growth Rochester (11.5%) and Cleveland (12.9%) ranked third and fourth. Faster growing Salt Lake City ranked fifth (13.3%). Population losing Buffalo ranked sixth (13.5%) edged out seventh ranked and slow growing St. Louis (13.5%). Faster growing Oklahoma City ranked eighth (13.7%), while slower growing Memphis ranked ninth (14.1%). Indianapolis (14.4%), one of the few Midwestern metropolitan areas growing faster than average, has the 10th lowest traffic congestion level.

    Traffic Congestion and Density

    The connection between higher levels of traffic congestion and higher urban population densities has been documented in various analyses (also here). The traffic congestion index confirms that metropolitan areas with higher urban densities generally have more intense traffic congestion (Figure 3). Obviously, there are other factors that contribute to traffic congestion, not least the insufficient provision of highway capacity. This is evidenced by growing Dallas-Fort Worth and Phoenix, where state and local officials have provided substantial increases in highway capacity. Traffic congestion index shows Dallas-Fort Worth to have only the 16th worst traffic congestion and Phoenix to have the 33rd worst traffic congestion (out of the 52 major metropolitan areas). Greater employment dispersion can also be an important factor. The data for each of the major metropolitan areas is in the Table.

    Composite Traffic Congestion Index: 2011-2013
    Excess Travel Time: Peak Periods
    Rank Metropolitan Areas Index
    1 Los Angeles 44.4
    2 Austin 34.5
    3 San Francisco 34.4
    4 New York 33.4
    5 Seattle 32.4
    6 San Jose 32.2
    7 Washington 31.3
    8 Boston 29.7
    9 Houston 28.3
    10 Portland 28.2
    11 Miami 27.8
    12 Chicago 26.9
    13 Philadelphia 25.8
    14 Atlanta 25.7
    15 Denver 25.3
    16 Dallas-Fort Worth 23.7
    17 San Diego 23.3
    18 Baltimore 23.1
    19 Nashville 22.9
    20 Minneapolis & St. Paul 22.7
    21 Tampa-St. Petersburg 22.6
    22 Charlotte 20.9
    23 New Orleans 20.5
    24 Orlando 20.3
    24 Virginia Beach 20.3
    24 Riverside-San Bernardino 20.3
    27 Pittsburgh 20.2
    28 Sacramento 19.4
    29 San Antonio 19.0
    30 Hartford 18.7
    31 Cincinnati 17.9
    32 Las Vegas 17.7
    33 Phoenix 17.2
    33 Detroit 17.2
    35 Providence 17.1
    36 Columbus 16.8
    37 Milwaukee 16.3
    38 Jacksonville 15.7
    39 Birmingham 15.2
    40 Raleigh 14.9
    41 Louisville 14.6
    42 Indianapolis 14.4
    43 Memphis 14.1
    44 Oklahoma City 13.7
    45 St. Louis 13.5
    45 Buffalo 13.5
    47 Salt Lake City 13.3
    48 Cleveland 12.9
    49 Rochester 11.5
    50 Kansas City 10.9
    51 Richmond 8.7
    Derived from Tom Tom, INRIX and Texas Transportation Institute data


    Traffic Congestion and Economic Growth

    While there are different interpretations of the appropriate standard for traffic congestion, there is no question but that less traffic congestion benefits a metropolitan area’s competitiveness. Because traffic congestion increases travel times, it necessarily reduces the share of a metropolitan area’s (labor market) jobs that can be reached by the average employee. A considerable body of research associates greater access (measured in time) with improved economic performance and job creation.

    —–

    Note 1: The 2011 – 2013 index represents the average excess travel time estimate of the three sources. For each source, each metropolitan area’s excess travel time is converted to a percentage of the metropolitan area with the worst excess travel time. These percentages are then averaged and the final excess travel time estimate is calculated by applying this percentage to the average worst excess travel time for the three sources. But these estimates are based on the TTI travel time index, and the peak hour excess travel time percentages from INRIX and Tom Tom (the Tom Tom figure is obtained by averaging data from the morning and evening peak period).

    Note 2: I have a personal attachment to the Long Beach Freeway "missing link" in South Pasadena. In the early 1960s my great aunt and her husband were forced to sell their home taken to the California Highway Department for the imminent construction of the roadway. This was the beginning of a decades-long fight to keep the freeway from splitting the city of South Pasadena. In the early 1980s, as a member of the Los Angeles County Transportation Commission I was appointed to a special committee chaired by County Supervisor Peter F. Schabarum to make a final route selection between the Caltrans "Meridian" route and the South Pasadena preferred "Westerly Route." Our decision, the result of submittals and hearings, confirmed the Caltrans route, but did nothing to alleviate the South Pasadena opposition. Now, there is the possibility of building a tunnel, which would minimize surface disruption.

    —-

    Wendell Cox is principal of Demographia, an international public policy and demographics firm. He is co-author of the "Demographia International Housing Affordability Survey" and author of "Demographia World Urban Areas" and "War on the Dream: How Anti-Sprawl Policy Threatens the Quality of Life." He was appointed to three terms on the Los Angeles County Transportation Commission, where he served with the leading city and county leadership as the only non-elected member. He was appointed to the Amtrak Reform Council to fill the unexpired term of Governor Christine Todd Whitman and has served as a visiting professor at the Conservatoire National des Arts et Metiers, a national university in Paris.

    Photo: Richmond (major metropolitan area with the least traffic congestion) by CoredestayChiKai

  • Let’s Make Kalamazoo’s Promise America’s Promise

    In 2005, in order to boost their city’s economy, a small group of donors in the city Glenn Miller made famous created the Kalamazoo Promise. It  offered any graduate of the city’s public schools a four-year scholarship covering all tuition and mandatory fees at any of Michigan’s public colleges or universities, provided those students maintained a 2.0 grade average in college and made regular progress toward a degree.

    The offer had an immediate and noticeable effect on public school enrollments and home construction within the city as families moved back in to take advantage of the chance to boost their children’s higher education opportunity. Enrollments in the public schools rose initially by 17.6% even as high school dropout rates fell by half. Residential construction permits within the district rose from 30% within the overall metropolitan area to 50%.  The program’s success caused other cities across the country as disparate as El Dorado, Arkansas and Tulsa, Oklahoma to adopt similar programs.

    Now a recent national study of the results of such initiative has documented the positive impact such promise programs can have on increasing educational attainment, while encouraging more students to attend a wide range of colleges.  University of Pittsburgh professors, LeGower and Walsh found that programs offering scholarships to all students regardless of merit, and to the widest range of two and four year colleges and universities, saw the biggest gains in enrollment. Their research published in a National Bureau of Economic Research working paper, documented enrollment gains in Kalamazoo and other identical programs.

    With these compelling results in hand, it’s time to make Kalamazoo’s promise America’s promise. A bi-partisan proposal from the non-profit Redeeming America’s Promise seeks to do just that by creating a federal American Promise Scholarship program that would pay the cost of tuition for every academically capable and personally determined high school student in America from families earning $180,000 or less. The plan would offer two year scholarships for high school graduates of $2500 per year, and four year scholarships worth on average $8500 per year to students graduating with a 2.75 GPA. These rates represent the current average cost of in state resident tuition at our public community colleges and universities. States would need to agree to accept such scholarships in lieu of any tuition payments from the families of APS students and at a minimum maintain their current level of support for their institutions. Additional incentives would be provided to encourage them to do even more to make sure a college education is both accessible and affordable for their residents. According to the Bipartisan Policy Center, there is $52 billion in current expenditures which can be used to fund the American Promise Scholarships by redirecting the money the federal government currently spends on tuition tax credits as well as by integrating the Pell Grant program into this new form of support.

    Other parts of the plan, which can be downloaded in its entirety at redeemingamericaspromise.org, would provide additional support for students who are the first in their family to attend college and reward college completion as well as post-graduation service to community or country. Money for these programs can be found by reducing the level of profits the government currently makes on student loans and ending other college support programs which have not proven their effectiveness.  

    The current system of financing higher education is unsustainable.  Student loan debt, which is not dischargeable in bankruptcy, now exceeds one trillion dollars—more than all the credit card debt in the country. The burden is felt disproportionately by lower and middle income families and is a severe drag on the desire of members of the Millennial Generation (born 1982-2003) to start a family, buy a house and have children. Furthermore, there is no historical precedent for placing such a burden on our youngest citizens.

    Since the country’s founding, education has been a key component of the promise of upward economic mobility. This has been true in every era, beginning with the Northwest Ordinance setting aside land for one room schoolhouses to the institution of mandatory, free primary education in all states at the time of the Civil War. The expansion of educational opportunities continued in the 20th Century as our growing Industrial Age economy required workers with a high school education for our factories and offices. Government funds in every state and community were set aside to provide a free, public high school education for boys and girls to respond to these new demands. Later in the century, after WWII, the GI Bill of Rights and then the Higher Education Act 0f 1965 were enacted to further encourage college enrollment, thereby establishing the educational foundation for our rapidly expanding middle class. It is only in this century that we have asked a generation, Millennials, to self-finance the education they need, and our country needs, to be economically successful.

    This wrong-headed inter-generational and economically disastrous policy needs to end before America loses its global competitive edge for good. The current system is creating a skills gap.

    America needs to make Kalamazoo’s Promise a promise every American can count on and that can address the growing skills gap in many parts of the occupational spectrum.  By joining with the Democrats and Republicans, young and old, who are already supporting Redeeming America’s Promise’s plan to make college tuition free we can ensure that day arrives sooner rather than later.

    Morley Winograd is co-author of the newly published Millennial Momentum: How a New Generation is Remaking America and Millennial Makeover: MySpace, YouTube, and the Future of American Politics and fellow of NDN and the New Policy Institute.

    Graduation photo by Bigstock.

  • The Ugly City Beautiful: A Policy Analysis

    When it comes to the future, Detroit and San Francisco act as poles in the continuum of American consciousness. Detroit is dead and will continue dying. San Francisco is the region sipping heartily from the fountain of youth. Such trajectories, according to experts, will go on indefinitely.

    Harvard economist Ed Glaeser has a grim outlook for the Rust Belt. “[P]eople and firms are leaving Buffalo for the Sunbelt because the Sunbelt is a warmer, more pleasant, and more productive area to live,” he writes in City Journal.

    Glaeser echoes this sentiment in a recent interview with International Business Times, saying “[s]mart people want to be around other smart people”, and the Rust Belt has a long slog ahead given that “post-industrial city migration is dominated by people moving to warmer climes”.

    But is this true? Is there a “brain drain” from the Rust Belt to the Sun Belt and Coasts? In a word: no. But Rust Belt leaders have bought this narrative hook line and sinker, and the subsequent hand-wringing has led to wasteful public investment.

    “Michigan’s cities must retain and attract more people, including young knowledge workers, to its cities by making them attractive, vibrant, and diverse places,” reads a 2003 memo from the National Governor’s Association about Michigan’s “Cool Cities” campaign.

    But the campaign struggled. “Government can’t mandate cool,” reflected Karen Gagnon, the former Cool Cities director. “As soon as government says something is cool, it’s not.”

    What’s worse, “cooling you city” with talent attraction expenditures can exacerbate economic disparities on the ground. Cities, like Chicago, are increasingly becoming bifurcated cities based on faulty assumptions that “trickle down urbanism” works. That said, the challenge of the day—for not only Rust Belt cities, but all cities—is not “brain drain”, but “brain waste”. Those cities who can best rebuild middle class communities tied to emerging markets will be the future of investment, like they were in the past.

    Through Rust-Colored Glasses

    When a people fall from grace, the sentiment of decline tends to stick. The Rust Belt’s demise is cemented. Meanwhile, the future is elsewhere. Like toward the sun. For instance, from 2000 to 2010, the Sun Belt metros of Houston, Dallas, Atlanta, Riverside, Las Vegas, Miami, Orlando, and Phoenix experienced the largest population growth. The biggest losers? It’s a “who’s who” of Rust Belt metros, led by Detroit, Cleveland, Pittsburgh, and Buffalo.

    America is a country governed by growth: big cars, big belt buckles, big houses, and big populations. Shrinkage is weakness. It is a sign of place failure. The problem here is that population growth is an ineffective, broad-brush measure when trying to understand regional underlying dynamics. A new study by Jessie Poon and Wei Yin in the journal Geography Compass called “Human Capital: A Comparison of Rustbelt and Sunbelt Cities” details exactly that.

    In it, the authors compare human capital levels between the Sunbelt metros in California (including San Francisco and L.A.), Nevada, New Mexico, and Arizona with Rust Belt metros in Michigan, Ohio, Indiana, Pennsylvania, and upstate New York. When it comes to share of population with a college degree, the authors find that the Rust Belt is experiencing a brain gain equal to their Sun Belt peers from 1980 to 2010. Poon and Wei also found that skill ratios of immigrants is higher in the Rust Belt than Sunbelt. The authors note that despite population decline, the Rust Belt continues “to be important sites of human capital accumulation”.

    The study coincides with recent work out of the Center for Population Dynamics that shows Greater Cleveland’s number of 25- to 34-year olds with a bachelor’s or higher increased by 23% from 2006 to 2012, as well as Pittsburgh economist Chris Briem’s work that shows the metros of Pittsburgh, Detroit, and Cleveland rank 1st,, 6th, 7th in the country respectively when it comes to the number of young adults in the labor force with a graduate or professional degree.

    Beyond human capital, the Rust Belt continues to produce and export wealth at a massive pace. The “Chi-Pitts” mega-region, which mirrors the Rust Belt boundaries with the addition of Minneapolis, generates $2.3 billion in economic output, second only to the “Bos-Wash” mega-region that makes up the Northeast Corridor.

    Also, using IRS migration data from the 2009-2010 period, a team of researchers led by Michal Migurski showed that Los Angeles County, New York County, and Cook County sent the most people and money to the rest of the United States. Detroit’s Wayne County was fourth. Cleveland’s Cuyahoga County was 9th, one spot ahead of San Francisco County. Speaking to Esquire, which published the work in a visual called “Where Does the Money Go”, Migurski explains the findings:

    "We realized that if you look at the biggest ‘losers,’ essentially what you’re looking at are the biggest cities in the U.S.," Migurski says. One of those losers: New York County, which lost $1,306,548,000 and 15,100 people. "But does that actually mean New York is a big loser?" Migurski asks. "One of our ideas was that, you’re not a loser if you’re losing money. You’re an exporter." The sort of exporter, he says, that boosts the rest of the U.S. economy. Traditional Sun Belt retirement areas comprise the gainers; areas like South Florida and Southern California in particular, create what Migurski calls "money sinks."

    Still, the notion of “loser” for Wayne and Cuyahoga County sticks, despite evidence to the contrary. But why? Why the constant “poor post-industrial people” sentiment, if not a low-grade captivation that comes with “ruin porn” rubbernecking?

    Well, if an ideal exists—you know, the experts beckon: be the “new” city, the “hot” city, the “creative” city—then a study in contrasts is necessary. The Rust Belt, with its connotations of smoke stacks and demographic decline, fits the bill.

    “[Richard] Florida suggests that Rustbelt cities’ high concentration of less creative blue-collar workers also produces unhappy residents,”Poon and Wei conclude in their Rust Belt/Sun Belt study. “We suggest that such a doom and gloom picture of urban and regional development for the uncool industrial Rustbelt needs to be tempered with a trend of brain gain that is growing across cities in the region.”

    But for this tempering to happen a clearer understanding of the importance of accumulating human capital needs to be ascertained. More exactly: Is it to put your city to work, or to “live-work-play”?

    Build it and they will…what?

    In his 1921 work Economy and Society, social scientist Max Weber details a city’s raison d’etre. Cities can be producer cities, wherein importance is derived from industries that demand national and international trade. Think Detroit and cars. Additionally, cities are consumer cities, in which growth is tied to how much is spent consuming goods and services in the local economy. Think eating, drinking, and buying houses.

    The cities that are the most economically robust have wealth generated from global production, which in turn enables local consumption. San Francisco’s tech economy drives it real estate market and artisanal toast scene. That is, if the question was “What came first, the farm-to-table chicken or the egghead?” The answer is “the egghead”, hands down.

    But this logic—i.e., in order to go to a restaurant, you need a job, and your job prospects are tied to the viability of your region’s global industries—is often turned on its head in economic development. Here, the goal is growth, no matter the rhyme or reason.

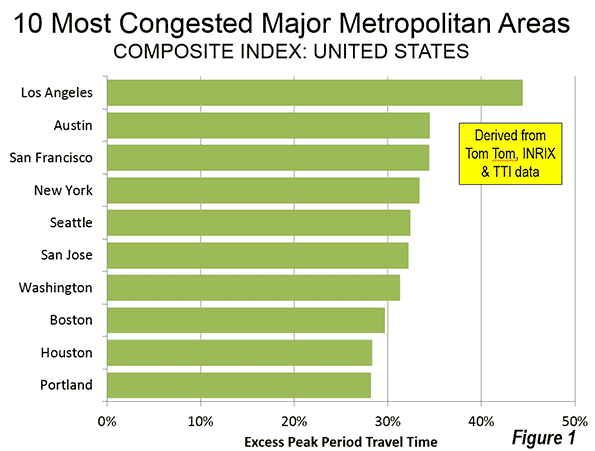
    “Like in many Sun Belt cities,” writes a Seattle Times columnist and Sun Belt expat, “Phoenix’s economic plan devolved into merely adding people, no matter the enormous long-term costs”. The columnist goes on to note that while the population has boomed, the city lags on most measures, such as per capita income (see Figure 1 below).

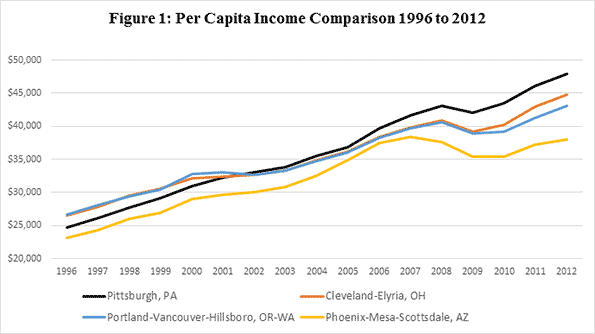
    Moreover, the Phoenixes of the world exist partly because of retired Baby Boomers and the disposable income that comes with it. The Sun Belt feeds off the legacy of production in the Northeast and Midwest. Other cities, like Portland, are fed by a not dissimilar dynamic. But it’s not the retired who come, rather the pre-retired.

    “The Portland metro area’s young college-educated white men are slackers when it comes to logging hours on the job,” lead’s a piece in the Oregonian about a study conducted last year, “and that’s one reason people here collectively earn $2.8 billion less a year than the national average.” Figure 1 demonstrates Portland’s sluggish income gains compared to Rust Belt peers Pittsburgh and Cleveland.

    Similarly, in a paper circulated by the Federal Reserve Bank of Atlanta, the author analyzed the top 86 “brain gain” metros in the nation to determine whether or not a region’s increase in human capital was paying off in terms of per capita income, labor force participation, poverty rate, and unemployment. The author found Portland was one of twelve metros that experienced zero economic outcomes. Pittsburgh scored 4 for 4. The authors suggest that talent attraction and retention—when untethered to production capacity—“may be largely inefficient, a kind of traditional economic development ‘buffalo hunting’”.

    Portland is perhaps America’s consummate lifestyle city. No doubt, the city has experienced a significant brain gain over the last decade. Portland is a talent attraction model. But it is not a talent producing or refining model. Rather, Portland is producing a scene that is run by the consumption of the scene’s aesthetic. Writes one young worker who left:

    “I can’t stay too long because I know if I stayed a day too long in Portland, I’d suddenly be happy to embrace the slow pace of the city and stop working… I’d end up getting sleeping real late every day, drink some coffee, maybe write some poetry on my porch (or not), and then find a part time job selling cigars like I had in college.”

    The lesson is that accumulating talent is not enough. There has to be something for the talent to do, or a context that fosters “doing”. It is also a warning for cities investing in the lifestyle game. Spending on creative class amenities ensures nothing. Creating a field of dreams won’t pay the bills. But it will run up the tab.

    The Ugly City Beautiful

    In 1998, the Chicago Sun-Times ran a piece called “Building the City Beautiful”. “The mayor of the city of Chicago, Richard M. Daley, is a big admirer of Martha Stewart,” it begins, before describing Daley’s plans to begin the "Martha Stewart-izing" of Chicago. The article goes on to quote a University of Illinois at Chicago professor who said Chicago is turning from a producer city to a consumer city. "The producer city was the industrial city — the smoke and the noise and the industrial jobs,” noted the professor. “The consumer city is the city of Starbucks, boutiques and so forth.”

    The professor was only partly right. By the 1990s, Chicago was indeed becoming brainier. But its emerging knowledge economy was an outgrowth of its “big shouldered” manufacturing base. Columbia University professor Saskia Sassen recently noted that pundits overlook this when examining the city’s transformation, with the bias being that “Chicago had to overcome its agro-industrial past, [and] that its economic history put it at a disadvantage”. Notes Sassen:

    [I]n my research I found that its past was not a disadvantage. In fact, it was one key source of its competitive advantage. The particular specialized corporate services that had to be developed to handle the needs of its agro-industrial regional economy gave Chicago a key component of its current specialized advantage in the global economy.

    Similar economic transformations from legacy cost to legacy asset are found throughout the whole of the Rust Belt. Pittsburgh, for instance, no longer provides the muscle for steel making, but it does act as the “brain center” for the world’s steel frame. How this came about is detailed in the article “Pittsburgh’s evolving steel legacy and the steel technology cluster”.

    With the arrival of the new economy also came “new economy” tastes. Sassen noted that when she arrived in to study in Chicago in the 90s she was greeted by “old lofts transformed into beautiful restaurants catering to a whole new type of high-income worker—hip, excited, alive.”

    In other words, local consumption patterns began setting up around the emergent worker demand. Going was the Italian Beef and arriving was pickled beets. This demand also impacted housing, with the attraction to urban living setting the stage for gentrification. This, in a nutshell, is the dynamic driving the transformation of urban neighborhoods nationwide: a new economy demands new workers which in turn demand a new kind of lifestyle. The problem, though, is that leaders have the causality backward, or that creating a new lifestyle will incur new worker supply and then poof: new industries. But as we see with Portland, it is not that easy. The industrial DNA and social history of your city matters more than the cosmetics atop the topography.

    Still, from a policy and strategy standpoint, it is easier just to make your city “cool”. And that’s exactly what Chicago has been doing at a significant pace. In a recent piece entitled “Well-healed in the Windy City”, author Aaron Renn details Mayor Rahm Emanuel’s policy of using tax-increment financing (TIF) to create geographic “winners” and “losers” across Chicagoland. “The true purpose of Chicago’s TIF districts—which now take in about $500 million per year,” writes Renn, “appears to be tending to high-end residents, businesses, and tourists, while insulating them from the poorer segments of the city.”

    The strategy was spelled out explicitly by Mayor Emanuel during a recent ribbon cutting for a bike path in Chicago’s Loop. Said Emanuel: “I expect not only to take all of their [Seattle and Portland’s] bikers but I also want all the jobs that come with this, all the economic growth that comes with this, all the opportunities of the future that come with this.”

    Notwithstanding the faulty logic in the strategy—e.g., if Portland lacks the jobs for its residents, how can it supply jobs for Chicagoans—the real problem is the costs associated with such bifurcated investment. In West and South Chicago, the byproducts of the City Beautiful approach are downright ugly. But they are not unexpected. They are the long-documented economic and social effects of concentrated poverty and segregation. Continues Renn:

    Safety levels in Chicago can no longer be plotted on a single bell-shaped curve for the entire city. Today, that curve is split into two—one distribution for the wealthy neighborhoods and one for the poor ones. A lack of resources is part of the problem: the police department is understaffed… While the city budget is tight, failing to increase police strength during a murder epidemic is a profound statement of civic priorities.

    Urban priorities flow from a perception of what is at stake. For long, the push for human capital accumulation has pitted city versus city amidst the backdrop of an urban popularity contest in which the “winner” is assured nothing outside of popularity. But victory in the vanity game is fleeting. The young and the restless are exactly that, and many people who come to New York or San Francisco, or for that matter Portland, leave as they get older and seek out affordable places to raise a family. What remains on the ground is the reality of brain waste. Without the prioritization of equitable, integrated middle-class neighborhoods a city’s progress will be always be disparate, if not illusory. Talent attraction is but part of a redevelopment process. So is talent refinement for those arriving and talent production for those in place. After all, neighborhoods are factories of human capital. Building people, not places, is what a successful city is all about.

    But to know this is to “know thyself”. The Rust Belt has been dying for some time now, so say the experts. The region has absorbed the projections, and given that desperate times call for desperate measures investment has been wasted. “[Creative class theory] is bad because it distracts from what’s important,” says Sean Stafford, author of Why the Garden Club Couldn’t Save Youngstown.

    Regaining focus entails removing the rust-colored glasses. Rust Belt leaders will see there are assets to work with, not to mention feel the freedom that comes with no longer being a study in contrast for those touting a future that really isn’t.

    Richey Piiparinen is Senior Research Associate at the Center for Population Dynamics at the Maxine Goodman Levin College of Urban Affairs at Cleveland State University. The Center for Population Dynamics at Cleveland State University’s Maxine Goodman Levin College of Urban Affairs aims to help partner organizations competitively position the region for economic and community development. It will do so through the lens of migration, applied demography, and culture.

    Lead photo courtesy of bctz Cleveland

  • The Long Term: Metro America Goes From 82% to 86% Suburban Since 1990

    The major metropolitan areas of the United States experienced virtually all of their overall growth in suburban and exurban areas between 2000 and 2010. This is the conclusion of an analysis of the functional Pre-Auto Urban Cores and functional suburban and exurban areas using the Demographia City Sector Model.

    The City Sector Model
    The City Sector Model classifies zip code areas in the major metropolitan areas based on urban form (Note 1). These include four classifications, one of which replicates the urban form and travel behavior typical of the pre-World War II urban cores. These areas were typically higher density and dependent on transit and walking. The City Sector Model has three other classifications, Pre-Auto Urban Core, Auto-Suburban: Earlier, Auto-Suburban: Later and Auto-Exurban.

    For simplicity the City Sector categories are referred to as urban core, earlier suburban, later suburban and exurban. The City Sector Model is described in a previous article, and illustrated in Figure 1, which is also posted to the internet.

    The model makes it possible to analyze metropolitan areas based on smaller area functional classifications, rather than on jurisdictional (historical core municipality) borders, which among other things, mask as core large areas of suburbanization.

    Suburbanized Core Municipality Examples: San Jose and Charlotte

    This suburbanization in the historical core municipalities is illustrated by examples like San Jose and Charlotte. The City Sector Model indicates that neither of these metropolitan areas has a pre-auto urban core. This is because neither metropolitan area has a large enough concentration of houses with a median construction date of 1945 or before or sufficient area of 7,500 population density per square mile (2,900 per square kilometer) with a transit, walking and cycling work trip market share of at least 20 percent. As a result, virtually all of both metropolitan areas is automobile oriented suburban, including virtually all of the core municipalities.

    This is true in Charlotte despite its development of one of the most impressive new central business districts in the nation, with high employment densities. Yet at the same time the  core city of Charlotte itself is very low density (2010), at 2,500 per square mile (950 per square kilometer), less than the suburban area average for large US urban areas (2,600 per square mile or 1,000 per square kilometer). Charlotte, however, could develop the equivalent of a pre-auto urban core if its central population density rises enough and enough commuters use transit, walking and cycling.

    The core city of San Jose is far more dense than Charlotte, at 5,800 per square mile (2,200 per square kilometer). However, it is less dense than the suburbs of Los Angeles (6,400 per square mile or 2,500 per square mile). Like Charlotte, the core city of San Jose is virtually all automobile oriented suburban and has a transit work trip market share a full third below the major metropolitan area average.

    Overall Population Trend: 2000-2010

    These phenomena reflect national trends, All major metropolitan area growth between 2000 and 2010 (100.9 percent) was in the functional suburbs and exurbs.

    Between 2000 and 2010, the percentage of major metropolitan area population in the urban cores declined from 16.1 percent to 14.4 percent. The urban cores lost approximately 140,000 residents (a loss of 0.6 percent), despite strong gains very close to the centers of the historical core municipalities. Consistent with these findings, Census Bureau analysis showed that the focused gains in the cores of the urban cores were more than negated by losses in surrounding urban core areas (described in: Flocking Elsewhere: The Downtown Growth Story).

    The earlier suburban areas gained only modestly, adding 280,000 new residents, for a 0.4 percent increase. These areas have median house construction dates between 1946 and 1979. The largest increase was in the later suburban areas, which added the most new residents, 11.4 million, for a gain of 33.4 percent. The later suburban areas have median house constructions of 1980 or later. Exurban areas added 5.0 million residents, for a gain of 21.3 percent. Exurban areas are located outside the principal urban areas (Figure 2).

    Overall, the later suburban and exurban areas gained 16.4 million residents, compared to the combined gain of 130,000 in the urban cores and earlier suburban areas. Thus, more than 99 percent of the population growth in the major metropolitan areas was in the later suburban and exurban areas (Figure 3).

    During the decade, the exurban areas overtook the urban cores in population, rising from 15.4 percent of the major metropolitan area population to 16.8 percent (Figure 4).

    Contrast with 1990-2000 Population Trend

    Despite all of the talk of an urban core renaissance, the 2000 to 2010 decade was less favorable for urban cores than the 1990 to 2000 decade. In the earlier decade, the urban cores (as defined in 2010) added 960,000 residents, for a growth rate of 4.0 percent. This compares to the 140,000 urban core loss between 2000 and 2010 (Note 2).

    Virtually all of the difference was attributable to urban core population trend reversals in New York, Boston and Chicago, which combined experienced a drop in growth of 1.1 million. Between 1990 and 2000, the urban core of New York added 779,000 residents, far more than the 190,000 added between 2000 and 2010. Boston’s 1990-2000 urban core growth was 296,000, but fell to 27,000 in the last decade. Chicago’s urban core dropped from a gain of 139,000 to a loss of 175,000.

    Over the past twenty years, the population of urban cores has diminished relative to that of major metropolitan areas. In 1990, the urban cores represented 18.1 percent of the population, but fell to 14.1 percent in 2010. Auto-oriented areas (suburban and exurban) have increased their combined share from 81.9 percent of the major metropolitan area population in 1990 to 85.6 percent in 2010 (Figure $$$).

    Summary of Individual Metropolitan areas

    In 30 of the 52 major metropolitan areas, all or more of the population growth was in suburban and exurban areas between 2000 and 2010. This includes the metropolitan areas that do not have Pre-Auto Urban Cores.

    Chicago had the largest share of suburban and exurban population growth, at 148 percent. This occurred because of the substantial urban core population losses. The suburbs and exurbs of Providence captured 131 percent of its growth, slightly more than the 126 percent suburban and exurban share in St. Louis. Baltimore, Rochester and Milwaukee had more than 110 percent of their growth in the suburbs and exurbs. Cincinnati, Indianapolis, Louisville, and Kansas City rounded out the largest suburban and exurban growth shares, all over 105 percent.

    Despite the substantial decline in its urban core growth in the last decade, New York had the lowest share of population growth in the suburbs and exurbs (meaning that it had the highest share of population growth in the urban core). The suburbs and exurbs of New York captured only 69 percent of the metropolitan area growth, well below second place, Virginia Beach – Norfolk (81 percent). Boston was next at 83 percent, followed by San Francisco – Oakland, at 88 percent. The bottom 10 in suburban and exurban growth share also included Seattle, Washington, Philadelphia, Richmond, Hartford and Portland. Even so, each of these six metropolitan areas had more than 90 percent of their growth in suburban and exurban areas (Figure 6).

    Jurisdictional Analyses: Suburbs Masquerading in Cities

    The functional analysis based on urban form and behavior reveals substantially different trends compared to the conventional jurisdictional analysis that compares historical core municipalities, principal cities or primary cities to the balance of metropolitan areas. For example a jurisdictional analysis shows that core municipalities added 1,290,000 residents between 2000 and 2010. In contrast, the urban cores, as indicated in the functional analysis, lost 140,000 residents. This indicates the extent of to which municipal boundaries can mislead in the analysis of urban form within metropolitan areas. The expansive city limits of most core cities masks the substantial automobile oriented suburbanization within their own borders.

    —-

    Note 1: The City Sector Model is generally similar to the groundbreaking research published by David L. A. Gordon and Mark Janzen at Queen’s University in Kingston Ontario (Suburban Nation: Estimating the Size of Canada’s Suburban Population) with regard to the metropolitan areas of Canada. Gordon and Janzen concluded that the metropolitan areas of Canada are largely suburban. Among the major metropolitan areas of Canada, the Auto Suburbs and Exurbs combined contain 76 percent of the population, somewhat less than the 86 percent found in the United States.

    Note 2: Changes in zip code definitions and boundaries could result in minor differences in comparability between the three censuses.

    —-

    Wendell Cox is principal of Demographia, an international public policy and demographics firm. He is co-author of the "Demographia International Housing Affordability Survey" and author of "Demographia World Urban Areas" and "War on the Dream: How Anti-Sprawl Policy Threatens the Quality of Life." He was appointed to three terms on the Los Angeles County Transportation Commission, where he served with the leading city and county leadership as the only non-elected member. He was appointed to the Amtrak Reform Council to fill the unexpired term of Governor Christine Todd Whitman and has served as a visiting professor at the Conservatoire National des Arts et Metiers, a national university in Paris.

    Photo:  Later Suburbs in New York Urban Area (Morris County, New Jersey), by author