Category: Urban Issues

  • Guaranteed Minimum What?

    I was on the road a while back and needed to stop to use the facilities. A chain restaurant on the side of the highway seemed like a reasonable spot. As I headed to the men’s room I noticed iPads on all the tables. These are the new electronic menus. They don’t replace wait staff, but they do make the whole process of ordering food more efficient with a likely reduction in the overall number of humans needed to do the same amount of work. And there are all the other benefits that come with data mining and systems optimization. The global supply chain managers must love it.

    Here’s a multiplex movie theater with a generous supply of self serve ticketing machines. Swipe your card, touch a few icons on a screen, and presto!

    Here’s the automated check out cluster at the big box store. Six or eight self serve machines are now overseen by a single human attendant.

    CafeX is beta testing a robotic barista. Here’s where high tech and high touch converge on the masses.

    Humans are aggressively being eliminated from as many business models as possible. The early adopters will be the largest companies with the most to gain from improvements in efficiency. Over the next few years we’ll see fewer and fewer people behind the counters. There will always be a need for someone to wipe down the tables, mop the floors, and take out the trash so a few minimum wage level positions will linger on. And there will need to be slightly better trained folks to manage the machines. But the overall level of employment in the service economy will consistently contract.

    At the other end of the spectrum I enjoyed lunch at an upscale restaurant. The entree consisted of delicately prepared seasonal wild foraged mushrooms served with local organic mixed greens and “moss” which the attentive wait staff explained was sponge cake infused with pureed parsley. The dish was called The Forest. It was delicious. $80. Spot the difference?

    Agriculture was mechanized a century ago and the population migrated away from small farm towns to big industrial cities where factory jobs were plentiful.

    Industrial cities crested and then were depopulated as factories were sent elsewhere and people moved on to the suburbs to participate in the post industrial service economy.

    We’re now seeing the next wave of creative destruction transforming society. We don’t yet know how it will end. At the moment it looks like people with the skills to create and manage complex systems or build and maintain computer guided equipment will do pretty well. So what about everyone else?

    This isn’t a technical problem. It’s a cultural and political conundrum. Americans aren’t big fans of taxing the rich and redistributing the money to the folks lower down the food chain. We tend to think of that as social engineering and Godless communism. My best guess is that we’re not going to resolve these challenges in any intentional comprehensive logical manner. At least not at first. Instead circumstances are going to overwhelm us until enough of the population is miserable enough to demand real change. That’s been the historical model and it tends to be messy. Big fun.

    This piece first appeared on Granola Shotgun.

    John Sanphillippo lives in San Francisco and blogs about urbanism, adaptation, and resilience at granolashotgun.com. He’s a member of the Congress for New Urbanism, films videos for faircompanies.com, and is a regular contributor to Strongtowns.org. He earns his living by buying, renovating, and renting undervalued properties in places that have good long term prospects. He is a graduate of Rutgers University.

  • Déjà Vu and the Dilemma for Planners

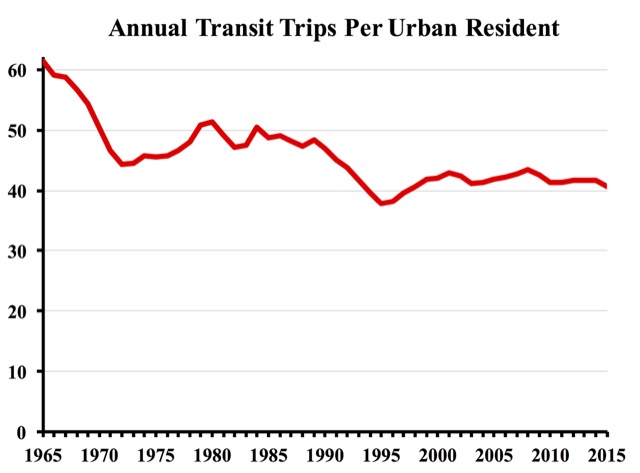
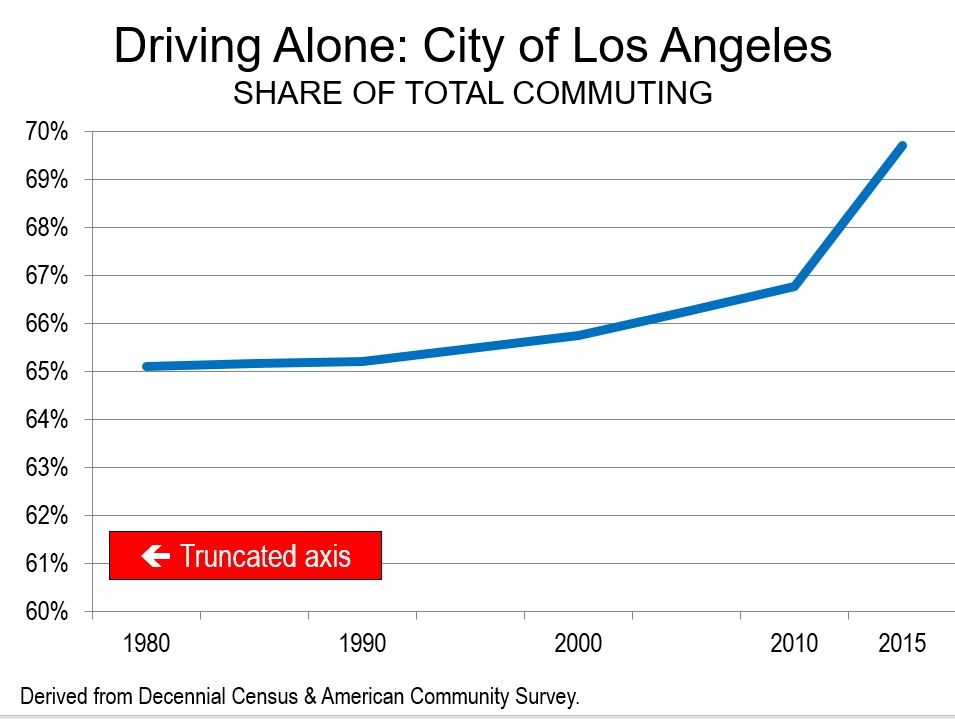
    Some planners may be feeling a little angst. A few months ago, the Federal Highway Administration released 2016 vehicle miles of travel data, indicating robust travel demand growth in 2016, up 2.8%. The increase pushed total vehicle miles of travel (VMT) to a new record and boosted travel per capita to levels not seen since mid-2008. That disappointment was compounded by the recent release of 2016 transit ridership data, indicating a decline of 2.3% in 2016, which compounds last year’s 1.3% decline. The disheartening news continued with the recent release of Census data indicating growth trends that had many highly urbanized counties loosing population while growth flourished in predominately suburban style counties. The top ten shrinking counties had a transit commute mode share over twice as high as the top ten growing counties. Piling on, other data indicates that millennials are morphing toward more traditional characteristics as “Millennials are starting to find jobs and relocating to the suburbs and smaller cities,” according to a recent Bloomberg article. “Everything we thought about millennials not buying cars was wrong,” says the title of a Business Insider news story.

    Meanwhile, in spite of an improving economy and the millennial generation aging, 31% of all 18- to 34-year-olds remain living in their parents’ home in 2016 – 46.9% in New Jersey—a large group that has not yet necessarily expressed their unconstrained preferences with respect to living location and mobility choices.

    Meanwhile, the expectations regarding automated (driverless) vehicles, most probably coupled with shared vehicle ownership and the adoption of electric vehicles, have ramped up. The trickle of public attention is now a firehose of media and policy interest as the public begins to grasp the speculated transformative implications.

    The planner is left in a dilemma. How in the world do we do long-range planning if we have so badly missed the mark about the future of mobility and housing choice?

    Future plans are influenced by four characteristics of interest: planners’ aspirations, revealed phenomenon and behaviors, stated preferences of stakeholders and the engaged public, and innovation and change. Each is discussed briefly below.

    Planners’ Aspirations

    Like in any profession, planners carry their own values and life experiences to work in the morning. These experiences and values influence their work. Historically the implications of varying politics was of subtle and nuanced relevance when there was a strong consensus on the critical role of providing transportation capacity, travel safety and cost effectiveness. However, in an era when everything is political, including transportation planning, different values have more significant implications going forward. As noted in a series of essays on planning theory nearly 40 years ago, the political nature of planning is no secret.

    “One of the planning profession’s most cherished myths – [is] that the planner is an apolitical professional, promoting goals that are widely accepted through the use of professional standards that are objectively correct.” (Burchell and Sternlieb, 1978)

    The recent past has seen the myth of an unbiased media exposed with explicit enumeration of political party registration, voting preferences, political contribution tallies, and measures of coverage bias. Such revelations show a media well out of sync with the public they serve. A consequence has been the polarization of media and audiences, which reinforces the value differences. Is the planning profession at risk of being similarly unmasked, and could political biases be impacting plans and their prospects for implementation? Can decision makers place full confidence in the objectivity of analyses and plans that are provided by planners? With the acknowledgement of the political nature of planning, should more senior planners be political appointees, or are other steps necessary to neutralize or expose planner biases?

    I have always enjoyed the Albert Einstein quote, “The right to search for truth implies also a duty; one must not conceal any part of what one has recognized to be true,” as it alludes to the sin of omission and the subtleties of objectivity. In our ever more politicized world, the politics of planning and planners is more relevant, yet it receives little attention.

    Revealed Phenomenon and Behaviors

    The foundation of planning practice is captured information about the behaviors of individuals and phenomenon and the use of that knowledge to predict how various policies and investments will perform in scenarios of future conditions. Examples include understanding the noise impacts of infrastructure as facilities are built, the emissions of vehicles in operation, and the travel of individuals when faced with various choices. Planners gain knowledge by observing history, discerning relationships, and extrapolating those relationships to reflect current and proposed future conditions—a process that often includes building and calibrating various models. Part of the current challenge of planning is understanding how valid historic relationships are for application to the future. People had, for example, observed changes in travel behavior and location decisions associated with millennials and extrapolated those to various conclusions regarding future transportation needs. Yet, a growing body of evidence suggests that the magnitude of those changes is not what had been expected, or perhaps hoped for. Many aspects of behavior are not fully understood and changes in demographics, economics, and technology are impacting behaviors in ways that are not reliably predicted based on current levels of knowledge. Our data and models are not always keeping up with changes. Thus, caution should be used in presuming significant variance from historic norms in fundamental travel and location behaviors, as the reversion toward historic trends in travel demand and development trends reveal.

    Stated Preferences

    “If I had asked people what they wanted, they would’ve said faster horses.”

    This quote, attributed to Henry Ford, is often used to characterize the fact that people’s aspirations for the future are often constrained by the range of experiences to which they been exposed. While historians debate if this quote originated with Henry Ford, it has stirred discussion about the extent to which people’s current aspirations should be a basis for guiding future actions.

    The good intentions of planners have resulted in outreach and public participation initiatives to support planning efforts. Virtually ubiquitous communications have enabled broad dissemination of sophisticated information. The solicitation of input from the public offers many benefits: creating a sense of ownership of plans, bringing information and ideas to the table that have not previously been articulated, and cueing planners and decision makers to critical issues that may need to be addressed before approvals and successful implementation can occur. But public expressions about future desires or behaviors may not be a sound basis for action.

    Stated preferences often run counter to revealed preferences. Everybody knows a doting parent who years earlier had sworn off having kids or has witnessed the bitter divorce of a couple not long after having seen them vow lifelong commitments. The stated expectations for how people will act in the future often run counter to strong evidence of how people actually behave. The literature is replete with examples of stated preferences varying substantially from actual choices, yet we have little guidance for how to “calibrate” expressions of stated preferences against revealed behaviors such that our plans will more closely address actual future needs.

    Innovation and Change

    The final factor influencing future plans is the impact of innovation and change. As we are beginning to grasp the potentially transformative impacts of technology, it has flummoxed our ability to plan for the future. Many marvel at the transformative impact of smartphones over a single decade, pointing out how everything from retail to media to business to social interactions has been profoundly impacted. Many are anticipating that self-driving vehicles will inevitably have a similar transformative impact on transportation and land-use. Massive financial and intellectual resources are being directed at transportation, and significant change is inevitable. The costs and impacts of transportation merit this attention. Unfortunately, the long lead times, high costs, and constrained flexibility of many traditional transportation investments make them particularly susceptible to risk if driverless, shared, and electric vehicles become dominant.

    So What

    So in summary, planners’ biases might be more relevant than in the past, our foundational knowledge of behaviors and relationships is getting shaky as the world changes in multiple dimensions, we often don’t know how to interpret the public’s aspirations, and the pace of technological change might be undermining our historically infrastructure-intensive strategy for dealing with transportation. So planners have some big challenges and important issues to address to insure scarce resources serve the public well. Responding to that challenge is a noble calling, to be sure. On the other hand, if you are overwhelmed with the challenges planners face, both Uber and Lyft are looking for drivers. Bridj—not so much.

    This piece first appeared on Planetizen.

    Dr. Polzin is the director of mobility policy research at the Center for Urban Transportation Research at the University of South Florida and is responsible for coordinating the Center’s involvement in the University’s educational program. Dr. Polzin carries out research in mobility analysis, public transportation, travel behavior, planning process development, and transportation decision-making. Dr. Polzin is on the editorial board of the Journal of Public Transportation and serves on several Transportation Research Board and APTA Committees. He recently completed several years of service on the board of directors of the Hillsborough Area Regional Transit Authority (Tampa, Florida) and on the Hillsborough County Metropolitan Planning Organization board of directors. Dr. Polzin worked for transit agencies in Chicago (RTA), Cleveland (GCRTA), and Dallas (DART) before joining the University of South Florida in 1988. Dr. Polzin is a Civil Engineering with a BSCE from the University of Wisconsin-Madison, and master’s and Ph.D. degrees from Northwestern University.

    Top photo: Daryl Hutchison, darylhutchison.com

    .

  • The Evolving Urban Form: Warsaw

    Like other major cities in the high income world, Warsaw has seen central area population losses, with all of the population growth taking place outside the urban core, principally in the suburbs and exurbs (Graphic 1). The city’s districts were reconfigured so that direct comparisons cannot be made before the 2002 census.

    The Warsaw region consists of the city of Warsaw, a county-level national jurisdiction (powiat) and seven powiats in the suburbs and nine in the exurbs. The Warsaw region grew from 3.31 million residents in 2002 to 3.58 million in 2016, a 0.5 percent annual growth rate. Warsaw’s slow growth is substantially faster than that of the nation, which has not gained in population since 2002, both as a result of a below-replacement fertility rate and migration to other parts of Europe.

    The Central District

    The central district (Śródmieście), which includes the central business district (CBD) and the central railway station (Warszawa Centralna) experienced a loss in population of 14 percent from the 2002 census to 2016, according to the Central Statistical Office of Poland.

    The skyline of Warsaw (Graphic 2) used to be dominated by the Palace of Culture and Science, which was constructed as a “gift” to the Polish people from Soviet leader Josef Stalin in the early 1950s (though completed after his death). It is sometimes called the “Eighth Sister,” referring to its similarity to the “seven sisters” in Moscow that share a very similar “wedding cake” design. Like Moscow State University and Ukraina Hotel buildings in the Russian capital, the Palace of Culture and Science is fully symmetric from the base up. The Palace is located at the very center of Warsaw, adjacent to Warszawa Centralna and even has suburban rail entry structures in the surrounding green area.

    The building spent decades as a reviled reminder of Soviet domination and the restrictions imposed under Soviet communism. When the Poles took control of their own destiny about 28 years ago, there was considerable pressure to dismantle the Palace as many felt it was a symbol of oppression. The parliament defeated a measure to demolish the building, despite significant public pressure. Today, the Palace seems to have been, at least reluctantly accepted. It is now impressively lighted at night.

    Since that time, the building has had a significant change in function. The building now houses offices, a museum, university facilities, the Polish Academy of Sciences, a fitness center and other functions. Even so, some people will still tell you that the best place to see Warsaw from is the Palace of Culture and Science, because it is the one place from which you cannot see the building. However, the view from the top is certainly worthwhile (Graphics 3-8).

    A number of new, modern skyscrapers have been built, principally to the west. The buildings, however, are not closely packed, as would be expected in an American, Canadian, or Australian central business district. Graphic 9 shows the skyline, with the Palace of Culture and Science in the center and other large buildings around it. The distribution of Warsaw’s post-Soviet commercial high rises is similar throughout both the central districts and the inner districts, widely spaced and reflecting a modern metropolitan area that has become much more automobile oriented.

    The central district also includes the intersection of (Pope) Jana Pawla II and Solidarity (the trade union led by Poland’s first post-Soviet president, Lech Walesa), boulevards named for two of the strongest forces responsible for separation from control by the Soviet Union and restoration of Polish independence (photograph at the top). Significantly, one of the corners of the intersection is occupied by a McDonald’s, one of the most obvious symbols of the market economy that Poland has embraced.

    The central district also includes the “old town,” which like most of Warsaw was reduced to rubble by the bombing and street battles of World War II, including the premeditated destruction of the city by retreating German forces. It has been painstakingly rebuilt as it was before (Graphic 10).

    Other Districts of Warsaw

    The inner ring of districts, each of which borders on Śródmieście, lost eight percent of its population between 2002 and 2016. These six districts include Mokotów, Ochota, Praga Północ, Praga Południe, Wola and Żoliborz.

    The outer city districts gained 13 percent in population. Their nearly 120,000 gain more than offset the 60,000 loss in the inner ring districts and the 20,000 loss in the central district.

    Suburbs and Exurbs

    The inner suburban powiats captured most of the growth, growing 20 percent, and adding 182,000 residents. Growth in the outer nine counties was much less, at three percent and 20,000. Nearly 85 percent of the Warsaw area’s population growth occurred in these suburban and exurban areas (Graphics 11 and 12).

    The suburban and exurban residential areas are comparatively sparsely developed. Development is more contiguous in the inner ring of suburbs and much less dense exurbs of the outer ring (Graphics 13-16). Many suburban and exurban residential streets are far narrower and often without sidewalks and curbs. The suburban infrastructure generally appears to be of a lower standard than is found in the suburban areas of Australia, Canada and the United States, where larger individual developments have been required to install wide streets, sidewalks and usually sewers, as opposed to the generally smaller or even individually developed parcels that are more evident in suburban Warsaw.

    Nevertheless, Warsaw, and Poland, are developing rapidly. Real gross domestic product per capita in the nation has increased by at least three times since 1990. The shopping centers of Warsaw look very much like others in the core of western Europe, and even similar to those in Canada and the United States. The nation is constructing a high-speed motorway system, which has among the highest posted speeds in the world, at 140 kilometers per hour (87 miles per hour), though a number of important segments remain to be built. After many difficult decades, Warsaw and Poland are truly a part of modern Europe.

    Wendell Cox is principal of Demographia, an international public policy and demographics firm. He is a Senior Fellow of the Center for Opportunity Urbanism (US), Senior Fellow for Housing Affordability and Municipal Policy for the Frontier Centre for Public Policy (Canada), and a member of the Board of Advisors of the Center for Demographics and Policy at Chapman University (California). He is co-author of the “Demographia International Housing Affordability Survey” and author of “Demographia World Urban Areas” and “War on the Dream: How Anti-Sprawl Policy Threatens the Quality of Life.” He was appointed to three terms on the Los Angeles County Transportation Commission, where he served with the leading city and county leadership as the only non-elected member. He served as a visiting professor at the Conservatoire National des Arts et Metiers, a national university in Paris.

    Top Photograph: Street signs at the intersection of Jana Pawla II and Solidarity, named respectively for their roles in securing independence from the Soviet bloc (Pope John Paul II and the Solidarity Trade Union, led by eventual President Lech Walesa). By author.

  • The Springfield Strategy

    I just enjoyed an adventure in Springfield, Massachusetts with Steve Shultis and his wife Liz of Rational Urbanism. Steve does a far better job of describing his town and his philosophy than I ever could, but my interpretation can be summed up with an analogy about an old college room mate.

    At the end of my first year at university I was approached by an engineering student who asked if he could be my room mate next year. We didn’t know each other particularly well and didn’t have much in common, but he seemed harmless enough. I shrugged. Sure. We went our separate ways over the summer and in September he appeared at my door. After a few months of successfully sharing accommodations I asked him why he came to me when most guys in his situation would have gone in a very different direction. He explained.

    The average college freshman tends to have an adolescent understanding of what a good independent life might be like. Young men are motivated by peculiar impulses and the siren song of the frat house calls. Beer. Parties. Girls. Sports cars. The prestige of hanging out with rich kids, athletes, and really popular older guys. He said that was usually a big mistake. The furniture is made of plastic milk crates. The place smells like a locker room. People eat ramen and cold day old pizza out of the box. They wear flip flops in the shower because no one has ever cleaned the bathroom. Ever. And when you bring a girl home there are a dozen bigger richer guys with fancier cars than you hovering around. You sit there trying to get your romance on with posters of naked women taped to the walls next to a collection of empty bottles. And you pay extra for all this… It’s just not a great situation.

    Then he made a sweeping motion with his hand indicating our apartment. A pleasing mixture of antiques and modern pieces. Smells like lemons. When he brings a girl home I’m in the kitchen cooking brisket and home made bread. Soft lighting. Ella Fitzgerald is playing in the background. No competition. And it’s cheaper. For him, doing the unorthodox and socially uncomfortable thing was just… rational.

    Back to Springfield. Steve took a version of the same strategy. He and his family live in a gracious four story French Second Empire mansion. The place is huge and everywhere you look there’s a level of detail and quality you can’t find in any home built today. There’s a legal apartment on the lower level that they use as a guest suite.  I looked up the address on a real estate listing site and he paid less for this house than many people spend on their cars. His family has a quality of life and a degree of financial freedom that none of his suburban piers can comprehend.

    Most people load themselves up with massive amounts of debt in order to live the way they believe they’re supposed to. You wouldn’t want to put your kids in a substandard urban school with the wrong element. You wouldn’t want to buy a house that never appreciated in value. You wouldn’t want to have to explain to your friends, family, and co-workers that you live in a slum with poor black people and Puerto Ricans. And where do you park?! It’s so much “better” to soak yourself in debt to buy your way in to the thing you believe you can’t live without.

    A walk around the block brought us to the family doctor, numerous great places to eat, and one of the best little Italian grocery stores I’ve seen in years.

    A few more blocks and we arrived at the civic center, museum district, and numerous pubic parks. Like most older downtown areas Springfield experienced decades of depopulation and disinvestment with white flight to the suburbs and out migration to the sun belt. As the years passed and the economy shifted once again some downtowns boomed, but it was a winner-take-all scenario in Boston, New York, and San Francisco that hasn’t touched second and third tier towns farther afield. Springfield is half empty, but the full half is amazing and spectacularly affordable.

    If you’re looking for a large fully detached home with a yard Springfield has an abundance. These elegant homes are right on the edge of downtown within bicycle distance. This is an excellent alternative to suburban living for families with children who appreciate urban amenities. Homes like these close to Boston sell for millions. In Springfield they sell for pennies on the dollar.

    I like to poke around the ugly parts of town in search of hidden nuggets. The most interesting people tend to need two things: affordable property and a lightly regulated environment. It helps if absolutely no one with any authority cares about the location.

    Gasoline Alley is the old industrial corridor that supplies Springfield with fuel and associated services. More than a few of the older buildings are no longer viable for their original purposes. Lo and behold, the void is being filled with good music, food and drink.

    As much as I appreciate the “creative class’ and the importance of “third places” at the end of the day towns need to be productive before anything else can be supported. Local indoor food production is a viable business model in Springfield. It costs 56¢ to grow a head of lettuce hydroponically and it sells for $3. At first I questioned the level of electricity and other inputs associated with this kind of cultivation. Isn’t it just cheaper and easier to grow things in the ground with sunlight? Turns out… not so much most of the year in Massachusetts.  The alternative is bringing veggies in from California and Florida in refrigerated trucks. That involves far more energy and creates a critical dependency on systems locals have no control over. This particular entrepreneur can’t keep up with demand for his products.

    That takes me to another point that no one seems to be talking about these days. Towns like Springfield were once the economic engines of their day. They managed to engage in national and international trade while doing so in an intensely local manner. The primary resources used for commerce and industry were readily at hand: hydro power from rivers, wood from abundant forests, and minerals from local quarries. And raw materials and finished products were transported along the canal system using nothing more than a mule pulling a barge. If you’re looking for an environmental, renewable, durable, and resilient economic base you could do a lot worse than re-inhabiting the mothballed facilities in a place like Springfield.

    This piece first appeared on Granola Shotgun.

    John Sanphillippo lives in San Francisco and blogs about urbanism, adaptation, and resilience at granolashotgun.com. He’s a member of the Congress for New Urbanism, films videos for faircompanies.com, and is a regular contributor to Strongtowns.org. He earns his living by buying, renovating, and renting undervalued properties in places that have good long term prospects. He is a graduate of Rutgers University.

  • The Great Non-Profit Die Off

    Marc Lapides wrote an op-ed in Crain’s Chicago Business calling for an 1871 accelerator for creating new non-profits.

    Most cities could actually use the opposite. What they need is an infrastructure for euthanizing non-profits that are past their expiration date.

    When I look around older cities, I frequently see that they’ve got a veritable armada of non-profits. Rarely do I see these making a huge difference in the trajectory of the city.

    The usual complaint about too many non-profits is that they aren’t coordinated, and so often overlap or don’t work well together on whatever cause it is they are trying to advance.

    This actually doesn’t bother me. The temptation to try to create a single uber-structure for everything is always there, but distributed systems have their own virtues. And where there are legitimate problems, the organizations generally come up with a solution. An example is the various “clearing house” organizations that charitable orgs use to prevent double-dipping.

    The bigger problem is that all these non-profits are basically sand in the gears that make it harder to get anything done. While the Lapides talks about innovation, from what I’ve seen non-profits seem to be among the biggest advocates for the status quo.

    Ironically, Lapides implicitly makes this point when he acknowledges funders prefer big, established organization.

    Try to do anything in a city and you’ll be told to meet with all these “stakeholders”, a large percentage of whom are non-profit leaders who claim to speak in the name of some constituency or cause but too often represent their own personal fief.

    Anyone wanting to do things in a city has to run this gauntlet of non-profits and find a way to placate them.

    Sean Safford’s famous study “Why the Garden Club Couldn’t Save Youngstown” is a perfect example of this. The Garden Club – a non-profit – was basically a vehicle for reinforcing existing social networks, creating excess social capital that made change difficult.

    Too many cities are like Safford’s Youngstown. They could use a culling of non-profits more than the creation of new ones.

    Killing unneeded stuff off is hard almost everywhere. For example, eliminating an obsolete app or even a report can be very difficult, as I can tell you from my IT experience. But I can also tell you a lot of them do very little. One time I replaced a legacy system with over a thousand reports. We went live with less than 15 initially critical reports, and the lack of the other 1000+ made no difference. In cities, the Pareto principle likely applies to non-profits as it does everywhere else: the top 20% most effective non-profits deliver 80% of the public benefits.

    But just because eliminating organizations is hard doesn’t mean it’s not worthwhile. In cities that are having trouble changing or dealing with problems, leaders should be looking harder at getting rid of a bunch of non-profits than they are at starting new ones.

    This piece was originally published on Urbanophile.

    Aaron M. Renn is a senior fellow at the Manhattan Institute, a contributing editor of City Journal, and an economic development columnist for Governing magazine. He focuses on ways to help America’s cities thrive in an ever more complex, competitive, globalized, and diverse twenty-first century. During Renn’s 15-year career in management and technology consulting, he was a partner at Accenture and held several technology strategy roles and directed multimillion-dollar global technology implementations. He has contributed to The Guardian, Forbes.com, and numerous other publications. Renn holds a B.S. from Indiana University, where he coauthored an early social-networking platform in 1991.

    Image via Crain’s Chicago Business.

  • Subsidies Haven’t Increased Transit Ridership

    In 2015, the American Public Transportation Association issued a press release whose headline claimed that transit ridership in 2014 achieved a new record. However, the story revealed that 2014 ridership was the highest since 1956. That’s no more a record than if it was the highest since 2013.

    The truth is that America’s urban population more than doubled between 1956 and 2014. Using the ridership number that really counts–trips per urban resident–2014’s number was a near-record low of 41 trips per person. The only time it was lower before 2014 was a few years in the mid-1990s, when ridership dropped to as low as 38 trips per person. The rate may fall to nearly that level in 2016.

    When Congress passed the Urban Mass Transportation Act of 1964, Americans took an average of 62 transit trips per person. At that time, 82 percent of all transit systems were privately owned. Within a decade, nearly every major transit system and all but a handful of minor ones were “municipalized” and the subsidies began to flow. At first, the federal government provided only capital subsidies, but in 1974 it also provided operating subsidies.

    By 1978, half of operating costs and, of course, all of the capital costs were subsidized. By the late 1980s, fares covered only a little more than a third of operating costs. With most money coming from taxpayers, transit agencies were more beholden to politicians than transit riders, and they became more interested in spending money to please political interests than in boosting transit ridership.

    Since 1965, transit operating subsidies (adjusted for inflation to today’s dollars) total close to $800 billion. We don’t have accurate capital cost data from before 1992, but since then we’ve spent close to $400 billion on capital programs (which in the transit industry include maintenance), most of it on rail transit.

    Thus, well over a trillion dollars in subsidies has resulted in transit ridership falling from 61 trips per urban resident in 1965 to 41 trips in 2015, and even less in 2016. The chart above shows that trips per urbanite have fluctuated since 1970, but those fluctuations are mainly in response to gasoline prices while the general trend is downward. To a large degree, this downward trend is because the subsidies have made transit agencies more responsive to politics than transit riders.

    Advocates of industrial policy argue that government should pick growth industries and nurture them along to help maintain American preeminence in new technologies. Skeptics suggest that government is more likely to pick losers than winners. Transit is clearly one of those losers.

    Most statistics in this post are from the American Public Transportation Association’s 2016 Public Transportation Fact Book data spreadsheet. Data for 2015 is from the National Transit Database. Urban population data are from the Census Bureau.

    This piece first appeared on The Antiplanner.

    Randal O’Toole is a senior fellow with the Cato Institute specializing in land use and transportation policy. He has written several books demonstrating the futility of government planning. Prior to working for Cato, he taught environmental economics at Yale, UC Berkeley, and Utah State University.

    Photo:

  • California Squashes Its Young

    In this era of anti-Trump resistance, many progressives see California as a model of enlightenment. The Golden State’s post-2010 recovery has won plaudits in the progressive press from the New York Times’s Paul Krugman, among others. Yet if one looks at the effects of the state’s policies on key Democratic constituencies— millennials, minorities, and the poor—the picture is dismal. A recent United Way study found that close to one-third of state residents can barely pay their bills, largely due to housing costs. When adjusted for these costs, California leads all states—even historically poor Mississippi—in the percentage of its people living in poverty.

    California is home to 77 of the country’s 297 most “economically challenged” cities, based on poverty and unemployment levels. The population of these cities totals more than 12 million. In his new book on the nation’s urban crisis, author Richard Florida ranks three California metropolitan areas—Los Angeles, San Francisco, and San Diego— among the five most unequal in the nation. California, with housing prices 230 percent above the national average, is home to many of the nation’s most unaffordable urban areas, including not only the predictably expensive large metros but also smaller cities such as Santa Cruz, Santa Barbara, and San Luis Obispo. Unsurprisingly, the state’s middle class is disappearing the fastest of any state.

    California’s young population is particularly challenged. As we spell out in our new report from Chapman University and the California Association of Realtors, California has the third-lowest percentage of people aged 25 to 34 who own their own homes—only New York and Hawaii’s are lower. In San Francisco, Los Angeles, and San Diego, the 25-to-34 homeownership rates range from 19.6 percent to 22.6 percent—40 percent or more below the national average.

    Read the entire piece at City Journal.

    Joel Kotkin is executive editor of NewGeography.com. He is the Roger Hobbs Distinguished Fellow in Urban Studies at Chapman University and executive director of the Houston-based Center for Opportunity Urbanism. His newest book, The Human City: Urbanism for the rest of us, will be published in April by Agate. He is also author of The New Class ConflictThe City: A Global History, and The Next Hundred Million: America in 2050. He lives in Orange County, CA.

    Wendell Cox is principal of Demographia, an international public policy and demographics firm. He is a Senior Fellow of the Center for Opportunity Urbanism (US), Senior Fellow for Housing Affordability and Municipal Policy for the Frontier Centre for Public Policy (Canada), and a member of the Board of Advisors of the Center for Demographics and Policy at Chapman University (California). He is co-author of the “Demographia International Housing Affordability Survey” and author of “Demographia World Urban Areas” and “War on the Dream: How Anti-Sprawl Policy Threatens the Quality of Life.” He was appointed to three terms on the Los Angeles County Transportation Commission, where he served with the leading city and county leadership as the only non-elected member. He served as a visiting professor at the Conservatoire National des Arts et Metiers, a national university in Paris.

    Photo: Dirk Beyer (Own work) [GFDL, CC-BY-SA-3.0 or CC BY-SA 2.5], via Wikimedia Commons

  • America the Cheap

    America is a price dominant culture, and we need to take responsibility for that when we complain about bad customer service, poor infrastructure, etc. Certainly American business and political leadership could be better, but they aren’t the ones who decided to shop at Wal-Mart instead of the local store (favoring short term financial gain over long term community loss). Nor are they the ones who force us to vote for politicians promising something for nothing.

    This is the subject of my latest City Journal piece, “America the Cheap“:

    American politicians understand this. That’s why they frequently promise voters something for nothing, or free stuff with other people’s money. Republicans promise to “eliminate fraud and waste” or to increase government revenues somehow by slashing taxes, or through some other cost-free method. Democrats say that they are going to tax “the rich,” such as when New York City mayoral candidate Bill de Blasio said that he would give all New Yorkers free pre-K education, funded by a special surtax on high-income households (i.e., somebody else).

    European social democracies offer extensive government services and generously funded safety-net programs. But these come with high taxes for the average citizen. Few American politicians are willing to advocate explicitly for that. They keep promising citizens a free lunch. And why not? It seems to be what we want to hear: there’s some magic elixir that can transmute lead into gold.

    The populists are right that corporate, governmental, and cultural elites have too often let America down, and even sometimes acted disgracefully. But that doesn’t mean that the man on the street is off the hook. Just because someone else is guilty doesn’t mean that we’re all innocent. If populism takes a high view of the ordinary citizen, then it should also recognize the importance of these citizens’ decisions in shaping the world we live in.

    Click through to read the whole thing.

    Aaron M. Renn is a senior fellow at the Manhattan Institute, a contributing editor of City Journal, and an economic development columnist for Governing magazine. He focuses on ways to help America’s cities thrive in an ever more complex, competitive, globalized, and diverse twenty-first century. During Renn’s 15-year career in management and technology consulting, he was a partner at Accenture and held several technology strategy roles and directed multimillion-dollar global technology implementations. He has contributed to The Guardian, Forbes.com, and numerous other publications. Renn holds a B.S. from Indiana University, where he coauthored an early social-networking platform in 1991.

    Photo Credit: Mike Kalasnik, CC BY-SA 2.0

  • Driving Alone Hits High, Transit Hits Low in “Post-Car” City of Los Angeles

    According to The New York Times, the car used to be “king” in the city (municipality) of Los Angeles. “’A Different Los Angeles’, The City Moves to Alter its Sprawling Image,” was another story that seeks to portray the nation’s second largest municipality as having fundamentally changed. Following this now popular meme, a Slate story in 2016 referred to Los Angeles becoming “America’s next great transit city.” Los Angeles has surely become America’s greatest transit tax city, with Los Angeles County voters in 2016 approving a fourth half-cent sales tax increase principally for transit since 1980. Yet transit’s market share has fallen, not only in the nation’s largest county but even in the city of Los Angeles.

    The Ascent of Transit: A False Narrative

    The Los Angeles political establishment and media is virtually unanimous in its praise for the now quarter century old rail system. Yet, despite more than $15 billion being spent on rail transit the already meager levels of transit commuting in the city have fallen further, while solo driving has risen to an all time high. Unless platitudes are more important than results, rail’s success is a false narrative. People are driving more and using transit less according to the American Community Survey for 2015.

    The share of city of Los Angeles residents commuting by transit fell from 11.2 percent in 2010 to 9.5 percent in 2015 (Figure 1, note truncated axis). The 2010 figure was the highest decennial census year transit figure in the period starting in 1980. Just five years later, in 2015, however, the city of Los Angeles transit commuting share had fallen below 1980 levels.

    In 1980, 10.8 percent of the city’s commuters used transit, a figure that fell to 10.5 percent just before the initial Long Beach “Blue Line” opened in 1990. While new light rail lines and the Metro (subway) line opened after 1990, transit’s market share fell further, to 10.1 percent by 2010. During the 2000s, transit commuting rose 1.1 percentage points to the 11.2 percent figure, propelled by unprecedented gasoline price increases. But progress was short-lived as the share dropped to 9.5 percent in 2015.

    City of Los Angeles Surge in Driving Alone

    At the same time, commuters were turning even more to driving alone. In 2015, 69.8 percent of work trip access was by solo drivers. This represents a substantial increase from the 66.8 percent drive alone share in 2010. From 1980 to 2010, driving alone edged up slightly, much less than the increase in the last five years. In 1980, 65.1 percent of commuters drove alone. In 1990, a nearly identical 65.2 percent drove alone. In the last five years, driving alone has risen more than the entire previous 30-year increase in the city of Los Angeles.

    The news could get worse. According to new American Public Transportation (APTA) data, total ridership on all Los Angeles County MTA services dropped more than five percent from 2016. The APTA reported decline is astounding, since the highly touted extension of the Expo light rail line to downtown Santa Monica opened in 2016. Even more astounding is that the expensive, at least seven line (counted at radial line ends plus the transverse Green Line) system has added not a soul to transit ridership on the Los Angeles MTA bus and rail system since 1985. Not all MTA service is in the city of Los Angeles, however, the APTA data could presage a further transit market share decline in the city with the American Community Survey data due in the Autumn.

    All of this is consistent with the larger trend in the Los Angeles metropolitan area (which includes Los Angeles and Orange Counties). Overall, the transit work trip market share in the metropolitan area fell from 6.1 percent in 2010 to 5.1 percent in 2015. The MTA 2016 decline is likely to push this figure lower.

    The Illusion of a “Different Los Angeles”

    Yet to read the press and media accounts in Los Angeles, one might be inclined to believe an alternate reality that LA transit is ascendant.

    Christopher Hawthorne, who teaches urban and environment policy at Occidental College told The New York Times that the recent defeat of a development moratorium, along with approval of the transit tax and an affordable housing measure is “a very clear statement from the voters that they want a different Los Angeles.”

    The voters may want a different Los Angeles, but apparently commuters are sufficiently happy with driving and have been for the more than a quarter century since rail transit was restored to Los Angeles. This is not surprising, since the average commuter can reach 60 times as many jobs by car in 30 minutes in the Los Angeles metropolitan area as by transit. (30 minutes is the average one-way commute time in the metropolitan area). Data is not available for the city of Los Angeles (see: “Access in the City”).

    However, it is a generally hopeless task for transit to be an alternative to the automobile, except for trips to and from the urban core (downtown and nearby). The reality is that it could take as much as the total income, every year, of a metropolitan area to provide transit that could effectively compete with the car throughout a metropolitan area for work and other trips.

    Platitudes do not ride, people do. At least with respect to the implied transit ridership increases and forsaken cars, the “different” Los Angeles is an illusion, completely inconsistent with reality.

    Wendell Cox is principal of Demographia, an international public policy and demographics firm. He is a Senior Fellow of the Center for Opportunity Urbanism (US), Senior Fellow for Housing Affordability and Municipal Policy for the Frontier Centre for Public Policy (Canada), and a member of the Board of Advisors of the Center for Demographics and Policy at Chapman University (California). He is co-author of the “Demographia International Housing Affordability Survey” and author of “Demographia World Urban Areas” and “War on the Dream: How Anti-Sprawl Policy Threatens the Quality of Life.” He was appointed to three terms on the Los Angeles County Transportation Commission, where he served with the leading city and county leadership as the only non-elected member. He served as a visiting professor at the Conservatoire National des Arts et Metiers, a national university in Paris.

    Photo: Los Angeles City Hall (by author)

  • Reason #1 to End Transit Subsidies: It’s the Most Costly Transportation We Have

    Fifty-three years ago, the transit industry was mostly private and earned a net profit. Today, it’s almost entirely publicly owned, and subsidies have grown out of control. It’s time to take a stand and say all transportation subsidies are bad, but transit subsidies are the worst.

    The National Transit Database says agencies spent more than $64 billion in 2015 yet collected less than $16 billion in fares. They carried about 55 billion passenger miles, for an average cost of $1.15 per passenger mile, of which 87 cents was subsidized. No other major mode of passenger transportation is anywhere near this expensive.

    Americans spent about $1.1 trillion buying, operating, repairing, and insuring cars and light trucks in 2015, but they also drove their autos nearly 2.8 trillion miles. At average auto occupancies of 1.67 people (see table 16), that’s 4.6 trillion passenger miles by auto, for an average cost of about 24 cents per passenger mile. We don’t have 2015 data yet, but in 2014, government agencies spent about $72 billion subsidizing roads (add the $98 billion in “other taxes and fees” to the minus $10 billion in “less amount for nonhighway purposes” and the minus $16 billion for “less amount for mass transportation”).

    This is more than was spent subsidizing transit, but those roads not only produced 70 times as much passenger travel, they were used to ship more than a quarter of the freight moved in this country. Ignoring the freight, the subsidy was about 1.6 cents per passenger mile, meaning the total cost of transit was more than four times the cost of driving.

    Airfares are about 14 cents a passenger mile, making air travel a bargain. Airline subsidies are only a couple of cents a passenger mile (subtract government expenditures from government revenues and divide by passenger miles). Amtrak subsidies are comparatively horrendous at 22 cents a passenger mile but are still only a quarter of transit subsidies.

    Transit is expensive because it is subsidized. Lacking any need to keep costs within revenues, transit agencies spend way too much money accomplishing far too little. It is time to stop all transportation subsidies, but as the most-heavily subsidized form of transportation, transit should be the priority.

    This piece first appeared on The Antiplanner.

    Randal O’Toole is a senior fellow with the Cato Institute specializing in land use and transportation policy. He has written several books demonstrating the futility of government planning. Prior to working for Cato, he taught environmental economics at Yale, UC Berkeley, and Utah State University.

    Photo: Robert Dyess, CC License