Category: Urban Issues

  • Rust Belt Chic And The Keys To Reviving The Great Lakes

    Over four decades, the Great Lakes states have been the sad sack of American geography. This perception has been reinforced by Detroit’s bankruptcy filing and the descent of Chicago, the region’s poster child for gentrification, toward insolvency.

    Yet despite these problems, the Great Lakes’ future may be far brighter than many think. But this can only be accomplished by doubling down on the essential DNA of the region: engineering, manufacturing, logistics, a reasonable cost of living and bountiful natural resources. This approach builds off what some local urbanists, notably Jim Russell, have dubbed “rust belt chic.”

    With a population of 58 million, the Lakes region boasts a $2.6 trillion economy equal to that of France and far larger than the West Coast’s. (We define the region geographically as comprising the western ends of New York and Pennsylvania, northeastern Minnesota, and Ohio, Indiana, Illinois, Michigan and Wisconsin.) Despite the growth in auto manufacturing in the South, the Great Lakes region still accounts for the vast majority of jobs in the resurgent industry, now operating at record levels of capacity.

    Since 2007, Michigan, Indiana, Ohio and Wisconsin have ranked among the top five states for growth in industrial jobs, adding a half million new manufacturing jobs since 2009.

    To build on this progress the region needs to focus on its human assets. This starts with by far the nation’s largest concentration of engineers, some 318,000, which stems from the oft unappreciated fact that manufacturing employs the majority of scientists and engineers in the nation. It also accounts for almost 70% of corporate research and development. This includes disciplines such as mechanical engineering, which according to a recent EMSI study, has enjoyed steady job and income growth over the past 20 years.

    Another critical asset is the concentration of skilled trades, the workers most sought after by employers, according to a recent Manpower survey. To keep this advantage, the area needs to focus on educating its workforce — particularly in neglected inner city neighborhoods — with skill training for jobs that actually exist and are expected to grow. This is already occurring in some states, such as Ohio.

    To be sure, traditional manufacturing jobs, particularly for the unskilled and semi-skilled, likely will never come back in large numbers. But the earnings level for skilled workers will remain well above the national average, and may increase even further as shortages develop.

    Some dismiss such blue-collar strengths as a critical weakness. They suggest that area residents might decamp for places like Silicon Valley where they can find livelihoods cutting hair and providing other personal services for the digerati.

    Of course, no sane Great Lakes leader would endorse this approach in public, but many, instead of embracing “rustbelt chic” prefer to recreate a faux version of America’s left coast. This obsession goes back at least a decade, reaching its most risible level during the time of former Michigan Gov. Jennifer Granholm. Her strategy focused on turning its cities — including Detroit — into “cool” burgs.

    This clearly did little to turn around either already beleaguered state or cities; “cool” did not save Detroit from bankruptcy. Indeed cool represents just one variation in a myriad of Rust Belt elixirs, including casinos, convention centers, “and creative class oriented arts districts. Virtually all the strategies being adopted in Detroit have already been applied in Cleveland, including by the same entrepreneur, Quicken Loans Chairman Dan Gilbert, with very little tangible economic benefit.

    Yet despite this history, Detroit — the poster child of public malfeasance — once again is pinning its hopes on luring the “creative class” to Motor City. It starts with the usual stab at subsidizing housing, office and retail around the central core. This is being jump-started by taking Quicken Loans jobs already in the area’s suburbs, meaning little net regional advantage.

    Even more absurd, Michigan taxpayers are being asked to pony up to as much as $440 million for a new stadium in Detroit for the Red Wings hockey team. In contrast to this beneficence, many remaining established, older smaller neighborhood businesses — many of them deeply entrenched in the Rust Belt economy — get stuck with ever higher tax bills and reduced levels of public service.

    To be sure, this approach can succeed in building hipster cordon sanitaire — a miniaturized but utterly derivative urban district — that can be shown to investors and visiting, and usually core-centric, journalists. It also can enrich speculators and those politicians who service them, but represents a marginally effective means of reviving the city, much less the regional, economy.

    Instead of chasing hipsters , Cleveland urban strategist Richey Piiparinen suggests cities such as his rebuild their economies from the ground up, tapping the strong industrial skills, work ethic and resilient culture deeply embedded in the region. Large factories may not return en masse to Cleveland, Detroit or Chicago, but a strong industrial economy and a culture embracing hard work could stir growth in service-related fields as well.

    Geography and location provide other opportunities . The area’s natural resources — the Great Lakes contain one-fifth of the world’s supply of fresh water — constitute a profound competitive advantage against drought stricken economies in the Inland West, the southern Great Plains and parts of the Southeast. Water is an essential element in many industrial processes, including fracking, a serious issue in parts of the Rust Belt. Miles of attractive coastline could be used to lure not only factories, but high-tech businesses, tourists and educated professionals who can choose their location.

    The Great Lakes also are a natural conduit for the $250 billion trade with Canada, with its vast resource-based economy and growing population . Instead of funding better bars, art galleries and sports venues, or hoping to attract tourists and conventioneers to traipse to Cleveland in December, what the region really needs, noted a recent Brookings report, is better infrastructure, such as bridges, ports, freight rail and roads.

    Critical too are the region’s strong engineering schools. Of the nation’s top 10, four — Carnegie Mellon, Purdue, the University of Michigan, and the University of Illinois at Champagne-Urbana — are located in the Rust Belt. The Great Lakes may not be home to the Ivy League, but it remains the nursery of practical applied intelligence.

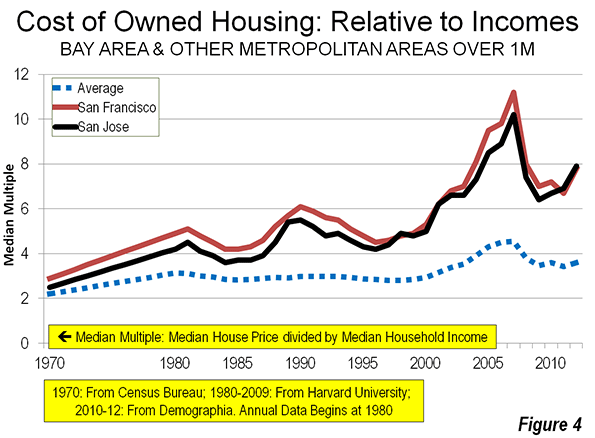
    Emerging demographic trends could also play a positive role. The millennial generation will soon be approaching the age when they wish to start businesses, get married, have children and buy homes. A good target would be those seeking a single-family home and a reasonable cost of living; both are increasingly difficult to attain in much of the Northeast and coastal California where the cost of housing, even adjusted to income, can be easily two to three times higher.

    Indeed, despite decades of demographic stagnation, the region already boasts higher percentages of people under 15 than the Northwest, the Northeast (including New York) and has about the same percentage of kids as the rapidly growing Southeast. For a new generation, the Great Lakes could emerge as a destination, not a place to avoid.

    This requires the region becoming more attractive to newcomers, whether from abroad or within the country. As urban analyst Aaron Renn suggests, the Great Lakes has to become more culturally open to outsiders and immigrants. Cities such as Cleveland, Chicago, and Detroit were once magnets for immigrants from Europe and people coming from America’s rural hinterlands, notably the south.

    Restoring appeal to outsiders does not mean denying the region’s proud past, and throwing away its historic assets, but instead focusing on its core values. For many reasons — geography, weather, history — the region cannot remake itself into California, the Pacific Northwest or the Northeast Corridor. Instead the Great Lakes can best restore its legacy as an aspirational region by focusing on the very real things that constitute its historic DNA.

    Joel Kotkin is executive editor of NewGeography.com and Distinguished Presidential Fellow in Urban Futures at Chapman University, and a member of the editorial board of the Orange County Register. He is author of The City: A Global History and The Next Hundred Million: America in 2050. His most recent study, The Rise of Postfamilialism, has been widely discussed and distributed internationally. He lives in Los Angeles, CA.

    This piece originally appeared at Forbes.

    Great Lakes map by BigStock.

  • Cities Don’t Consume Resources, People Do

    Urban form or urban consumers? If we want to reduce the environmental impacts of modern society let’s prioritize consumption, not city form.  The evidence suggests that large cities (and especially city centres) are associated with a bigger environmental footprint than modest cities or suburbs. 

    This post looks at incomes and consumption, especially the consumption of housing and transport services, asking how far can local regulation really influence environmental impacts?

    What can local governments do about the environment?
    Local governments have two core roles.  One is to ensure that the infrastructure and services necessary to sustain everyday life and commerce are in place and working well.  In fulfilling this role they should aim to enhance the quality of the urban environment and limit any environmental impacts of infrastructure. 

    The other role is to plan and manage development in a way that reduces conflict among land uses. In doing that they should aim to contain or control adverse spill-over impacts. 

    However, for councils to use their investment in infrastructure and land use regulation to determine in detail how and where people should live and consume pushes the boundaries of these roles, particularly when they try indirectly to reshape household behavior by reshaping the city.

    The key to understanding the environmental impacts of urbanized society is not urban form but household consumption, a function of income, not city plans.

    Urbanization and environmental impacts
    In a recent piece I showed how policies to increase residential densities around city and town centres assume a relationship between urban form and environmental impacts that is not supported by the evidence. In Australia, for example, residents of the New South Wales state capital, Sydney, particularly central Sydney, have by far the largest environmental impact per head.  Much lower levels are recorded in suburbs, smaller cities, and towns. (The same pattern is evident in all Australian states: have a look using the Australian Consumption Atlas).

    The environmental impacts of intensive urban living outweigh any advantages of increasing scale and density. This means that policies that push agglomeration and intensification will increase rather than lower the impacts of urban living.

    Household spending is the issue
    The Australian study confirms that a city’s environmental impacts simply comprise the collective impacts of its residents.  Income is the driver of their consumption and thereby their demands on the environment. 

    If we really believe city form can in some way over-ride income- and consumption-driven environmental impacts, then we should heed the evidence and plan for modest, small scale, dispersed urban settlement. 

    Spending on housing and transport in New Zealand
    Household Expenditure Survey data for New Zealand (and elsewhere) provide an opportunity to explore the role of income in consumption generally. 

    First, take a look at the distribution of spending on housing, transport, and discretionary goods (recreation and cultural services is used to represent the latter category) according to household incomes in 2010. Average spending levels have been organized by income decile for this purpose, each group containing 10% of households. Average incomes increase from decile 1 (the lowest earning 10% of households) to decile 10 (the highest earning 10%).

    The pattern is pretty predictable.  Housing dominates the spending of low decile households.  It accounts for 34% in the lowest decile, falling to 22% in the ninth.  It rises again (to 24%) in the highest earning decile (10). This lift between decile 9 and 10 households no doubt reflects higher discretionary spending in the latter group by way of additional space, the quality of fit-outs, and second homes. 

    Shares of Household Spending to Selected Categories, by Income Band
    http://3.bp.blogspot.com/-9RfoZrWOqJk/UdklonCl_xI/AAAAAAAAAY0/AX1r49MtdJE/s640/Share+of+hhold+spend+by+category.jpg

    Do lower housing costs lead to higher transport spending?
    Rent theory suggests that lower household spending is offset by higher transport spending.  This is because low income households can only afford cheaper, less accessible properties and so end up commuting further at a higher cost than high income households. 

    It turns out that it’s not that simple.  Contrary to the theory, higher income households actually spend more of their income on transport.  That makes sense when we realize that commuting accounts for only around 25% of time spent travelling by New Zealanders.  The capacity to take discretionary trips is a bigger determinant of transport consumption than non-discretionary commuting and work-based trips.

    The Relationship Between Spending on Housing and Transport

    http://4.bp.blogspot.com/-8sGLN4_gTfo/UdyUskoSpgI/AAAAAAAAAZk/WEqMSQNRZM4/s640/Transport+Housing+Relationship.jpg


    Lower incomes leave a lot less to spend on discretionary goods and services once housing and essential transport spending are covered. [1] Higher income households can and do travel more and consume more.  Their behavior is unlikely to be significantly influenced by changing city form. 

    Who spends how much?
    Not surprisingly total consumption in New Zealand is dominated by higher income households: the 20% highest earning households (deciles 9 and 10) account for 35% of total spending on goods and services, while the lowest earning 20% (deciles 1 and 2) account for just 20%.

    And decile 10 households account for 7 times more spending on transport than decile 1 households.  They spend 5.5 times more on recreation and cultural services, and 3.5 times as much on food.


    The Contribution of Household Total Expenditure by Income Band, Selected Categories
    http://2.bp.blogspot.com/-OXL5hMRRw-Q/UdklqCO8CjI/AAAAAAAAAZA/o2GweAb3nTc/s640/Contributinm+to+totalmspoend+by+decile.jpg

     
    The highest income households spend three times more on housing than low income households, an average of $476 per week compared with $161.
    If refurbished housing in high amenity inner city living is expensive, guess which income groups will be living there?  The high consumers, obviously.  And in Auckland, at least, it seems that city planners and policy-makers are keen to deliver them the high order consumer services that will promote ever-more discretionary spending around the CBD(although much of central city resident travel may be taken up with recreational and social trip-making away from there).  

    A high social cost for little environmental benefit?
    The conclusion is straightforward: higher incomes mean more expenditure on additional housing, transport, and discretionary goods and services with correspondingly high environmental impacts.  If incomes are higher in cities, then their collective impacts will be high too.

    Planning policies won’t change that much – except to the extent that they erode consumption by inflating the basic costs of living, something that impacts most heavily on lower income households.  

    Fiddling with city form is unlikely to significantly reduce the impact of higher incomes and associated spending on the environment.  Increasing dwelling and living costs by promoting larger cities, higher residential densities, and uneconomic transit systems simply penalizes low income households already committing substantial shares of their spending to housing and transport.  And this is the group that, by dint of constrained consumption, has the lowest impact on the environment. 

    Better to address environment issues directly
    From a policy perspective, environmental issues are better tackled directly.  This may mean promoting environmentally friendly goods and services, promoting low impact technologies (including low impact housing, fuel efficient vehicles, and the like), and encouraging responsible consumption. If we are really serious about environmental threats, we need to examine the efficiency of current pricing practices and even taxation measures, rather than leaning so heavily on clumsy, indirect, and ultimately spurious urban planning policies. 

    Phil McDermott is a Director of CityScope Consultants in Auckland, New Zealand, and Adjunct Professor of Regional and Urban Development at Auckland University of Technology.  He works in urban, economic and transport development throughout New Zealand and in Australia, Asia, and the Pacific. He was formerly Head of the School of Resource and Environmental Planning at Massey University and General Manager of the Centre for Asia Pacific Aviation in Sydney. This piece originally appeared at is blog: Cities Matter.

    Photo by Pat Scullion

  • Plan Bay Area: Telling People What to Do

    The San Francisco area’s recently adopted Plan Bay Area may set a new standard for urban planning excess. Plan Bay Area, which covers nearly all of the San Francisco, San Jose, Santa Rosa, Vallejo and Napa metropolitan areas, was recently adopted by the Metropolitan Transportation Commission (MTC) and the Association of Bay Area Governments (ABAG). This article summarizes the difficulties with Plan Bay Area, which are described more fully in my policy report prepared for the Pacific Research Institute (Evaluation of Plan Bay Area).

    Plan Bay Area would produce only modest greenhouse gas emissions reductions, while imposing substantial economic costs and intruding in an unprecedented manner into the lives of residents. The Plan would require more than three quarters of new residences and one third of net additional employment to be located in confined "priority development areas." These measures have been referred to as “pack and stack” by critics. The net effect would be to virtually ban development on the urban fringe, where the organic expansion of cities has occurred since the beginning of time.

    Irrational Planning

    Violating perhaps the most fundamental requirement of a rational plan, Plan Bay Area begins with a situation that no longer exists. Further, it is based on exaggeration, systematic disregard of official federal government projections and overly optimistic planning assumptions.

    Exaggerated Population Projection: The Plan assumes that the Bay Area will grow 55 percent more rapidly between 2010 and 2040 than official California state Department of Finance population projections indicate. These state-produced estimates have tended themselves to be on the high side (Figure 1). The planners scurried about to resolve these differences, but there is no indication that the state will be revising its projections. Plan Bay Area’s population projection would require growth in the Bay Area to increase by more than one-half from the 2000-2010 annual rate. The exaggeration of population growth has its uses: it leads to a higher greenhouse gas emissions projection for 2040, providing a rationale for stronger policy interventions.

    Ignoring Current Greenhouse Gas Emissions Projections: The Plan also ignores the new, more favorable DOE fuel economy projections (Figure 2). These projections were issued in December, well before the publication of the draft plan in April and the adoption of the final plan in July. Indeed, if the new DOE projections had been published the day before, Plan Bay Area should have been placed on hold and revised. In short, Plan Bay Area was out of date when adopted.

    Overly Optimistic Planning Assumptions: The Plan assumes that travel by light vehicle (automobiles, sport utility vehicles and pickups) would be reduced by substantial increases in transit ridership. Plan Bay Area presumes that expanding transit service 27 percent over the next 30 years will lead to a near doubling of transit ridership. This is stupefying, since over the last 30 years, transit ridership remained virtually the same, while service was expanded nearly twice as much as would be planned from 2010 to 2040.

    The plan also assumes that residents forced into the priority development areas will use transit and walking much more, materially reducing their use of light vehicles. This research behind this assumption is skewed toward transit oriented developments located on rail lines with good access to downtown. But nearly nine out of 10 employees in the Bay Area work outside the downtowns of San Francisco and Oakland, and that number is increasing (according to Plan Bay Area).

    Given recent history, it seems wishful thinking to believe that small transit service expansions and downtown oriented transit development can do much to attract drivers from cars. The modest gains greenhouse gas emissions reductions projected in Plan Bay Area are likely exaggerations.

    Plan Bay Area’s “pack and stack” densification is likely to produce even less than the modest substitution of transit and walking for driving (see The Transit-Density Disconnect). Traffic congestion, in this already highly congested area, is likely to be worsened, which could nullify part or all of the greenhouse gas emission reductions expected from reduced vehicle use.

    Correcting Plan Bay Area Forecasts

    Plan Bay Area would only modestly reduce light vehicle travel and greenhouse gas emissions. This is illustrated in Figure 3, which shows that the “pack and stack” strategies that would force most new residents and jobs into priority development areas, Plan Bay Area would reduce greenhouse gas emissions by 2 percent (“Plan Bay Area” line compared to the “Trend” or “doing nothing” line).

    By contrast, correcting the Plan Bay Area 2040 population estimates to reflect the state population projections would reduce greenhouse gas emissions more than eight times as much (17 percent), without the “pack and stack” strategies. A further correction of the Plan Bay Area 2040 estimates to reflect the latest DOE fuel economy projections, would reduce greenhouse gas emissions 22 percent, 11 times as much as the “pack and stack” strategies.

    Heavy Costs for Households and Businesses

    The Plan’s “pack and stack” strategies seem likely to exacerbate the Bay Area’s already high cost of living. Currently, the San Francisco and San Jose metropolitan areas have the worst housing affordability among the nation’s 52 metropolitan areas with more than 1 million residents. San Jose’s median house price relative to its median household income was 7.9 last year, according to the Demographia International Housing Affordability Survey. San Francisco’s median multiple was 7.8. This severely unaffordable housing results from recent decades of urban containment or smart growth policies, which have severely restricted the land on which development can occur. This drives up prices (other things being equal), consistent with economic principle. This has been made worse by house and apartment impact fees imposed on developers that are far above the national average.

    By comparison, in major metropolitan areas that have not implemented strong urban containment policies, the median multiple has typically been 3.0 or less since World War II, including the Bay Area before its adoption (Figure 4). The “pack and stack” strategies would largely limit new development to small parts of the Bay Area, an even more draconian prohibition than the long standing restrictions on urban fringe development. This further rationing of land could be expected to drive land prices even higher, making it even more difficult for households and businesses to live within their means.

    The problem is already acute. The new US Census Bureau housing cost adjusted data shows California to have the highest poverty rate among the states and the District of Columbia (metropolitan area data is not available). An early 2000s Public Policy Institute of California report showed Bay Area poverty to be nearly double the official rate, adjusted for the cost of living. Ultra pricey San Francisco had among the ten highest poverty rates – over twenty percent – of any urban county in the country.

    Unaffordable housing has also fueled an exodus to the San Joaquin Valley (Central Valley). Now more than 15 percent of the workers in the Stockton metropolitan area commute to the Bay Area, which led the Federal Office of Management and Budget adding Stockton to the San Jose-San Francisco combined metropolitan area (combined statistical area). In addition, the greater traffic congestion is likely to lengthen work trip travel times. This is likely to further increase emission while also burdening job creation and economic growth (see Traffic Congestion, Time and Money).

    Ignoring the Economy and Poverty

    Plan Bay Area effectively ignores these costs (despite rhetoric to the contrary), by failing to subject its strategies to a cost per ton metric. According to the United Nation’s Intergovernment Panel on Climate Change (IPCC), sufficient greenhouse gas emissions reductions can be achieved at a cost between a range of $20 to $50 per ton. The previous regional plan (through 2035) included such estimates. Only highway strategies achieved the IPCC range. Transit and land use strategies cost from four to more than 100 times the top of the IPCC range. Even those estimates did not include the prohibitively higher housing costs that result from urban containment policies. The cost metric is crucial, because spending more than necessary to reduce greenhouse gas emissions limits job creation and economic growth, which leads to reduced household affluence and greater poverty. This is the very opposite of the economic objectives of public policy. Virtually all political jurisdictions around the world seek greater prosperity for their residents and less poverty. A legitimate regional plan requires subjecting its strategies to economic metrics.

    Opposition

    There is opposition to Plan Bay Area. A citizen movement worked for rejection and has now filed suit claiming that the Plan violates the California Environmental Quality Act. The suit also alleges that MTC and ABAG used a questionable interpretation of state law and regulation to justify the irrational Plan outcomes.

    Recorded Votes

    Opponents were also successful in obtaining a rare recorded vote at ABAG. The governing board (General Assembly) is composed of selected elected officials from cities and counties who are not elected to their ABAG positions. ABAG adopts virtually all of its actions by consensus, rather by recorded votes, as occurs in many of the nation’s regional planning boards.

    Consensus decision making seem especially odd in California, where inability to obtain sufficient votes in the legislature for the state budget required a constitutional amendment. Neither do city councils and county commissions operate on a consensus basis on controversial issues.

    There is no shortage of controversial issues, at ABAG or other regional planning agencies. A good first reform would be for recorded votes to be the rule, rather than the exception. Consensus decision making may be appropriate for clubs, but it is not for representative bodies in a democracy.

    Impeding the Quality of Life

    Plan Bay Area was outdated when approved and reflects a world that no longer exists. Drafters have insisted on extravagantly expensive and intrusive policies that produce only minimal greenhouse gas reductions, and at great cost, using, among other things, unreasonably bloated population forecasts to bolster their approach. Unless changed, the Plan will likely be more successful in driving up housing prices, limiting options for households, and further congesting traffic than meeting its stated goal of reducing   greenhouse gas emissions.

    Wendell Cox is a Visiting Professor, Conservatoire National des Arts et Metiers, Paris and the author of “War on the Dream: How Anti-Sprawl Policy Threatens the Quality of Life.

    Photo: San Francisco (by author)

  • Root Causes of Detroit’s Decline Should Not Go Ignored

    Recently Detroit, under orders from a state-appointed emergency manager, became the largest U.S. city to go bankrupt. This stirred predictable media speculation about why the city, which at 1.8 million was once America’s 5th-largest, declined in the first place. Much of the coverage simply listed Detroit’s longtime problems rather than explaining their causes. For example a Huffington Post article asserted that it was because of “racial strife,” the loss of “good-paying [sic] assembly line jobs,” and a population who fled “to pursue new dreams in the suburbs.” Paul Krugman, who has increasingly become America’s dean of misguided thinking, downplayed the city’s pension obligations, instead blaming “job sprawl” and “market forces.” The implication is that Detroit’s problem just arose organically from structural economic changes, and within decades somehow produced a city of abandoned homes and unlit streets.

    But a closer look suggests that Detroit’s problems, which include 16% unemployment, 36% poverty, and 60% population decline, were self-inflicted by a half-century of government excess. Thomas Sowell nicknamed this excessiveness the “Detroit Pattern”, and defined it as the city’s habit for “increasing taxes, harassing businesses, and pandering to unions.” These three problems have proven as instrumental to decline as the “Big Three” automakers once were to Detroit’s rise. Analyzing their background, and potential for reform, could expedite the city’s turnaround.

    The foremost measure would be addressing taxes. Currently Detroit has one of America’s largest tax burdens for major cities, offering notoriously bad services in return (police response times average 58 minutes, and 40% of streetlights do not work). Its property tax rates are the nation’s highest, exceeding 4% for some buildings. This has caused particular disinvestment in the city’s large stock of abandoned homes, some of which sell for below $1000, but are avoided since they get assessed at far above their actual worth, leaving owners with inflated tabs.

    Detroit could also help its cause with a business climate that better encouraged entrepreneurship. For decades it has done the opposite, championing a growth policy that mirrored the city’s overly-centralized private sector. It has gambled—with tax breaks, subsidies, and extensive eminent domain—on stadiums, casinos, office towers, factories, and a downtown monorail, only to find that these didn’t produce nearly the anticipated benefits. Meanwhile it has squelched small businesses, which are generally better at creating jobs, with a cobweb of protectionist regulations—on food trucks, taxis, movie theaters, and so on. This was summarized in economist Dean Stansel’s recent “economic freedom” study, which ranked the regulatory and tax climates of U.S. metro areas. In a field of 384, Detroit placed 345th.

    These regulations have emanated from Detroit’s vast, union-controlled public bureaucracy. Recent debate about this bureaucracy has focused on retirement benefits, which apologists note are far less generous than in other big cities. But this does not detract from the sheer number of retirees, which at 20,000 are nearly twice Detroit’s existing public workforce, and account for obligations of potentially half the city’s $18 billion debt.

    Less discussed is the way unions protect existing workers also, by stifling needed service reforms. When a philanthropist offered $200 million in 1999 to open the city’s first charter school, which would require changes to state law, the Detroit Federation of Teachers organized a work stoppage to protest in Lansing, ultimately causing withdraw of the donation. Various other city unions (which total 47) have resisted reduction or privatization of water utilities, trash-pickup, street lighting, and transportation. This is despite the city having proven wildly incompetent at providing these services itself, a point made recently in the Wall Street Journal by a former transportation chief. He claimed that unionization of the 1,400-employee DDOT had ensured worker protections for rampant absenteeism and poor performance, thus creating a climate in which 20% of scheduled buses did not arrive. Similar protections from firings and layoffs existed in other city departments, he wrote, perhaps explaining why Detroit, at over 10,000 workers, remains one of the most overstaffed big cities in America, while managing to do so little with them.

    Of course many would argue that Detroit’s post-World War II racial conflicts were the real reasons for decline. More plausible is that these conflicts were inflamed by that era’s top-down government policies, which became all the worse when enforced by seemingly prejudiced officials. Throughout the 1950s and 1960s white mayors steamrolled roadways through functioning black neighborhoods like Black Bottom, and housed the displaced in dangerous, high-rise government projects. Funding for this and other “urban renewal” came from federal programs like President Johnson’s Model Cities, and using Detroit as a flagship, was meant to modernize aging urban communities. But the programs instead fragmented them, including a Detroit black population that, according to Sowell, then had 3.4% unemployment and “the highest rate of home-ownership of any black urban population in the country.” For them this “renewal” created a housing shortage, and along with discrimination and police brutality, inspired riots in 1967.

    These riots killed dozens, injured nearly 1,200, and along with the ones inspired by Martin Luther King’s assassination, immediately spurred a mass white exodus. This cemented the demographic changes needed for both the 1973 election of Detroit’s first black mayor, Coleman Young, and subsequent policies that instead targeted the city’s whites. A paper by economist Edward Glaeser argues that this was done intentionally by Young as a way to further drive political rivals to the suburbs, and increase the share of his poor black voting base. He did this, writes Glaeser, by cutting off services in white neighborhoods, imposing onerous taxes, and displacing thousands of Polish households for a GM factory in the Poletown neighborhood. This led to further white exodus and diminishment of the tax base.

    All these are examples of rampant abuses, under both black and white leadership, that have resulted because of Detroit’s notorious governing “pattern.” But one silver lining of its bankruptcy is the opportunity for structural change. This could occur by channeling the urban reforms—from charter schools, to defined-contribution pensions, to looser permitting, to plain-old lower taxes—that have helped other U.S. cities the last two decades. If these reforms can thrive in the Motor City than they probably can anywhere, turning it at the very least back into a functioning city, and at best into a reemerging economic star.

    Scott Beyer is traveling the nation to write a book about revitalizing U.S. cities. His blog, Big City Sparkplug, features the latest in urban news. Originally from Charlottesville, VA, he is now living in different cities month-to-month to write new chapters.

    Photo by Kate Sumbler.

  • 125 Years of Skyscrapers

    Skyscrapers have always intrigued me. Perhaps it began with selling almanacs to subscribers on my Oregon Journalpaper route in Corvallis. I have continued to purchase almanacs each year and until recently, the first thing I would do is look in the index for "Buildings, tall” in the old Pulitzer The World Almanac, the best source until the Internet.

    My 1940 edition is the first in which “Buildings, tall” appears. The world of skyscrapers has changed radically through the years. This article provides a historical perspective on the world’s tallest buildings, using information from almanacs and the Internet (See Table Below). Extensive hyperlinking is also used, principally to articles on particular buildings.

    The Rise of Commercial and Residential Buildings

    Throughout most of history, the tallest habitable buildings have been religious edifices, or mausoleums, such as the great pyramids of Egypt. But in the middle to late 19th century, taller commercial and residential buildings were erected in the United States. For four years, from 1890 to 1894, the New York World Building, itself was the tallest in the world, at 309 feet (95 meters) and 20 floors. But it was not until the turn of the 20th century that a commercial or residential building exceeded the tallest religious building, Ulm Cathedral in Germany. This was Philadelphia’s City Hall. In its wisdom, however, Philadelphia outlawed any building higher than William Penn’s head at the top of City Hall. It was not until the late 1980s that a taller building appeared in Philadelphia (One Liberty Place).

    Tallest Buildings in 1940

    Despite Chicago’s claim as birthplace of the skyscraper, by 1940, nine of the 10 tallest buildings in the world were in New York. Manhattan was so dominant that the World Almanac listed the city at the top of the list, out of alphabetical order. The five tallest buildings, the Empire State Building, the Chrysler Building, 60 Wall Tower (now 70 Pine), 40 Wall Tower (now the Trump Building) and the RCA Building (now the GE Building) all  opened in the 1930s and represent Art Deco at its zenith. The sixth tallest, the Woolworth Building, had been the world’s tallest from 1913 to 1930 and is neo-Gothic.

    Cleveland’s Terminal Tower was 7th tallest, and the tallest building in the world outside New York. Cleveland’s Union Terminal was in the building and served the legendary New York Central Railroad’spremier New York to Chicago 20th Century Limited.

    Tallest Buildings in 1962

    Things changed little by 1962. The five Art Deco skyscrapers that where the tallest in 1940 remained so in 1962. There were two newcomers to the top 10 list, both modernist monoliths, the Chase Manhattan Bank Building in lower Manhattan and the Pan Am Building (later the Met-Life Building). The Pan Am Building is despised by many New Yorkers as Parisians despise the Tour Montparnasse. This led to banning similar behemoths in the ville de Paris (most of the skyscrapers in the Paris urban area are in La Defense, a nearby suburban “edge city”). But all of the 10 tallest buildings in the world were in the United States.

    Tallest Buildings in 1981

    Just two decades later, New York’s dominance eroded. By now, The World Almanac listed New York in alphabetical order, between New Orleans and Oakland. For the first time since before 1908 when the Singer Building opened, New York was not the home of the world’s tallest building. That title had gone to Chicago’s, Sears Tower (later Willis Tower), which opened in 1974. Chicago gained even more respect with two other buildings appearing in the top 10, the Standard Oil Building (nowAon Center) and the John Hancock Center, which was the tallest mixed use (residential and commercial) building in the world. The twin towers of the former New York World Trade Center were tied for second tallest in the world.

    For the first time, a non-American skyscraper was in the top 10. Toronto’s First Canadian Place was the eighth tallest in the world. Only three of the former five New York Art Deco buildings remained in the top 10, with 40 Wall Tower and the RCA Building no longer on the list.

    Tallest Building in 2000

    By 2000,   Kuala Lumpur, which is not among the largest cities in the world, emerged with both of the tallest buildings, in the Petronas Towers. The Petronas Towers ended America’s long history of having the tallest building. These distinctive postmodern towers were just two of six Asian entries in the top 10, including another postmodern structure, the Jin Mao Tower in Shanghai’s Pudong, which is probably the world’s largest edge city.

    I recall my surprise at exiting the Guangzhou East Railway station in 1999 to see the CITIC Tower, the 7th tallest building in the world. There could have been no better indication of that nation’s modernization. The Pearl River Delta had two other of the tallest buildings, one in Shenzhen (Shun Hing Square), the special economic zone that became the economic model for the rest of China, and the second in Hong Kong (Central Plaza).

    Tallest Building in 2013

    By 2013, the world of skyscrapers had nearly completely overturned. Dubai, with a population little more than Minneapolis-St. Paul, is now home to the world’s tallest building, the Burj Khalifa. The Burj Khalifa is not just another building. Never in history has a new tallest building exceeded the height of the previous tallest building by so much. Even the long dominant Empire State Building had exceeded the Chrysler building by only 200 feet (64 meters). The Burj Khalifa was nearly 1050 feet higher (320 meters) than the then tallest building, Taipei 101, and reaches to more than 1/2 mile (0.8 kilometers) into the sky. The world’s second tallest building (the Mecca Royal Hotel Clock Tower) is also on the Arabian Peninsula.

    The Shanghai World Financial Center is now the fourth tallest in the world, and when it opened had the highest habitable floor and the highest observation deck in the world. Its unusual design has earned it the nickname "bottle opener" among residents (Photo 1). Hong Kong has a new entry in the list, the International Commerce Center, across the harbor in Kowloon. Nanjing’s Greenland Financial Complex (Photo 2) ranks 8th, and Shenzhen’s Kinkey 100 ranks 10th.


    Nine of the 10 tallest buildings in the world are now in Asia. The last American entry is the Sears Tower (Willis Tower), in Chicago, which ranks 9th. Skyscraperpage.com maintains a graphic of the world’s tallest buildings (Note 1).

    Under Construction: A number of super-tall buildings (Note 2) will soon open. Earlier this month, the Shanghai Tower was “topped out.” This structure is across the street from the Jin Mao Tower and the Shanghai World Financial Center, forming by far the greatest concentration of super-tall skyscrapers in the world (Photo 1). The Ping An Finance Center in Shenzhen and the Wuhan Greenland Center in Wuhan are also under construction, and will rank, at least temporarily, second and third tallest in the world when completed. The Goldin Finance Building in Tianjin and the Lotte World Tower in Seoul will be somewhat shorter. One World Trade Center in New York will be completed before most of these, which will allow it brief entry into the top ten.

    Another entry, Sky City in Changsha (Hunan) could be on the list, slightly taller than the Burj Khalifa. This building is to be constructed in 210 days, following site preparation and work began last month. It was, however, halted by municipal officials and there are conflicting reports as to the building’s status.

    Skyscraperpage.com also maintains a graphic of the world’s tallest under-construction buildings.

    Tallest Buildings in 2020?

    None of the tallest buildings in the world are predicted to be in the United States by 2020, according to a graphic of current plans posted on the Council on Tall Buildings and Urban Habitat website. The Burj Khalifa is expected to be replaced as tallest by another Arabian Peninsula entry, the Kingdom Tower in Jeddah, which will be 0.6 miles high (3.3 kilometers). The torch has been passed to Asia.

    WORLD’S TALLEST COMPLETED BUILDINGS: 1940-2013
    1940 Building City Feet Meters Stories
    1 Empire State New York 1,250 381 102
    2 Chrysler New York 1,046 319 77
    3 60 Wall Tower (70 Pine Street) New York 950 290 66
    4 40 Wall Tower (Trump) New York 927 283 90
    5 RCA New York 850 259 70
    6 Woolworth New York 792 241 60
    7 Terminal Tower Cleveland 708 216 52
    8 Metropolitan Life New York 700 213 50
    9 500 5th Avenue New York 697 212 60
    10 20 Exchange Place New York 685 209 54
    1962 Building City Feet Meters Stories
    1 Empire State New York 1,250 381 102
    2 Chrysler New York 1,046 319 77
    3 60 Wall Tower (70 Pine Street) New York 950 290 66
    4 40 Wall Tower (Trump) New York 927 283 71
    5 RCA New York 850 259 70
    6 Pan Am (Met-Life) New York 830 253 59
    7 Chase Manhattan New York 813 248 60
    8 Woolworth New York 792 241 60
    9 20 Exchange Place New York 741 226 57
    10 Terminal Tower Cleveland 708 216 52
    1981 Building City Feet Meters Stories
    1 Sears Tower (Willis Tower) Chicago 1,454 443 110
    2 World Trade Center-North Tower New York 1,350 411 110
    2 World Trade Center-South Tower New York 1,350 411 110
    4 Empire State New York 1,250 381 102
    5 Standard Oil (Amoco) Chicago 1,136 346 80
    6 John Hancock Center Chicago 1,127 344 100
    7 Chrysler New York 1,046 319 77
    8 Texas Commerce Tower Houston 1,002 305 75
    9 First Canadian Place Toronto 952 290 72
    10 60 Wall Tower (70 Pine Street) New York 950 290 66
    2000 Building City Feet Meters Stories
    1 Petronas Tower 1 Kuala Lumpur 1,483 452 88
    1 Petronas Tower 2 Kuala Lumpur 1,483 452 88
    3 Sears Tower (Willis Tower) Chicago 1,454 443 110
    4 Jin Mao Tower Shanghai 1,381 421 88
    5 World Trade Center-North Tower New York 1,350 411 110
    5 World Trade Center-South Tower New York 1,350 411 110
    7 Citic Plaza Guangzhou 1,283 391 80
    8 Shun Hing Center Shenzhen 1,260 384 69
    9 Empire State New York 1,250 381 102
    10 Central Plaza Hong Kong 1,227 374 78
    2013 Building City Feet Meters Stories
    1 Burj Khalifa Dubai 2,717 828 163
    1 Mecca Royal Hotel Clock Tower Mecca 1,971 601 120
    3 Taipei Taipei 101 1,670 508 101
    4 Shanghai World Financial Center Shanghai 1,614 592 101
    5 International Commerce Center Hong Kong 1,588 484 118
    6 Petronas Tower 1 Kuala Lumpur 1,483 452 88
    6 Petronas Tower 2 Kuala Lumpur 1,483 452 88
    8 Greenland Financial Complex Nanjing 1,476 450 89
    9 Sears Tower (Willis Tower) Chicago 1,454 443 110
    10 Kinkey 100 Shenzhen 1,450 442 100
      Outside United States
      United States, Outside New York
      New York


    Wendell Cox is a Visiting Professor, Conservatoire National des Arts et Metiers, Paris and the author of “War on the Dream: How Anti-Sprawl Policy Threatens the Quality of Life.

    ———————

    Note 1: There are a number of sources for information on tall buildings, such as the Council on Tall Buildings and Urban Habitat, Skyscraperpage.com, Emporis.comand Wikipedia.com. Of course, my favorite will always be The World Almanac, even if the Internet provides faster access. Wikipedia also has fascinating articles on individual buildings (Wikipedia’sutility is limited to recreational research for identifying original sources, and should never be used in serious research, or God forbid, used in a footnote).

    Note 2: The Council on Tall Buildings and Urban Habitats defines a super-tall building as being over 980 feet (300 meters) high.

    ——————————

    Photo 1: Jin Mao Tower (left) and Shanghai World Financial Center (right), Shanghai. Construction began later on the recently topped out Shanghai Tower to the right of the Shanghai World Financial Center.

    Photo 2: Greenland Financial Center, Nanjing

    —————————-

    Photograph: The New York World Building (1890-1955).

  • Children and Cities

    Central cities are not likely to regain their former population. However, some of them may have reached an important inflection point—population growth has returned to at least some of the largest (and longest-declining) cities. For example, New York City’s population has increased by more than one million since 1990, after declining by about one million between 1950 and 1980. Over the past decade, nine of the ten largest (and 17 of the 20 largest) cities in the United States have gained population.

    Many observers attribute the population turnaround to changes in the residential attractiveness of the city, although cause and effect are blurry since new residents themselves have instigated many changes to the urban landscape.   Prominent urban researchers have described particular features of urban areas that have attracted households back to the core. These features include new housing in city centers, amenities such as specialized restaurants and night life, restoration of architectural gems, and myriad cultural activities. Such features are enticing increasing numbers of (mostly young) college-educated singles to call city centers home.

    If one goes back in time, studies on urban household location tended to focus on the tradeoff in the cost of commuting from suburban areas and the lower price of land and housing in suburban communities.  Research indicated that about half of the suburbanization in the post-World War II period was driven by higher income that increased the demand for suburban housing relative to city housing.  It is still the case that suburbanization is partly driven by the demand for larger, detached houses that are more prevalent in suburban communities.   

    To be sure, amenities alone do not explain recent trends. Other studies have documented the ability of urban cores to foster jobs and businesses characterized by intense information exchange and creativity, thereby attracting college-educated workers to live in nearby neighborhoods. In a recent study, we show that central cities are an increasingly important work site for the most highly educated workers in all of the metropolitan areas that we examined, even bankrupt Detroit.¹

    Income, education, and human capital are all important elements in city revival. In a recent study, Alan Ehrenhalt calls the return to city living the “great inversion” that reverses trends present in cities since the mid-twentieth century. He hypothesizes that some American metropolitan areas are beginning to resemble nineteenth century European cities, where the more affluent lived in city centers and households of more modest means lived in the suburbs. Some of the reasons that he offers for the heightened attractiveness of many central cities as a place to live are the decline of manufacturing in cities (making them more livable); lower crime rates; growth in the single, never-married population; lower fertility rates; and a bulging cohort of relatively affluent and educated seniors.

    Although many cities still have a disproportionately number of the poor, poverty has become more suburban over the past decade.  For example, the number of poor in suburbs of Chicago about doubled over the past decade.  Thus, although the poverty rate in cities such as Chicago remains much higher, it has declined relative to suburban areas.

    Conspicuously absent from recent discussion is the role and attractiveness of central cities for families with children. In the past, research and observation both indicated that suburbs provided families with cheaper land and housing, as well as safer neighborhoods and higher quality schools.

    In many MSAs, the central city’s share of college-educated adults approaches or exceeds the city’s share of all persons aged 25 and older, with the exception of some older industrial cities, such as Detroit, Milwaukee and Philadelphia (see table). But for educated adults with children, only Seattle and Charlotte buck the trend, or come close to it.                                  


    Percent of MSA residents aged 25 years and older living in central cities, 2009


    All Persons Age 25+


    All College- Educated


    Parents with School-Age Kids

    College-Educated Parents with School-Age Kids

    Baltimore

               17

               14

              17

                6

    Boston

               19

               20

              13

                8

    Charlotte

               31

               38

              28

              33

    Chicago

               30

               30

              27

              16

    Cincinnati

               13

               16

                 9

                7

    Detroit

               22

               12

              24

                9

    Milwaukee

               25

               19

              27

              11

    Minneapolis

               19

               22

              16

              13

    NYC

               49

               46

              47

              36

    Philadelphia

               33

               24

              30

              13

    Pittsburgh

               12

               14

                 8

                8

    Seattle

               24

               33

              14

              21

    St. Louis

               16

               14

              13

                7

    San Francisco

               22

               27

              14

              12

    Washington, D.C.

               14

               16

                 8

                5

    Source: American Community Survey 2009.


    Yet today, central cities undoubtedly have more to offer households with children. Many cities have made significant strides in improving their public safety, or they have simply benefitted from general trends toward lower criminal activity. However, with regard to public education, it is unclear whether most cities have achieved much traction in this regard, though efforts towards these ends are widespread.  In the case of the city of Chicago, more affluent and educated families with school-age children continue to migrate to suburban communities.  This has resulted in a 16.5% decline in the school-age population in the city of Chicago over the past decade.

    Urban school improvement initiatives range from a host of teacher pay-for-performance reforms, to “small schools” reconfiguration, to charter school choice and high-achieving academies.  In some instances, where highly educated parents with children have chosen to live in the city, parents have opted out of the public school system. For example, in Manhattan about 1 in 4 school-age children attend private schools. In the more affluent areas within Manhattan the percentage is much higher — about 1 in 2 children in families that live in either the Upper East Side or Upper West Side.

    As they aim to encourage further population growth in city centers, policy leaders would do well to understand the residential choices being made by affluent and educated households with children and work to provide the amenities and services important to these families. They represent a population segment that may be significant in attracting jobs and building a tax base to provide public services for all city residents.  Otherwise, working parents who must commute from suburb to city may demand higher wages as compensation for the additional time and cost of getting to work, thus having a negative effect on employment and investment in the city.

    The recent influx of young (mostly well-educated) adult singles represents an opportunity for central cities. These urban homesteaders begin with a preference for urban living; policymakers might want to consider ways to keep them in the city as they marry and raise children.

    In a current study, we are exploring the relationship between higher education, income, and the location of families with school-age children within a city-suburban area context for 15 large metropolitan areas in the United States, including Chicago, New York City, Philadelphia, and San Francisco.² In particular, we highlight the effects of various levels of higher education on household location and how education effects vary for different types of households. We compare our results with estimates for married respondents without school-age children and for never-married respondents without school-age children. Thus, we are able to highlight the heterogeneity in the effects of education on household location by household type and city-suburb location.

    A key variable in our study is whether adults have at least a bachelor’s degree. In about half of the metropolitan areas we examine, educational attainment levels of householders are higher in central cities than in suburban areas. In some cases, the differences are relatively large—for example, the share of population with a college degree is 15 percentage points higher in the city of Seattle than in the suburbs. However, the share is 18 percentage points higher in the suburbs of Detroit than in the city.

    But when it comes to college-educated parents, the apparent residential advantage of the city mostly evaporates. In most cases, college-educated parents with school-age children are far less concentrated in central cities relative to all parents with school-age children, with the exceptions of Charlotte, Pittsburgh, and Seattle. For example, 30 percent of college graduates in the Chicago MSA live in the city of Chicago, but only 16 percent of college-educated parents with school-age children live in the city. About half of these parents send their children to private schools.

    On the face of it, the key reason that parents live in central cities is the location of their work. A high percentage of parents who work in central cities also live there. For example, 59 percent of parents with school-age children who work in the city of Chicago also live there. This declines to 43 percent for college-educated parents with school-age kids.

    How do these numbers hold up to closer statistical scrutiny? To put them to the test, we conducted multivariate analyses with respect to individual household location in city versus suburb. We analyzed each of 15 city-suburb MSA pairs separately for the very recent past. Our study data are drawn from the Census Bureau’s American Community Survey for 2009. According to our results, the ongoing migration of educated, mostly young, adults into the city has not carried over into their child-raising years. Our findings are negative for higher education and income effects on living in a central city for families with school-age children for the largest cities within metropolitan areas in our sample, including Chicago, New York City, and Philadelphia. This contrasts with more positive higher education effects on living in cities for married and never-married respondents without school-age children.

    In most of our study MSAs, households with high educational attainment lead the way in living in central cities, but the presence of school-age children negates this effect. Overall, having either a bachelor’s degree or a master’s degree has a negative effect on families with school-age kids living in a city, although there are a few cases where the effect is positive. Having very high levels of educational attainment (a professional degree or a Ph.D.) is negatively associated with living in a city only in a few cases, suggesting that parents with the highest levels of educational attainment tend to have a greater preference for living in cities than other college-educated parents.

    To what extent should cities pursue households with children as a focus of strategic development? Clearly, the benefits of good schools and safe neighborhoods accrue to all population segments, so these are important goals for policy in any case. Social returns to education and safety are high; today’s children are tomorrow’s citizenry and work force. Now that more college-educated households are choosing to live in the city during their pre-child-raising years, city leaders may want to explore ways to entice more of them to remain in the city after they become parents.

    William Sander (Ph.D., Cornell University) is professor of economics at DePaul University in Chicago.  He has also taught at the University of Illinois at Urbana-Champaign and the University of the Philippines.

    William A. Testa (Ph.D., Ohio State University) is Vice President and Director of Regional Programs, Federal Reserve Bank of Chicago.  He has also taught at Tulane University.

    References:
    ¹William Sander and William A. Testa. 2013a. “Education and the Location of Work: A Continued Economic Role for Central Cities.” Annals of Regional Science.
    ²William Sander and William A. Testa. 2013b. “Parents’ Education, School-Age Children, and Household Location in American Cities.” Paper prepared for the European Regional Science Association Congress, Palermo, Italy.

    Crossing the street photo by Bigstock.

  • Mobility for the Poor: Car-Sharing, Car Loans, and the Limits of Public Transit

    Public transit systems intend to enhance local economies by linking people to their occupations. This presents problems for many  low-income families  dependent on transit for commuting. With rising prices at the gas pump, much hope has been placed on an influx of investment into public transit to help low-income households. But does public transit really help the poor? While the effect of transit access on job attainment is murky, several alternatives such as car loans and car-sharing programs have seen real results in closing the income gap. For Christina Hubbert, emancipation from public transit has been a change for the better. NBC News reports:

    A car means Hubbert no longer spends two hours each way to and from work in suburban Atlanta. It means spending more time with her 3-year-old daughter — and no longer having to wake her up at 5 every morning so she can be in the office by 8. It also means saving hundreds of dollars each week in day care late fees she incurred when she couldn’t get to the center before its 6:30 p.m. closing time.

    Research finds that car-ownership is positively correlated with job opportunities while no such relationship exists with access to transit stations. Furthermore, increased transit mobility has been proven to have no effect on employment outcomes for welfare recipients. The notion that newer and nearer public transit creates benefits for all is inaccurate; it only creates opportunities for those who live near the transit stations, and those opportunities are limited. A study by the Brookings Institute finds that, among the ten leading metropolitan areas in the US, less than 10% of jobs in a metropolitan area are within 45 minutes of travel by transit modes. Moreover, 36% of the entry-level jobs are completely inaccessible by public transit. This is not surprising given the fact that suburbia houses two-thirds of all new jobs.

    The mismatch between people and jobs can be reconciled in two ways: car loans and car-sharing services. Basic car-sharing involves several people using the same car or a fleet of cars, as with the ZipCar. The concept has branched out to on-demand car sharing services, such as Lyft, mobile apps which link riders with drivers.

    Car loans on the other hand have been around for a while and offer affordable financing for a car without a required down payment. Ways to Work, one of the largest loan providers in the U.S., includes courses on personal finance and credit counseling. By making vehicle travel more attractive, these two disruptive innovations threaten the expansion of public transit – and its powerful associated lobbies – in three ways:

    1. It’s more cost-efficient and time-efficient.

    To improve the way we move people, transit developments must save both time and money. Sadly, transit lines are notorious for their extraordinary costs and long delays. Data from the 2010 Census reveals that people living in central cities with a higher proportion of transit riders experience longer commutes. And since transit riders have more cumbersome commutes, they are much more likely to be tardy or absent from work.

    The hefty price tag of transit projects also triggers concern. For example, the cost per new passenger of the Washington Metro line to Dulles Airport was estimated at $15,000 annually. That’s about the same as the current poverty threshold for a household of two.

    Car-loan programs on the other hand are largely cost-efficient, producing real fiscal benefits to borrowers, employers, and taxpayers. A survey of 4,771 borrowers and their employers finds that borrowers have greater job security as a result of access to vehicles. With access to credit, borrowers increase their purchasing power by an average of $2,900 each year and save about $250 by avoiding payday loans and checks-for-cash outlets. Employers gain as well through cost savings due to increase retention and reduced absenteeism and tardiness, which amount to $817 and $1130 per borrower respectively. In large part, providing vehicle financing is a smart investment since it reduces the number of low-income families on social welfare – an annual cost savings of $2,900 for each borrower coming off public assistance.

    Given its clear advantages, car sharing is increasing. Recent reports find that shared-use vehicle organizations have been lucrative. Between August 2012 and July 2013, car-sharing ridership grew by 112 percent and the number of vehicles increased by 52 percent. And although car-sharing is not typically used to transport the poor, having on-demand car service makes it so that door-to-door access is more available and affordable. If car-sharing continues to grow at its current rate, it’s reasonable then to assume that these pseudo-taxi services will be eventually be affordable enough so that people would choose to be chauffeured rather than drive their own vehicles.

    2. Vehicle ownership provides greater access to jobs and economic opportunities.

    Instead of being limited to a few areas that are transit-oriented, families with cars have access to more jobs and economic opportunities. Public transit lines are limited in their geographical coverage and take time to make often numerous stops.  Transfers are inefficient and time-consuming, making much of that coverage impractical. Also regular transit riders have limited employment options since they’re only able to consider jobs in the vicinity of transit stops and stations.

    3. Travel by car  is responsive to current travel patterns

  • A common misperception is that low-income people do not have cars. In reality, 86% of the poor have cars, compared to 95% of the entire population. The high percentage of poor families with cars reveals how automobile culture has become fixed into American ideals of economic well-being and prosperity. And contrary to stereotypes, the poor and the rich similarly spend about 94% of their transportation costs on vehicle travel versus public transit, challenging the notion that low-income travel behavior is unlike that of the rest of the population. As such, providing the poor with cars dramatically levels the playing field as they are the ones who would gain the most from increased access to employment destinations and education facilities.

    A strong argument posited by public transit advocates is that as more cars use the road, congestion and pollution will intensify. And to be sure, public transit is more environmentally friendly than motor vehicles. The Amalgamated Transit Union (ATU), the largest union representing transit workers in North America, reports that one full bus eases the road of thirty-five cars, and that existing transit usage cuts national gasoline consumption by 1.4 billion gallons annually. Yet, on average, this result can only   be achieved if buses were always full, which they are not – authorities from the Los Angeles Metro estimate that their buses run at an average of 42% capacity.

    But is it equitable to ask the poor to forgo mobility and economic gain for the environment? Considering that most Americans experience some degree of social mobility via vehicle ownership, it’s far more reasonable to allow  low-income families greater access to opportunity. In addition, new fuel efficiency standards for cars set by the Obama administration will decrease overall GHG emissions substantially; according to forecasts by the Department of Energy, carbon emissions from light-duty vehicles will drop 21% between 2010 and 2040 in spite of a 40% increase in driving. This shows that, even with more cars on the road, environmental goals can be accomplished.

    Although the eligibility requirements are stricter in some areas than others, every state in the U.S. has a program for low-income residents to have access to car loans. Car-sharing is also rapidly expanding, but  marketing now is geared towards millennials on a budget rather than low-income families. Both innovations, however, respond to new demands faced by future workers, who are likely to find employment in dispersed locations and may make more trips per workday since many may have multiple part-time jobs. With more efficient ways of getting people to work, it’s time to challenge the assumption that the expansion of public transit is the best way to meet the needs of America’s hard-pressed working class.

    Jeff Khau graduated from Chapman University with a degree in business entrepreneurship. Currently, he resides in Los Angeles where he is pursuing his dual-masters in urban planning and public policy at the University of Southern California.

    Photo by Romana Klee, #113 zipcar.

  • What Detroit Has Really Taught America

    Nothing. Seriously. Not a damn thing.

    Oh, the occasion is being used to opine on our state of affairs, but nothing is structurally taking shape in America to prevent the next Detroit from occurring. In fact, Detroit is occurring every day inside most of us. We are all getting bankrupt in so many little ways.

    America is in a precarious position. Our economy is based on consumption. Our consumption is based on our livelihood. Our livelihood is based on our employment, and in our jobless “recovery”, there just aren’t many decent jobs. With technological advances, it is likely to get worse. Writes columnist Bill McClellan in the St. Louis Dispatch:

    [T]he day is coming when trucks will drive themselves. People in the trucking industry say it is inevitable. Within a decade or so, truck drivers will be obsolete. There are currently 5.7 million truck drivers.

    McLellan continues, discussing an email he received from a reader:

    Pat B. is a conservative businessman. He wrote, “Regarding the truck drivers, I think the bigger issue is how society is going to deal with nonproductive people vs. productive people. Automation will allow ‘productive’ people to be much, much more productive than the ‘nonproductive’ people. Theoretically, a very small segment of the population could produce almost everything. How will we deal with this?”

    Good question. Currently, Detroit is ground zero of it. So much busted there, so many poor, so many with blue- and white-collar skills in the new no-collar economy. Do we let the city die on the vine? Au revoir Rust Belt?

    Well, a consensus is becoming clear. We need to “First World” Detroit. Get it and other post-industrial cities on the right path.

    Enter New York.

    Courtesy of Smithsonian

    In the late 1970′s, New York City was in trouble: the threat of bankruptcy, and the Bronx was on fire, literally, with broadcaster Howard Cosell famously being attributed to saying “There it is ladies and gentleman, The Bronx is burning” as cameras panned to a fire in an abandoned elementary school during Game 2 of the 1977 World Series. Put simply, the 1970’s NYC was not unlike the modern day Detroit—insolvent fiscally, aesthetically, and, in many respects, sociologically. “Broken youth stumbling into the home of broken age,” wrote Frank Rose in the Village Voice.

    But with crisis comes opportunity, particularly for those who can afford to be opportunistic. Specifically, in the book by Paul Harvey entitled The Brief History of Neoliberalism, the crossroads of NYC’s late-70’s fiscal crisis gets center stage. Here, the groundwork for the city’s co-optation had been laid for some time, with the 1960’s urban crisis increasing municipal desperation. Financial institutions smelled blood, and they saw occasion. What happened dictates urban redevelopment to this day. Writes Harvey (h/t Cleveland Frowns):

    At first financial institutions were prepared to bridge the gap, but in 1975 a powerful cabal of investment bankers (led by Walter Wriston of Citibank) refused to roll over the debt and pushed the city into technical bankruptcy. The bail-out that followed entailed the construction of new institutions that took over the management of the city budget.

    Harvey states that the new budget strategy amounted to “a coup by the financial institutions against the democratically elected government”, one that would subsequently de-emphasize social and physical infrastructure for the priority of a “good business climate”. Harvey continues:

    But the New York investment bankers did not walk away from the city. They seized the opportunity to restructure it in ways that suited their agenda…This meant using public resources to build appropriate infrastructures for business…coupled with subsidies and tax incentives for capitalist enterprises…[T]he investment bankers reconstructed the city economy around financial activities, ancillary services such as legal services and the media…and diversified consumerism (with gentrification and neighborhood ‘restoration’ playing a prominent and profitable role). City government was more and more construed as entrepreneurial rather than a social democratic or even managerial entity.

    Fast forward to now and you can see how this framework has made modern day New York. A billionaire mayor. Impressive wealth accumulation. Lower crime. Gentrifying areas that are spreading into many parts of the city. The scene in the Bronx:

    The South Bronx is on the upswing and this new project proves it,” said Kathy Zamechansky, President of KZA Realty Group. “A gleaming new building is just what this area needs to add life and vitality to a neighborhood…

    All good, right?

    Not exactly. Commoditizing public welfare has come with very personal costs. Particularly, New York City’s economic sphere epitomizes the worsening two-tier system in America, with one study finding that “three of the four most [income] segregated metropolitan areas [in the country] are in the New York City region”. In the city itself, the income disparity rates from subway stop to subway stop are at Namibian levels. “Get off at Chambers St., and you’re averaging $205,192,” writes Fishbowl NY. “Hop off at Kingsbridge Rd., and you’re at $18,610”.

    Income Disparity New York

    There is cost to personal freedom as well, with Mayor Bloomberg’s “stop-and-frisk” tactics ruled as a violation to the constitutional rights of minorities. The increase in police stops have been significant since Bloomberg took office, going from 160,851 in 2003 to 685,724 in 2011. In a 195-page response just released, the federal judge wrote: “No one should live in fear of being stopped whenever he leaves his home to go about the activities of daily life”.

    Heck, there’s even consternation from the city’s creative types. Specifically, New York’s legacy of nurturing the next generation of thought is being homogenized by the fact that elites talking to elites creates for shitty cultural capital. Writes Gawker’s Hamiliton Nolan on how the influx of money is turning the city into “a game of urban Candy Crush”, “Everything is an orgy of destruction! Who’s hip now? Nobody!” Echoes creative class troubadour Lena Dunham:

    It’s news to no one that the middle class and up-and-coming talent struggle in this city. As a result, New York is seeing an exodus of its creative population. As Dunham says, “If they struggle for too long, they’re leaving New York for Seattle, Chicago, Austin, and in some cases, even Tampa. We can’t have our generation’s Patti Smith moving to Tampa. That’s going to seriously f*ck our shit up.

    But the bridge had been crossed. Not simply for the reasons Dunham fingers, but because New York City is the head of a teetering set of bones. Writes eminent economic scholar Joseph Stiglitz in a recent essay entitled “The Wrong Lesson from Detroit’s Bankruptcy”:

    Rather than deal purposefully with this changing economic landscape with useful policies encouraging the growth of other industries, our government spent decades papering over the growing weaknesses by allowing the financial sector to run amok, creating “growth” based on bubbles. We didn’t just let the market run its course. We made an active choice to embrace short-term profits and large-scale inefficiency.

    America does have an urban renewal program, but it is aimed more at restoring buildings and gentrification than at maintaining and restoring communities, and even at that, it is languishing.

    Which brings us back to Detroit. Consider it America’s “Back to the Future” moment. There is municipal bankruptcy. There is fiscal management being taken away from an elected government. There are financial institutions wreaking havoc on the middle class via a collective Alfred E. Neuman-like exasperation. There is the subsidy environment going full bore in the midst of economic trauma, with the Governor of Michigan giving the okay to Detroit billionaire Mitch Ilitch on his $650 million dollar publicly-subsidized hockey arena one day after signing off on the country’s largest city bankruptcy filing. And then there’s the gentrification-as-economic-development silver bullet, with real estate developer Dan Gilbert buying up downtown properties for the price of a song and then using the spatial grease of placemaking to fill his square feet with the rise of the creative class. “Stand up and gentrify: 7 days in Detroit” reads a series running in the The Windsor Star.


    “It was a face that didn’t have a care in the world, except mischief.” Quote from Mad editor Harvey Kurtzman.

    Taken together, the framework of Detroit’s progression is to simply go forth into who we are as a country—a group of people on a collision course with the inevitable failings of economic disparity, or more generally: a nation without good jobs.

    Should Detroiters be worried?

    Maybe. Reads the New York Observer: “Bloomberg Warns the Next Mayor Could Follow Detroit Into Bankruptcy”.

    Back to the future indeed.

    Richey Piiparinen is a writer and policy researcher based in Cleveland. He is co-editor of Rust Belt Chic: The Cleveland Anthology. Read more from him at his blog and at Rust Belt Chic.

    Lead photo courtesy of Vice.

  • Here’s a Way to Flood the US Housing Market with One Trillion Dollars

    Members of the millennial generation – born between 1982 and 2003 – carry a student debt burden of close to one trillion dollars. This is the group that includes many just entering the stage in life when people tend to settle down and start families. Even though Millennials are marrying later than previous generations, they would still be the prime market for sales of single family starter homes, if only they could afford them. As interest rates rise along with home  prices, the only way this key consumer segment will be able to afford to buy a house is if the nation, out of its own self-interest, finds a way to relieve Millennials of their crushing student loan obligations.

    Millennials are the first generation in American history that has been asked to self-finance the cost of the education needed for America to be economically successful. Shortly after the ratification of the Constitution, Congress passed legislation setting aside land in the new territories for the establishment of the iconic one room school houses to assure its newest citizens had the skills required to be good farmers and domestic servants. Even as the country was engaged in a devastating Civil War, a state-by-state movement to mandate universal and free primary education for every child swept the nation and became a permanent part of American society. Then, when the Industrial Revolution generated a demand for factory and office workers with a high school education, the nation expanded the concept to make such an education available equally to young men and women without any requirement to pay tuition.      

    The situation has changed, but the need for an educated young generation has not. The difference is that at least two years of post-secondary education has become a must-have ticket for a young generation seeking to make its way in the world. Yet we have suddenly yanked the universal, free education rug out from under them and asked them to pay for it by not only going into debt, but assuming a debt that is not even dischargeable in bankruptcy court.

    The result is a rising tide of student debt that threatens to undermine the economic vitality of the nation. According to the Federal Reserve, student debt rose by a factor of more than eight between 2001 and 2012, twice as fast as home loans and far in excess of the modest increases in other forms of indebtedness during the same time period. A recently released report by the Consumer Financial Protection Bureau indicates that about one in four student loans is now either in default or in programs designed to help borrowers in distress. This analysis looked only at loans made through the direct student loan program totaling about $570 million, not older ones that may have been offered by banks and other private sector lenders. If borrowers are unable to repay their loans in the long run, the federal government and taxpayers will have to absorb the losses. Why, then, not recognize the problem now and bail out the borrowers so that they can put the windfall to good use in an economy desperately needing a new boost in consumer spending?

    The Great Recession seriously disrupted household formation and consumer spending.  According to an analysis by Merrill Lynch, in the decade before the financial markets’ collapse in 2008, one-third of all housing turnovers came from homeowners older than  55, and about one-third of those sales were to buyers under 34. Since then sales of homes have fallen by about two million units, leaving the economy 2.5 million households below normal levels. Millennials represent about 22% of the US population and control $200 billion of direct purchasing power, not counting their influence on their parent’s spending decisions. Over the next five years, a quarter of Millennials will enter their peak spending years, making them the best hope for reviving the housing market.

    Millennials have expressed a strong preference for living in the type of suburban communities in which they grew up, especially when it’s time, as it is for many of them now, to raise a family. Their first home needn’t be “move in ready;” about a third of them say they would prefer a “fixer upper.” And more than 80% of the generation believe they would find a way to pay for the cost of any repairs themselves rather than borrow the money from their parents. A wave of new home buying would not only give a sharp boost to the durable goods industry that depends on new household formation for its growth, but would also provide a ready-made army to fix up some of the country’s declining, inner ring suburban housing stock.

    There are legitimate public policy issues about how to fix the problem of financing American higher education. Some might argue that we should tackle that problem before dealing with student loan debtors. But with the economic recovery still proceeding at too slow a pace for most middle class Americans, an equally good case can be made that the country should deal with student loan debt either first or as part of a comprehensive reform of  financing higher education. The economy could use the boost, as could the morale of America’s largest and most diverse generation.

    Morley Winograd and Michael D. Hais are co-authors of the newly published Millennial Momentum: How a New Generation is Remaking America and Millennial Makeover: MySpace, YouTube, and the Future of American Politics and fellows of NDN and the New Policy Institute.

    New home photo by BigStockPhoto.com.

  • California Homes Require Real Reach

    In the 1950s and 1960s, Southern California was ground zero for the “American Dream” of owning a house. From tony Newport Beach and Bel-Air to the more middle-class suburbs of the San Fernando Valley and Garden Grove to working-class Lakewood, our region created a vast geography of opportunity for prospective homeowners.

    Today, with house prices again skyrocketing, Southern California is morphing into something that more resembles a geography of inequality. Now, even the middle class is forced into either being “house poor” or completely shut out of homeownership, or may simply be obliged to leave the area. Even more troubling is that the working class and the poor suffer from the kind of crowded, overpriced housing conditions sadly reminiscent of those experienced during the Depression and the Second World War.

    Judged by the “median multiple” – the median income divided by the median house price – California’s prices for a generation have soared well above the national averages. Demographer Wendell Cox notes that, until the early 1970s, California’s house prices were similar to those in the rest of the United States. National Association of Realtors data indicate that the median house price in California at that time was 7 percent above the national average. By 2013, the price differential had risen to 109 percent.

    This has little to do with such things as construction costs, which have not risen as quickly in most of California as elsewhere, but are largely the result of soaring land costs and stiff fees imposed on housing. Attributable largely to regulatory factors that restrict building in many areas, the cost of finished land for comparably priced houses has increased nine times as much in California as in the rest of the nation since 1970. Portland State University economist Gerald Mildner refers to this as “Economics 101,” indicating that “as the demand for property in a region grows, the increase in demand translates into some combination of more space and high prices, depending upon the elasticity of supply.”

    Beside regulatory restraints, California housing prices are driven up by the highest impact fees in the nation. An annual survey by Duncan and Associates shows that the average impact fee in California for single-family residence in 2012 was $31,100 per unit, nearly 90 percent higher than the next most expensive state and 265 percent higher than the norm among jurisdictions that levy such fees, which typically pay for capital improvements, like water and wastewater facilities, required by a new development. Many states and localities on the other side of the Sierras do not.

    These fees also impact multifamily housing; the state’s fees on multifamily units averaged $18,800, 290 percent above the average outside the state.

    Construction penalized

    California’s emerging housing crisis, then, is not, as some suggest, a reflection of the state’s constrained geography or economic superiority. The two most-recent spikes in housing costs have occurred as the state’s median income has dropped from well above to just about the national average. Neither can we blame a huge surge of new residents, since California’s once-buoyant population growth has slowed to levels similar to those of the rest of the country.

    Instead, the roots of our state’s massive social regression lie in political choices made by the state, counties and cities. This trend likely will intensify, as regulators interpret the state’s climate-change legislation to further penalize construction of single-family houses preferred by most California families. Particularly vulnerable will be the starter-home market, once the engine of California’s egalitarian middle-class culture.

    Some “new urbanists” and greens argue that such restrictions will eliminate wasteful “McMansions” and spur construction of more “sustainable” dense housing for the working masses. Yet, in reality, the impact of highly restrictive housing polices tend to be felt most by both middle-class families and the least-affluent, who find themselves unable to buy housing or, in some cases, are forced to spend huge percentages of their income on rent.

    The growing affordability crisis seems likely to worsen as the housing market recovers. Given the paucity of new home construction, and ever-tightening regulation, California’s housing market is particularly vulnerable to wild swings in prices; the year-on-year median house price increase as of May 2013 was the greatest since 1980, even greater than in any of the past decade’s “bubble” years. Overall, price gains in the state were two to three times stronger than that in the rest of the nation.

    This process has been further accelerated by the presence of investors in the local market. Investors, many from Asia, now account for upward of one in four home purchasers in the state.

    Among the biggest losers here is California’s middle class, particularly young families without large family endowments. Some 60 percent of U.S. households can now afford to buy a house, according to the National Association of Home Builders / Wells Fargo Housing Opportunity Index, but that percentage has dropped even in the Riverside-San Bernardino (40 percent) and Sacramento (50 percent) metropolitan areas, while San Jose, Los Angeles and San Diego had affordability levels of 20 percent to 30 percent. The lowest level, 17 percent, was found in the San Francisco metropolitan area. We can expect these numbers to worsen in the immediate future.

    These numbers will impact a wide range of people, including many with skills desired by employers. According to an analysis of Orange County average salaries for National Core, a nonprofit housing developer based in Rancho Cucamonga, even a biomedical engineer or a nurse in O.C. does not earn enough to buy a house there. As economist and author Claude Gruen has suggested, more restrictive land-use regulation “is to the middle class what the economic disaster of slum clearance was to the poor.”

    Renters don’t escape

    Nor will the poor, or renters, benefit from these policies. The nation, and the state, have had programs to help lower-income residents, but these programs meet only a fraction of the need. Los Angeles County had a waiting list 17 times its potential supply of housing, according to a 2004 report by the National Low Income Housing Coalition. With relatively little new product being produced, it’s unlikely this situation can improve, as potential homeowners are shoved into the rental market, boosting rents higher.

    The net result is that more Californians are becoming house poor or “rent” poor. According to American Community Survey data analysis done for National Core by this author and demographer Wendell Cox, this state has four of the six major metropolitan areas with the largest share of renters spending more than 30 percent of their income on rent – led by Riverside-San Bernardino, Los Angeles-Orange County, Sacramento and San Diego – are located in the Golden State. This includes a majority of renter household in the cities of Los Angeles, Glendale, Anaheim and Santa Ana.

    Even more troubling is a growing percentage of working households suffering housing-expense burdens of 50 percent or more of income. California again leads the way, according the National Housing Conference, with Los Angeles and San Diego among the top five major metro areas.

    This emerging social disaster has received little attention from the so-called progressives, whose policies in part are responsible for the state’s growing housing crisis. In large part due to housing, and lack of good middle-class jobs, California now has the highest poverty rate (when adjusted for the cost of housing) of any state.

    Not only are working-class Californians poorer, they also are subject to ever-higher levels of overcrowding. On a percentage basis, four California major metropolitan areas are in the 10 regions in the country with the most families doubling up. The top two are Riverside-San Bernardino and Los Angeles, followed by San Jose and San Diego.

    Overcrowding is particularly tough on children, who suffer greater problems with health and academic performance. Another study associated psychological problems with children from overcrowded housing.

    Long drives to work

    Finally, the housing crisis also creates significant environmental problems. The unaffordability of housing has forced many Californians to seek shelter far from work. Among commuters traveling 60 minutes or more to work, Riverside-San Bernardino is third-highest, followed by Los Angeles, eighth, and San Francisco, ninth. Among major metropolitan areas with the highest share of commuters traveling 90 or more minutes one way, Riverside-San Bernardino ranks second, in a virtual tie with New York, followed by Sacramento, seventh, and Los Angeles, eighth.

    For both California’s middle- and working-class, our housing regulatory regime serves as a kind of tax – a nearly confiscatory one – that works particularly against families, the poor and those who do not possess considerable family wealth. The result is a California that is increasingly out of sync with the very dream that has brought millions from all over the country.

    Joel Kotkin is executive editor of NewGeography.com and Distinguished Presidential Fellow in Urban Futures at Chapman University, and a member of the editorial board of the Orange County Register. He is author of The City: A Global History and The Next Hundred Million: America in 2050. His most recent study, The Rise of Postfamilialism, has been widely discussed and distributed internationally. He lives in Los Angeles, CA.

    This piece originally appeared at The Orange County Register.

    Photo of Los Angeles housing by Wendell Cox.