Category: Urban Issues

  • The Cities That Are Stealing Finance Jobs From Wall Street

    Over the past 60 years, financial services’ share of the economy has exploded from 2.5% to 8.5% of GDP. Even if you believe, as we do, that financialization is not a healthy trend, the sector boasts a high number of relatively well-paid jobs that most cities would welcome.

    Yet our list of the fastest-growing finance economies is a surprising one that includes many “second-tier” cities that most would not associate with banking. To identify the cities making the biggest gains, we ranked metropolitan statistical areas’ employment growth in the sector over the long-term (2001-12), mid-term (2007-12) and the last two years, as well as momentum.

    Best Cities for Jobs in Finance Industries

    New High-Fliers

    Tops on our list among the 66 largest metro areas is Richmond, Va., where financial sector employment has grown an impressive 12% since 2009. This reflects the presence of large banks such as Capital One Financial , the area’s largest private employer with 10,900 jobs, and SunTrust Banks , which employs 4,400. The insurer Genworth Financial is based in Richmond, and Wells Fargo and Bank of America also have sizable operations there. Along with the Northern Virginia metropolitan statistical area (an area encompassing the state’s suburbs of Washington, D.C., including Fairfax, Arlington, Loudoun and Prince William counties), which is No. 7 on our list, the Old Dominion is quietly becoming a major financial power.

    In once-gritty Pittsburgh, which places second on our list, financial services is now the largest contributor to the regional GDP, according to the Allegheny Conference. Long seen as a backwater, the area has begun to lure the kind of highly trained workers used by financial firms, leading Rust Belt analyst Jim Russell to joke, “Pittsburgh is becoming the new Portland.” Financial employment there has grown nearly 7% since 2009. The strongly reviving local economy spans everything from energy to medical technology.

    Like Pittsburgh, some of the areas doing well in financial services are also thriving generally. These include such Texas high-fliers as No. 3 Ft. Worth-Arlington, where financial services employment has expanded over 12% since 2007, as well as No. 4 San Antonio-New Braunfels. And it is not real estate that is driving this boom—in Fort Worth, for example, the “real estate and rental and leasing” sub-sector of financial services shed jobs over the last five years while the “finance and insurance” subsector expanded almost 20%.

    Some metro areas that aren’t exactly setting the world on fire are scoring in the financial job sweepstakes. Jacksonville, Fla., ranks fifth on our list and St. Louis, MO-IL ranks eighth. In St. Louis, financial sector employment is up 6.4% since 2007 by our count, and the number of securities industry jobs has increased 85% to 12,000 over that span, according to the Wall Street Journal.

    What’s Driving Dispersion of Financial Services?

    The largest traditional financial centers appear to be losing their edge. New York, home to by far the largest banking sector with 436,000 jobs, places a meager 52nd on our list of the cities winning the most new jobs in the sector. Big money may still be minted in Gotham, but jobs are not. Since 2007 financial employment in the Big Apple is down 7.4%.

    The next four biggest financial centers are also doing poorly. San Francisco-San Mateo ranks 37th – remarkably poor given that San Francisco placed first overall on our 2013 list of The Best Cities For Jobs. Meanwhile Boston-Cambridge-Quincy ranks 44th (despite notching a strong 17th place ranking on our overall list), Los Angeles-Long Beach is 47th, and Chicago-Joliet-Naperville is 57th.

    So what gives here? A key factor is cost-cutting. As firms look to move back office and some sales functions to less expensive locales, the traditional financial centers are losing out. Between 2007 and 2012, New York, Boston, Los Angeles, Chicago and San Francisco lost a combined 40,000 finance jobs.

    In addition to lower rents in the cities that rank highly on our list, workers come cheaper, too: the average annual salary for securities industry jobs in St. Louis is $102,000, according to the Wall Street Journal, compared with $343,000 in New York.

    This trend is not just limited to the high-profile investment banks and brokerages. Insurance, the quieter and tamer part of the financial services sector (it has roughly the same number of jobs today as it did in 2001 and 2007), has seen an exodus of jobs into these lower-cost regional markets as well. Illinois-based insurance giant State Farm, for example, recently signed mega-leases in Dallas, Phoenix and Atlanta.

    Manufacturing And Energy Drive Changes

    The manufacturing revival in the Rust Belt and the Midwest is creating financial sector jobs in midsized cities (those with overall employment totaling 150,000 to 450,000).  Tops on that list is Ann Arbor, Mich., followed by Green Bay, Wisc., No. 16 Grand-Rapids-Wyoming, Mich., and No. 19 Madison, Wisc. Among small cities, Owensboro, Ky., ranks first, followed by No. 3 Kankakee-Bradley, Ill., No. 5 Clarksville, Tenn.-Ky., No. 11 Bloomington-Normal, Ill., and No. 13 Michigan City-La Porte, Ind. With low commercial and industrial market costs and available workforces, these regions could prove attractive to manufacturers re-shoring U.S. operations.

    The top of the financial services rankings for midsized and small cities is also liberally sprinkled with places where hot energy economies are driving employment in all sectors. The midsized list features Bakersfield-Delano, Calif., in third place, the Texas towns of El Paso and McAllen-Edinburg-Mission in fifth and ninth place, respectively, and No. 10 Lafayette, La. Our small cities ranking includes the Texas towns of Odessa (2nd), Midland (fourth) and Sherman-Denison (10th), and Cheyenne, Wyo. (14th). More economic activity will continue to flow to these regions both as they grow and as their suppliers move closer to reduce costs.

    What The Future Holds

    Historically financial services clustered in big cities, but increasingly cost is leading financial institutions to focus on smaller metropolitan areas. With the connectivity of the Internet and growth of educated workforces in many smaller metros, it has become increasingly possible for financial firms to locate many key functions outside of the traditional money centers.

    Some places can boast advantages beyond just lower costs. Jacksonville, and Miami-Kendall (No. 13 on our big cities list) benefit from the huge demand for financial advisers in Florida. The Sunshine State ranks fourth in the number of financial advisors, and this seems likely to grow as at least some of the expanding ranks of down-shifting boomers — some with decent nest eggs– head down south to retire or start second careers. This demographic trend could also benefit Phoenix, which already hosts substantial operations of Bank of America, JPMorgan Chase and Wells Fargo.

    Perhaps no low-cost metro area has greater long-term advantages than Salt Lake City, 12th on our list. The unique linguistics skills of the largely Mormon workforce have attracted big financial firms such as Goldman Sachs, who need people capable of conversing in Lithuanian, Chinese or Tagalog. Salt Lake City, with 1,400 employees, is the investment bank’s sixth largest location in the world.

    “We consider Salt Lake a high leverage location,” notes Goldman managing director David W. Lang. “There’s a huge cost differential and you have a huge talent-rich environment.”

    As we saw in manufacturing and information sectors, the financial services industry appears to be undergoing a profound geographic shift. Once identified largely with such storied locales as Wall Street, Chicago’s LaSalle Street or San Francisco’s Montgomery, the financial sector — like much of the economy — is dispersing, perhaps even more rapidly. Over time, this could accelerate the process of economic decentralization that has been occurring, fairly steadily, for the better part of a half century.

    Best Cities for Jobs in Finance Industries

    Joel Kotkin is executive editor of NewGeography.com and a distinguished presidential fellow in urban futures at Chapman University, and a member of the editorial board of the Orange County Register. He is author of The City: A Global History and The Next Hundred Million: America in 2050. His most recent study, The Rise of Postfamilialism, has been widely discussed and distributed internationally. He lives in Los Angeles, CA.

    Michael Shires, Ph.D. is a professor at Pepperdine University School of Public Policy.

    This piece originally appeared at Forbes.com.

    Downtown Richmond photo by CoredesatChikai.

  • Addressing Housing Affordability Using Cooperatives

    Our country is six years into the Great Recession, the biggest economic downturn since the Great Depression. It’s been replete with reports of home foreclosures, collapsing commuter towns, and young people struggling to become home owners. The term “generation rent” is often used in the media to describe the struggles of aspiring young people.  

    This is really a problem of upward mobility, and  how little the political system has responded to this problems of “generation rent” and those who have lost their homes. The current lack of action can be contrasted with the two very different periods in our economic history – the Roaring Twenties and the Great Depression.

    When discussing home ownership, many often bring up the efforts of Franklin Delano Roosevelt during the Great Depression. FDR called a nation of homeowners “unconquerable.”  But his administration really built on the ideas of previous administrations. Herbert Hoover, while serving as Warren Harding and Calvin Coolidge’s Secretary of Commerce, lent his support the “Own Your Own Home Campaign” of the Federal National Mortgage Association. This campaign touted the benefits of home ownership to the American people. And when Hoover became president, he created the Federal Home Loan Bank Board which chartered and supervised federal savings and loan institutions and created Federal Home Loan Banks to lend money to finance home mortgages. The purpose of this bank was to make homeownership cheaper for lower income people. It also represented a portion of Hoover’s efforts to fight the depression, and those efforts often went unrecognized by the American people both then and now. Hoover said home ownership could "change the very physical, mental and moral fiber of one’s own children." 

    After being elected president, Roosevelt created the Federal Housing Administration which insured homes made by banks and other lenders. The agency made it possible for people to pay for homes over three decades, before this period most homes were paid for through a three to five year loans. This program, followed up by Harry Truman’s support of veteran’s home loans and the home mortgage interest deduction, helped turn a nation of urban tenement dwellers into a nation of suburban home owners. Today, the federal government spends billions in subsides to ensure people have the opportunity to own their own homes. 

    Urbanist Richard Florida discusses the issue of home ownership in the 2010 book The Great Reset. In his interesting but misguided book, he correctly points out that too many people attained loans in the housing bubble and that high rates of homeownership hobble the labor market, as owning a home makes it harder for the job seeker to move. He also faults the Obama Administration for trying to do too much to prop up the mortgage market and recommends that the government quit supporting home ownership and start supporting renting to a greater extent. He said Fannie Mae has already taken steps in this direction by allowing people who experienced foreclosure to rent their houses. 

    But Florida is overstating the importance of renting in the lives of the American people, as we have a strong heritage as an upwardly mobile, ownership society that stretches back to the homesteading legislation pushed by Thomas Jefferson and Abraham Lincoln. But there’s no doubting that we’re a more mobile society than in the homesteading days. While FDR built on the work of his Republican predecessors, today’s leaders also have a template in the cooperative housing movement. According to the National Association of Housing Cooperatives, cooperative housing is defined as when “people join together on a democratic basis to own and control the housing or community facilities where they live.” Each month those who live in a housing cooperative pay their share of the expenses while sharing the benefits of the cooperative. According to the NAHC, 1.2 million families live in cooperative housing in the United States.

    What if we could create more forms of cooperative housing to make sure families have the opportunity to own a home and at the same time have a certain amount of mobility? Could a new Cooperative Housing Authority, with funding from Fannie Mae, buy up foreclosed houses and charge a monthly below market rate to a family? All such houses could be considered a part of the CHA and the family in the house would share in the profits of the authority. If and when the family moves, they’ll be entitled to those profits which could be used for rent or a down payment on a house. Such a program would help commuter towns who are suffering from high gas prices and foreclosures. 

    But a Cooperative Housing Authority would also be a conduit for affordable housing in America’s big cities and the surrounding suburbs, as the added supply of new housing forces the cost down. This would be an asset to certain cities where the supply of affordable housing is dwindling due to gentrification. Like most cooperative housing, the housing could take various forms: condos, townhomes and single family homes. I would suspect single family homes would be the most popular because they are the preference of most Americans. 

    A Federal Community Land Trust could be along with a CHA another way to deal with affordable  housing shortages. Like any land trust, it could add civic buildings, commercial spaces and community assets to the areas where the housing exits. This would ensure mixed/use type neighborhoods where residents would have access to shopping and civic life nearby. 

    Returning to FDR’s administration, during the 1930s the government constructed what was called garden suburbs outside of major cities: Greenbelt, Maryland; Greenhills, Ohio; and Greendale, Wisconsin. The garden suburbs were intended to house rural people who were migrating to the city as well as poor urban workers. The project was a two way street, as the government provided the road grid and cheap credit for the suburbs while aspiring families provided the mortgage payments.  These garden suburbs – designed to be suburban with some green (trees and parks) – provided a template for the mass automobile suburbanization that occurred in the 1950s.

    Of course, urbanists have never quit critiquing this suburban development model since it emerged. Like many in the city planning world, Lewis Mumford was horrified at the way suburbanization played out after World War II:
    "The planners of the New Towns seem to me to have over-reacted against nineteenth-century congestion and to have produced a sprawl that is not only wasteful but–what is more important–obstructive to social life."
    Mumford advocated the regional city – a city that included an urban core surrounded by well-planned suburbs, as he also rejected the densely packed cities of the decades before the war.     

    Could a FCLT and CHA work to create family friendly suburbs with mixed use development, and in turn save families money on energy and at the same time spare the environment more greenhouse gas pollution? I think that it could, and if these developments were to become a reality, Lewis Mumford’s vision of a regional city might look like a reality. 

    Jason Sibert is a freelance writer who has lived in the St. Louis Metro Area since the late 90s. He worked for the Suburban Journals for a decade and his work has appeared in various publications over the last four years.

    Chicago housing cooperative photo by Jennifer D. Ames.

  • Driving Trends in Context

    There are grains of reality, misreporting and exaggeration in the press treatment of a report on driving trends by USPIRG. The report generated the usual press reports suggesting that the millennial generation (ages 16 to 35) is driving less, moving to urban cores, and that with a decline in driving per capita, people are switching to transit. These included the usual, but not representative anecdotes about people whose lifestyles and mobility needs are sufficiently served by the severe geographical and travel time limitations of transit.

    Further, in an important contribution, the USPIRG report provides driving trend forecasts that are lower than other projections. If accurate, these would result in materially greater greenhouse gas emissions reductions to 2040 than projected by the Department of Energy, further undermining the justification for anti-mobility policies as well as urban containment.

    Millennials and More Urban and Walkable Living

    It is again reported that millennials "like to live in the city center." Last year, a report by USPIRG cited a poll indicating that 77 percent of millennials plan to live in urban cores. Their actual choices have been radically different.

    In fact, 2010 census data indicates that people between 20 and 29 years old were less inclined to live in more urban and walkable neighborhoods than their predecessors. In 2000, 19 percent of people aged 20 to 29 lived in the core municipalities of major metropolitan areas, where transit service and walkable neighborhoods are concentrated. Only 13 percent of the increase in 20 to 29-year-old population between 2000 and 2010 was in the core municipalities. By contrast, the share of the age 20 to 29 living  in the suburbs of major metropolitan areas was 45 percent, higher than the 36 percent living there in 2000 (Figure 1).

    The Decline in Driving

    Driving per capita in urban areas peaked in 2005. Between 2005 and 2011, driving declined seven percent. In the context of rising gasoline prices, and economic trends, the real news is not how much driving has fallen, but rather how little. A seven percent reduction is slight compared to the one and one-half times increase in gas prices over the past decade (Figure 2). Per capita travel by car and light truck has fallen back only to 2002 levels, which remained above the driving rates of previous years.

    Drivers: Not Switching to Transit

    The USPIRG report gives the impression that instead of driving, Americans are switching to other modes of transport, principally transit. In discussing the report, Nick Turner, of the Rockefeller Foundation said: "Americans are making very different transportation choices than they did in years past."

    Actually not. The data shows that as people drove less, they did not switch to transit. The driving reduction was approximately 900 miles per capita from 2005 to 2011. At the same time, transit ridership per capita was up approximately 15 miles – a small change compared to the reduction in driving (Figure 3). People just traveled a less (perhaps fewer trips to the store or to the beach, not to mention the fewer work trips in a depressed economy).

    Work trip travel trends are little changed over the past decade. Driving alone and transit were up marginally between 2000 and 2011. Working at home increased the most, while car pooling declined the most (Figure 4).

    This raises the issue of context. While driving was declining about seven percent per capita from 2005 to 2011, transit use was increasing about seven percent. The percentages were similar, but the amount of travel was radically different, because of transit’s much smaller base. Transit usage would need to increase nearly 400 percent to equal the mileage of a seven percent loss in travel by car. For all of the impressive transit ridership increase claims, transit’s share of urban travel has changed little (Figure 5).

    Transit’s failure to capture much of the decline in driving simply reflects the limitation of its effectiveness in taking people where they need to go. Transit is very effective in providing mobility to the nation’s largest downtown areas, where it provides half to three quarters of the trips. Approximately 55 percent of all US transit commuting is to six transit legacy cities (municipalities), including New York, Chicago, Philadelphia, Boston, San Francisco, and Washington. Most of this commuting is to the compact and dense downtown areas.

    Outside the transit legacy cities, transit’s impact is slight, because of the "last mile" problem.  Transit service is not close enough (or fast enough) to be practical for most trips in metropolitan areas. For example, Brookings Institution data indicates that the average worker can reach fewer than 10 percent of of jobs in major metropolitan areas within 45 minutes. By contrast, the average solo driver reaches work in approximately 25 minutes. There is no solving this problem, because the infrastructure that would be required is far from affordable, as Professor Jean-Claude Ziv and I showed in a WCTRS paper (See: Megacities and Affluence).

    Millennial Driving in Context

    Survey data does indicate a decline in driving among millennials, but those with jobs are not flocking to transit. Single occupant commuting in this age group increased between 2000 and 2011, from 66.9 percent to 69.7 percent. Transit use and working at home also increased (5.4 percent to 5.8 percent and 1.4 percent to 2.6 percent respectively. There was, however, a substantial decline in car pool use among millennials, from 17.4 percent to 12.6 percent (Figure 6).

    Younger workers have suffered disproportionately from the economic decline. There has been a substantial reduction in the percentage of people aged 16 to 24 who have jobs (Figure 7). These lost work trips have contributed more than any perceived preference for urban living to the decline in driving. Transportation expert Alan Pisarski has attributed much of the decline in demand in this age group to such economic factors.

    At the same time, and as USPIRG indicates, the increase in social media use may well have contributed to the declining demand for discretionary travel.

    Driving Less in the Future and the GHG Emissions Implications

    The decline in per capita driving is not surprising. Back in 1999, Pisarski predicted that per capita driving would soon peak ("Cars, Women and Minorities: The Democratization of Mobility in America"), because automobile availability had now spread to most all segments of society.

    USPIRG forecasts driving volumes below US Department of Energy predictions. According to USPIRG:  "Coupled with improvements in fuel efficiency, reduced driving means Americans will use about half as much gasoline and other fuels in 2040 than they use today." This means an even greater reduction in GHG emissions than currently forecast. Department of Energy forecasts a 21 percent decline in total (not per mile) GHG emissions from light vehicles between 2010 and 2040, despite a 40 percent increase in driving. The more modest driving levels in USPIRG scenarios would result in GHG emissions reductions of between 31 percent and 55 percent between 2010 and 2040 (Figure 8). These projections provide further evidence that of the "greening" of the automobile and the needlessness of urban containment policies.

    Reality

    Regardless, however, of the future trend, it is important to minimize the time that people spend traveling in metropolitan areas, because of the strong association between effective mobility, job access, and economic growth. Modern metropolitan areas require the quickest possible access between all origins and destinations to facilitate greater household affluence (measured in discretionary income) and lower levels of poverty. The objective should be the greatest reduction in travel delay per dollar spent on transportation.

    Dug Begley accurately characterized the situation in the Houston Chronicle:

    "We spend a lot of transportation money in the Houston region on roads, and for good reason: That’s how most people travel. Houston is a growing place, and there aren’t two or three job centers, there are about eight. Getting people between them … is going to take roads."

    Outside the municipal boundaries of the six legacy cities and especially their downtown enclaves, Houston (despite its reputation) is little different than the rest of metropolitan America. From the suburbs of New York, to the entire Portland and Phoenix metropolitan areas, the automobile carries the overwhelming share of travel (see Table 1, here). It cannot be any other way, since no planning agency in the New World or Western Europe has a plan, much less the resources, to construct a transit system that would duplicate the mobility of the automobile throughout its metropolitan area.

    Wendell Cox is a Visiting Professor, Conservatoire National des Arts et Metiers, Paris and the author of “War on the Dream: How Anti-Sprawl Policy Threatens the Quality of Life.

    —–

    Methodology: This article is based on data from the Federal Highway Administration, the Federal Transit Administration, Census Bureau, Department of Energy and USPIRG.

    Photo: Roadways, Fort Lauderdale (Miami metropolitan area)

  • Southern California Economy Not Keeping Up

    One of Orange County’s top executives asked me over lunch recently why Southern California has not seen anything like the kind of tech boom now sweeping large parts of the San Francisco Bay Area. In many ways, it is just one indication of how this region – once seen as the cutting edge of American urbanism – has lost ground not only to its historic northern rival, but also to some venerable East Coast cities, as well as the boom towns of Texas and the recovering metropolitan areas of the Southeast.

    This divergence became particularly clear to me as I put together the most recent Forbes Best Places for Jobs with Pepperdine University economist Mike Shires. Our rankings focus heavily on momentum: What areas are growing fastest now and have made the best progress over the past decade. For me, a 40-year resident of the Los Angeles Basin (Shires is a native of San Diego), the results were far from encouraging.

    To be sure, Los Angeles, Orange County and Riverside-San Bernardino are up somewhat from their dismal showings in past years, in part due to the housing recovery. But none did well enough to ascend even to mediocrity. Yet, of 66 regions with more than 450,000 jobs, Los Angeles ranked No. 49, while Riverside-San Bernardino clocked in at No. 45, and Santa Ana-Anaheim-Irvine did best, with a still-less-than-middling No. 38.

    These rankings were way below those registered in the country’s emerging economic powerhouse, Texas, which placed a remarkable four regions in the top 10 (Fort Worth, Dallas, Houston, Austin) or rising burgs such as No. 2, Nashville, No. 3, Salt Lake City, and No. 9, Denver. We also got smoked by such low-exposure places as No. 13, Columbus, Ohio, No. 15, Oklahoma City, and No. 16, Indianapolis.

    But our relative decline is not merely a reflection of the natural effects of lower costs and better business climate. We also lagged well behind such famously expensive, and hyper-regulated, places as No. 14, Seattle, No. 17, Boston, and No. 18, New York City. Worse of all, Southern California was left completely in the dust by its two great interstate rivals, the No. 1-ranked San Francisco Bay Area and No. 7-ranked San Jose/Silicon Valley. The only California cities to do worse than the Southland were No. 56, Oakland, and No. 57, Sacramento.

    Why is the Southern California economy lagging, even in this recovery? Much of the answer can be found by looking at the information sector, which is driving much of the Bay Area’s growth. As my luncheon partner, who is investing heavily in the Silicon Valley, suggested, the entire wave of new tech companies has largely bypassed Southern California.

    This is not merely a question of achieving less growth, but actually losing ground, while the Bay Area metros soar. Since 2007, for example, the information sector – which includes software, media and entertainment – surged 18 percent in the San Francisco-San Mateo area and by a remarkable 25 percent in the San Jose-Silicon Valley region. In contrast, the Los Angeles information sector declined by 7.3 percent, while in Orange County, once a tech hotbed, it dropped by 21 percent.

    These declines impact not only demonstrably tech-oriented jobs, but also professional and business services that often serve tech clients. Over the past five years, these jobs have been growing smartly in San Francisco and decently in Silicon Valley, while declining in both Orange County and Los Angeles. Only recently have these sectors showed any sign of recovery in the Southland, but at a far weaker rate than in the Bay Area.

    Why is this happening? Certainly the answers are complex. Historically, the L.A.-Orange County tech economy has been strongly tied to aerospace and defense, and these sectors have been declining under President Barack Obama. The defense sector also has tended to shift toward more politically potent places like Texas, Georgia and Alabama, where politicians actually work on behalf of industrial jobs. With the exception of drone technology, the Southern California region’s aerospace industry, as one analyst put it, has become “dormant,” a victim of a talent drain and a gradual withdrawal of aerospace giants, most recently, Northrop, from the region.

    Like Los Angeles, Silicon Valley’s tech community was largely birthed by the Defense Department and NASA, something rarely acknowledged by the region’s hagiographers. But, starting in the 1980s, the Bay Area began to apply early innovations in semiconductor design and software to other industries, such as personal computers, the Internet and, more recently, social media and mobile devices, something that has generated not only jobs, but also buzz.

    Capital, too, has played a role. The L.A. area has lots of rich people, but a relatively weak venture capital community. The Bay Area has roughly five times as much venture capital – more than $10 billion – as the far more populous L.A.-O.C. region. New York and New England also enjoy far more money in local venture investment firms than does Southern California.

    Politics and image-making also has contributed to the Southland’s eclipse. California politics are now almost totally dominated by Bay Area politicians – from Gov. Jerry Brown to Lt. Gov. Gavin Newsom and Attorney General Kamala Harris. Both our U.S. senators are from San Francisco and its environs. Their economic orientation, when they have one, tends to be to worship at the altar of allied Bay Area software giants, like Google, and social media firms such as Twitter or Facebook. Life in cyberspace makes less-direct demands on green “progressive” sensibilities than making airplanes or garments, or the work of processing trade with Asia.

    In general, the Bay Area economic mindset tends to disdain the tangible economy – manufacturing, wholesale trade, construction – critical to the more diverse and more blue-collar-oriented Los Angeles-area economy. California’s tight land-use regulation and soaring energy prices do not much impact the Bay Area giants, since they simply shift their energy-intensive operations to places like Texas or Utah. And, as for soaring housing prices, people who cannot afford Bay Area prices also can be shifted to Salt Lake City, Austin, Texas, or Raleigh, N.C.

    In contrast, Southern California, like much of the Central Valley, is far less able to slough off the green-dominated policies of the Bay Area political cliques. Los Angeles, for example, still has 360,000 manufacturing jobs, down more than 18 percent since 2007, and Orange County has an additional 160,000 such jobs, after a drop of 11 percent the past five years. In contrast, San Francisco-San Mateo has only 36,000 industrial jobs. These, too, have been declining rapidly, but have far less impact on the economy than down here.

    Then, there’s the question of image. According to a recent Bloomberg Businessweek survey, San Francisco ranked as “best city” to live in. Suburban San Jose ranked No. 33.

    Los Angeles? Try No. 50, behind such places as Cleveland, Omaha, Neb., Tulsa, Okla., Indianapolis and Phoenix.

    In another survey, identifying the top 10 cities for “millennials,” Seattle ranked first, followed by such cities as Houston, Minneapolis, Dallas, Washington, Boston and New York. Needless to say, neither Los Angeles nor Orange County made the cut.

    Is there something we can do about this decline? I think this is more than just a marketing issue. Southern California, a region that largely invented itself out of combination of real estate speculation and great climate, needs to rediscover the roots of its success. Once our entrepreneurs imagined and forced into being great things, such as massive water and port systems; they dominated the race for space and planned out the suburban dreamscapes of Lakewood, Valencia and the Irvine Ranch. With the possible exception of Elon Musk and Space X, Southern California’s entrepreneurial guile is now decidedly low-key – food trucks, ethnic shopping, reality shows, hipster-oriented lofts and shopping areas.

    This limited vision extends to politics as well. As recently as the 1980s, the region boasted an aggressive business community that bullied Sacramento and bestrode Washington like a colossus. Now, our business leaders cringe like supplicants before well-funded greens, racialist warlords and public employee unions. We need business and community leaders to match the increasing arrogance and audacity of the Silicon Valley oligarchs, to force legislators to address the needs of our economically diverse, and still tangibly oriented economy.

    This also requires that the cultural resources of the region – Hollywood, the fashion industry, universities and colleges – become more engaged in something larger than protecting their narrow interests. At some point, they should realize that, as our region loses luster, so, too, does the fundamental attractiveness of their institutions and industries.

    Until this happens, Southern California – despite its cultural richness, ideal climate and great history of economic vigor – will continue to lag, performing, at best, to its current level of underachievement, slouching toward a permanent state of mediocrity.

    Joel Kotkin is executive editor of NewGeography.com and a distinguished presidential fellow in urban futures at Chapman University, and a member of the editorial board of the Orange County Register. He is author of The City: A Global History and The Next Hundred Million: America in 2050. His most recent study, The Rise of Postfamilialism, has been widely discussed and distributed internationally. He lives in Los Angeles, CA.

    This piece originally appeared in the Orange County Register.

  • Texas Suburbs Lead Population Growth

    The US Census Bureau has reported that eight of the fifteen 2011-2012 fastest-growing municipalities with at least 50,000 population were in Texas. Three of them were in the Austin metropolitan area. San Marcos, south of Austin, grew the fastest in the nation at 4.9 percent. Cedar Park, located in Austin’s northern suburbs, ranked fourth in growth at 4.7 percent while Georgetown, also north of Austin grew 4.2 percent and ranked seventh. Houston suburb Conroe placed 10th adding 4.0 percent to its population. Dallas-Fort Worth suburbs McKinney and Frisco placed 11th and 12th. The other two Texas municipalities ranking high were outside the major metropolitan areas, Midland (third) and Odessa (13th).

    Growth Outside Texas

    South Jordan, located in the southern suburbs of the Salt Lake City metropolitan area was the second fastest-growing municipality, at 4.9 percent. Atlanta suburb Alpharetta grew 4.4 percent and ranked sixth. The largest municipality among the fastest-growing was Irvine, an Orange County suburb in the Los Angeles metropolitan area, which grew 4.2 percent to a population of 230,000. Buckeye, a suburb on the western periphery of the Phoenix metropolitan area placed ninth, growing 4.1 percent.

    Among the above 11 fastest-growing suburbs in major metropolitan areas, all are either near the periphery of the urban area or beyond the principal urban area. This illustrates the historic tendency of the fastest-growing city sectors to be located on (or beyond) their fringes. This was also strongly evident in the 2000 to 2010 census data, which showed 94 percent of major metropolitan area growth to be 10 miles or more from the urban cores.

    Other fast growers were not in major metropolitan areas, including Midland, Texas, Odessa, Texas, Auburn, Alabama and Manhattan, Kansas. Clarksville, Tennessee grew fifth-fastest. Clarksville is the core city of the second fastest-growing metropolitan area in the nation, just north of Nashville.

    First Census Bureau Municipal Estimates Since 2010

    These were the first reliable municipality (sub-county) population estimates produced by the Census Bureau since the 2010 census. The 2011 municipality estimates were virtually meaningless, since they were simply percentage allocation of county growth to municipalities based upon their share of the 2010 population.

    Growth in the Major Metropolitan Core Cities

    Nonetheless, over the past two years the greatest historical core municipality growth has been in those with the most suburban (Figure 1) land use characteristics. (See Suburbanized Core Cities for discussion of how “Historical Core Cities” are defined).

    Pre-War & Non Suburban Core Cities: The least suburban core cities, those with little postwar suburban development, grew 0.7 percent between 2010 and 2012. The strongest growth in this category was in Washington, which added 2.2 percent annually. In reaching a population of 634,000, Washington passed nearby Baltimore for the first time in its history. New York added the largest number of people in the category at 162,000.

    Pre-War and Suburban Core Cities: The Pre-War Core cities with large tracts of post-war suburban development grew at a 1.2 percent annual rate (Note 1). In this category, New Orleans grew the fastest, at an annual rate of 3.2 percent, as it continues to recover from Hurricane Katrina. Denver also grew strongly, at an annual rate of 2.5 percent.

    Post-War & Suburban Core Cities: These core cities, none of which had strong urban cores before World War II and which are virtually all suburban, grew at an annual rate of 1.5 percent. Austin, which is at the core of the fastest-growing major metropolitan area in the United States, grew the fastest in this category, at 2.9 percent.

    Metropolitan, Core City and Suburban Trends

    The estimates also indicate that the suburban population boom that accompanied the housing bubble has run its course. During the 2000s, the share of major metropolitan area (over 1 million population) growth in historical core municipalities fell to approximately one-half the rate of the 1990s. That picked up in the late 2000s as housing construction came to a near standstill and the slower suburban growth rates that have continued through to 2012.

    In a few metropolitan areas, historical core municipalities attracted the majority of the population growth. The leader in this regard was Providence, with 75 percent of its metropolitan growth, which was miniscule. New Orleans captured nearly 2/3 of the growth in its metropolitan area, while New York accounted for 61 percent of its metropolitan area growth. San Antonio, San Jose, and Columbus also attracted more than one half of their metropolitan area growth, though the high share of core-city growth in San Jose and San Antonio was reflective of their high population shares (Table 1).

    Between 2000 and 2012, historical core municipalities accounted for 27.2 percent of the growth in major metropolitan areas (Figure 2). This is slightly more than their 26.4 percent of the population in 2010. It would be a mistake to interpret this as presaging the long predicted "return to the city." It would take a continuation of these growth rates for nearly 500 years for historical core municipality populations to struggle to 30 percent of the major metropolitan area population. At the same time, there have been recent indications of even more dispersion, as major metropolitan areas lost nearly two million domestic migrants to smaller areas between 2000 and 2011, according to Census Bureau data.

    Further, the trends in domestic migration indicate that people continue to move to the suburbs from elsewhere, while moving away from the core counties (migration data is not available below the county level). Overall, the core counties of major metropolitan areas lost 167,000 domestic migrants, while the suburban counties added 286,000 (Note 2).

    The domestic migration losses in some core counties were substantial. In the five counties that constitute New York, there was a loss of 139,000 domestic migrants (there was also a loss of 114,000 domestic migrants in the suburbs). Los Angeles County lost 111,000 domestic migrants, while Chicago’s Cook County lost 74,000. The largest gainers were in Austin (Travis County: 36,000), Atlanta (Fulton County: 32,000) and San Antonio (30,000). Core counties continued to attract most international migration, adding 757,000, compared to 589,000 in the suburban counties (Table 2).

    The Future?

    It seems apparent that the nation’s growth continues to be in a transitional period. Should a more normal and vibrant economy replace the current malaise, it seems likely that suburban growth will be renewed. That would not, however, preclude a continuation of the recent smaller inner-core population growth in the increasingly safer and more attractive downtown areas.

    Table 1
    Metropolitan and Historical Core CityPopulation: 2010-2012
    Metroplitan Area Metropolitan Area Change Historical Core City(s) Change Share of Growth
    Atlanta, GA        5,457,831         171,099         443,775        23,496 13.7%
    Austin, TX        1,834,303         118,017         842,592        51,955 44.0%
    Baltimore, MD        2,753,149           42,660         621,342            381 0.9%
    Birmingham, AL        1,136,650             8,600         212,038           (250) -2.9%
    Boston, MA-NH        4,640,802           88,400         636,479        18,885 21.4%
    Buffalo, NY        1,134,210            (1,301)         259,384         (1,926)
    Charlotte, NC-SC        2,296,569           79,534         809,798        21,221 26.7%
    Chicago, IL-IN-WI        9,522,434           61,329       2,714,856        19,258 31.4%
    Cincinnati, OH-KY-IN        2,128,603           14,023         296,550           (400) -2.9%
    Cleveland, OH        2,063,535          (13,705)         390,928         (5,886)
    Columbus, OH        1,944,002           42,037         809,798        21,221 50.5%
    Dallas-Fort Worth, TX        6,700,991         274,781       1,241,162        43,329 15.8%
    Denver, CO        2,645,209         101,731         634,265        34,241 33.7%
    Detroit,  MI        4,292,060            (4,187)         701,475       (12,302)
    Grand Rapids, MI        1,005,648           16,710         190,411          2,371 14.2%
    Hartford, CT        1,214,400             2,016         124,893            118 5.9%
    Houston, TX        6,177,035         256,579       2,160,821        63,604 24.8%
    Indianapolis. IN        1,928,982           41,105         834,852        14,410 35.1%
    Jacksonville, FL        1,377,850           32,254         836,507        14,723 45.6%
    Kansas City, MO-KS        2,038,724           29,386         464,310          4,523 15.4%
    Las Vegas, NV        2,000,759           49,490         596,424        12,637 25.5%
    Los Angeles, CA       13,052,921         224,079       3,857,799        65,172 29.1%
    Louisville, KY-IN        1,251,351           15,643         605,110          7,774 49.7%
    Memphis, TN-MS-AR        1,341,690           16,861         655,155          8,266 49.0%
    Miami, FL        5,762,717         198,060         413,892        14,384 7.3%
    Milwaukee,WI        1,566,981           11,073         598,916          4,176 37.7%
    Minneapolis-St. Paul, MN-WI        3,422,264           73,405         683,650        16,004 21.8%
    Nashville, TN        1,726,693           55,803         624,496        20,969 37.6%
    New Orleans. LA        1,227,096           37,233         369,250        25,421 68.3%
    New York, NY-NJ-PA       19,831,858         264,451       8,336,697      161,561 61.1%
    Oklahoma City, OK        1,296,565           43,573         599,199        19,196 44.1%
    Orlando, FL        2,223,674           89,263         249,562        11,258 12.6%
    Philadelphia, PA-NJ-DE-MD        6,018,800           53,459       1,547,607        21,601 40.4%
    Phoenix, AZ        4,329,534         136,647       1,488,750        41,198 30.1%
    Pittsburgh, PA        2,360,733             4,448         306,211            509 11.4%
    Portland, OR-WA        2,289,800           63,791         603,106        19,328 30.3%
    Providence, RI-MA        1,601,374               522         178,432            396 75.9%
    Raleigh, NC        1,188,564           58,074         423,179        19,232 33.1%
    Richmond, VA        1,231,980           23,879         210,309          6,072 25.4%
    Riverside-San Bernardino, CA        4,350,096         125,245         213,295          3,343 2.7%
    Rochester, NY        1,082,284             2,613         210,532              20 0.8%
    Sacramento, CA        2,196,482           47,355         475,516          9,028 19.1%
    St. Louis,, MO-IL        2,795,794             8,099         318,172         (1,122) -13.9%
    Salt Lake City, UT        1,123,712           35,839         189,314          2,871 8.0%
    San Antonio, TX        2,234,003           91,495       1,382,951        55,346 60.5%
    San Diego, CA        3,177,063           81,755       1,338,348        36,727 44.9%
    San Francisco-Oakland, CA        4,455,560         120,169       1,226,603        30,649 25.5%
    San Jose, CA        1,894,388           57,477         982,765        30,203 52.5%
    Seattle, WA        3,552,157         112,348         634,535        25,875 23.0%
    Tampa-St. Petersburg, FL        2,842,878           59,635         347,645        11,936 20.0%
    Virginia Beach-Norfolk, VA-NC        1,699,925           23,105         245,782          2,979 12.9%
    Washington, DC-VA-MD-WV        5,860,342         224,110         632,323        30,600 13.7%
    Total     173,283,025       3,770,067     45,771,761    1,026,581 27.2%
    Calculated from US Census Bureau data
    Table 2
    Migration: Major Metropolitan Areas
    Net Domestic Migration Net International Migration
    Metroplitan Area Core County(s) Suburban Counties Core County(s) Suburban Counties
    Atlanta, GA             32,368             4,672                8,122             31,891
    Austin, TX             36,045           30,339                9,536              2,161
    Baltimore, MD             (9,476)             9,895                4,282             14,336
    Birmingham, AL             (6,365)             2,141                1,709              1,119
    Boston, MA-NH             (2,596)             3,109              14,543             36,407
    Buffalo, NY             (4,920)            (1,473)                4,930                 440
    Charlotte, NC-SC             20,354           16,936                9,535              2,732
    Chicago, IL-IN-WI            (74,050)          (48,018)              36,540             15,580
    Cincinnati, OH-KY-IN            (10,814)            (3,155)                3,420              3,622
    Cleveland, OH            (24,548)            (2,628)                6,409              1,382
    Columbus, OH              3,116             2,366                9,220              1,088
    Dallas-Fort Worth, TX              9,745           88,765              20,652             22,153
    Denver, CO             17,317           29,839                3,447              6,393
    Detroit,  MI            (49,741)              (706)                7,716             13,973
    Grand Rapids, MI                 171                 59                1,794                 776
    Hartford, CT            (10,189)            (3,202)                9,480              1,428
    Houston, TX             20,101           50,554              42,096             12,295
    Indianapolis. IN             (6,523)           11,509                5,561              2,670
    Jacksonville, FL             (2,000)           12,461                5,991              1,546
    Kansas City, MO-KS             (6,842)             2,624                1,957              4,711
    Los Angeles, CA          (110,934)             8,439              88,868             23,635
    Louisville, KY-IN                (906)             1,837                3,871                 647
    Memphis, TN-MS-AR             (4,670)              (656)                3,727                 261
    Miami, FL                   26           44,255              66,308             44,873
    Milwaukee,WI            (11,271)               662                3,740                 911
    Minneapolis-St. Paul, MN-WI              2,706            (4,786)              11,583             11,424
    Nashville, TN              6,117           19,203                5,357              2,714
    New Orleans. LA             19,061              (585)                1,439              4,262
    New York, NY-NJ-PA          (139,190)        (114,335)            151,431           117,636
    Oklahoma City, OK              7,494           12,791                3,335              1,432
    Orlando, FL             16,507           15,163              21,115             10,779
    Philadelphia, PA-NJ-DE-MD            (14,535)          (18,095)              16,276             22,104
    Phoenix, AZ             42,243             4,716              18,971                 413
    Pittsburgh, PA              3,114             4,050                5,006                 783
    Portland, OR-WA              9,266           14,323                5,055              7,153
    Providence, RI-MA             (9,263)            (5,050)                6,428              2,988
    Raleigh, NC             25,546             3,409                7,207                 568
    Richmond, VA              1,965             3,781                1,656              4,908
    Riverside-San Bernardino, CA             (4,221)           33,207                6,649              6,184
    Rochester, NY             (5,738)            (2,222)                4,392                 583
    Sacramento, CA             (2,086)             6,472              11,150              3,172
    St. Louis,, MO-IL             (7,666)          (14,640)                2,322              6,677
    Salt Lake City, UT              1,486                 47                5,486                   28
    San Antonio, TX             30,130           16,031                7,417                 604
    San Francisco-Oakland, CA              1,736           17,103              12,294             36,783
    San Jose, CA             (7,029)               476              30,315                 104
    Seattle, WA             21,616             5,003              26,670              9,748
    Tampa-St. Petersburg, FL             20,153           15,875              12,823              7,086
    Virginia Beach-Norfolk, VA-NC             (4,405)            (7,859)                3,269             10,065
    Washington, DC-VA-MD-WV             14,170           21,026                6,199             73,365
    Total          (163,363)         285,728            798,480           588,593
    Calculated from US Census Bureau data


    Wendell Cox is a Visiting Professor, Conservatoire National des Arts et Metiers, Paris and the author of “War on the Dream: How Anti-Sprawl Policy Threatens the Quality of Life.

    —–

    Note 1: See 2010 historical core municipality list. This list does not include Grand Rapids, which now exceeds 1,0000,000 population as a result of the new metropolitan definitions, and is classified as Pre-War Core and Suburban.

    Note 2: Excludes the Las Vegas and San Diego metropolitan areas, which have only one county.

    Photo: Google Earth image of Cedar Park, Texas

  • The Cities Winning The Battle For Information Jobs

    The information industry has long been a darling of the media — no surprise since the media constitutes a major part of this economic sector, which includes publishing, software, entertainment and data processing. Yet until the last few years, it has been a sector in overall decline, with almost 850,000 jobs lost since 2001. The biggest losses have been in telecommunications (half a million jobs gone since 2001) and print publishing (books, newspapers, magazines), which lost 290,000 jobs — 40% of its 2001 job base.

    Yet over the past two years, spurred largely by social media and the growing use of data in business, there has been something of a resurgence in the information sector, with strong hiring in software publishing, data processing and other information services. To identify the cities making the biggest gains, we ranked metropolitan statistical areas’ employment growth in the sector over the long-term (2001-12), mid-term (2007-12) and the last two years, as well as momentum.

    Best Cities for Information Sector Jobs

    The Usual Suspects

    On our large cities list (the 66 metropolitan statistical areas with more than 450,000 jobs), the top two, perhaps not surprisingly, are San Jose-Sunnyvale-Santa Clara, Calif., aka Silicon Valley, followed by San Francisco-San Mateo-Redwood City. Since 2007, the number of information jobs in the Valley has grown by 25%, although this has not offset the large job losses in manufacturing, construction and government. Overall, San Francisco comes off a bit better: information employment is up less over the same period, 18%, but it has suffered less grievous losses in its smaller industrial and construction sectors. The San Francisco metro area ranks No. 1 on our 2013 list of The Best Cities For Jobs.

    Several other of our top performers come from what we might consider the usual suspects of high-tech hype, including Boston (No. 4), where information employment is up over 8% since 2007, and Seattle (15th), which has posted solid if not overwhelming growth of 4% in the sector since 2007, but has a much stronger manufacturing scene than the Bay Area. (See: America’s New Manufacturing Boomtowns)

    The Rising Stars

    But the big story in the information sector may be the emergence of a whole series of smaller metro areas that are usually less expensive. Some of the names here would also not surprise, such as Austin, Texas (fifth), and Raleigh-Cary, N.C. (eighth). They have been pulling information jobs from places like Boston, New York and the Bay Area for almost a generation. For example, Apple decided last year to center its Americas operations division in Austin, which is likely to bring upward of 3,000 information jobs to the Texas capital.

    Less well-known has been the growth in other upstart locations. Perhaps the most dramatic player is third-place New Orleans-Metairie-Kenner, where information employment is up 28% since 2009. The information sector in the area, where I am currently working as a consultant to the regional development agency, GNO, Inc., is very broad-based, including companies in digital effects, videogames, software development as well as a burgeoning film and television industry. The recent decision by General Electric to place its new technology center and its 300 new technology jobs in New Orleans is another sign of the Crescent City’s emergence as a viable information hub.

    GE is representative of a growing trend to place high-tech jobs in a new cadre of low-cost locations. In addition to New Orleans, the conglomerate has announced, over the past year, new technology centers in Detroit; Richmond, Va.; and San Ramon, Calif. While these expansions were not enough to reverse the overall poor showing on our large cities list of Richmond (second to last out of 66) and Detroit (60th), they reflect a growing tendency of businesses to tap relatively low-cost pools of talent.

    In many ways, New Orleans’ success story in information — the migration of jobs to lower cost, but still attractive, regions — is mirrored in other metro areas in our rankings. This includes No. 6 Atlanta, whose 85,000-strong information sector is now the nation’s fourth largest, if you combine Silicon Valley and San Francisco into one region. As in New Orleans, mega-companies also see Atlanta as a major and affordable talent center. General Motors, for example, recently announced plans to set up its new software center in the Atlanta suburbs, bringing more tech jobs.

    Several other large but affordable metro areas are also gaining momentum, most of which are in the Sun Belt. These include seventh-place San Antonio, which has experienced strong growth in such fields as cyber-security, and Phoenix (ninth),which traditionally draws talent and companies from California, and has also won a 1,000-person strong GM tech center in suburban Chandler.

    Finally, tech and media watchers should look out for 10th-place Nashville-Murfreesboro-Franklin, Tenn. Like New Orleans, the country music capital has a very strong media base and provides newcomers with everything from a hip urban ambiance to bucolic country suburbs. Its information sector is also helped by growth in health and manufacturing in the area.

    What About The Big Boys?

    New York, with some 174,000 information jobs, and Los Angeles, with over 190,000, retain the largest clusters of information industry jobs, but they are not growing as quickly as our top 10 metros. New York, at No. 13, has enjoyed only modest 3.2% growth in employment in the sector since 2007, and, despite all the renewed hype about “Silicon Alley,” growth ground to a halt over the past year. Overall since 2001 New York has lost some 16,000 information jobs, many of them directly tied to a big drop in publishing employment.

    But the Big Apple is an information boom town compared to Los Angeles (28th), with information employment there dropping 7.3% since 2007. L.A. today has 25,000 fewer information jobs than in 2001. Things appear to be more stable recently, but the big issue for L.A. lies in the decline of the entertainment industry, which dominates much of the area’s information sector. Since 2007, the Big Orange has lost roughly 9,000 jobs connected to the motion picture, television and recording industry, something the region has not found a way to redress.

    The only information hub that arguably has done consistently worse is Chicago, which has lost 30,000 information jobs since 2001. Many of those losses came from publishing and telecom, which suffered huge losses early in the last decade. Since then, the information sector decline has slowed and last year the area eked out growth of 0.4%.

    Best Cities for Information Sector Jobs

    Little Wonders

    Information businesses historically cluster in big cities, but there are now several smaller regions whose sectors are now growing rapidly. On our medium-size metro area list (between 150,000 and 450,000 jobs), the top spot goes to Trenton-Ewing, N.J., which enjoyed 9.2% growth in the sector since 2007 and appears to be attracting software development jobs. There’s also been considerable growth in Utah, which boasts Provo-Orem (fourth) and Ogden-Clearfield (sixth). Combined with Salt Lake City, a respectable 17th on the large metro area list, the Wasatch Front appears to be a real comer in the information economy.

    The mid-sized list, like the rising stars, appears very much to be driven by lifestyle preferences and the proximity of universities to provide raw talent. If there’s a more physically attractive metro area than No. 2 Santa Barbara-Santa Maria-Goleta, Calif., we’d like someone to find it for us. Lansing-East Lansing, Mich. (third), and Madison, Wisc. (fifth), may be a lot colder and less spectacularly beautiful than Santa Barbara, but as college towns and state capitals, they boast considerable amenities and a constant flow of recent graduates. Much the same can be said of No. 7 Baton Rouge, La., which also enjoys the benefits of an expanding energy industry. Albuquerque, N.M. (eighth), and Huntsville, Ala. (ninth), while not state capitals, are home to major national science laboratories that also attract a deep pool of local technology talent.

    The impact of the modern energy industry on information grows from the need of oil and gas firms to use technology to discover, maintain and expand their operations. This can be seen in our number one small metro for information jobs, Cheyenne, Wyo., as well as the Texas towns of College Station-Bryan (third) and Tyler (fourth). The link between manufacturing and information is evident in some of the small metros, including No. 2 Flint, Mich., and No. 8 Columbus, Ind.

    Who’s Left Behind?

    The information industry’s growth has missed many, if not most American metro areas. This includes many large cities in California, including Oakland-Fremont-Hayward (58th on our large cities list), Sacramento-Arden Arcade-Roseville (63rd) and San Bernardino-Riverside (64th). Given its proximity to both Silicon Valley and San Francisco, Oakland’s slow recovery is a bit surprising, but remember it was only when growth in Silicon Valley went hyper-critical during the ’90s dot-com bubble that Oakland finally surged. Other poor performers include last-place Camden, N.J.; Oklahoma City (62nd), Kansas City, Kan. (61st).

    Yet to an extent not well appreciated in the media, a slow-growing or even shrinking information sector isn’t necessarily an economic kiss of death. Information remains a relatively small, if highly obsessed over, sector of our economy. Additionally, some of these jobs are being subsumed into the indistinguishable category of business services as more and more firms bring them in-house as part of the normal course of doing business. Nonetheless, while you can certainly thrive without it, given the glitz factor, most metro areas would probably prefer to rank among those that are winning these jobs than missing out on them.

    Joel Kotkin is executive editor of NewGeography.com and a distinguished presidential fellow in urban futures at Chapman University, and a member of the editorial board of the Orange County Register. He is author of The City: A Global History and The Next Hundred Million: America in 2050. His most recent study, The Rise of Postfamilialism, has been widely discussed and distributed internationally. He lives in Los Angeles, CA.

    Michael Shires, Ph.D. is a professor at Pepperdine University School of Public Policy.

    This piece originally appeared at Forbes.com.

  • Visions of the Rust Belt Future (Part 2)

    There are interesting developments being played out in the Rust Belt. Some cities, like Detroit, seem to be embarking whole hog down the creative class path. Others, like Pittsburgh, have their own thing going on, a thing loosely delineated as the “Rust Belt Chic” model of economic development, with no modest amount of success. How a given Rust Belt city reinvests will have a large say in its future.

    Part 1 of this series examined the nascent creative classification of Detroit. Part 2 analyzes whether or not there is a new way forward for post-industrial cities, using the lessons from Pittsburgh and Cleveland as a guide.

    Rust Belt Chic

    Rust Belt Chic is the opposite of Creative Class Chic. The latter [is] the globalization of hip and cool. Wondering how Pittsburgh can be more like Austin is an absurd enterprise and, ultimately, counterproductive. I want to visit the Cleveland of Harvey Pekar, not the Miami of LeBron James. I can find King James World just about anywhere. Give me more Rust Belt Chic.—Jim Russell, Talent Geographer and economic development blogger at Pacific Standard.

    ***

    Pittsburgh has been referred to as “hell with the lid taken off”. It’s not a compliment, with the moniker originating from an 1868 travelogue written in The Atlantic Monthly. But the reference is a misquote. From the piece:

    On the evening of this dark day, we were conducted to the edge of the abyss, and looked over the iron railing upon the most striking spectacle we ever beheld … It is an unprofitable business, view-hunting; but if any one would enjoy a spectacle as striking as Niagara, he may do so by simply walking up a long hill to Cliff Street in Pittsburg, and looking over into — hell with the lid taken off.”

    As stated, the context of the piece has been lost to the narrative of the Rust Belt malaise, with one Pittsburgh local writing: “It was practically a love letter to the city, yet that damned ‘hell with the lid taken off’ line is all that survives”.

    This Rust Belt notion of “hell with the lid taken off”, “Shittsburgh”, and Cleveland as the “Mistake by the Lake” flows from a certain reality, as the post-industrial transition hasn’t exactly been a sun-bathing. But the lore is also partly contrived, since it’s derived from a stubborn stereotyping of the Rust Belt as a backwater you go to die. Such rigid yet malleable beliefs are “mesofacts”, or cognitions which—while not necessarily reflecting reality—nonetheless influence reality, particularly the act of migration. Writes Samuel Arbesman, the founder of the term:

    [I]magine you are considering relocating to another city. Not recognizing the slow change in the economic fortunes of various metropolitan areas, you immediately dismiss certain cities. For example, Pittsburgh, a city in the core of the historic Rust Belt of the United States, was for a long time considered to be something of a city to avoid.

    Mesofacts are an issue for Rust Belt cities. But the  resultant civic booster pandering comes off as desperation, with the image makeover usually but a process to “hip” your city into something, anything else. In fact there has been ample shame in being Rust Belt. Shame for having been post-industrialized. Abandoned. Idled from what the culture is known for: hard work. The collective sense has affected how the future is plotted.  Buffalo, St. Louis, Dayton yearn to be Las Vegas, Miami, Portland, New York. In fact, as we speak, Cleveland is planning a “transformational” vibrancy effort that entails hanging a Rodeo Drive-like outdoor chandelier in its theatre district. It will hang not a mile away from a neighborhood, Central, with a 70% poverty rate. Such dissonance-ensuing efforts kills recovery efforts. Said Jean de la Fontaine:

    “Everyone has his faults which he continually repeats: neither fear nor shame can cure them”.

    The alternative is for a city to know itself,  to chart its own way. Let others copycat their way to oblivion, or to become, according urbanist Aaron Renn, some “sort of mini-Brooklyn instead of who they really are at heart”. But this isn’t easy. It requires a collective and sustained effort, and a conceptual frame that can guide the process. This, then, is the central driving tenant of Rust Belt Chic economic development. It is not a process of “kumbaya-ing”, but a strategy sourced through that basic wisdom of the ages: “Know Thyself”.


    Courtesy of Red, White, and Blueprints

    Below details the experiences of Pittsburgh and Cleveland using the Rust Belt Chic lens, particularly showing how an awareness of its legacy costs and legacy opportunities can be used to build emerging economies and evolving societies.

    The New Economy: Neither Extraction nor Retention

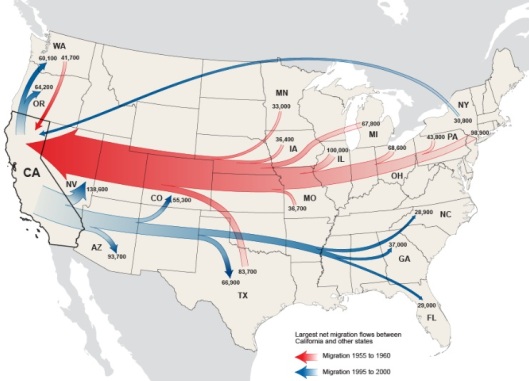
    A reality for the Rust Belt is that people left. Cleveland’s population declined by one-third in the 1970s. Pittsburgh’s exodus occurred in the 1980s. In fact, the whole of the region exported people, with states like California historically benefiting. Commonly, domestic outmigration has been viewed akin to leprosy, with angst-ridden brain drain initiatives haranguing people to stay put. This is a prime example of a mesofact-driven policy that does more harm than good. Rather, understanding how to leverage the fact your citizens are everywhere would be wise in an economy where connection matters more than place. This is the view in international economic development. Rust Belt cities should get wise. How Sweden thinks:

    Swedish Foreign Affairs Minister Carl Bildt believes it’s essential to embrace globalization. “I want to have more of the world in Sweden and more of Sweden in the world,” he told me. Sweden isn’t afraid of brain drain, he said. Instead, “we encourage our young people to study abroad and to work abroad.” Many return, but even those who don’t help to connect Sweden to what Mr. Bildt calls “the global flow of ideas.”

    This “global flow of ideas” is not just talk. It has legs. Writes leading Rust Belt Chic thinker, and colleague, Jim Russell: “Moving from one place to another is an economic stimulus. People leaving Cleveland promotes growth.”

    Courtesy of the Census.

    Courtesy of the Census.

    How does this work exactly?

    Think of an act of migration as a lying down of fiber optics, with each trip thickening the network between two points in space. Often, cluster relationships begin forming. Take Los Angles and Pittsburgh. For years, the best talent would be poached at Carnegie Mellon. On the surface, this meant Pittsburgh would grow the talent and California, though an employer such as Disney Labs, would reap the rewards.

    Brain drain, right? Thus, spend money to herd the nerds, and make your talent inert for the sake of a Census count. Or, as Russell writes: “Pittsburgh is dying. Time to pony up the jingle and get Richard Florida to save the day.”

    Well, as Ernest George Ravenstein wrote in “The Laws of Migration, 1885”, “Each main current of migration produces a compensating counter-current”, and this is exactly what happened between Pittsburgh and Los Angeles. For instance, as the cost of attracting talent into “spiky locales” started becoming prohibitive, alternatives were sought. For Disney Labs, one was locating an R&D center near Carnegie Mellon, with the decision influenced by the networks formed through by Pittsburgh’s “brain drain”. Count Google and Apple as two others bellying up in the Rust Belt backwater. As is Schell Games, an educational gaming company with a founder born in Jersey, educated in Pittsburgh, and refined in Los Angeles. Located in the South Side neighborhood of Pittsburgh, the company totaled a quarter of a billion dollars in sales in 2011. A similar process is being played out in Cleveland between Case Western, University Hospitals, and Philips Technology in the field of medical imaging. These are just some of the  relational opportunities across the whole of the Rust Belt.

    Digging further, there is something else going on here, particularly as it relates to the Rust Belt’s legacy asset of growing talent. To wit, other regions, like Portland, attract talent, but their educational ecosystems are less developed. The Rust Belt educates. It mines talent. Exports talent. For instance, according to the Chronicle of Higher Education, the top 10 states for out-of-state freshman enrollment reside in the Midwest (Pennsylvania is 1, Ohio is 7).

    Why does this matter? Because much like the industrial epoch before it, the innovation economy—to buy a term from Economist Enrico Moretti—is converging; that is, it is becoming less “spiky” and looking for leverage. Thus, the “rise of the rest”. From the Harvard Business Review:

    It goes without saying that no matter how much talent a company might have, there are many more talented people working outside its boundaries. Yet all too many companies focus solely on acquiring talent, on bringing talent inside the firm. Why not access talent wherever it resides?

    The overall lesson here is this: Rust Belt cities need to get over lamenting the Chicken Little-like strategy that is plugging the brain drain. Let your people go. Let them grow. Concentrate on the network.  The trend of jobs constricting its supply line to talent is likely to grow. Welcome to the “talent economy”.

    “Cool” Exhaustion

    Venture capitalist Brad Feld recently said, “The cities that have the most movement in and out of them are the most vibrant”. The statement speaks to the reality that Pittsburgh et al. won’t shrink their way to growth, as in-migration is needed. On that score, there’s some indication of Rust Belt demographic inflows, indicating changes of a mesofact shift.

    For example, people are returning to Pittsburgh, with a positive net migration for the past five years. In fact, U-Haul’s latest annual survey marks Pittsburgh as the top growth city in the U.S. There’s some movement back to Cleveland as well. My past research for the Urban Institute showed a net inflow of 25- to 34-year olds in the city’s downtown, as well as its surrounding inner-core neighborhoods. Other Cleveland neighborhoods and inner-ring suburbs are seeing a net inflow of young adults as well. Also, migration patterns from 2005 to 2010 flowed net positive to Cleveland’s Cuyahoga County from the “spiky” counties of Chicago’s Cook County and Brooklyn’s King County.

    Will the trend grow? Here, it’s necessary to infer why it is occurring, so as to emphasize the inherent competitive advantages Rust Belt cities have to offer.

    Part of the psychogeographic attraction that Cleveland and Pittsburgh have is the fact they are not Portland, Brooklyn, or any other variety of venerable hot spots engaging in an  arms race of mod. Industrial cities maintain distinct cultures comprised of unique histories that are manifested by both elegant and unpolished bones. In short, the Rust Belt is real places, with real people. Wrote a New York City cyclist and author on his recent trip entitled “It’s Monday, I’m Back, And Cleveland!”:

    Portlanders ride around on bespoke bicycles wearing artisanal fanny packs and eating kimchi quesadillas out of food trucks.  Clevelanders watch “The Deer Hunter” and eat rabbit and tubular meats while basking in the warm glow of their leg lamps…

    …Cleveland has its own unique take on the whole “artisanal” phenomenon.  For example, in Brooklyn people open stores where they only sell olive oil or mayonnaise, or where some Oberlin graduate will give you an old-timey shave with a straight razor and a leather strop for $75.  In Cleveland, this guy sits outside his shop making bats.


    Courtesy of Bike Snob NYC

    Rust Belt cities, then, got their own thing going on, something at variance with the universal creative class typology said to attract “young and the restless”. To engage in copycatting would be a tragedy for Cleveland and Pittsburgh to adopt—like re-branding a flower by eroding its scent.

    Joi Ito, the head of MIT’s Media Lab, agrees, saying city making is not about heavy-handed creative class endeavors, but about backing off, letting things emerge. But again, this requires city self-awareness, which, according to Ito, “has to do with the character of the city, the character of the people, the character of the mayor”. In other words, the answers for a city are inside of it. Not inside the idea of outside programming.

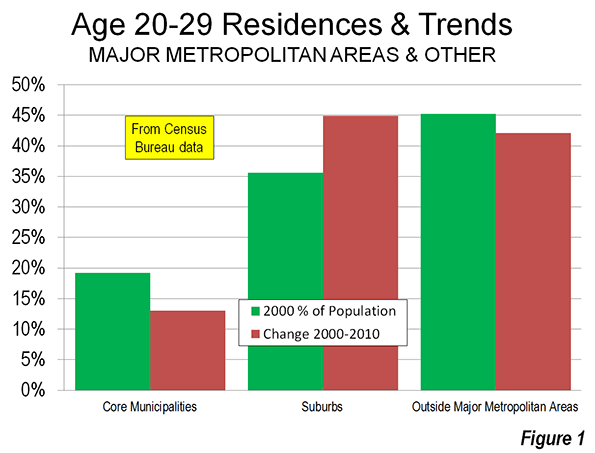
    And by being self-aware, Cleveland and Pittsburgh could position themselves as places for the “cool exhausted”, or places about community, affordability, and family. Places that contain good single-family housing stock. Places with coffee shops, taverns, and backyards. Places not prone to the dichotomy of micro-apartments v. McMansions but rather rest in a middle-grounding sweet spot that is projected to be attractive to the next generation of homebuyers. Says a newcomer to Pittsburgh from Brooklyn:

    Moving to Lawrenceville was one of the smartest things we’ve done.  It’s a visually, historically, and socially stimulating neighborhood with a stronger sense of community than I’ve experienced anywhere else.

    No doubt,  in-migration of all types is needed—i.e., Pittsburgh’s and Cleveland’s foreign-born rates are at historic lows— but the low-hanging fruit is Rust Belt refugees, or “boomerangers”, many Global City graduates. Russell, who has been examining the phenomenon for years, sees this variant of return migration as a potential game-changer for historically declining Rust Belt cities, particularly because it represents a counter flow to the donut hole-patterning of urban decline. “This is happening, and it’s on a scale much larger than expected,” Russell says. “We are busy catching up to a trend. The Rust Belt Chic migration is a particular form of return migration: Rust Belt suburb-to Big City-to grandpa’s neighborhood”.

    Economically speaking, such migrants pack a wallop, as the act of migration is primarily an entrepreneurial act. Such is illustrated in a recent New York Times piece called “Replanting the Rust Belt”. In it, they profile Cleveland chef Jonathan Sawyer who moved back home from New York to raise his family. Yet he was also determined “to help the city transcend its Rust Belt reputation”. Once there, Sawyer “foraged for people”, eventually setting up a local food ecosystem that “connects mushroom farms, bean gardens, Italian bakeries, Amish dairies, noodle makers, butchers and the basement and backyard of his own house”.

    Migrants like Sawyer are economic change agents. Pittsburgh and Cleveland need to scale them up, and then do everything they can to eliminate barriers so they can forage properly.

    Bowling with Strangers

    As the middle class re-enters and gentrifies inner city Rust Belt neighborhoods, consequences will arise. Still, desperate city leaders are happy with any trade-offs, as is evidenced by Detroit’s economic development czar George Jackson recent declaration that: “I’m sorry, but, I mean, bring it on [gentrification]. We can’t just be a poor city and prosper.”

    Such conceptions are common in government, institutionalized even. Notes Neil Smith:

    Gentrification became a systematic attempt to remake the central city, to take it back from the working class, from minorities, from homeless people, from immigrants…What began as a seemingly quaint rediscovery of the drama and edginess of the new urban “frontier” became in the 1990s broad-based market driven policy.

    It is widely understood gentrification does little to eliminate the systemic problems facing not only the Rust Belt, but most communities: that of segregation and inequality. There needs to be a prioritizing of the underlying neighborhood dynamics that offer both hope and challenges for a path forward. To that end, given the rapidity of demographic and housing change in the industrial Midwest—i.e., it’s “brokenness”—consider the Rust Belt as good a living “lab” as any.

    For instance, certain demographic shifts in various Rust Belt cities are going against longstanding patterns, particularly the organic evolution of mixed neighborhoods. The integration is coming from several angles, which is largely due to the “benefits” of a depressed housing market. For instance, in Ohio City, one of Cleveland’s gentrifying neighborhoods, the percentage of black residents increased from 24% of the population to 34% from 1990 to 2010, whereas the percentage of whites declined 58% to 50%. Given that Ohio City is one of the areas seeing an inflow of 25- to 34-year old residents, there appears to be  a meet-up of lower-to-middle-income black families that have migrated from the East Side of Cleveland with younger suburban and exurban whites. The same demographic patterns are occurring in other Cleveland neighborhoods such as Edgewater, Old Brooklyn, and Kamm’s Corners, as well numerous suburbs, suggesting a “shake-up” of social capital paradigms that have kept Cleveland not only geographically segregated, but psycho-sociologically segregated.

    “Social capital”, you say?

    Yes. Most often social capital is talked about in good terms only, a la Putnam’s seminal book Bowling Alone But as illustrated in the paper “Why the Garden Club Couldn’t Save Youngstown”, too much social capital kills. For example, too much trust in others like you can parallel not enough trust in others unlike you, leading  to immobility, insularity, and stagnation of ideas.  What is needed in Cleveland and Pittsburgh is less social capital, or more movement, more outsiders, and more crossing of such psychogeographic divides as the Cuyahoga River, which has served to divide the  city of Cleveland between the East and West Sides. These “shake-ups” that are occurring fosters the heterogeneity necessary to reverse Cleveland’s declining, patriarchal course.


    “My Hometown”. Courtesy of Plain Dealer

    But simple diversification of neighborhoods won’t do the trick. For instance, a white teen may go to a diverse high school but it doesn’t mean she will have black friends. This filtering along entrenched historical fault lines happens in neighborhoods as well. The scene in D.C.:

    Both groups [whites and blacks] feel entitled and resent the other’s sense of entitlement. Over time the neighborhood’s revitalization engineers a rigid caste system eerily reminiscent of pre-1965 America. You see it in bars, churches, restaurants and bookstores. You see it in the buildings people live in and where people do their shopping. In fact, other than public space, little is shared in the neighborhood. Not resources. Not opportunities. Not the kind of social capital that is vital for social mobility. Not even words.

    What is partly occurring here relates to a controversial finding of Putnam’s, or that diversity can decrease social capital—perhaps too much. “People living in ethnically diverse settings appear to ‘hunker down’”, writes Putnam, or “to pull in like a turtle”.

    Why?

    Part of the reason is that neighborhood diversity can equate to living “by” each other and not “with” each other. As such, neighborhood integration is still raw in the American zeitgeist, with heterogeneity, according to Putnam, engendering mistrust and too little social capital. A next step is needed. Here, community leaders should heed lessons from the concept of creative destruction. From the article “The Downside of Diversity”:

    If…diversity, at least in the short run, is a liability for social connectedness, a parallel line of emerging research suggests it can be a big asset when it comes to driving productivity and innovation…

    … In other words, those in more diverse communities may do more bowling alone, but the creative tensions unleashed by those differences in the workplace may vault those same places to the cutting edge of the economy and of creative culture.

    This, then, represents a key opportunity for Cleveland and Pittsburgh to reconstitute a new American neighborhood model by harnessing the potential inherent in its integrating neighborhoods. This opportunity is perhaps greater in Rust Belt communities given—as of yet—the absence of housing market pressure that tends to filter people along similar demographic lines. The mission is simple: how can cities foster mobility without a complete sacrifice of trust? This entails thinking about social capital in a new way: neither a presence nor absence of it, but a continuum of social capital with insularity based on comfortability on one end, and insularity based on mistrust on the other. The sweet spot of social capital is somewhere in the middle, which entails not bowling with your buddies or bowling alone, but bowling with strangers—until they no longer aren’t.

    Why is this so important?

    Where people live informs them no less than where they go to school. Neighborhoods are factories of human capital. America needs to go past the gentrification model of revitalization. The cities that still have a fighting chance, like in the Rust Belt, should lead.

    Richey Piiparinen is a writer and policy researcher based in Cleveland. He is co-editor of Rust Belt Chic: The Cleveland Anthology. Read more from him at his blog and at Rust Belt Chic.

    Lead photo courtesy of Spicy Biscotti.

  • Poverty and Growth: Retro-Urbanists Cling to the Myth of Suburban Decline

    In the wake of the post-2008 housing bust, suburbia has become associated with many of the same ills long associated with cities, as our urban-based press corps and cultural elite cheerfully sneer at each new sign of decline. This conceit was revealed most recently in a a studyreleased Monday by the Brookings Institution–which has become something of a Vatican for anti-suburban theology–trumpeting the news that there are now 1 million more poor people in America’s suburbs than in its cities.

    America’s suburbs, noted one British journalist, are becoming “ghost towns” as middle-class former suburbanites migrate to the central core. That’s simply untrue: both the 2010 Census and other more recent analyses demonstrate that America is becoming steadily more suburban: 44 million Americans live in America’s 51 major metropolitan areas, while nearly 122 million Americans live in their suburbs. In other words, nearly three quarters of metropolitan Americans live in suburbs, not core cities.

    The main reason there are now more poor people in the suburbs is that there are now many more people in the suburbs, which have represented almost all of America’s net population growth in recent years. Despite trite talk about “suburban ghettos,” suburbs have a poverty rate roughly half that of urban centers (20.9 percent in core compared to 11.4 percent in the suburbs as of 2010).

    To be sure, poverty in suburbs, or anywhere else, must be addressed. But not long ago, suburbs were widely criticized for being homogeneous; now they are mocked for having many of the problems associated with being “inclusive.”

    Many poor suburbs are developing because minorities and working-class populations are moving to suburbs. Yet even accounting for these shifts, cities continue to contain pockets of wealth and gentrification that give way to swathes of poverty. In Brooklyn, it’s a short walk east from designer shoe stores and locavore eateries to vast stretches of slumscape. The sad fact is that in American cities, poor people—not hipsters or yuppies—constitute the fastest-growing population. In the core cities of the 51 metropolitan areas, 81 percent of the population increase over the past decade was under the poverty line, compared to 32 percent of the suburban population increase.

    In Chicago, oft cited as an exemplar of “the great inversion” of affluence from suburbs to cities, the city poverty rate stands at 22.5 percent, compared to 10 percent in the suburbs. In New York, roughly 20 percent of the city population lives in poverty, compared to only 9 percent in the suburbs.

    Looking at it from a national perspective, most of the major metropolitan counties with the highest rates of poverty are all urban core, starting with the Bronx, with 30 percent of people living under the poverty line, followed by Orleans Parish (New Orleans), Philadelphia, St. Louis, and Richmond, Va. In contrast all 10 large counties with the lowest poverty rates are all suburban.

    This divergence has an impact on other measurements of social health. Despite substantial improvement in crime rates in “core cities” over the past two decades, suburban areas generally have substantially lower crime rates, according to Brookings Institution’s own research. Yet at the same time suburban burgs dominate the list of safest cities over 100,000 led by Irvine and Temecula, Calif., followed by Cary, N.C. Overall suburban crime remains far lower than that in core cities.

    A review of 2011 crime data, as reported by the FBI, indicates that the violent-crime rate in the core cities of major metropolitan areas was approximately 3.4 times that of the suburbs. (The data covers 47 of the 51 metropolitan areas with more than 1 million population, with data not being available for Chicago, Las Vegas, Minneapolis-St. Paul, and Providence.)

    In the least suburbanized core cities, that is places that have annexed little or no territory since before World War II (New York, Philadelphia, Washington, etc.) the violent crime rate was 4.3 times the suburban rate. Among the 24 metropolitan areas that had strong central cities at the beginning of World War II but which have significant amounts of postwar suburban territory (Portland, Seattle, Milwaukee, Los Angeles, etc.), the violent crime rate is 3.1 times the suburban rate. Among the metropolitan areas that did not have strong pre–World War II core cities (San Jose, Austin, Phoenix, etc.), the violent crime rate was 2.2 times the suburban rate. Basically, the more suburban the metropolis, the lower the crime rate.  
    Rather than castigating suburbs for exaggerated dysfunction, retro-urbanists would be much better served focusing on how to correct and confront the issue of poverty, which continues to concentrate heavily in the urban core and elsewhere in America.

    Joel Kotkin is executive editor of NewGeography.com and a distinguished presidential fellow in urban futures at Chapman University, and a member of the editorial board of the Orange County Register. He is author of The City: A Global History and The Next Hundred Million: America in 2050. His most recent study, The Rise of Postfamilialism, has been widely discussed and distributed internationally. He lives in Los Angeles, CA.

    Wendell Cox is a Visiting Professor, Conservatoire National des Arts et Metiers, Paris and the author of “War on the Dream: How Anti-Sprawl Policy Threatens the Quality of Life.

    This piece originally appeared in the The Daily Beast.

    Suburban neighborhood photo by Bigstock.

  • Religious Freedom Lures Many to U.S. from Asia

    It’s been two decades since California Gov. Pete Wilson used grainy ads of undocumented immigrants – “They keep coming” – as an effective means of stoking fear of newcomers and assuring his re-election. Yet, increasingly America’s immigration realities are moving far beyond the mojado paradigm of the 1990s in ways that challenges the stereotypes of both conservatives and progressives.

    This discussion of the undocumented, and about the relative benefits of accepting millions of poor, often modestly educated newcomers, has sharply divided the Left and Right. But this often-polarized debate largely has missed the changing nature of immigration and its potential long-term impact on our national future.

    The biggest shift in immigration lies in primary motivation. Traditionally, most immigrants came primarily for economic reasons. Poor people in Mexican or Central American villages saw a better life in the United States and, unlikely to do so legally, chose to make the crossing, anyway. Legal immigrants from further away, including many with educations, such as from Asia, the Middle East and Africa, also came to reap financial opportunities that their still-developing economies could not provide.

    Today these economic motivations are losing their primacy, both for documented and undocumented workers. Many of the economies from which immigrants once fled – including Mexico, Korea, India, Taiwan and China – are now arguably doing better than the U.S. economy. A machinist from Monterrey, a technician from Taipei, or a biologist from Bangalore can find ample, and even greater, opportunities at home than here.

    Most important have been changes with Mexico, from where most undocumented immigrants have come. A survey from the Pew Hispanic Center notes that, during 2005-10, about 1.4 million Mexicans immigrated to the U.S. – exactly the same number of Mexican immigrants and their U.S.-born children who moved back, or were deported, home.

    This trend is likely to continue. Brighter economic prospects south of the border, a rapidly declining birth rate and lack of good jobs for the modestly skilled do much to explain the plunge in Mexican immigration. The “back to Mexico” numbers could even grow since many Mexicans immigrants here – roughly two-thirds of legal residents – have chosen not to become American citizens.

    ‘Lifestyle’ migration

    Now we see a shift both in the primary motivation and geography of immigration. Increasingly, immigrants are coming less out of economic distress and more as a result of what may be called “lifestyle” migration. This may be particularly applicable to the largest source of immigration, Asia. Opportunity, notes a recent Pew study, remains a key lure but freedom to express political views and a better environment to raise children was cited by more than three in five as reasons for coming here.

    Asia has become much richer in the past few decades, but many people find conditions there less than satisfactory. In a place like Beijing, Shanghai and Singapore, even the highest levels of wealth and “success” cannot buy you the comfort and privacy of single-family home. In China, even a billionaire can’t breathe clean air, drink the tap water or easily access quality public education.

    Recent immigrants to places like such as Irvine or Eastvale, a newly minted suburb just outside Ontario, California, will tell you that the “quality of life” here is simply unavailable in their home country, at virtually any price. This quality-of-life migration is particularly evident in California, where twice as many new immigrants now come from Asia than from Latin America. Even the New York Times admits they are not coming here to duplicate the high-density environment of Mumbai or Shanghai, but to indulge “the new suburban dream.”

    Religious freedom

    Of course, some immigrants still come for venerable reasons, such as the freedom to worship. Christians, who make up some 42 percent of Asian-Americans, face surveillance and repression, particularly, in China, where religion is tightly regulated, and dissent from the party line can land adherents in jail. Over half of Asian immigrants, Pew notes, cite freedom of religion as a key advantage of living in America. New faith-based migration could also be seen soon among Christians fleeing increasingly Islamic regimes in Egypt, Syria and other Middle Eastern countries.

    And then there’s the related issue of legality. In China, in particular, property ownership is never secure from state confiscation. This, in part, accounts for a rise in immigrant investors, not only to the United States but to such bastions of legality as Canada and Australia. Lack of faith in the long-term political stability is also driving a growing group of Chinese professionals to emigrate.

    “Chinese come from a country where it isn’t infrequent that government takes land for redevelopment with little concerns for the American notions of due process,” Realtor Tommy Bozarjian of Aslan Properties told Chapman University researcher Grace Kim. “Vietnamese come from a country where they had to gather what little they had into pillow cases and makeshift bags” before boarding helicopters and boats in efforts to escape the communist regime.

    Overall, this new immigration is far more promising than that portrayed in Pete Wilson’s grainy videos. An influx of young families, seeking to establish a better way of life for the children, represent something of an elixir for a sagging economy. Asians, the fastest-growing group, outperform other racial groups across a broad array of measurements, notably education and income.

    Higher entrepreneurship rates among immigrants are providing a bright spot in an otherwise-sagging start-up economy. The immigrant share of all new businesses, notes the Kauffman Foundation, more than doubled, from 13.4 percent in 1996 to 29.5 percent in 2010.

    But not all the positives pertain at the higher end. Clearly, the country will also need some lower-skilled workers, particularly in agriculture, who work in circumstances few Americans would embrace. More important still, immigrants may be necessary for addressing a looming shortage of skilled technicians, such as process engineers, machinists, mold-makers, which are, in part, a result of our still-neglected high school vocational training programs, trade schools and junior colleges.

    Less-in-demand jobs

    At the same time, there may be less need to encourage the migration of workers in hospitality, retail and other entry-level industries when many native-born and naturalized residents still struggle for employment. College graduates, in particular, are increasingly turning to these professions since the number of opportunities for all but the most credentialed, and gifted, seem rather limited. More than 43 percent of recent graduates now working, according to a recent report by the Heldrich Center for Workforce Development, are at jobs that don’t require a college education.

    This dynamic may even be applied to some higher-skilled professions. Silicon Valley executives, such as Facebook’s Mark Zuckerberg, insist we need to import large quantities of tech workers. He’s even backed a faux conservative group to push his agenda within the GOP. Yet, there is growing evidence, as recently revealed in a study by left-of-center Economic Policy Institute, that the country’s much-ballyhooed shortage of STEM (science-technology-engineering-mathematics-related) workers may be vastly exaggerated.

    If EPI’s analysis is accurate, importing vast numbers of young code-writers – what in the Silicon Valley has been sometimes referred to as “techno-coolies” – may result in lowering the price of labor and allow the Silicon Valley elite to not address issues such as inflated housing costs that keep older, American-born workers out of the Valley’s labor pool.

    These are the kind of issues Washington should focus on as politicians look to reshape our immigration laws. So, too, are policies that encourage the immigration of families likely to stay and put down roots long-term here in the United States. As an immigrant country, we do not want to duplicate the dependence on transitory workers associated with places like Dubai, Singapore and large parts of Europe.

    Overall, the newer wave of “lifestyle” immigrants seems a net plus, but legislators should take care to recognize that even the most obvious windfall could have negative unintended impacts on Americans and our economy. Rather than simply a politically motivated rush to judgment, or replaying the immigration wars of the past, we need to pay more attention to the emerging realities of this new wave and devise a policy that best serves the long-term interests of the nation in the decades ahead.

    Joel Kotkin is executive editor of NewGeography.com and a distinguished presidential fellow in urban futures at Chapman University, and a member of the editorial board of the Orange County Register. He is author of The City: A Global History and The Next Hundred Million: America in 2050. His most recent study, The Rise of Postfamilialism, has been widely discussed and distributed internationally. He lives in Los Angeles, CA.

    This piece originally appeared in the Orange County Register.

    Photo “asian american” by flicker user centinel.

  • The Evolving Urban Form: Toronto

    Toronto is the largest city (metropolitan area) in Canada and its principal commercial center. However, this is a relatively recent development. Toronto displaced Montréal is Canada’s largest city during the 1960s. Since the 1971 census, when the two Metropolitan areas were nearly identical size, Toronto has added approximately 3 million people, while Montréal has added approximately 1,000,000 (Figure 1).

    This shift is exceptional within the high-income world over the past half century.  Toronto’s ascendancy was in large part precipitated by the move by Québec, in which Montréal is the largest city, to assert the primacy of the French language even though much of the Montréal business community was Anglophone. Many of these businesses, and some of their employees, decamped to Toronto.

    Metropolitan, Suburban and Core Population Growth: 1931-2011

    Toronto has grown very rapidly. In 1931, the metropolitan area had little more than 800,000 residents. About 80% of these (630,000) lived in the former city of Toronto. Since that time, nearly all of the growth in the Toronto metropolitan area has been in the suburbs (Figure 2). The area of the former city of Toronto (abolished in 1998 as a part of a six jurisdiction amalgamation, see Note on the Toronto Amalgamation) has added little more than 100,000 residents while the suburban areas have added approximately 4.7 million. By 2011, the metropolitan area had grown to a population of 5.5 million (Figure 3).


    In recent decades, Toronto has been among the fastest-growing larger metropolitan areas in the high income world.

    The Larger Region: The Golden Horseshoe

    The Toronto metropolitan area is at the core of a much larger region of urbanization that is referred to as the Golden Horseshoe. The Golden Horseshoe stretches in the shape of a horseshoe from the US border at Niagara Falls (St. Catharine’s metropolitan area) through the Hamilton metropolitan area to Toronto and on to the Oshawa and Peterborough metropolitan areas to the east. The Golden Horseshoe (which can be defined in various ways), also includes the Kitchener, Brantford, Guelph, and Barrie metropolitan areas.

    Overall the Golden Horseshoe registered a population of approximately 8.1 million in the 2011 census. Approximately 9% of the population lives in the former city of Toronto, 3% in the inner core federal electoral districts of Toronto – Centre and Trinity – Spadina and another 6% in the balance of the former city. Approximately 91% of the population is in the rest of the Golden Horseshoe (Figure 5).
    Like many other metropolitan areas, Toronto’s core has experienced a resurgence. Between 2006 and 2011, the inner core two districts added 16.2% to their population (Figure 6). This was a much stronger increase than occurred in the federal electoral districts that roughly correspond to the balance of the former city of Toronto, which grew 1.8%. The inner suburbs grew somewhat more strongly, at 4.2%. This rate of growth, barely one-quarter that of the inner core districts, was a more than 1.5 times the actual population increase of the inner core districts.


    The outer suburbs within the metropolitan area grew 13.7%. While the outer suburban growth rate was less than that of the inner core districts, the actual population increase was more than nine times as great. The balance of the Golden Horseshoe grew 4.7%, slightly more than the inner suburbs.

    Between 2006 and 2011 the overwhelming majority – 92 percent – of population growth was outside the core roughly corresponding to the former city of Toronto. This is less than the percentage of the total population represented by the inner core in the 2006 census. This is similar to the dynamics of metropolitan population growth in the United States, where inner core districts dominated central city growth, but produce little or none of the overall growth because of the stagnant or declining populations in the areas immediately outside the inner core.

    The Urban Area

    The Toronto urban area (called “population centre” by Statistics Canada) had a population of approximately 5.1 million according to the 2011 census. With a land area of 675 square miles (1,750 square kilometers), Toronto’s population density is 7,590 per square mile (2,930 per square kilometer). Toronto is the only major urban area in the New World (Australia, Canada, New Zealand and the United States) that is more dense than Los Angeles, which had 7,000 residents per square mile (2,700 per square kilometer), according to the 2010 census (Note on extended urban areas).

    Canada’s Largest Employment Center

    It is not surprising that Canada’s largest employment center should be in its largest metropolitan area. Surprisingly it is not downtown Toronto, but rather the Pearson International Airport area, which is shared between the municipalities of Mississauga, Brampton, and Toronto that is the top job center. This large area covers approximately 45 square miles (120 square kilometers), an area as large as either the municipalities of Vancouver or San Francisco. The center is largely made up of low rise transportation and distribution facilities that stretched far from the airport itself. Overall, the Pearson International Airport center has an employment level of more than 350,000.

    In contrast  downtown Toronto has  approximately 325,000 jobs crammed into  an area of 2.3 square miles (6 square kilometers). This highly concentrated area is, however, the focal point of transit’s largest commuting market in Canada.

    The contrast between these two employment markets vividly illustrates the substantial strengths of transit in serving highly concentrated employment centers, like downtown Toronto, and its virtual inability to provide automobile competitive service in more highly dispersed employment centers (see Note on Transit and Employment Concentration)

    Overall, only 13 percent of the employment in the metropolitan area (as opposed to the Golden Horseshoe) is in downtown Toronto.

    As Goes Toronto, So Goes Canada

    Toronto and the Golden Horseshoe are particularly important to Canada. The Golden Horseshoe has more than one quarter of Canada’s population. This is an unusually high proportion of a nation’s population for one highly urbanized region and boasts an even larger share of its economic output. By comparison, the largest metropolitan region in the United States, New York, represents barely 7% of the nation’s population. In many ways, Canada’s prosperity, which has been impressive in recent years, depends on the success of Toronto and the Golden Horseshoe.

    See Also: A Toronto Condo Bubble?

    ————–

    Note on the Toronto Amalgamation: The former city of Toronto and five other municipal jurisdictions were amalgamated under an act of the Ontario government in 1998. The amalgamation was promoted by the government on efficiency grounds, claiming that hundreds of millions annually would be saved. I was hired by the former city to assist it in an effort to defeat the amalgamation proposal. Our side argued that the cost savings would not occur because of the necessity of harmonizing (the leveling up) labor costs and service levels. Despite advisory referendums that receive a minimum of a 70% no vote, the amalgamation went forward.

    The amalgamation is still a controversial subject. The financial argument appears to have been resolved in the favor of the position of the former city. A major Toronto business organization, the Toronto City Summit Alliance reported “The amalgamation of the City of Toronto has not produced the overall cost savings that were projected. Although there have been savings from staff reductions, the harmonization of wages and service levels has resulted in higher costs for the new City. We will all continue to feel these higher costs in the future.” My commentary  in the National Post on the tenth anniversary of the amalgamation summarized the experience.

    In a spirited debate in 2001 at Ryerson University, in downtown Toronto with a former Toronto transit commission official, my opponent and I agreed on one issue, that the amalgamation of Toronto had been a mistake.

    Note on Extended Urban Areas: In fact, the continuous urbanization of Toronto extends further, to the west into the Hamilton metropolitan area and to the east into the Oshawa metropolitan area. If these areas are combined into a single urban area, the population density falls to 7000 per square mile (2,700 per square kilometer). Even with this extension, Toronto would be more dense than an extended Los Angeles urban area (extending to include Mission Viejo and the western Inland Empire, at 6,200 per square mile or 2,400 per square kilometer (These larger urban area definitions are used in Demographia World Urban Areas)).

    Note on Transit and Employment Concentration: It is virtually impossible for employees throughout the metropolitan area to reach the airport area on transit that is time-competitive with the automobile. This disadvantage is not easily solved. If grade-separated rapid transit lines (such as a subway or busway) were built to the area, only a small percentage of the jobs would be within walking distance (within one quarter mile or 400 metres). Walks of up to 5 miles (8 kilometers) could be necessary from stations to employment locations.  This compares with the virtually 100 per cent of downtown jobs that are accessible by walking from subway and commuter rail (Go Transit) stations (See Improving the Competitiveness of Metropolitan Areas)

    Wendell Cox is a Visiting Professor, Conservatoire National des Arts et Metiers, Paris and the author of “War on the Dream: How Anti-Sprawl Policy Threatens the Quality of Life.

    Photograph: Google Earth Image of the Pearson Airport employment area (Canada’s largest employment area)