Category: Urban Issues

  • US Suburbs Approaching Jobs-Housing Balance

    Suburban areas in the US metropolitan areas with more than 1 million total regional population, once largely seen as bedroom communities, are nearing parity between jobs and resident employees. The jobs housing balance, which measures the number of jobs per resident employee in a geographical area has reached 0.89 (jobs per resident workers) in these 51 major metropolitan areas, according to data in the 2011 one-year American Community Survey. This is well below the 1.39 ratio of jobs to resident employees in the historical core municipalities (Figure 1).

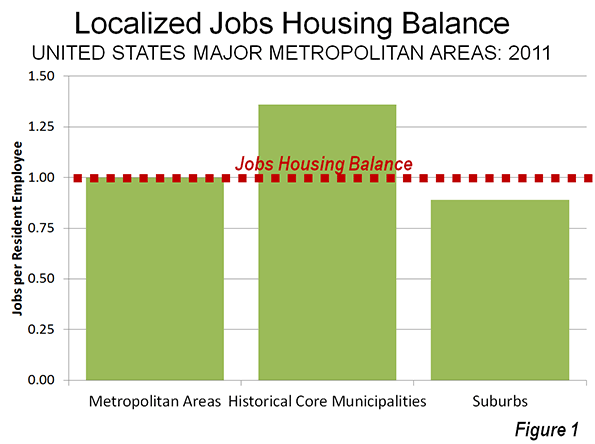
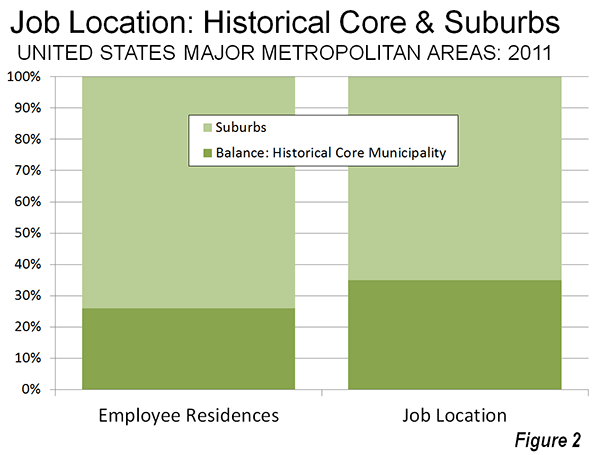
    The historical core municipalities still have a larger share of metropolitan employment than they have of resident workers. However, 65 percent of major metropolitan area jobs are now in the suburbs, where 74 percent of workers live (Figure 2). The 0.89 jobs housing balance index indicates that there are only 11 percent fewer jobs in the suburbs than resident workers. Overall, the jobs housing balance of metropolitan areas (a synonym for labor markets) is at or near 1.00.

    From Monocentric to Polycentric to Dispersed Cities
    The data indicates the extent to which the classical monocentric city has been left behind by the evolution of the modern metropolitan area. Before the near universal extension of automobile ownership, cities were necessarily much more monocentric. Transit lines tended to converge on downtown, which made downtowns far more dominant in their share of metropolitan employment than they are today.

    For example, in 1926, according to historian Robert M. Fogelson writing in Downtown: Its Rise and Fall: 1880-1950, in 1926 41 percent of Los Angeles residents went to downtown every day, a figure that had dropped to 15 percent by 1953, principally for work and shopping. Today, in a much larger metropolitan area that also includes Orange County, 3 to 5 percent of jobs are located downtown (depending on the geographical definition). The area not only lost a significant share of metropolitan employment, but saw its share of retail sales drop as regional shopping centers were built throughout the area. Similar trends occurred in virtually every metropolitan area of the United States.

    All of this occured as the automobile facilitated access to virtually everywhere in the metropolitan area, not just downtown.

    The emerging polycentricity of the city long was obvious to many analysts, but it was Joel Garreau who brought the issue to popular attention in his classic Edge City: Life on the New Frontier. Garreau documented the development of large suburban employment centers throughout the major metropolitan areas and provided a list. Later, Robert Lang of the University of Nevada Las Vegas took the issue further in his Edgeless Cities: Exploring the Elusive Metropolis, which examined office space outside downtown areas and edge cities in 1999. Gross office space was greatest outside both the downtowns and edge cities, according to Lang’s data (Note 1).

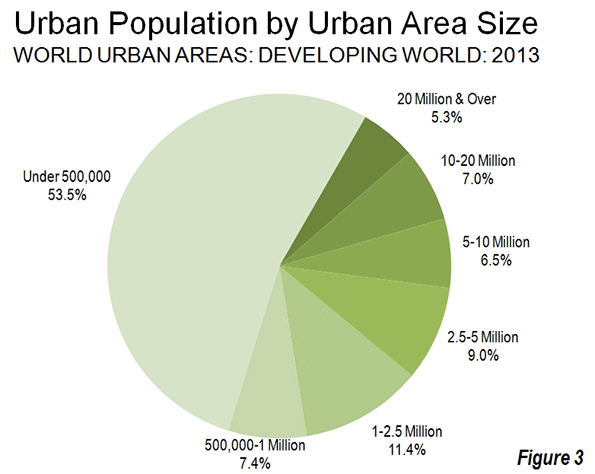
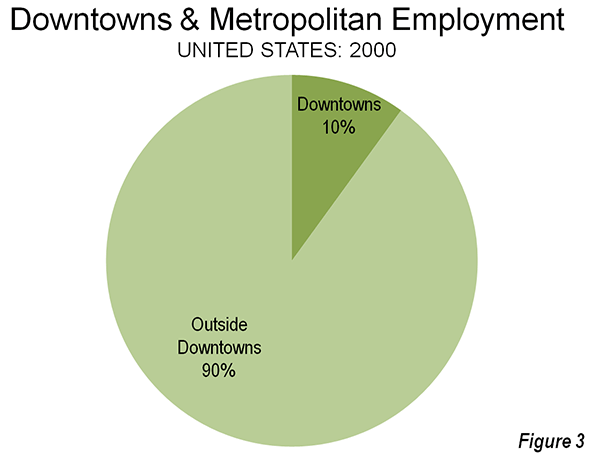
    Lang’s analysis is limited to office space, which is more concentrated in downtown areas than employment. On average, 2000 data indicates that downtown areas had approximately 10 percent of employment, well below downtown’s 36 percent share of office space (Figure 3).

    Even so, there remains a misconception today that cities remain monocentric. Yet as the figures show we are progressing toward a distribution of jobs that nearly matches its distribution of housing, with the exception of downtown (where there is the greatest imbalance, see below).

    Historical Core Municipalities: Where the Jobs-Housing Imbalance is the Greatest

    The excess of jobs in relation to residential workers is greatest in the historical core municipalities. It is driven by the downtown areas (central business districts or CBDs), which have by far the highest employment densities in the metropolitan areas. For example, in 2000, the downtown areas of the nation’s 50 largest urban areas had an average job density 92,000 per square mile. This is approximately 70 times the average non-downtown urban area employment densities (1,300 per square mile). Downtown residential densities, if they were readily available, would doubtless be a small fraction of the downtown employment figures.

    Largest Historical Core Municipality Jobs-Housing Imbalances

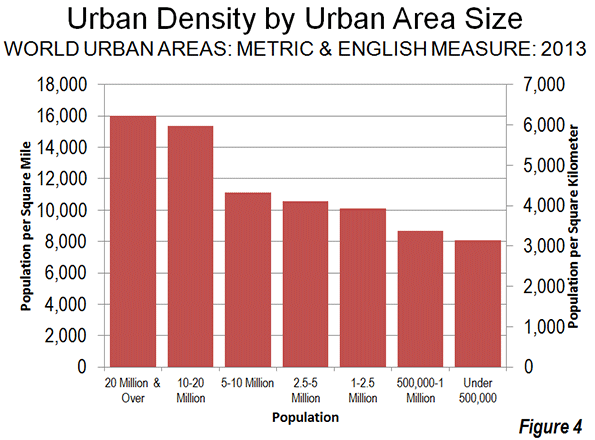
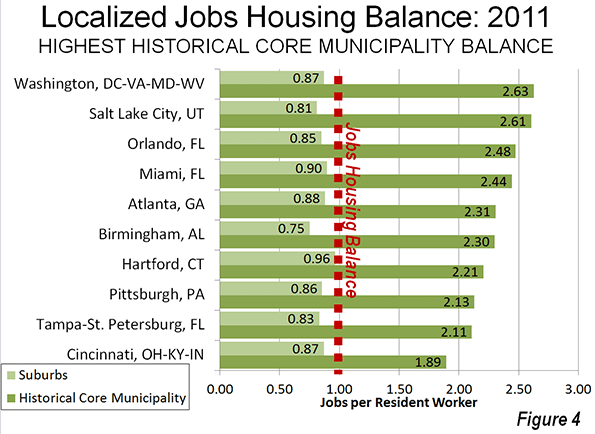
    The imbalance between jobs and housing is highest among the historical core municipalities of Washington (2.63), Salt Lake City (2.61), Orlando (2.48), Miami (2.44) and Atlanta (2.31). Yet, these large historical core municipality imbalances co-exist with generally near average suburban jobs housing balances. For example, in Washington there are 0.87 jobs per resident worker in the suburbs, or only 13 percent fewer jobs than workers who reside in the suburbs. In the other four metropolitan areas, the suburban jobs housing balance is above 0.80 (Figure 4).

    Smallest Historical Core Municipality Jobs-Housing Imbalances

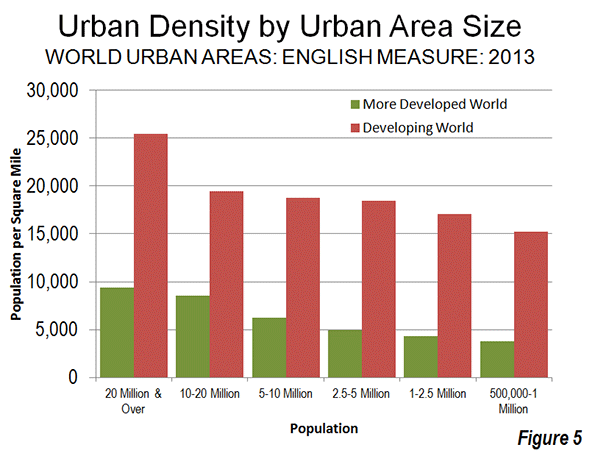
    The smallest historical core municipality jobs housing imbalance is in San Jose (0.84), which is the only major metropolitan area in which has fewer jobs than resident workers (Figure 5). However, the municipality of San Jose is a "Post War Suburban" core municipality, having experienced virtually all of its growth since 1940. This is despite the fact that San Jose’s corresponding urban area is the third most dense (following Los Angeles and San Francisco). Generally higher suburban housing densities were built in San Jose compared to less dense urban areas – which extend over vast distances – such as New York, Philadelphia and Boston. San Jose is also the only metropolitan area in which there are more suburban jobs than suburban resident workers (1.41 jobs per worker).

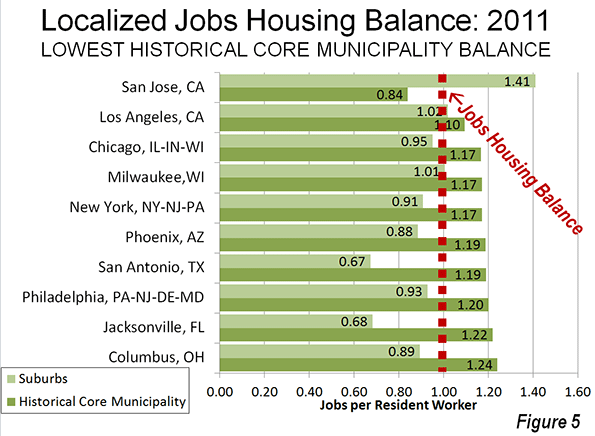
    The other historical core municipalities with the least imbalance between employment and resident workers are Los Angeles (1.10), Chicago (1.17), Milwaukee (1.17) and New York (1.17). The surprising inclusion of New York is discussed below.

    Each of the historical core municipalities with the fewest jobs per resident worker has a higher than average jobs housing balance in its suburban areas. Los Angeles has 1.02 jobs per suburban resident worker, principally the result of importing workers from the adjacent Riverside-San Bernardino metropolitan area. Milwaukee also has more suburban jobs than suburban resident workers (1.01).

    New York

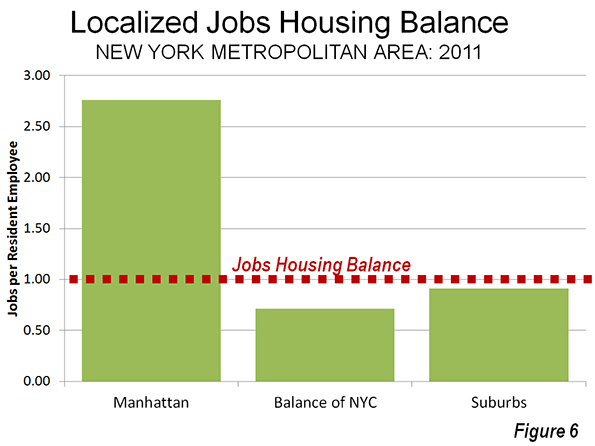
    New York has the second largest central business district in the world, following Tokyo. It therefore seems odd that the municipality of New York should have such a low ratio of jobs per resident worker. The borough of Manhattan, where the central business district is located, has 2.76 jobs per resident workers, higher than that of top ranked Washington, DC (above). There are 1,450,000 more jobs than resident workers in Manhattan.

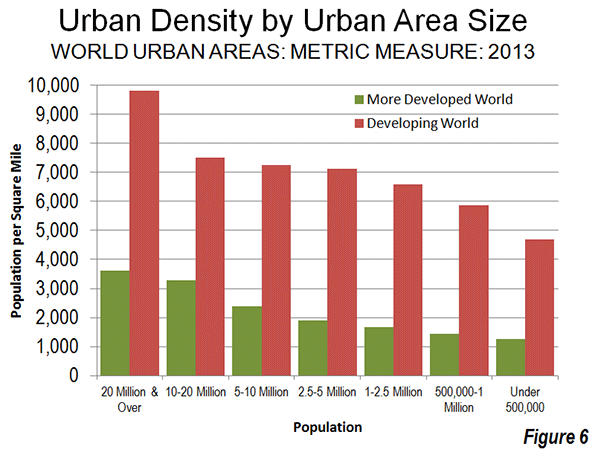
    New York’s low ratio is the result of a huge shortage of jobs relative to workers the outer boroughs (the Bronx, Brooklyn, Queens and Staten Island). There are 830,000 fewer jobs than resident workers in the four outer boroughs. Their ratio of jobs per resident, at 0.71 is lower than all but five suburban areas in the other 50 major metropolitan areas (Figure 6).

    The suburbs of New York, ironically, are more job-rich than the outer boroughs. They boast an 0.91 jobs per resident worker, ranking 17th out of the 51 metropolitan areas.

    The New Normal

    The former assumption that "everyone works downtown" is a thing of the past. Dispersion of jobs throughout the metropolitan area has become the rule. The "old normal" was that of the bedroom community – people living in the suburbs and working in the core cities. The "new normal" is about downtown and the core city. To the extent that there is a distortion in the jobs housing balance throughout the modern metropolitan area, it is the result of a larger number of jobs than residents in the core cities (and especially downtown).

    Wendell Cox is a Visiting Professor, Conservatoire National des Arts et Metiers, Paris and the author of “War on the Dream: How Anti-Sprawl Policy Threatens the Quality of Life.

    ———————-

    Photo: Houston downtown (to the left), edge city (Texas Medical Center in the middle) and dispersed employment (rest of photo). Photo by author.

    Note 1: The total office space outside the primary downtowns, secondary downtowns and edge cities was 37.0 percent in reviewed 13 metropolitan areas. Primary downtowns accounted for 36.5 percent, secondary downtown for 6.5 percent and edge cities for 19.8 percent (this analysis classifies Beverly Hills, Mid-Wilshire and Santa Monica in Los Angeles  as secondary downtowns, rather than as primary as in the book. See tables 4-2 and 4-10).

    Note 2: The historical core municipalities are the largest municipalities in each metropolitan area, with the following exceptions.
    (a) Oakland and St. Paul are also historical core municipalities.
    (b) Norfolk is the historical core municipality in the Virginia Beach metropolitan area.
    (c) San Bernardino is the historical core municipality in Riverside San Bernardino
    (see Classification of Historical Core Municipalities)

  • Density Boondoggles

    Is it density or migration? Venture capitalist Brad Feld weighs in:

    The cities that have the most movement in and out of them are the most vibrant.

    The densest city in the world won’t be as vibrant as the city with the most talent churn. Yet planners and urbanists tout the former over the latter. We’ve reached the point of density for the sake of density. It is an end instead of a means to an end. The art of the density boondoggle:

    The following is the conversation held at every regional summit on Long Island:

    Advocate: Let’s keep our young people from leaving! There’s a…brain drain!

    Public: How do we stop it?

    Developer: Build denser housing! Let’s make it…affordable! Walkable! Let’s make it…mixed-use sustainable smart growth…with a downtown, pedestrian-friendly feel.

    Municipality: Development approved!

    What’s the question? Greater density is the answer. It will plug the brain drain. I promise. But plugging the brain drain will reduce talent churn. Long Island will be less vibrant.

    There is a name for the Cult of Density. It now has its very own -ism. All hail Vancouverism:

    Vancouverism is, at the root, a movement to go from low density, to higher density, to make Canadian and North American cities about people once again.

    Making cities all about people sounds great. All I hear is the chant of the Underpants Gnomes:

    Phase 1: Create a cool city.
    Phase 2: ?
    Phase 3: Retain talent.

    That will be $500,000. Thank you for your patronage, Memphis. Consulting is fun!

    Development approved. That’s the story line playing out in downtown Las Vegas with Zappos. Density is king. Don’t listen to Brad Feld. Talent churn doesn’t matter.

    If Vancouverism were harmless, then I wouldn’t blog about it. The misplaced emphasis on density has negative impacts. Vancouver is more about people, those who are young, single and college-educated:

    ‘Revitalizing,’ but leaving seniors behind

    Last July, Vancouver city council unanimously approved a three-year Chinatown Neighbourhood Plan and Economic Revitalization Strategy. More than a decade in the making, the plan focused on economic revitalization, after two-thirds of businesses surveyed in Vancouver’s original Chinatown reported declining revenues between 2008 and 2011 — blamed mainly on losses to newer Chinese-language communities in suburbs like Richmond.

    The revitalization plan envisions new residential development, "to connect with younger generations and reach out to people of all backgrounds to ensure Chinatown is increasingly relevant to a more multi-cultural Vancouver." At the same time, it acknowledged that in a neighborhood where 67 per cent of households are low-income — more than twice the City of Vancouver average — such redevelopment "can displace low-income residents." What is good for old Chinatown’s businesses, in short, may be less so for its poor and isolated elderly.

    S.U.C.C.E.S.S., Vancouver’s primary provider of culturally- and linguistically-supportive housing and services for Chinese seniors, is providing a partial answer. It operates a single multi-level care facility in old Chinatown for people with cognitive impairments or who require round-the-clock nursing. But its 103 beds, soon to be 113, are about one-tenth of what the UBC Centre for Urban Economics anticipates will be needed over the next 15 years to house Chinese seniors.

    Meanwhile, the support it offers seem a world away from Rosesari and her neighbours living in privately operated SROs like the May Wah Hotel. Yet the women are spirited and resilient. "I’m happy and I’m healthy," Rosesari told me through Pang’s interpretation. Both she and Lin say they like living in Chinatown. They feel at home here, where the language spoken is the one they know.

    They are also in their 90s. As time goes on, they and others may no longer be able to manage the May Wah’s staircases, its lack of mobility aids, and its communal bathing facilities. The alternatives available to them then are in terribly short supply.

    Welcome to the dark side of the obsession with wants and needs of the Creative Class. Vancouverism is boutique urbanism, catering to a specific demographic at the exclusion of all others. People are either displaced or fall into the cracks. Bike lanes and food trucks trump the needs of seniors.

    Jim Russell is a talent geographer with particular interest in the Rust Belt. Read his blog at Burgh Diaspora, where this piece originally appeared.

    Downtown Vancouver photo by runningclouds

  • The World’s Fastest-Growing Megacities

    The modern megacity may have been largely an invention of the West, but it’s increasingly to be found largely in the East. The seven largest megacities (defined as areas of continuous urban development of over 10 million people) are located in Asia, based on a roundup of the latest population data released last month by Wendell Cox’s Demographia. The largest megacity remains the Tokyo-Yokohama area, home to 37 million, followed by the Indonesian capital of Jakarta, Seoul-Incheon, Delhi, Shanghai and Manila.

    With roughly 20 million inhabitants, the New York metro area, the world’s largest urban agglomeration from early in the 20th century till Tokyo surpassed it in the 1950s, ranks eighth. The only other western urban areas among the 28 biggest megacities now are Moscow (15th), Los Angeles (17th), and Paris (28th). London, which was the first modern city of a million people, is not on the list at all, with expansion long ago stopped by its green belt. In 1990, New York ranked second and Los Angeles ranked eighth.

    This de-Westernizing trend seems likely to continue. The fastest-growing megacities over the past decade have been primarily in the developing world. Karachi, Pakistan, has led the growth charge, with a remarkable 80% expansion in its population from 2000 to 2010. The growth economies of China and India dominate the rest of the list of most rapidly growing megacities.

    China, not surprisingly, has the most megacities of any country, four. The second fastest growing megacity over the past decade, Shenzhen, was a small fishing village not long ago that became a focus of Deng Xiaoping’s first wave of modernization policies. In 1979 it had roughly 30,000 people; now it is a thriving metropolis of over 12 million whose population in the past decade grew 56%. Its rise has been so quick that the Asia Society has labeled it “a city without a history.”

    Older Chinese cities are also growing rapidly. Shanghai, a cosmopolitan world city decades  before the Communist takeover of the country, expanded almost 50% since 2000. The ancient capital Beijing and the southern commerce and industrial hub of Guangzhou grew nearly as rapidly.

    India matches Japan with three megacities, but they are all growing much faster. The population of Delhi, the world’s fourth-largest city, expanded 40% over the past decade; Mumbai, almost 20%; and Kolkata, roughly 10%, a relatively low rate for a city in a developing country.

    Other rapidly growing megacities are scattered throughout the developing world. In Nigeria, Lagos saw its population swell by over 48%; The Thai capital of Bangkok and Dhaka, Bangladesh, both grew some 45%. The world’s second-largest megacity, Jakarta, expanded 34% to almost 27 million.

    One caveat: Estimating population for comparably defined urban areas, particularly in the developing world, can be difficult. For example, there is considerable disagreement about the population of Lagos, where local officials claimed there were twice as many people in 2005 as were counted in the 2006 Nigerian census. Add the “missing” 8 or more million people and the population would be 22 million this year. The higher local count, however, has not been broadly accepted. There population of Karachi is also disputed, with some claiming a somewhat lower population than reported.

    In contrast, high-income countries in Europe and the U.S., where population tracking is more reliable, grew relatively slowly. The only city with a purchasing power adjusted GDP of over $40,000 that registered population growth over 10% was Moscow, which has expanded rapidly as the center of Russia’s resource-led boom. The population of Paris grew 8%; Los Angeles, 6%; and New York, barely 3%.

    Japan, one of the world’s most urbanized major countries, has also logged slower growth. Tokyo, the great outlier in that country’s stagnant population profile, expanded 7%, Nagoya grew 5.7% and Osaka-Kobe a weak 2.4%. The rapid population depletion in the rest of the country and a lack of immigrants suggest that Japan’s great cities will grow even slower in the years ahead, as the country runs short on migrants from rural areas and young people in general.

    So what do the numbers tell us about the future of megacities? For one thing, it’s clear that the most rapid growth is taking place in countries that still have large rural hinterlands and relatively young populations. These mostly poor places — most with median incomes between Dhaka at $3,100 per capita and Bangkok at $23,000 — will continue to grow, at least until their populations begin to see the results of decreasing birthrates.

    U.N. projections to 2025 suggest that the future list of megacities will be dominated by such lower-income cities, with growth primarily in places like Africa and central Asia. Among the likely new entrants are Lima (Peru) , Kinshasa (Democratic Republic of the Congo) and Tianjin (China). At least seven others (Chennai, Bangalore, Bogota, Ho Chi Minh City, Dongguan, Chengdu and Hyderabad) are now above 8 million, making it likely they could reach megacity status by 2030. Among high-income world cities, London might finally reach 10 million while the only other high-income world candidate, Chicago, with more than 9 million residents, could take until 2040.

    At the same time, some megacities in the low and middle-income world already seem to have reached a point of saturation. A generation ago, it was widely predicted that Mexico City would become the world’s largest city. Yet its growth has slowed to a modest 11% over the past decade. Lower Mexican birthrates and the development of other urban alternatives have made La Capital far less a growth hub than once imagined.

    Similar processes can be seen elsewhere in Latin America, where fertility rates have been dropping to levels closer to American and northern European norm, but not yet those of the ultra-low Japan or southern European countries. Over the past decade population growth was 13% in Buenos Aires, 15%  in Sao Paulo and 10%  in Rio de Janeiro. These cities will likely continue to grow, but at a reduced rate.

    The real winners in the coming decades are likely to be Chinese megacities, and to a lesser extent those in India. China’s megacities all enjoy per capita incomes above $20,000 and the vast scale of the country’s rural population suggests there is still room for growth. It will be perhaps another decade or so before the country’s low birthrate catches up with it, and slows growth down to western or Japanese levels.

    India’s cities, notably Mumbai and Delhi, are not as wealthy as China’s, but are clearly getting richer, with Delhi getting close to the $10,000 per capita income level. With a somewhat higher birthrate than its Chinese or South American counterparts, Indian cities can be expected to continue expanding at least for the next decade or so.

    These trends, of course, may be altered by any number of developments, including the possible threats to  cities from wars, environmental challenges or other large-scale disruptions. But we can say, with some confidence, that the world’s megacities will continue to become increasing Asian and African, reflecting the protean nature of an urban growth pattern that continues to de-emphasize slower expanding regions in the Americas, Japan and, of course, Europe.

    FASTEST GROWING MEGACITIES IN THE WORLD
    (Urban Areas with more than 10 million residents)
    Rank Geography Urban Area Population Estimate GROWTH (Decade)
    1 Pakistan Karachi 20,877,000 80.5%
    2 China Shenzhen 12,506,000 56.1%
    3 Nigeria Lagos 12,090,000 48.2%
    4 China Beijing, BJ 18,241,000 47.6%
    5 Thailand Bangkok 14,544,000 45.2%
    6 Bangladesh Dhaka 14,399,000 45.2%
    7 China Guangzhou-Foshan 17,681,000 43.0%
    8 China Shanghai 21,766,000 40.1%
    9 India Delhi 22,826,000 39.2%
    10 Indonesia Jakarta 26,746,000 34.6%
    11 Turkey Istanbul 12,919,000 25.3%
    Source: Demographia World Urban Areas (2013): http://demographia.com/db-worldua.pdf

    Joel Kotkin is executive editor of NewGeography.com and a distinguished presidential fellow in urban futures at Chapman University, and a member of the editorial board of the Orange County Register. He is author of The City: A Global History and The Next Hundred Million: America in 2050. His most recent study, The Rise of Postfamilialism, has been widely discussed and distributed internationally. He lives in Los Angeles, CA.

    Wendell Cox is a Visiting Professor, Conservatoire National des Arts et Metiers, Paris and the author of “War on the Dream: How Anti-Sprawl Policy Threatens the Quality of Life.

    This piece originally appeared at Forbes.com.

  • Houston Rising—Why the Next Great American Cities Aren’t What You Think

    America’s urban landscape is changing, but in ways not always predicted or much admired by our media, planners, and pundits. The real trend-setters of the future—judged by both population and job growth—are not in the oft-praised great “legacy” cities like New York, Chicago, or San Francisco, but a crop of newer, more sprawling urban regions primarily located in the Sun Belt and, surprisingly, the resurgent Great Plains.

    While Gotham and the Windy City have experienced modest growth and significant net domestic out-migration, burgeoning if often disdained urban regions such as Houston, Dallas-Ft. Worth, Charlotte, and Oklahoma City have expanded rapidly. These low-density, car-dominated, heavily suburbanized areas with small central cores likely represent the next wave of great American cities.

    There’s a whole industry led by the likes of Harvard’s Ed Glaeser, my occasional sparring partner Richard Florida and developer-funded groups like CEOs for Cities, who advocate for old-style, high-density cities, and insist that they represent the inevitable future.

    But the numbers tell a different story: the most rapid urban growth is occurring outside of the great, dense, highly developed and vastly expensive old American metropolises.

    An aspirational city, by definition, is one that people and industries migrate to improve their economic prospects and achieve a better relative quality of life. In the 19th and early 20th centuries, this aspirational spirit was epitomized by cities such as New York and Chicago and then in the decades after World War Two by Los Angeles, which for many years was the fastest-growing big city in the high-income world.

    Until the 1970s, the country’s established big cities were synonymous with aspiration—where the jobs and opportunities for broad portions of the population abounded. But as the financial markets took on an oversized role in the American economy and manufacturing receded, the cost of living in the nation’s oldest metropolises shot up far faster than the median income there—and Americans have turned elsewhere now that, as Virginia Postrel wrote in an important essay on the nation’s growing economic wall, “the promise of a better life that once drew people of all backgrounds to rich places like New York and [coastal] California now applies only to an educated elite—because rich places have made housing prohibitively expensive.”

    Like the great legacy cities during their now long-past adolescent and at times ungainly growth spurts, today’s aspirational cities often meet with little approval from travelers from other, older cities. A 19th-century Swedish visitor to Chicago described it as “one of the most miserable and ugly cities” in North America. New York, complained the French Consul in 1810, was a city where the inhabitants had “in general no mind for anything but business”; later Bostonian Ralph Waldo Emerson, granted Gotham’s entrepreneurial supremacy only to explain that his more cultured “little city” was “appointed” by destiny to “lead the civilization of North America.”

    Los Angeles, most of whose early-20th-century migrants came from the Midwest, became a favorite object of scorn from sophisticates. William Faulkner in the 1930s described the city of angels as “the plastic asshole of the world.” As the first great city built largely around the automobile, mainstream urbanists detested it; their icon Jane Jacobs called it “a vast blind-eyed reservation.”

    A half century later, today’s aspirational urban centers suffer similarly poor reputations among urbanists, planners and journalists. One New York Post reporter recently described Houston as “brutally ugly” while new urbanists like Andres Duany relegate the region to a netherworld inhabited by car-centric cities such as Phoenix and Atlanta.

    Yet over the past decade the 25 fastest-growing cities have been mostly such urbanist “assholes”—Raleigh, Austin, Houston, San Antonio, Las Vegas, Orlando, Dallas-Fort Worth, Charlotte, and Phoenix. Despite hopeful claims from density advocates that the Great Recession and the housing bust ended this trend, the latest census data shows that Americans have continued choosing places that are affordable enough to offer opportunity, and space.

    One common article of faith among mainstream urbanists, at least when they stop to note this growth at all, is that these cities grow mainly because they are cheap and can house the unskilled. But in reality many of these metropolitan areas are also leading the nation in growing their number of well-educated arrivals. Houston, Charlotte, Raleigh, Las Vegas, Nashville, and San Antonio, for example, experienced increases in the number of college-educated residents of nearly 40 percent or more over the decade, roughly twice the level of growth as in “brain centers” such as Boston, San Francisco, San Jose (Silicon Valley), or Chicago. Atlanta, Houston, and Dallas each have added about 300,000 college grads in the past decade, more than greater Boston’s pickup of 240,000 or San Francisco’s 211,000.

    Once considered backwaters, these Sunbelt cities are quietly achieving a critical mass of well-educated residents. They are also becoming major magnets for immigrants. Over the past decade, the largest percentage growth in foreign-born population has occurred in sunbelt cities, led by Nashville, which has doubled its number of immigrants, as have Charlotte and Raleigh. During the first decade of the 21st century, Houston attracted the second-most new, foreign-born residents, some 400,000, of any American city—behind only much larger New York and slightly ahead of Dallas-Ft. Worth, but more than three times as many as Los Angeles. According to one recent Rice University study, Census data now shows that Houston has now surpassed New York as the country’s most racially and ethnically diverse metropolis.

    Why are these people flocking to the aspirational cities, that lack the hip amenities, tourist draws, and cultural landmarks of the biggest American cities? People are still far more likely to buy a million dollar pied à terre in Manhattan than to do so in Oklahoma City. Like early-20th-century Polish peasants who came to work in Chicago’s factories or Russian immigrants, like my grandparents, who came to New York to labor in the rag trade, the appeal of today’s smaller cities is largely economic. The foreign born, along with generally younger educated workers, are canaries in the coal mine—singing loudest and most frequently in places that offer both employment and opportunities for upward mobility and a better life.

    Over the decade, for example, Austin’s job base grew 28 percent, Raleigh’s by 21 percent, Houston by 20 percent, while Nashville, Atlanta, San Antonio, and Dallas-Ft. Worth saw job growth in the 14 percent range or better. In contrast, among all the legacy cities, only Seattle and Washington D.C.—the great economic parasite—have created jobs faster than the national average of roughly 5 percent. Most did far worse, with New York and Boston 20 percent below the norm; big urban regions including Philadelphia, Los Angeles, and, despite the current tech bubble, San Francisco have created essentially zero new jobs over the decade.

    Another common urban legend maintains these areas lag in terms of higher-wage employment, lacking the density essential for what boosters like Glaeser and Florida describe as “knowledge-intensive cities.” Defenders of traditional cities often cite Santa Fe Institute research that they say links innovation with density—but actually does nothing of the kind. Rather, that research suggests that size, not compactness, constitutes the decisive factor. After all, it’s hard to define Silicon Valley, still the nation’s premier innovation region, as anything other than large, sprawling, and overwhelmingly suburban in form.

    Size does matter and many of the fastest growth areas are themselves large enough to sport a major airport, large corporate presences and other critical pieces of economic infrastructure. The largest gains in GDP (PDF) in 2011 were in Houston, Dallas and, surprisingly, resurgent greater Detroit (and that despite its shrinking urban core). None of these areas are characterized by high density yet their income growth was well ahead of Seattle, San Francisco, or Boston, and more than twice that of New York, Washington, or Chicago.

    But in fact neither density nor size necessarily determine which regions generate new high-end jobs. The growth in STEM—or science-technology-engineering and mathematics-related—employment in Houston, Raleigh, Nashville, Austin, and Las Vegas surpassed that in San Francisco, Los Angeles, Boston, or New York. One reason: most STEM jobs are not found in fashionable fields like designing social media or videogames but in more prosaic activities tied to medicine, manufacturing, agriculture and (horror of horrors) natural resource extraction, including fossil fuel energy. In this sense, technology reflects the definition of the French sociologists Marcel Mauss as “a traditional action made effective.”

    This pattern also extends to growth in business and professional services, the nation’s biggest high-wage job category. Since 2000, Houston, Dallas-Fort Worth, Charlotte, Austin and Raleigh expanded their number of such jobs by twenty percent or more—twice the rate as greater New York, the longtime business-service capital, while Chicago and San Jose actually lost jobs in this critical category.

    Finally there is the too often neglected topic of real purchasing power—that a dollar in New York doesn’t go nearly as far as one in Atlanta, for example. My colleague Mark Schill at the Praxis Strategy group has calculated the average regional paycheck, adjusted for cost of living. Houston led the pack in real median pay in, and seven of the 10 cities with the highest adjusted salary were aspirational ones (the exceptions were San Jose-Silicon Valley, Seattle, and the greater Detroit region). Portland, Los Angeles, New York, and San Diego all landed near the bottom of the list.

    Conventional urbanists—call them density nostalgists—continue to see the future in legacy cities that, as the University of Washington demographer Richard Morrill notes, were built out before the dominance of the car, air-conditioning and with them the prevalence of suburban lifestyles.

    Looking forward, it is simply presumptuous and ahistorical to dismiss the fast-growing regions as anti-cities, as 60s-era urbanists did with places like Los Angeles. When tradition-bound urbanists hope these sprawling young cities choke on their traffic and exhaust fumes, or from rising energy costs, they are reflecting the classic prejudice of city-dwellers of established urban centers toward upstarts.

    The reality is that most urban growth in our most dynamic, fastest-growing regions has included strong expansion of the suburban and even exurban fringe, along with a limited resurgence in their historically small inner cores. Economic growth, it turns out, allows for young hipsters to find amenable places before they enter their 30s, and affordable, more suburban environments nearby to start families.

    This urbanizing process is shaped, in many ways, by the late development of these regions. In most aspirational cities, close-in neighborhoods often are dominated by single-family houses; it’s a mere 10 or 15 minute drive from nice, leafy streets in Ft. Worth, Charlotte, or Austin to the urban core. In these cities, families or individuals who want to live near the center can do without being forced to live in a tiny apartment.

    And in many of these places, the historic underdevelopment in the central district, coupled with job growth, presents developers with economically viable options for higher-density housing as well. Houston presents the strongest example of this trend. Although nearly 60 percent of Houston’s growth over the decade has been more than 20 miles outside the core, the inner ring area encompassed within the loop around Interstate 610 has also been growing steadily, albeit at a markedly slower rate. This contrasts with many urban regions, where close-in areas just beyond downtowns have been actually losing population.

    Even as Houston has continued to advance outwards, the region has added more multiunit housing over the past decade than more populous New York, Los Angeles or Chicago. With its economy growing faster and producing wealth faster than any other region in the country, urban developers there usually do not need subsidies or planning dictates to be economically viable.

    Modern urban culture also is spreading in the Bayou City. In what has to be a first, my colleagues at Forbes recently ranked Houston as America’s “coolest city,” citing not only its economy, but its thriving arts scene and excellent restaurants. Such praise may make some of us, who relish Houston’s unpretentious nature, a little nervous—but it shows that hip urbanism can co-exist with rapidly expanding suburban development.

    And Houston’s not the only proverbial urban ugly duckling having an amenity makeover. Oklahoma City has developed its central “Bricktown” into a centerpiece for arts and entertainment. Ft. Worth boasts its own, cowboy-themed downtown, along with fine museums, while its rival Dallas, in typical Texan fashion, boasts of having the nation’s largest arts district.

    More important still, both for families and outdoor-oriented singles, both cities are developing large urban park systems. At an expense of $30 million, Raleigh is nearing the completion of its Neuse River Greenway Trail, a 28-mile trail through the forested areas of Raleigh. Houston has plans for a series of bayou-oriented green ways. For its part, Dallas is envisioning a vast new 6,000 acre park system, along the Trinity River that will dwarf New York’s 840-acre Central Park.

    To be sure, there’s no foreseeable circumstance in which these cities will challenge Paris or Buenos Aires, New York, or San Francisco as favored destinations for those primarily motivated by aesthetics that are largely the result of history. Nor are they likely to become models of progressive governance, as poverty and gaps in medical coverage become even more difficult problems for elected officials without a well-entrenched ultra-wealthy class to cull resources from.

    Finally, they will not become highly dense, apartment cities — as developers and planners insist they “should.” Instead the aspirational regions are likely to remain dominated by a suburbanized form characterized by car dependency, dispersion of job centers, and single-family homes. In 2011, for example, twice as many single-family homes sold in Raleigh as condos and townhouses combined. The ratio of new suburban to new urban housing, according to the American Community Survey, is 10 to 1 in Las Vegas and Orlando, 5 to 1 in Dallas, 4 to 1 in Houston and 3 to 1 in Phoenix.

    Pressed by local developers and planners, some aspirational cities spend heavily on urban transit, including light rail. To my mind, these efforts are largely quixotic, with transit accounting for five percent or less of all commuters in most systems. The Charlotte Area Transit System represents less a viable means of commuting for most residents than what could be called Manhattan infrastructure envy. Even urban-planning model Portland, now with five radial light rail lines and a population now growing largely at its fringes, carries a smaller portion of commuters on transit than before opening its first line in 1986.

    But such pretentions, however ill-suited, have always been commonplace for ambitious and ascending cities, and are hardly a reason to discount their prospects. Urbanistas need to wake up, start recognizing what the future is really looking like and search for ways to make it work better. Under almost any imaginable scenario, we are unlikely to see the creation of regions with anything like the dynamic inner cores of successful legacy cities such as New York, Boston, Chicago or San Francisco. For better or worse, demographic and economic trends suggest our urban destiny lies increasingly with the likes of Houston, Charlotte, Dallas-Ft. Worth, Raleigh and even Phoenix.

    The critical reason for this is likely to be missed by those who worship at the altar of density and contemporary planning dogma. These cities grow primarily because they do what cities were designed to do in the first place: help their residents achieve their aspirations—and that’s why they keep getting bigger and more consequential, in spite of the planners who keep ignoring or deploring their ascendance.

    Joel Kotkin is executive editor of NewGeography.com and a distinguished presidential fellow in urban futures at Chapman University, and a member of the editorial board of the Orange County Register. He is author of The City: A Global History and The Next Hundred Million: America in 2050. His most recent study, The Rise of Postfamilialism, has been widely discussed and distributed internationally. He lives in Los Angeles, CA.

    This piece originally appeared in the The Daily Beast.

    Photo by telwink.

  • Green Office Towers Cast Shadow Over Sydney

    Known for her spiky hair, studded-collar and heels, Sydney’s Lord Mayor is the epitome of progressive chic. For a green activist, though, Clover Moore attracts some surprising company. Landlords owning 58 per cent of the CBD’s office space have rushed to join her Better Buildings Partnership, an alliance “to improve the sustainability performance of existing commercial and public sector buildings”. At first glance, the property industry’s enthusiasm for ‘green building’ seems strange.  Shouldn’t they be insisting on less costly design and materials?  Or despite their hard-nosed reputation, are they out to save the planet after all?

    As it turns out, the lure of green building has more to do with cash than climate. By virtue of the soft economy and creeping “sustainability” measures, green-rated office towers are a gilt-edged opportunity for investors fleeing stocks and bonds. The wave of change rolling over central Sydney displays a certain logic. Meddling officials get to wrap themselves in virtue while big landlords – local and global investment trusts and fund managers – get a new premium grade rating for their properties. How better to protect asset values in an unsettled world? It’s a cosy, CBD-boosting deal, even if it distorts job and investment flows in outlying parts of the city.

    The floor-space revolution

    Even before the crash of 2008, banks, insurance companies and other financial services were under pressure to extract higher value out of every inch of floor-space. The global debt meltdown only accelerated the process. Aggressive cost-cutting saw Australian banks reduce their cost-to-income ratios from around 60 per cent in the late 1980s to around 45 per cent today. This priority is turning Sydney CBD’s office core inside-out, a trend reinforced by pay-offs from the green-rating of building stock.

    One recent headline summed it up neatly: “Martin Place exodus”. The article describes how major banks like Westpac, ANZ and Commonwealth are all vacating large office blocks in stately Martin Place, “the heart of Sydney’s financial centre”. Linking George Street, the CBD’s commercial “spine”, to the city’s government office sector along Macquarie Street, near state Parliament House, Martin Place has hosted the cream of Australia’s banking and insurance houses since the nineteenth century. The Reserve Bank is based there as well.   

    Sydney’s traditional office core enclosed Martin Place within Clarence, King and Macquarie Streets and the waterfront at Circular Quay. In line with conventional CBD morphology, this lies just north of the longstanding, but expanding, retail core bounded by York, Park, Elizabeth and King Streets, where large department stores are concentrated around the conjunction of George and Market Streets, the CBD’s peak land value intersection (PLVI).  

    Driven to economise on floor-space, larger financial and professional services firms are leaving the traditional office core for outer blocks, which until recently were, in the parlance of CBD theory, “zones in transition”, low-grade areas on the periphery of the office and retail cores with potential for higher value functions. Some “see the axis of the Sydney central business district changing.” Typically, landlords are now expected “to work with Sydney tenants to address their concerns around relocating or redesigning … and help minimise costs and increase efficiencies in their work environment.”  Lest this be dismissed as penny-pinching, a new “workplace philosophy” has been invented to sell the floor-space revolution, and, predictably, that old chestnut “sustainability” has been pressed into service.

    Spreading from banks to insurance companies to professional services and other large white-collar workplaces, “activity-based working” (ABW) has been treated to rapturous media coverage. “Gen Y shuts door on open-plan century”, is how one headline put it. In progressive outlets, ABW is depicted more as a reaction than an initiative, a revolution forced on employers – and indirectly on property developers – by green, socially aware, tech-savvy Gen Y office workers. As the narrative goes, they reject confinement in the “assigned desks” of open-plan workstations or offices. 

    At one prominent bank, staff are “free to roam and work where and how the mood takes them.” Usually, we are told, “they start the day at an ‘anchor point’ where their locker is and which they share with about 100 other workers … they might stay around that area for the day, with a choice of work situations ranging from quiet spaces to conversation areas, or they may set up somewhere else depending on who they need to see.” Equipped with laptops, i-pads, mobile phones and wi-fi, they “can move from space to space and hardware isn’t an inhibitor.” Some organisations “have been … expanding a whole range of tools from [their] internal social-media platform to crowd-sourcing …” Spaces come in all varieties, including meeting rooms, “hush” rooms, discussion pods, team tables, cafes, “floor hubs”, “touch-and-go area[s] for short stays”, even “funky kitchens”.

    And topping off the semblance of a white-collar wonderland, ABW adapted buildings often have glass lifts and “a central atrium allowing views to other floors”, so “you really do feel part of a bigger whole, you can see everybody.”

    Touted in near-utopian language, ABW unites the high-end circle of developers, architects, interior designers, building managers, real estate agents and progressive media. Most of all, we are assured, it’s about values, lifestyles and the coming generation, invariably presented as model progressives. According to a Colliers International report, Generation Y “prefer to work for an organisation with a commitment to social causes than one without … [i]n relation to the built environment, being green as an office occupier will become more of a ‘must have’ than a ‘nice to have’ in order to attract and retain staff.” Amongst other things, this means “creating less hierarchical workplaces, which facilitate collaboration, personal accountability and flexibility.”

    Such are the times, that if a business announced ABW-type reforms to improve its bottom line, raise productivity or increase returns to investors, it would be damned as a “slave to neo-liberal dogma”. But if the very same measures were dressed-up in the garb of “sustainability”, it would be showered with awards and accolades.

    Notwithstanding the pushy New Age rhetoric, ABW is more an economic-cum-technological opportunity for employers, than a revolt by the young and restless. Focus on costs is inevitable when economic conditions are so tight, and information and communications devices so ubiquitous and portable. A popular measure of office space efficiency is the workspace ratio, explains a researcher at Jones Lang Lasalle, or the number of square metres occupied by each office worker. The typical ratio is 15 square metres per person, but technology is freeing up workers to leave the office, so occupancy is typically now between 40 and 50 per cent, which translates, on average, to each worker occupying 37.5 square metres. “That’s expensive space”, he says.

    Other research found that in a traditional office, between 55 and 85 per cent of desks are not used at any given time. Yet other studies indicate that “trading off individual territory for shared areas” can reduce floor space requirements by 20 to 40 per cent. This all leads directly to the bottom line. By cutting the amounts paid for rent and outgoings, says a Colliers researcher, ABW could reduce a firm’s total cost by up to 30 per cent.

    That’s reason enough to drive large organisations out of their digs in Martin Place and the old office core, mostly for state-of-the-art towers designed to accommodate ABW floor-plans and facilities. “Macquarie Bank was an early mover (to Shelley Street), as was Westpac to its vertical campus in the western central business district”, report Jones Lang Lasalle on the major banks, and “[m]ore recently, the Commonwealth Bank has moved to Darling Quarter and ANZ will soon move to Pitt Street.” One way or another, the larger financial institutions, whose head-office functions were scattered throughout the CBD, have “implemented strategies to consolidate their space requirements and build in [ABW] flexibility.”

    This isn’t happening to satisfy worker demands for “sustainability”, but recourse to “green ethics” no doubt helped prise the sceptical from their desks.

    Green-star trek

    Nor have landlords failed to gain from the floor-space revolution. Large and institutional players like real estate investment trusts and fund managers profited from a wave of demand for innovative, capital-intensive building stock. More unexpectedly, they encountered a rising class of green-tinged activists, designers and architects, whose obsessions with energy-saving and natural power came in useful. As climate change crept up the political agenda, progressives across all tiers of government soon turned to the built environment, churning out laws and regulations that defined and mandated ‘green building’ standards. The property industry’s peak bodies embraced the concept.    

    This is somewhat paradoxical. Despite its obsession with all sorts of metrics, ratios and indices, the property sector doesn’t seem to care that the object of these standards is unmeasurable. Their effect on the global climate system can never be known (it was always fanciful to suggest that Australian building styles would affect the climate, but anyone who believes it after Copenhagen, Cancun, Durban and Rio is deluded).

    On the other hand, the financial benefits are rather more tangible. The key is NABERS, the National Australian Built Environment Rating System. Administered nationally by the New South Wales Office of Environment and Heritage, NABERS is a rating scale from a low of 1 to a high of 6 stars (the “Green Star”) applicable to buildings or tenancies, based on criteria like energy efficiency, water usage, waste management and indoor environment quality. The federal and some state governments have mandated at least a 4.5 star rating for public sector offices, and 4.5 has generally become the minimum for image-conscious corporates. A building or suite designed or refurbished for ABW will naturally score well.

    The Commonwealth Bank’s new campus-style headquarters at Darling Quarter is in the CBD’s “western corridor”, formerly a “zone in transition” near the disused docks and freight yards of Darling Harbour. It achieved a coveted 6 star rating. Coming up with two curved-roof buildings of six and eight stories, “the designers have emphasised the natural light, air quality and water recycling … with features including a full-height atrium, single-pass ventilation, blackwater recycling, trigeneration power and passive chill beam air-conditioning.” Westpac’s new campus further up the corridor at 275 Kent Street achieved 4 stars, and the three towers underway at Barangaroo, a futuristic, mixed-use precinct at the corridor’s northern end, meet 6 star specifications. ANZ’s new headquarters at 242 Pitt Street (161 Castlereagh), towering over the CBD’s “mid-town” south of the retail core, also aims for 6 stars.

    The most vaunted 6 star tower is the oval-shaped, “flagship” tower at 1 Bligh Street. Using 3D software called Building Information Modelling or BIM, the designers conceived an edifice with “gas and solar panels reduc[ing] electricity consumption by as much as 25 per cent, while water recycling reduces mains water by up to 90 per cent …” But its “principal sustainability feature is a fully glazed doubleskin façade made from clear glass panels … allow[ing] for automated sunshading that dramatically reduces the heat load on the building, which means [it needs] less airconditioning and can have … better natural light.” First-tier law firm Clayton Utz is the building’s anchor tenant.

    To the extent that creative designers, developers and landlords have combined to meet a demand in the market, these buildings are impressive enough. That’s how markets should work. But on the pretext of “sustainability”, activist politicians and officials have, effectively, codified the product and marketing strategies of the most powerful players. NABERS does that by granting official recognition to a system mirroring the star scale long used in the hotel industry. Overnight, hundreds of thousands of square metres of non-rated office space was downgraded. Rent-seeking opportunities for the owners of rated space proliferated, to the detriment of smaller, more marginal players, their tenants and peripheral regions. “While the NABERS rating of a building is not the sole factor for corporate tenants”, said a CBRE director, “it is playing a significant role in selecting suitable office space.”

    Clover Moore, whose jurisdiction covers capital-rich Sydney CBD and surrounds, has actively boosted the interests of large and institutional landlords with a grab-bag of lucrative benefits. There’s the CitySwitch Green Office program, which assists landlords leasing more than 2000 square metres of office space to achieve a mandatory NABERS rating; there are “green loans” for “sustainable retrofits” to be repaid as a levy on council rates; there’s a scheme under the Better Buildings Partnership that enables commercial property owners to enter Environmental Upgrade Agreements (EUAs) and share the cost of green building upgrades with tenants; and there are exemptions from a levy on new construction for green initiatives. 

    All in all, NABERS effects have proven a boon to the high-end property industry. Particularly for listed real estate investment trusts (REITs) and fund managers, but also many unlisted investors, which value stable capital growth as much as income, and continually trade or “recycle” assets to manage their portfolios. By allocating capital efficiently for market-oriented purposes, these investors can play a positive role in urban development, as long as green distortions (amongst others) don’t get in the way.

    An Australian Property Institute study at the end of 2011 found that office buildings with a 6 star NABERS rating enjoyed a premium in value of 12 per cent, those with a 5 star rating 9 per cent, those with 4.5 stars 3 per cent, and those with 3 stars 2 per cent. In May 2012, the IPD green property survey found that “prime office buildings with high NABERS ratings – from 4 stars to 6 stars – outperformed the broader prime office market over the past year … the greener buildings delivered an 11.3 per cent total return compared with the overall CBD office return of 10.8 per cent.” Further, buildings with a high NABERS rating “significantly outperformed assets as having a NABERS rating of 3.5 stars or less … better-rated assets delivered 11.8 per cent compared with 8.7 per cent for the lower-rated properties.”

    Capital growth conscious REITs and funds must have been pleased to hear, from a principal of the IPD Green Property Investment Index, that “owners who improve the sustainability attributes of their buildings are more likely to experience relatively stronger growth in capital values and will mitigate downside risk in asset values.” That’s a bonus for such local and global investors who have poured billions into the “safe haven” of Australian – especially Sydney – commercial real estate for other reasons, like the diminished standing of other asset classes, stock market volatility, a relatively sound economy, a reputable legal system and links to the booming Asia-Pacific region. Sydney was the world’s fourth most popular destination for cross-border property investment in the 18 months to June 2010, while the spreading use of NABERS culiminated in November 2011, when a rating became mandatory for space above 2000 square metres.   

    This is how a mayor can spend her life cultivating a progressive persona, only to end up the unwitting tool of some canny fund managers.

    Regressive recentralisation

    Green building is promising to be a goldmine for the well-placed, and a dead weight for almost everyone else. In an April 2012 Market Overview for Parramatta, a second-tier CBD servicing Sydney’s western region, Knight Frank explain that “the gap between economic rents and market rents remains a constraint on new [office] supply.” In other words the cost of land acquisition, planning and building processes, construction and fitting out, and a profit margin, on a square metre basis (economic rent) exceeds the rent obtainable from prospective tenants (market rent). Not all the gap between economic and market rents can be pinned on green standards, now essential for investor interest. But they are an undeniable factor. On one estimate, by consultants Davis Langdon, achievement of a 4 to 6 star NABERS rating can add between 3 and more than 11 per cent to construction costs.

    If supply constraints are serious in Parramatta, where the federal and NSW governments have relocated several agencies and departments, apparently they are acute in more suburban locations. According to a newspaper report in April 2011, “the trend across the Sydney metropolitan markets is falling [office] supply … this is evident across all key markets including North Sydney, St Leonards, Parramatta, North Ryde, Rhodes and Homebush … at present there is no speculative development across these suburbs, so the problem of reduced A-grade space will only increase during the next couple of years, putting pressure on rents and incentives.” The only speculative office block started at the time was at Norwest, says the report, a specialised business park in north-west Sydney. The building was designed for a 4.5 star NABERS rating.

    These weak conditions have various causes, but green standards shouldn’t be underestimated. Investors have lost interest in non-rated projects, and the economics of rated projects are trickier beyond high-rent centres like the CBD or business parks. According to a CBRE director, as of June 2011 there was “more capital looking to invest in the office sector than was evident before the global financial crisis … however, the majority of this capital is only chasing prime assets with very few groups willing to consider smaller secondary assets and non-central business locations.” For their part, more demanding tenants are also retreating to the green citadels and ABW theme-parks of Sydney CBD. Noting the CBD’s low office vacancy rate, Jones Lang Lasalle explain that “any downsizing that has occurred in the financial services sector has been offset by tenant centralisation … [a]s companies continue to look to improve the environment and amenity for staff as a means of attracting and retaining the best talent.” They detect a “trend to centralisation”.  Similarly, a Colliers director observed that “tenants were being driven out of metro markets by tight vacancy rates for quality space and are attracted by a greater ability to attract and retain staff if located in the CBD.”

    Phrases like “attract and retain staff”, of course, suggest NABERS rated buildings adapted for ABW. The portability of communications devices should be liberating workers from fixed locations, not just assigned desks. ABW advocates love phrases like “work is a thing you do not a place you go” and “work is becoming a process not a place”. But green imposts are having a countervailing effect.

    This withdrawal of capital and tenants is bound to choke-off a range of suburban and peripheral businesses, the small to medium sized service operators, start-ups, microbusinesses, consultants, franchisees and sole traders which rely on freely-available space and low rents.  

    To all but the greenest ideologues, it should be clear that the decentralisation of offices – as well as factories and warehouses – over recent decades has fuelled Sydney’s prosperity, enabling the city to absorb an extra 1.5 million people since the mid-1980s. Equally, it should be clear that decentralisation offers better outcomes on access to affordable housing, traffic congestion and employment dispersion. On average, peripheral Local Government Areas (LGAs) still experience higher unemployment rates than central LGAs. That’s why the centralising forces unleashed by green planning and building codes pose serious dangers to economic vitality across the greater metropolitan region. Plenty of attention has been lavished on the pampered few in their ABW playgrounds. Some should be spared for the vast majority who seek to make a life in Sydney.

    John Muscat is a co-editor of The New City, where this piece originally appeared. 

    Photo by Christopher Schoenbohm.

  • The Evolving Urban Form: Athens

    Around the fifth century BCE, Athens may have been the most important city in the West. Like China’s Chang’an (modern Xi’an), the "on and off" capital of China, Athens has experienced many severe "ups and downs" throughout its remarkable history. At its ancient peak, Athens is estimated to have had more than 300,000 residents (historic population estimates vary greatly). At least one estimate indicates that Athens may have fallen to a population of under 5,000 by the middle 19th century. The city, now having evolved into the modern manifestation of the metropolitan area (Attica region), peaked at 3.9 million in the early 2000s, but its population has begun to drop again.

    Athens is the capital of Greece and located at the south end of the Attica peninsula, on the Aegean Sea. The core municipality of Athens is located approximately 5 miles (8 kilometers) from the historic port of Piraeus, from which ferries operate to the Greek Islands.

    Metropolitan Dispersion

    Like virtually all of the world’s metropolitan areas, population growth has been concentrated in the suburbs and exurbs for decades.

    The Athens municipality (the historic core city) peaked at 885,000 in 1981. At a population density of nearly 60,000 per square mile (23,000 per square kilometer), Athens once stood among the most dense municipalities in the world. However, the Athens municipality since has declined, with population losses in each of the three subsequent decades. Between 2001 and 2011, the population fell 125,000 to 664,000, a decline of 16%. The Athens municipality is still dense, however, at 44,000 per square mile (17,000 per square kilometer). The rest of the urban organism, as is usually the case, is considerably less so.


    Photo: Athens Core Density

    Since 1951, suburban and exurban Athens (see The Evolving Urban Form Series Definitions) has accounted for 95% of the growth in the metropolitan region, adding 2.2 million new residents, compared to approximately 100,000 for the Athens municipality. Since 1971, all of the population growth has been in the suburbs and exurbs (Figure 1).

    However, over the last decade, population growth has dropped across the entire Athens metropolitan region. Certainly, the low Greek fertility rate is a factor (see The Rise of Post-Familialism: Humanity’s Future?). Greece’s total fertility rate (average number of children per women of child bearing age) is approximately 1.5, according to Eurostat, well below the replacement rate of 2.1 not to mention the 2.3 Greek figure in the late 1970s. More recently, it is likely that the Greek fiscal crisis has contributed to an even lower rate of increase by reducing the previously flow of international migration as well as discouraging family formation among native Greeks.

    Athens growth slowed dramatically well before the financial crisis. Between 1991 and 2001, the Athens metropolitan region added approximately 300,000 new residents. But  between 2001 and 2011, the metropolitan region lost 67,000 residents. However, the suburbs and exurbs gained marginally, adding 58,000 residents, partially offsetting the loss in the Athens municipality (Figure 2). Even so, the suburban population increase was miniscule compared to the 330,000 gain of the previous decade (photo: North Suburban Athens).


    Photo: North Suburban Athens

    The Urban Area

    Even with its slow and even negative growth, the  Athens urban area remains  among the most dense in the developed world (Figure 3). No major urban area in Western Europe, Japan or the New World (Australia, Canada, New Zealand and the United States) is as dense. The 2013 edition of Demographia World Urban Areasindicates that the Athens urban area has a population of 3.5 million (Note), living in a land area of 225 square miles (580 square kilometers), for a density of 15,600 per square mile (6,000 per square kilometer). This places Athens slightly ahead of London (15,300 per square mile or 5,900 per square kilometer), about double the density of Toronto or Los Angeles and more than four times that of Portland.

    As is typical around the world, the urban area of Athens exhibits a generally declining density from the core to the urban fringe. From the 44,000 per square mile (17,000 per square kilometer) Athens municipality density, the inner suburbs drop to approximately 20,000 per square mile (7,700 per square kilometer). This is still a high population density for inner suburbs, reflecting the fact that much of the area was developed before the broad achievement of automobile ownership (a similar situation is obvious in the inner ring suburbs of Paris). The outer ring suburbs have been more shaped by the automobile, yet have a density of 8,500 per square mile (3,300 per square kilometer), which still  is high by Western European standards (Figure 4).

    Affluence

    Athens has below average affluence among the metropolitan regions of the developed world. According to data in the Brookings Institution Global Metro-Monitor, Athens had a gross domestic product, purchasing power parity adjusted (GDP-PPP) per capita of $30,500 in 2012. This trails the most affluent metropolitan regions around the more developed world. It is less than one-half the gross domestic product per capita of Hartford (US), the world’s most affluent major urban area ($79,900). The Athens GDP-PPP is approximately one-half that of regional leaders Perth (Australia) at $63,400, Calgary ($61,100), Tokyo ($41,400) and Busan (South Korea) at $36.900. Athens also ranks well below Western Europe’s most affluent metropolitan region, Oslo, at $55,500. Athens is also less affluent than the least major metropolitan areas with the lowest GDP-PPPs per capita in Australia (Adelaide), Canada (Montréal), and the United States (Riverside-San Bernardino). However, Athens has a higher GDP-PPP per capita than Sendai (Japan), Daegu (South Korea) and Naples (Figure 5), the least affluent major metropolitan areas in their respective geographies.

    Low Fertility, Declining Migration and An Uncertain Future

    Even as the national fertility rate dropped in the late 20th century, Athens continued to grow strongly due largely to international migration, especially from Albania. During the 1990s, virtually all of the population growth in Greece was the result of immigration, as the natural components of growth (births minus deaths) fell into decline. During the 2000s, immigration declined so severely that the nation lost population, most of it in the Athens metropolitan region (with the Athens municipality’s loss exceeding the nation’s) where the foreign born population has concentrated. Much of the decline in international migration resulted from the severe economic crisis.

    Athens typically exhibits the principal function of cities in civilization. When cities compete well by facilitating economic aspiration, they grow. When they do not, cities stagnate or fall into decline. For Athens, stagnation or decline seems the likely scenario in the foreseeable future.   

    Wendell Cox is a Visiting Professor, Conservatoire National des Arts et Metiers, Paris and the author of “War on the Dream: How Anti-Sprawl Policy Threatens the Quality of Life.

    —–

    Note: The difference between the metropolitan area and urban area population is the residents living in exurban areas (outside the urban area, but within the metropolitan area).

    Photo: The Acropolis (all photos by author)

  • Why Inmigration Really Matters, Particularly to the Rust Belt

    Cleveland Mayor Frank Jackson’s recent comment about immigration has drawn some local ire. At his annual remarks on the state of the city, the Mayor—in response to a question of how Cleveland can end its population decline by attracting immigrants—stated: “I believe in taking care of your own”.

    To be fair, the Mayor contextualized the statement by inferring that the best attraction strategy is to build a city that works for those who reside in it. In some respects I agree. In fact America attracts immigrants not because of “attraction strategies”, but because it offers the prospects of a better quality of life. So, if a city can nail that down, well, that is a hell of a pull.

    The problem, though, is that historically inward-facing legacy cities such as Cleveland have had a hard time moving the needle toward progress because fresh blood is lacking, and so a “taking care of your own” strategy often devolves into policies that simply further fossilize the status quo.

    Why?

    Because such cities—with low rates of inmigration, and a long lineage of social capital that can tip to the side of insularity and territorial encampment—have too much inertia, which is defined as “the resistance of an object to change its state of motion or rest”.

    Inertia is real, not simply in physics, but in organizational behavior, such as city politics and policy. And the more historical it is, the thicker the status quo, and thus the harder it is for a city to change—meaning the future, or the momentum of the city, can be like a train chugging to constant stops of stagnation unless a “force outside the system…act[s] upon the system for a long enough period of time to have any effect on changing the momentum.”

    Enter the importance of outsiders, be they immigrants, returning expats, or just new people from other parts of the country. Without them cities get stuck. People see the same things, talk the same things over. Bullshit territorial divides like East- versus West-side of the Cuyahoga River reign, effectively cutting a city’s “brain” in half. Business is business as usual, then. Hence the post-industrial-sixty-year decline.

    Writes Aaron Renn over at Urbanophile:

    I previously noted how it generally takes a critical mass of outsiders, enough to create a constituency for change in its own right, to drive real disruptive change in a community. These are the people who aren’t invested in the status quo. Absent that, getting reform that works will be a difficult challenge.

    Echoes migration expert and blogger Jim Russell:

    Without migration, there are no cities. An urban landscape is more than a draw for talent. Metros thrive on churn, both the influx and egress of people…

    … The very act of moving, particularly to the top tier of global cities, is entrepreneurial. You are surrounded by risk-takers and innovation. The competition is fierce. The cream of the crop is seeking any edge, looking for any opening.

    I am learning about the power of migration first hand. You see, I am a lifelong Clevelander, a West Sider, one well-versed in the how things are customarily done around here, and what thoughts and words are commonly produced if only through a Rust Belt inertia that can be cloaked in “tradition”. My partner, Andiara Lima, is a relative newcomer from Vale do Aço, or the “Steel Valley” of Brazil. Before I met her I was ignorant to the presence of the Brazilian community in Cleveland. Now, I no longer am, and the experience provides me with on-the-ground lessons as to the importance of migration in evolving the Rust Belt “way”.

    brazil house party


    For instance, individually speaking, my panorama is being broadened, with the dominant cultural connotations of Cleveland defined primarily by whiteness or blackness taking a needed hit. For instance, I was at a Brazilian-hosted house party not long back, and it was like nothing I ever experienced. The dining room was cleared, bodies moved, sweat poured, people screamed and shook ass. A band was set up to play bossa nova along a window seat. And it was happening all in the neighborhood of my childhood, but way beyond my childhood. Rather a feeling of something forward.  Not just past. Not identity politics, but a freshness needed so that crusty legacy and power can be dampened if only to bust identity politics up.

    No doubt, these identity politics hurt the region’s ability to welcome and catalyze emerging groups. For instance, I am reminded of a recent Facebook comment on a local politician’s page that discussed a community forum about how Cuyahoga County government reform would affect race relations. The commenter notes:

    The whole panel was black or white people. The Asians and Latinos were in the back of the room wondering “what about us?”

    “What about us?”

    It’s a good question, and one local leaders shouldn’t underestimate given the region’s need for fresh blood. And we aren’t just talking bodies, but talent, as migrants are “economic ass-kickers”, particularly due the fact that migration is in itself an act of entrepreneurialism.

    For instance, my partner Andiara studies the Brazilian trade market for a local investment company. Her informational network into the country, both professionally and informally, is deep. For me, she is a link between two Rust Belt worlds, shattering my sense of restrictive locality for a borderless view that gets me thinking about how to position Cleveland not just regionally, but globally.

    For Cleveland, she is a reserve for local industry that should be both cultivated and tapped, especially since—as the US Ambassador to Brazil recently said at Cleveland’s Union Club—“Brazil is an economic and democratic power the United States needs as a partner”.


    And there is Luca Mondaca and Moises Borges, both acclaimed Brazilian musicians who are plugging (into) and broadening (out) Cleveland’s musical legacy. Yet there is frustration, particularly for Luca, as she feels isolated, untapped, and sometimes lost in the culture of a city that—while desperate for freshness—has difficulty getting beyond the inertia that comes with being comfortably stale. And while I am hopeful that the city is in fact becoming more welcoming—and that the opportunity afforded by the region’s affordability and legacy assets can further open the inmigrant sluicegates—passive optimism is not an option.

    Neither is parochial playmaking.

    In fact, Andiara Lima, Luca Mondaca, and Moises Borges are Cleveland’s “own”. But without that recognition, they may not be for very much longer.

    Richey Piiparinen is a writer and policy researcher based in Cleveland. He is co-editor of Rust Belt Chic: The Cleveland Anthology. Read more from him at his blog and at Rust Belt Chic.

  • Why British Prosperity is Hobbled by a Rigged Land Market

    The British have the least living space per head, the most expensive office rents and the most congested infrastructure of any EU-15 country. Thanks to a rapidly growing population –  the result of a healthy birth-rate and immigration – these trends are worsening steadily. At the same time, the British economy is languishing in a prolonged slump brought on by a collapse of demand. The answer is obvious: Britain needs to build more. Unfortunately, the obstacles to development are formidable. Britain’s supply-side problems are of a different character to those holding back other struggling European economies, but arguably no less serious.

    Britain is generally considered a flexible, economically liberal economy, in which insiders have few opportunities to rig the system for their own benefit. To the extent that supply-side problems are considered a significant obstacle to economic growth, attention generally centres on the country’s patchy skills base. A high drop-out rate from secondary school and weak vocational training are no doubt real constraints on the UK economy, but there is an equally, if not more, serious one. Housing, commercial property and infrastructure are central to a country’s economic and social well-being. The UK’s essentially rigged market for land and its restrictive planning system are as big an obstacle to economic growth as restrictive labour markets and protected professions are in Southern Europe.

    The number of new homes built each year in Britain has lagged far behind demand from a growing population for 30 years. Despite faster population growth, house construction is currently running at half the level of the 1960s. At the same time the average size of homes built in Britain is now the smallest in the EU. The result of these two trends has been a steady fall in the amount of living space per head. Property prices relative to average household incomes have come down a bit since 2007, but remain very high. Moreover, the problem is not just restricted to the residential sector: Britain has the highest office rents in the EU. Firms in cities such as Manchester pay more than in Frankfurt or Milan. And transport infrastructure is very expensive to build in Britain, which is one reason why there is too little of it.

    Britain is small and densely-populated, but does not suffer from particularly acute land scarcity. Around 13 per cent of the UK is built on, a lower proportion than in countries with a similar population density such as Germany, Belgium or the Netherlands. Britain’s problem is that the supply of new housing and commercial space is uniquely unresponsive to increases in property prices. Alone among the countries that experienced a house price boom in the run up to the financial crisis, Britain had no construction boom. The number of houses being built picked up only slightly, despite UK house prices rising by more than in any other developed countries except Ireland.

    This situation has far-reaching economic and social consequences for the UK. Massive house price inflation has aggravated the UK’s already high levels of inequality by shifting wealth from the young (and property-less) to the old (and propertied). The poor availability of affordable housing undermines labour mobility – people are unable to move to where jobs are available because they cannot afford accommodation. Those on welfare are discouraged from working (as they then lose access to subsidised housing).  Congested, expensive infrastructure combined with pricey commercial property pushes up the cost of business, depresses investment and holds back economic growth.

    The two reasons for Britain’s land-use woes – a complex planning system and insufficient land for development – are inter-related. A major constraint on the supply of land is the existence of a protected ‘greenbelt’: land around cities on which development is very tightly controlled. There are also strict controls over building on other so-called green-field sites. The market for land is essentially rigged in favour of landowners, who pay no tax on their land holdings and hence pay no penalty for sitting on it, waiting for the artificially-created scarcity to push prices up further. With no revenue from land taxes, local authorities are unable to capture any increase in the value of land that takes place when planning permission is granted. As a result, they have little incentive to open up land for development. 

    The UK should, of course, redevelop so-called ‘brownfield’ sites – vacant or derelict buildings and land. But this will only ever comprise part of the solution to its land use crisis. By its very nature, brownfield land is concentrated in parts of the country where people do not want to live. And it is often very expensive to redevelop, not least because the government has stipulated that 60 per cent of new homes must be built on brownfield sites. There is no alternative to building on the green-belt, much of which is neither beautiful nor green. The greenbelt was originally established to combat urban sprawl, but is now an obstacle to sensible development. For example, allowing London to expand by between two and three miles in each direction would easily solve the city’s land-use problems. Increasing that proportion of the UK’s surface area under development by between 1 and 2 percentage points would address the country’s  land constraints  and would not involve concreting over England’s ‘green and pleasant land’. Urban sprawl could easily be prevented by good quality town planning.

    The sanctity of the greenbelt, and green-field land more generally, has much to do with vested interests perpetuating a system which rewards speculation. Many Britons have profited from land scarcity (and the tax-free property price gains it has led to), and are determined to defend those gains. They may complain about their children being unable to buy a house, but at the same time will staunchly oppose new development. For their part, landowners are a powerful and politically well-connected lobby; many of the biggest sit in the House of Lords (the country’s upper house). They have a big stake in inflated land prices and are well-placed to resist the taxation of land.

    A land tax would involve property owners paying a percentage of the value of their land in tax each year. If the value of their property rose, so would the amount of tax paid on it. This would achieve a number of things. First, local authorities would have a financial incentive to change land from agricultural to residential (and commercial) use as they would profit from the increased value of the land this would cause. Second, it would make it more expensive to speculate on future rises in land values, and some of those gains would be captured by the government. Third, construction companies would not be able to sit on large amounts of land (so-called land banks), and drip feed the market, maintaining prices at artificially high levels. Instead, land would have to be developed or sold, which together with the increased availability resulting from the freeing up of greenbelt land, would bring down the price of developing land and with it the cost of housing, commercial property and infrastructure. Lower land costs would also increase competition by reducing barriers to entry to the construction sector: for example, at present housing building is dominated by a small number of big players.

    Supply-side measures are rarely a quick solution to a demand-side crisis. That is certainly the challenge facing other struggling European economies. Spain and France suffer from inflexible labour markets, Germany from over-regulated product and services markets, Italy from both. Academic research shows that addressing such problems improves economic performance in the longer term, but it provides no immediate boost to demand. However, the UK is almost certainly an exception. Addressing Britain’s biggest supply-side problem (its rigged market for land) could provide a more immediate economic stimulus by releasing massive pent-up demand, as well as lift growth potential.

    Britain should turn its weaknesses into strengths. Other struggling European countries have a surfeit of housing and infrastructure and poor demographics. For example, boosting construction in Spain would do no good – Spain has far too many unsold houses and it is now suffering from net emigration (more people are leaving the country than arriving). In Italy and Germany, populations are stagnant, although there is more scope to boost spending on infrastructure than in Spain. France’s population is growing, but as a result of persistently strong public investment, it already has very good physical infrastructure. And thanks to a rational planning system and plenty of land, it does not suffer from a housing shortage. Unlike Britain, these countries have few low-hanging fruit.

    Far-reaching reform of the greenbelt and the introduction of land taxes could open the way for a boom in housing and commercial development. Local authorities and the national government could agree to set aside a proportion of the funds raised through land taxes to fund investment in infrastructure. Moreover, land taxes would make the tax system fairer by taxing unearned income. And by redistributing money from the wealthy (who save a high proportion of their income) to construction sector workers (who save little of it), it would provide a further boost to economic activity. The current Conservative-Liberal government has pushed through modest reforms of the planning system, but has shied away from opening up the greenbelt and has no intention of introducing a land tax. 

    An economy in which speculation is rewarded and wealth is increasingly concentrated in the hands of those with property risks stagnation. It faces an uphill battle to hold on to its young or attract skilled immigrants. Britain needs to strike a better balance between the interests of existing property-owners and the rest of the country. This includes acknowledging that the value of land is determined by the activities of society as a whole and not the landowner, and hence needs to be taxed accordingly.

    Simon Tilford is chief economist at the Centre for European Reform, where this piece originally appeared.

  • Annual Update on World Urbanization: 2013

    Tokyo continues to be the world’s largest urban area with more than 37 million people, according to the recently released 9th Annual edition of Demographia World Urban Areas. Tokyo has held the top position for nearly 60 years, since it displaced New York. There have been only modest changes in the ranking of the world’s largest urban areas over the past year. The top four urban areas remain the same, with Jakarta (Jabotabek) second, Seoul third and Delhi fourth. Fast-growing Shanghai, however, assumed fifth place, displacing Manila where the latest census data showed less population growth than had been expected (Table 1).

    Table 1          
    LARGEST URBAN AREAS IN THE WORLD          
    Rank Geography Urban Area Population Estimate Land Area: Square Miles Density Land Area: Square Kilometers Density
    1 Japan Tokyo-Yokohama 37,239,000 3,300 11,300 8,547 4,400
    2 Indonesia Jakarta (Jabotabek) 26,746,000 1,075 24,900 2,784 9,600
    3 South Korea Seoul-Incheon 22,868,000 835 27,400 2,163 10,600
    4 India Delhi, DL-HR-UP 22,826,000 750 30,400 1,943 11,800
    5 China Shanghai, SHG 21,766,000 1,350 16,100 3,497 6,200
    6 Philippines Manila 21,241,000 555 38,300 1,437 14,800
    7 Pakistan Karachi 20,877,000 310 67,300 803 26,000
    8 United States New York, NY-NJ-CT 20,673,000 4,495 4,600 11,642 1,800
    9 Brazil Sao Paulo 20,568,000 1,225 16,800 3,173 6,500
    10 Mexico Mexico City 20,032,000 790 25,400 2,046 9,800
    11 China Beijing, BJ 18,241,000 1,350 13,500 3,497 5,200
    12 China Guangzhou-Foshan, GD 17,681,000 1,225 14,400 3,173 5,600
    13 India Mumbai, MAH 17,307,000 211 82,000 546 31,700
    14 Japan Osaka-Kobe-Kyoto 17,175,000 1,240 13,900 3,212 5,300
    15 Russia Moscow 15,788,000 1,700 9,300 4,403 3,600
    16 Egypt Cairo 15,071,000 640 23,500 1,658 9,100
    17 United States Los Angeles, CA 15,067,000 2,432 6,200 6,299 2,400
    18 India Kolkota, WB 14,630,000 465 31,500 1,204 12,100
    19 Thailand Bangkok 14,544,000 900 16,200 2,331 6,200
    20 Bangladesh Dhaka 14,399,000 125 115,200 324 44,500
    21 Argentina Buenos Aires 13,776,000 1,020 13,500 2,642 5,200
    22 Iran Tehran 13,309,000 525 25,400 1,360 9,800
    23 Turkey Istanbul 12,919,000 520 24,800 1,347 9,600
    24 China Shenzhen, GD 12,506,000 675 18,500 1,748 7,200
    25 Nigeria Lagos 12,090,000 350 34,500 907 13,300
    26 Brazil Rio de Janeiro 11,616,000 780 14,900 2,020 5,700
    27 France Paris 10,869,000 1,098 9,900 2,845 3,800
    28 Japan Nagoya 10,183,000 1,475 6,900 3,820 2,700
    Source: Demographia World Urban Areas (2013)


    Provisional census results moved Karachi into the top 10 for the first time, while two urban areas, Bangkok and Tehran, reached megacities status (over 10 million population), reflecting strong growth and the availability of more precise data for estimation.

    As before, the most dense megacity was Dhaka, Bangladesh, at 115,000 per square mile (45,000 per square kilometer). New York continues to have the largest urban footprint, covering nearly 4,500 square miles (more than 11,500 square kilometers) and the least dense megacity in the world.

    Coverage

    This year’s Demographia World Urban Areas report provides current and coordinated population, urban land area and density data for all 875 identified urban areas with 500,000 population or more as well as estimates for 650 smaller urban areas. The report includes a total population of approximately 1.86 billion in urban areas with 500,000 or more population and an overall population for urban areas of all sizes of 2.0 billion. These urban areas account for approximately 53% of the world’s urban population.

    Distribution of Population by Urban Area Size

    As was noted in What is a Half Urban World? a considerable share of the world’s urban population lives in smaller urban areas (as small as 200 population). In 2013 is estimated that 51% of the world’s urban population lives in urban areas with less than 500,000 population, based on the data in Demographia World Urban Areas. The 10 largest urban areas, each with over 20 million population, account for approximately 6% of the urban population while the 28 megacities, each with more than 10 million population, account for 13% of the population. Approximately 21% of the urban population is in the more than 375 urban areas with between 1 million and 5 million population (Figure 1).

    The share of the population in larger urban areas is greater in the more developed world than in the developing world. Only 42% of the population lives in urban areas with less than 500,000 population in the more developed world. The share of the population in megacities is greater than the world figure, at approximately 16% (Figure 2).

    A larger share of the population is in smaller urban areas in the developing world, at 54%. Combined, 13% of the developing world population is in the megacities and 20% of the population is in urban areas with between 1 million and 5 million population (Figure 3).

    Distribution of Population by Urban Area Size

    Generally, the larger urban areas have higher average population densities than smaller urban areas (Figure 4). Overall, the urban areas with more than 20 million population have a density of approximately 16,000 per square mile (6,200 per square kilometer), while urban areas between 10 million and 20 million population are nearly as dense at 15,400 per square mile (6,000 per square kilometer). The urban areas with from 5 million to 10 million population are considerably less dense, at 11,100 per square mile (4300 per square kilometer). The smallest urban areas (Note), below 500,000 population are estimated to have a density of approximately 8,100 per square mile (3,100 per square kilometer).

    A similar relationship exists in both the more developed and developing world, with the largest urban areas being considerably more dense than smaller urban areas. The megacities in the  more developed world have an average population density of approximately 9,000 per square mile (3,600 per square kilometer), compared to 3,700 per square mile (1,400 per square kilometer) for urban areas in the 500,000 to one million population range.

    However, urban areas in the developing world are considerably more dense in the less developed world, to be expected given the relationship between lower incomes and higher population densities. Developing world megacities are approximately 2.5 times as dense as megacities in the more developed world. The differences are even greater in smaller urban areas. Developing world urban with less than 5 million population are approximately four times as dense as those in the more developed world (Figures 5 and 6).

    However, megacities in both the more developed and developing world have both population growth and decreasing densities in common. This is illustrated in an examination of megacity trends, which indicates that in recent decades, all 23 examined experienced falling densities. The same is also true of the other five megacities (Karachi, Teheran, Lagos and Paris), which will be described in greater detail in future articles. (see Dispersion in the World’s Urban Areas). Cities everywhere are continuing to expand organically, with nearly all growth on the periphery.

    Distribution of Large Urban Areas

    The world’s largest urban areas are increasingly located in the developing world. Only three of the 10 urban areas with more than 20 million are located in the more developed world, Tokyo, Seoul and New York. Among the 28 megacities, only seven are in the more developed world. More than three quarters of the urban areas with 500,000 or more population are located in the developing world (658 of 875). There is a similar ratio with respect to population, with developing world urban areas having approximately 2.9 million population, while the urban population in the more developed world is approximately 850 million (Table 2).

    Table 2
    DISTRIBUTION OF WORLD URBAN AREAS BY SIZE
    Population More Developed World Developing World World Share in Developing World
    20 Million & Over 3 7 10 70.0%
    10-20 Million 4 14 18 77.8%
    5-10 Million 15 26 41 63.4%
    2.5-5 Million 28 76 104 73.1%
    1-2.5 Million 65 217 282 77.0%
    500,000-1 Million 102 318 420 75.7%
    Total 217 658 875 75.2%
    Source: Demographia World Urban Areas (2013)


    The Future of Urbanization

    This concentration of urbanization in the developing world is likely to become much greater in the decades to come. According to the United Nations, urban population will increase more than 2.5 billion between 2010 and 2050 in less developed regions, compared to less than 150 million in its more developed regions. By 2050, more than  85 percent of the world’s urbanization is expected to be in today’s less developed regions.

    Wendell Cox is a Visiting Professor, Conservatoire National des Arts et Metiers, Paris and the author of “War on the Dream: How Anti-Sprawl Policy Threatens the Quality of Life.

    ——–

    Note: The population density of urban areas under 500,000 is estimated by applying ratios from, Making Room for a Planet of Cities(Shlomo Angel, with Jason Parent, Daniel L. Civco, and Alejandro M. Blei) to the Demographia data.

    Photo: Travel by bajaj in Jakarta (by author)

  • The Ecology of Obesity

    Starting in the mid-nineties, ecologically-minded Americans increasingly came to see farmers markets as a way to bring healthy foods to poor neighborhoods, support local organic agriculture, and even address global warming. During the Bush years, major health philanthropies joined these efforts, making new grocery stores their highest priority in combating obesity, which was disproportionately affecting the poor.

    Food justice advocates were thus taken aback last April when new public health research revealed that there were more grocery stores and supermarkets in poor communities than in middle- and upper-income ones. More importantly, the studies found no relationship whatsoever between childhood obesity and neighborhood food availability. In effect, children who have more access to grocery stores and supermarkets are no more likely to become obese than children who have less. The findings — independently arrived at by two large national studies published by RAND and Social Science and Medicine — landed on the front page of the New York Times.

    The reaction from some advocates was swift and harsh. "I’d love to take a couple of those researchers and drop them in several neighborhoods where I grew up," First Lady Michelle Obama told NPR. "Go get a head of lettuce — one that’s affordable, that’s fresh — and see what happens." Mrs. Obama went on to suggest that poor mothers on the south side of Chicago have to travel five miles to reach a grocery store.

    But Mrs. Obama need only visit the US Department of Agriculture’s online Food Desert Locator to discover that the vast majority of Chicago’s poor live well within walking distance of grocery stores. Just 0.4 percent of Cook County’s 5 million residents are low-income and live more than a mile away from a grocery store or supermarket. In Mrs. Obama’s old neighborhood, fewer than 7,000 poor people have to travel more than a mile.

    It is no exaggeration to say that most Americans, and especially the poorest among us, have greater access to healthy food than ever before. Why, then, the rush to attribute our growing waistlines to a supposed lack of fruits, vegetables, and other whole foods?

    In a major new essay for Breakthrough Journal, sociologist Helen Lee, who authored the Social Science and Medicine study challenging the neighborhood-obesity connection, explains how journalists, public health officials, and food justice advocates got the obesity epidemic so wrong.

    She begins in the late 1990s, when activist journalists and public health officials were less focused on food deserts than with how we had become a "fast food nation." The decision to blame food corporations for our burgeoning waistlines came in part from a misunderstanding of the successes of the tobacco-control movement. Some public health scholars believed that framing smoking as a consequence of corporate power had created a "public opinion environment conducive to public policy solutions that burden powerful groups." 

    Convinced that reducing obesity rates would require a similar effort, scholar-activists advocated targeting food corporations as the source of the obesity epidemic. The problem was that the major declines in smoking came not from the high-profile anti-Joe Camel campaigns of late nineties but rather from decades-long public education efforts about the harms of smoking. 

    Moreover, the relationship between fast food and obesity has always been conjectural. Consider that between 1952 and 1980 the number of McDonald’s franchises skyrocketed from 1 to 8,000, and yet obesity rates remained virtually flat. The rise in obesity rates starting in the nineties and its plateau in the mid-aughts remain as mysterious to public health researchers as the decline in violent crime is to criminologists.

    Moreover, where smoking can result in largely untreatable diseases like lung cancer, obesity is one risk factor among many for diseases that are, in fact, highly treatable. While national health philanthropies were pouring hundreds of millions into farmers markets and grocery stores, better medical care was reducing mortality rates for diabetic adults by an astonishing 25 percent and cardiovascular disease by 40 percent.

    Part of what makes obesity a wicked problem is how existing solutions — farmers markets, anti-corporate marketing — led advocates to frame the problem in particular ways. "The picture painted by advocates of grocery stores and gardens in the inner city was compelling to so many in no small part because it combined an established way of thinking about poor neighborhoods as materially deprived along with rising cultural support from middle-class Americans for eating healthier, locally grown foods," Lee writes.

    The new research has not exactly inspired food justice advocates to rethink their approach. "Obesity is declining in Philadelphia because of a network of people dedicated to helping vulnerable children and families," asserted the head of the Kellogg Foundation recently. And yet another journalist, Pulitzer-winning New York Times reporter Michael Moss, is out with a book (subtitle: How the Food Giants Hooked Us) reducing the obesity epidemic to food companies. 

    To be sure, food corporations have played a role in making the obesity epidemic. They must exercise greater responsibility. And farmers markets can be a way to both deliver fresh produce and build community.

    But in focusing so narrowly on food availability, many in the public health and philanthropic communities lose sight of the far more important determinants of health and well-being. "For the poor,” Lee writes, “the problem has less to do with food deserts and more to do with income deserts, college degree deserts, and quality health care deserts.” 

    Confronting the negative impacts of obesity on low-income Americans means confronting difficult social problems like inter-generational poverty, inadequate access to health care, under-performing schools, and myriad barriers to higher education. It requires a perseverance over decades, and a commitment to getting the science right.

    Easier to build more farmers markets.

    Shellenberger and Nordhaus are co-founders of the Breakthrough Institute, a leading environmental think tank in the United States. They are authors of Break Through: From the Death of Environmentalism to the Politics of Possibility.

    This piece originally appeared at TheBreakthrough.org.

    Photo Credit: Lance Cheung/USDA