Category: Urban Issues

  • Commuting in Australia

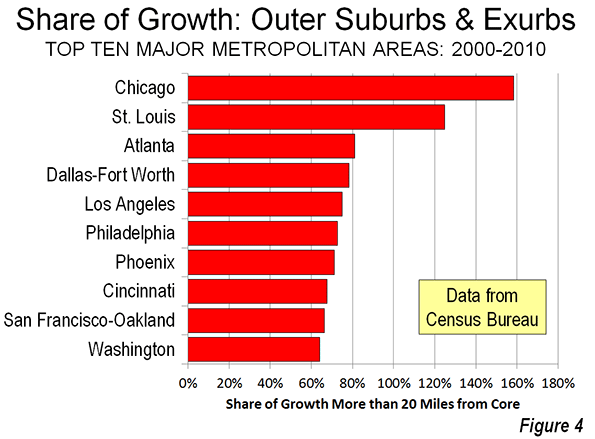
    Data from the 2011 censuses indicates that mass transit is gaining market share in all of but one of Australia’s major metropolitan areas. The greatest increase as in Perth, at 21% , aided by the new Mandurah rail line to the southern urban fringe. On average, mass transit’s market share increased by 10.8% in the five metropolitan areas with more than 1 million population. This increase seems likely to be in response to both mass transit service improvements (such as in Perth) and higher petrol (gasoline) prices. The highest mass transit market share is in Sydney, at 22%, approximately equal to that of Toronto and greater than all major US metropolitan areas except New York (31%). Adelaide has the smallest transit market share, at 9.5%, which is nonetheless 50% above that of Portland, to which Adelaide officials have often looked as a model (Figure 1).

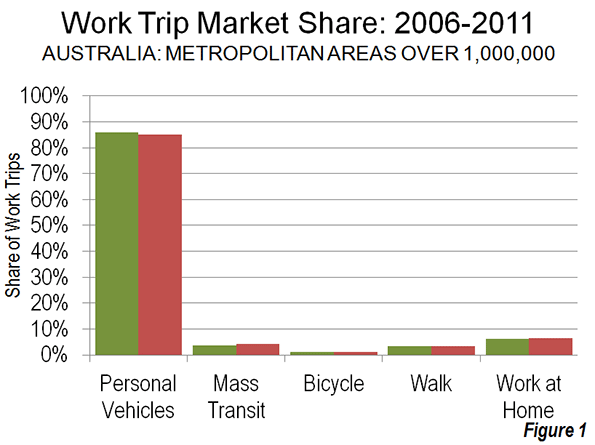
    At the same time, there was a personal vehicle (automobiles, motorcycles, taxis and trucks) market share in all 5 metropolitan areas, averaging 2.2% (Table). However, the much larger base of personal vehicle use prevented mass transit from materially reducing the share of the automobile in any of the metropolitan areas.

    Work Trip Market Share 2006-2011
    Major Metropolitan Areas in Australia
    2000 Personal Vehicles Mass Transit Bicycle Walk (Only) Work at Home Other
    Adelaide 81.2% 9.6% 1.5% 3.1% 3.5% 1.2%
    Brisbane 76.5% 13.2% 1.1% 3.5% 4.5% 1.2%
    Melbourne 76.7% 13.3% 1.3% 3.4% 4.2% 1.1%
    Perth 80.8% 10.0% 1.1% 2.5% 4.1% 1.5%
    Sydney 69.0% 20.3% 0.6% 4.7% 4.4% 1.0%
    Average 76.8% 13.3% 1.1% 3.5% 4.1% 1.2%
    2010
    Adelaide 81.1% 9.5% 1.3% 2.8% 3.7% 1.6%
    Brisbane 75.1% 14.3% 1.2% 3.5% 4.6% 1.4%
    Melbourne 74.5% 15.4% 1.5% 3.3% 4.1% 1.2%
    Perth 78.1% 12.1% 1.2% 2.6% 3.9% 2.0%
    Sydney 66.9% 22.2% 0.8% 4.6% 4.4% 1.1%
    Average 75.2% 14.7% 1.2% 3.4% 4.1% 1.4%
    Change in Market Share
    Adelaide -0.1% -0.6% -12.2% -7.4% 4.6% 32.1%
    Brisbane -1.8% 8.3% 10.5% 0.3% 0.5% 14.4%
    Melbourne -2.9% 15.6% 17.2% -4.4% -1.0% 10.8%
    Perth -3.3% 21.0% 11.3% 4.0% -3.9% 30.2%
    Sydney -2.9% 9.4% 30.3% -3.6% -0.4% 11.1%
    Average -2.2% 10.8% 11.4% -2.2% 0.0% 19.7%
    Source: Calculated from Australian Bureau of Statistics data


    Unlike the United States, where working at home is the fastest growing method of work access (and likely to pass mass transit in this decade), Australia’s working at home share has stayed constant. Working at home is also increasing in Canada.  

    Mass Transit: About Downtown

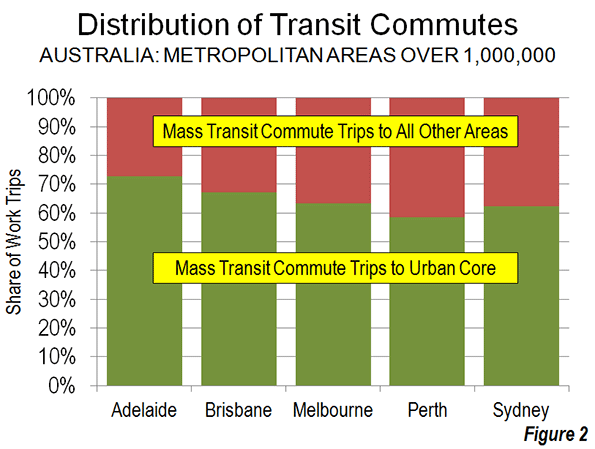
    In Australia, as in Canada and the United States, mass transit is dominated by commuting to the central business district (downtown). On average, 65% of mass transit commuters had a work trip destination in the urban core, which includes the central business district (downtown). This ranges from a low of 59% in Perth to a high of 73% in Adelaide (Figure 2). This concentration of mass transit destinations in the central business district is epitomized by Sydney, where there was a core share of all trips of nearly 60%. By contrast, in Parramatta, which includes one of the largest suburban business centers, is well served by not only the region’s rail system but also by an exclusive busway, the mass transit market share was 15%, one-fourth that of Sydney’s core.

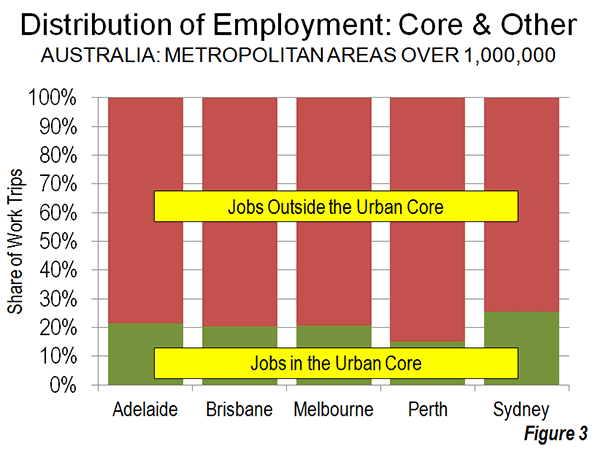
    In the five large Australian metropolitan areas, nearly 21% of jobs are located in these urban core areas that include the central business district (Figure 3). The difficulty for transit in serving the nearly 80% of work trip destinations outside the urban core lies with far lower employment densities and mass transit travel times not remotely competitive with the automobile (on the assumption that services even available). On average, mass transit carries 200 times as many commuter to each square kilometer of core land area for each commuter carried per square kilometer in the rest of the urban area (urban centre).

    It is not surprising that the central business districts dominate mass transit commuting. They are the only locations in virtually any urban area that have a sufficient employment densities and a comprehensive enough radial rapid transit system to provide no-transfer service to a large number of riders.

    Australia’s Long Work Trip Travel Times

    The growth of transit has not reduced travel times but may have boosted it. In fact Australia’s workers already are traveling for longer times to work than in nearly all similar- or larger-sized metropolitan areas in Canada and the United States (Figure 4). For example, the average one-way work trip travel time in Melbourne is 36 minutes, which is longer than that of any major metropolitan area in the US or Canada.  Sydney’s one-way work trip travel time is 34 minutes. This exceeds that of all similarly sized or larger metropolitan areas in the three countries with the exceptions of New York and Washington, which are larger. In Improving the Competitiveness of Metropolitan Areas, I cited Statistics Canada data showing that mass transit work trip travel is much longer than by car and that transferring demand to transit would not improve average travel times.

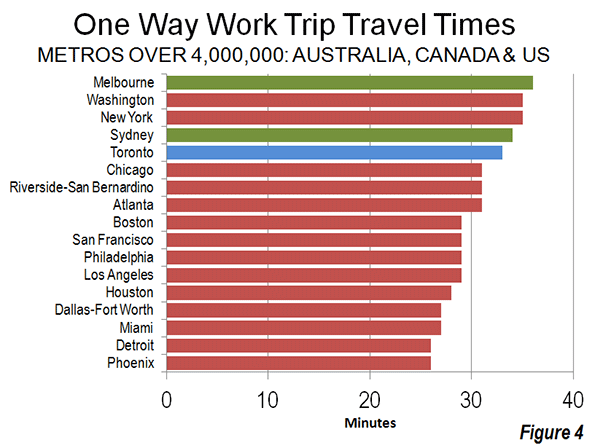
    Both Melbourne and Sydney have slightly longer one-way travel times than larger Toronto, which is also larger, at 33 minutes. The Toronto Board of Trade, the Federation of Canadian Municipalities, and the Canadian Urban Transit Association have all expressed serious concern about Toronto’s long journey to work time, noting that it places is a competitive disadvantage relative to other metropolitan areas.

    Melbourne and Sydney also have longer one-way travel times than all of the other 12 US metropolitan areas with more than 4 million population. Perhaps the starkest comparison is with Los Angeles, often cited as having some of the worst traffic congestion in the high income world. Yet, despite having a urban population density higher than that of either Melbourne or Sydney and a far lower transit work trip market share, Los Angeles has a one-way work trip travel time of 28 minutes The secret in Los Angeles, is more dispersed work locations and a more comprehensive freeway system (though major parts of the planned freeway system were not built).

    Far starker is the comparison with Dallas-Fort Worth, which has a population density well below that of both Melbourne and Sydney and a much lower transit work trip market share (2%, compared to 22% in Sydney and 15% in Melbourne). Yet, in Dallas-Fort Worth, the average work trip travel time is 26 minutes, a full quarter less than in Melbourne and 8 minutes less than in Sydney.

    Where Should Planners "Put" People?

    A recent Infrastructure Australia report (The State of Australia’s Cities: 2012) cites "Marchetti’s Constant," which it characterizes as holding that "people will devote on average 90 minutes a day to travel and no more." (In fact, 90 minutes represents is a full 30 minutes greater than Marchetti indicates: See Note on Marchetti’s Constant).

    Infrastructure Australia continues "This suggests that improving the efficiency of urban transport systems by putting people in their economically optimal location within a total travel time of 90 minutes may be the key to improving the productivity of cities."

    "Putting people" where they have total travel time of 90 minutes seems a pessimistic goal; Sydney’s average daily travel time is now nearing 80 minutes. This justifies policy makers to further increase its already non-competitive work trip travel times. Economic research associates maximizing the number of jobs that can be reached by people in a metropolitan area in a specified time (such as 30 minutes) is critical to improving city productivity  (see The Need to Expand Personal Mobility.)

    The issue is not where to "put" people, but rather to facilitate more rapid access for commuters throughout the metropolitan area.

    Things are Likely to Get Worse

    In the end, there is only so much mass transit can do. Already the Australian metropolitan areas have high transit commute market shares to the cores, which leaves only modest room for improvement. At the same time there is little potential for material increases elsewhere in the metropolitan areas. Automobile competitive transit to these locations would be cost prohibitive, perhaps requiring annual expenditures rivaling the total income of the metropolitan area each year for operations, capital costs and debt service (see Megacities and Affluence: Transport and Land Use Considerations).

    Australian urban areas are generally underserved by freeways, despite their overwhelming reliance on personal vehicle travel. At the same time, urban consolidation, “smart growth” land use policies are increasing population densities without accommodating the inevitable associated additional personal vehicle demand (see Urban Travel and Urban Population Density). Things could get worse.

    Wendell Cox is a Visiting Professor, Conservatoire National des Arts et Metiers, Paris and the author of “War on the Dream: How Anti-Sprawl Policy Threatens the Quality of Life.

    —–

    Methodology: The analysis is based upon Australian Bureau of Statistics (ABS) data for capital city statistical divisions. The urban core was defined as the following local government areas: Sydney, North Sydney, Melbourne, Perth and Adelaide. In Brisbane, where the local government area is far larger, the inner Brisbane census division was used. Consistent data is limited to the central business district is not readily available. All trips which include transit as a mode are counted as transit. Workers who did not work on census day or who did not provide information were excluded from the analysis.

    Note on "Marchetti’s Constant:" Not only does Marchetti find a 60 minute, rather than a 90 minute average, but he also credits Zahavi of the World Bank with the concept, noting that with respect to travel:  "The empirical conclusion reached by Zahavi is that all over the world, the mean exposure time for man is around one hour per day.” While there are few references to Marchetti’s Constant in the academic literature, it might be more appropriately named "Zahavi’s Constant." In a further irony, Professor Peter Newman, a member of the board of Infrastructure Australia, cited 60 minutes (echoing Marchetti), rather than the 90 minute average in describing the "Zahavi/Marchetti Constant" in a Sydney Morning Herald commentary ("Why We’re in Reaching Our Limits as a One-Hour City" ).

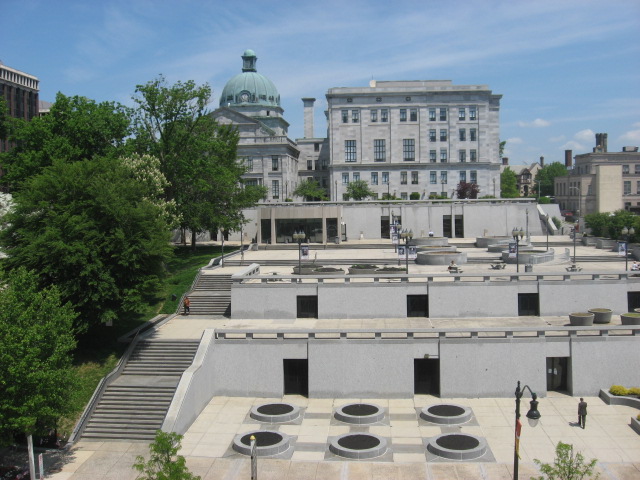
    Photo: Downtown Brisbane (by author)

  • What Killed Downtown?

    What Killed Downtown?: Norristown, Pennsylvania, from Main Street to the Malls
    by Michael E. Tolle

    For those of us who have grown dyspeptic on the over-indulged topic of the collapse of the American city center, Michael Tolle’s What Killed Downtown? Norristown, Pennsylvania, from Main Street to the Malls earns much of its anodyne appeal by straying from a commonly accepted convention in urban studies—that an analysis of the socioeconomic decline of a community should draw heavily upon socioeconomic variables. Isn’t there another way to get the point across? And more importantly, aren’t there other contributing factors?

    This compassionate narrative of the 20th century rise and fall of an older Philadelphia suburb avoids graphs and charts for the most part, becoming much more engaging for its alternative approach. And likeability is exactly what it will need to win over skeptics, or the merely apathetic, because most people in the US probably have never heard of Norristown. In fact, it’s likely that quite a few people on the other side of the Keystone State aren’t familiar with it either. After all, the borough at its 1960 peak only had 39,000 inhabitants (the 2010 Census records a population of 34,000). But Norristown merits further observation, not so much because its downtown has declined in the mid-20th century—that happened everywhere, in municipalities of all sizes—but because Norristown sits squarely in the middle of Montgomery County, an expansive bedroom community of Philadelphia with 800,000 people and a median household income of over $78,000, placing it within the top 100 wealthiest counties in the nation. Meanwhile, Norristown’s median household income, according to the latest Census, is approximately $43,000 and its poverty level of 16.4% is almost triple that of the county’s 5.7%, and still a fair amount higher than the state’s rate of 12.6%. While Montgomery County boomed over the last half century, Norristown has not shared in that prosperity. It is by no means a devastated town—many old neighborhoods remain charming and fully intact—but the commercial heart of Norristown has never healed.

    The above paragraph contains a higher concentration of raw data than one should ever expect to encounter in Tolle’s new book. Rather than delving into the Bureau of Labor Statistics, the US Census Bureau, or rankings from Urban Land Institute or the Brookings Institution, Tolle manages to chronicle the rapid ascent of this suburban outpost, its 75-year dominion over commercial activity within the county, and its precipitous decline shortly after the Second World War—and he achieves it through a diligent perusal of old city directories, interviews with almost two dozen of Norristown’s older citizenry, and a vigorous exploration of the internal machinations of the Borough Council. He applies an anthropologist’s lens to a subject that sociologists have long overcrowded.

    While Norristown’s early history—first as a manor under one of William Penn’s initial surveys, followed by a subdivision into smaller farms by Isaac Norris in 1712—is clearly never the focal point for Tolle’s methodical dissection of downtown, he avoids glossing over it. Not surprisingly, Norristown emerged as the most desirable plot of land in the sprawling manor because of its accessibility: it abutted the “canoeable part of the Schuylkill” and the interconnected American Indian trails that allowed for easy fording of the river. By 1784, the Pennsylvania Assembly carved Montgomery County out of the existing Philadelphia County, and a subsequent deed conveyed lots reserved for county buildings at the intersection of two of the only extant roads at the time. Due to its advantageous location, it became a nearly self-sufficient Town of Norris within a few years, abiding by Penn’s “Town Model” for Philadelphia and other Pennsylvania cities, employing tightly organized, gridded streets that maximized uses of available space. The construction of some of the earliest turnpikes helped to stimulate the town’s steady growth and prepare it for its incorporation as a borough of 520 acres in 1812, followed shortly thereafter by the rail networks that galvanized further expansion.


    Swede Street just north of Main Street, known by some as Lawyers’ Row. Photo from Spring 2011, courtesy of Matthew Edmond.

    The early chapters of the book may only provide a backdrop for Norristown’s 20th century rise and fall, but Tolle chronologically accounts for the factors that helped Norristown emerge as the primary urban center in Montgomery County. And unlike neighboring 19th century boomtowns that dot both the Delaware and Schuylkill Valleys, Norristown “lacked the characteristics that define similar towns of sufficient size and influence that could easily explain the downtown’s decline. . . [It] was never a one-company town. It was never dependent on [a] single employer whose corporate fate might have led it to a catastrophic domino effect; rather Norristown’s workforce has always been distributed among many workplaces.” It owed much of its steady growth to its fortuitous location 17 miles northwest of Philadelphia, the convergence of several modes of transportation, and its role as the administrative center of a large and increasingly prominent county.

    By the book’s twentieth page, Tolle reveals the real heart of his study: the bustling commercial core of Norristown’s six-block Main Street. At the borough’s Centennial Celebration, population approached 30,000, swelling largely from immigrants who arrived to work in various industries: first the northern European Protestants, then the Irish, then, in by far the highest concentration, the Italians, overwhelmingly from Sicily. Mennonites, Amish, and Jews (predominantly of German heritage) along with African Americans arrived in smaller numbers. While the population self-segregated along largely ethnic and economic lines (working and lower-middle class Protestants on the West End; the wealthy, Northern European original settlers in the North End and DeKalb Street; Italians and African Americans in the blue-collar East End), all the strata converged along Main Street’s densely commercialized blocks. Tolle explores the full week’s worth of celebratory activities, from the details of the floats in the Industrial Day parade to overhead weave of flags, bunting, and electrical wires. The pace of the narrative slows at this point, but Tolle employs a humanism that he retains across the ensuing pages. When he intermittently bogs down in relentless detail, he’s easily forgivable—even a little admirable for not shying away from his obsessions.


    A view of DeKalb Street, Norristown’s most affluent residential address, from its southern junction with Main Street. This was once the center of commercial activity in the borough. Tolle details the controversy of the implementation of the Comprehensive Plan to make DeKalb Street one-way northbound in 1951, a restriction which remains today. Photo from Spring 2011, courtesy of Matthew Edmond.

    The Directory of the Boroughs of Norristown and Bridgeport, Montgomery County, Pa, for the years 1860-1861 serves as the bedrock for his chronological exploration of the commercial health of downtown Norristown. For some of the most resilient businesses—Chatlin’s Department Store, Egolf’s Furniture, Zummo’s Hardware—Tolle offers vignettes on their immigrant backgrounds and the financial maneuvering necessary to start their trades. Interspersed with these brief accounts are updates from subsequent City Directories, chronicling the change in business composition over time. But Tolle generally eschews tables and charts—with few exceptions, he narrates the changing commercial landscape of Norristown by integrating the livelihoods of the proprietors with the demands of the consumers. Because the authorial voice depends so heavily on firsthand accounts of the business climate—articles from the Norristown Times Herald, advertisements (including misspellings and solecisms), and, in the later years, eyewitness accounts—the routine references to City Directory data never grow stuffy or monotonous.


    What Killed Downtown? is a concatenation of anecdotes. While such an indulgence in human-interest nostalgia could take a maudlin turn, Tolle again counterbalances these episodes with moments of acerbic subjectivity, as any conscientious anthropologist cannot help but do. My two favorite anecdotes feature a building and a person. The Valley Forge Hotel emerged in the roaring 1920s, purely driven by the local business community, who felt that the proud city demanded a first-class hotel. A stock subscription campaign raised enough to complete the massive six-story brick structure by November of 1925. Though it rarely made a profit, its size and relative opulence made it an icon for the city, and as an emblem of civic pride, it succeeded. The other great anecdote involves the detailed account of the life of the city’s most colorful politician, the recalcitrant Paul Santangelo. Lacking greater aspirations than borough administration, Santangelo earns more ink on these pages than any other civic leader, including the mayors. He fiercely defended the interests of the poorer Sicilian immigrants who comprised much of his district, voting ferociously in their favor but often—in Tolle’s opinion—at the expense of city progress as a whole.


    Norristown Main Street, west of Swede Street and looking westward. Photo from Spring 2011, courtesy of Matthew Edmond.

    Tolle’s account of Norristown’s Main Street after its 1950 apex avoids mind-numbing predictability even has he identifies the usual culprits contributing to its decline: growing dependence on the automobile, competition from suburban shopping plazas like the now-mammoth King of Prussia, shift of the population center toward the far-southern part of Montgomery County, construction of limited access highways outside of the borough’s limits. And of course, all these factors converge with the suburban amenity that wounds Norristown the most: “free, ample parking”—a mantra which Tolle repeats enough that it tacitly answers the question to his book’s title. Anyone with a scintilla of knowledge of American urbanism will know where this is headed. But by the1950s, Tolle reaches a point in time where procures firsthand accounts of Main Street’s changes. The worm’s-eye view continues, imbuing the narrative of Norristown’s saddest days—by the 1970s it is not safe to walk Main Street at night—with empathy and hope.


    Courthouse Plaza along Main Street, one of many mid-century projects that removed commercial buildings and replaced them with staid, largely unused civic space. Photo from Spring 2011, courtesy of Matthew Edmond.

    For a person as enamored by details as me, Tolle’s worm’s-eye view never really grows old, even when he’s a fussbudget over counts of shuttered storefronts from year to year. At the same time, this intricate approach to an already small subject could easily undermine the ability for What Killed Downtown? to find a broad audience. What happens to a little-known suburban city can hardly resonate as much as if he had explored the devolution of downtown Philadelphia—or even Allentown or Erie. The fixation on downtown storefronts—at the expense of geographic context—firmly ensconces the book in the “local interest” category. His 250-page narrative rarely explores impacts on Norristown Main Street outside of Montgomery County. From an early point in the book, he describes street intersections with specificity that would only mean anything to a local; then he only provides two referential maps.

    None of these cavils really amount to an inherent weakness of the book—after all, it might prove just the right medicine for Tolle’s fellow Norristowners. But the narrowness of scope does foretell an oversight as to the broader implications for this city’s decline, which could have made for a much bolder peroration than the one the book currently provides. The only atypical bogeyman contributing to downtown Norristown’s precipitous decline is the persistent political gridlock and resultant incompetence of the Borough Council, which he relates with the same humanist eye he applies to his wonderful vignettes of immigrant entrepreneurialism. But Tolle had the chance to make this story matter on a scale that could mean something to someone from Ashtabula or Waukegan, and he spurned the opportunity.

    My knowledge of Philadelphia, having lived there for a time, gives me an unfair advantage, but I can’t help but ask a few questions. Norristown, the seat of wealthy Montgomery County, declined and its main street is moribund to this day. But Media, the much smaller seat of neighboring Delaware County, boasts a flourishing main street of local shops and restaurants—all despite the fact that Delaware County, while equally urbanized, is much less affluent than Montgomery County. Meanwhile, cities like Chester (also in Delaware County) and Camden, New Jersey can claim a similar lifespan to Norristown, strong transportation access, and an industrial boom. But today these two cities are not only among the most devastated municipalities in their respective states, Chester and Camden are among the poorest cities in the country. Perhaps most interestingly, after several decades of population decline, Norristown began to trend upward again in the 2000 census, and by the 2010 Census the city grew virtually 10%–an unprecedented occurrence for a city that still has the reputation of being the poorest place in its respective county.

    What Killed Downtown? remains a welcome contrast to countless other chronicles of downtown decline whose narratives depend on sociological detachment. Recognizing that true objectivity is impossible, Tolle instead depicts the Norristown transformation from the perspective of people who experienced it. Because its vision is geographically precise and obscure to people outside southeast Pennsylvania, I suspect our author felt driven to write it even if it enjoyed a readership of zero. Such an endeavor could reek of self-indulgence, but Michael Tolle’s opus has way too much empathy for that. Hopefully Norristown’s coterie of model train owners and newspaper collectors will put this book on their to-do lists—and then recommend it to others.

    Eric McAfee is a licensed urban planner currently working in emergency management. Though he hails from Indianapolis, his professional field grants him a certain degree of itinerancy, which he uses to his advantage to write about and photograph landscapes across the country in his blog, American Dirt. He lived and worked as a military planner in northern Afghanistan from 2010 to 2012, letting him fudge on the “American” aspect of his blog a little bit. In the past, Eric’s writing has won him Outstanding Paper in Real Estate at the University of Pennsylvania, as well as an outstanding research on housing award from the Joint Center for Housing Studies at Harvard University.  Aside from American Dirt, he has featured his writing on Urban Indy.com, Streetsblog.net, and Urbanophile.com. 

  • Richard Florida Concedes the Limits of the Creative Class

    Among the most pervasive, and arguably pernicious, notions of the past decade has been that the “creative class” of the skilled, educated and hip would remake and revive American cities. The idea, packaged and peddled by consultant Richard Florida, had been that unlike spending public money to court Wall Street fat cats, corporate executives or other traditional elites, paying to appeal to the creative would truly trickle down, generating a widespread urban revival.

    Urbanists, journalists, and academics—not to mention big-city developers— were easily persuaded that shelling out to court “the hip and cool” would benefit everyone else, too. And Florida himself has prospered through books, articles, lectures, and university positions that have helped promote his ideas and brand and grow his Creative Class Group’s impressive client list, which in addition to big corporations and developers has included cities as diverse as Detroit and El Paso, Cleveland and Seattle.

    Well, oops.

    Florida himself, in his role as an editor at The Atlantic, admitted last month what his critics, including myself, have said for a decade: that the benefits of appealing to the creative class accrue largely to its members—and do little to make anyone else any better off. The rewards of the “creative class” strategy, he notes, “flow disproportionately to more highly-skilled knowledge, professional and creative workers,” since the wage increases that blue-collar and lower-skilled workers see “disappear when their higher housing costs are taken into account.” His reasonable and fairly brave, if belated, takeaway: “On close inspection, talent clustering provides little in the way of trickle-down benefits.”

    One group certain to be flustered by this new perspective will be many of the cities who have signed up and spent hard cash over the years to follow Florida’s prescription of focusing on those things—encouraging the arts and entertainment, building bike paths, welcoming minorities and gays—that would attract young college-educated workers. In his thesis, the model cities of the future are precisely those, such as San Francisco and Seattle, that have become hubs of highly educated migrants, technology, and high-end business services.

    That plan, though, has been less than successful in many of the old rust belt cities that once made up much of his client base. Perhaps even more galling to these cities, Florida has turned decidedly negative in his outlook on many of those cities—now looking remarkably gullible—that once made up much of his client base.

    The most risible example of this may have been former Michigan Jennifer Granholm’s “cool cities” campaign of the mid-oughts, that sought to cultivate the “creative class” by subsidizing the arts in Detroit and across the state. It didn’t exactly work. “You can put mag wheels on a Gremlin,” comments one long-time Michigan observer. “but that doesn’t make it a Mustang.”

    Alec MacGillis, writing at The American Prospect in 2009, noted that after collecting large fees from down-at-the-heels burgs like Cleveland, Toledo, Hartford, Rochester, and Elmira, New York over the years, Florida himself asserted that we can’t “stop the decline of some places” and urged the country to focus instead on his high-ranked “creative” enclaves. “So, got that, Rust Belt denizens?” MacGillis noted wryly in a follow-up story last year at the New Republic. Pack your bags for Boulder and Raleigh-Durham and Fairfax County. Oh, and thanks again for the check.”

    One key constituency advocating “creative class” oriented development has been the grandees of urban real estate. Albert Ratner of Cleveland-based Forest City Enterprises, a major urban developer with a taste for subsidies, in New York and elsewhere, suggests Florida’s ideas provides the “playbook for developers.”

    For Rust Belt cities, notes Cleveland’s Richey Piiparinen, following the “creative class” meme has not only meant wasted money, but wasted effort and misdirection. Burning money trying to become “cooler” ends up looking something like the metropolitan equivalent to a midlife crisis.

    It would have been far more sensible, Piiparinen suggests, for such areas to emphasize their intrinsic advantages, such as affordable housing, a deep historic legacy tied to a concentration of specific skills as well as a strategic location. He urges them to cultivate their essentially Rust-Belt authenticity rather than chase standard issue coolness promoted by big developers like Forest City. Focusing on attracting the “hip cool” single set, Piiparinen maintains, simply sets places like Cleveland up for failure.

    Geography of Hip Coolness

    Perhaps the best that can be said about the creative-class idea is that it follows a real, if overhyped, phenomenon: the movement of young, largely single, childless and sometimes gay people into urban neighborhoods. This Soho-ization—the transformation of older, often industrial urban areas into hip enclaves—is evident in scores of cities. It can legitimately can be credited for boosting real estate values from Williamsburg, Brooklyn, Wicker Park in Chicago and Belltown in Seattle to Portland’s Pearl District as well as much of San Francisco.

    Yet this footprint of such “cool” districts that appeal to largely childless, young urbanistas in the core is far smaller in most cities than commonly reported. Between 2000 and 2010, notes demographer Wendell Cox, the urban core areas of the 51 largest metropolitan areas—within two miles of the city’s center—added a total of 206,000 residents. But the surrounding rings, between two and five miles from the core, actually lost 272,000. In contrast to those small gains and losses, the suburban areas—between 10 and 20 miles from the center —experienced a growth of roughly 15 million people.

    The smallness of the potentially “hip” core is particularly pronounced in Rust Belt cities such as Cleveland and St. Louis, where these core districts are rarely home to more than 1 or 2 percent of the city’s shrinking population. Yet the subsidy money for developers is often justified in the name of “reviving” the entire city, most of which has continued to deteriorate.

    Nor has this dynamic changed since the onset of the Great Recession, as urban boosters such as Aaron Ehrenhalt have suggested. Ehrenhalt, citing the perceived preferences of millennials, envisions an urban future where more reject the suburban life, in part as a reaction to the wreckage of the last housing bust. To Ehrenhalt, places like downtown Chicago are emerging as the modern-day version of early-20th-century Vienna, central cores that attracted the elites while the working class and middle class dullards regress to the suburbs. Yet in reality, an examination of data between 2011 and 2012 by Jed Kolko at Trulia found despite a spike in downtown residents, population losses continue in surrounding close-in urban neighborhoods, while the fastest growth has continued to be located further out in the periphery.

    Class Politics in the “Creative Age”

    Investments in “cool” districts may well appeal to some young professionals, particularly before they get married and have children. But overall, as Florida himself now admits, it has done little overall for the urban middle class, much less the working class or the poor.

    Indeed in many ways the Floridian focus on industries like entertainment, software, and social media creates a distorted set of economic priorities. The creatives, after all, generally don’t work in factories or warehouses. So why assist these industries? Instead the trend is to declare good-paying blue collar professions a product of the past. If you can’t find work in deindustrialized Michigan, suggests Salon’s Ray Fisman, one can collect “ more than a few crumbs” by joining the service class and serving food, cutting hair or grass in creative capitals like San Francisco or Austin.

    These limitations of the “hip cool” strategy to drive broad-based economic growth have been evident for years. Conservative critics, such as the Manhattan Institute’s Steve Malanga have pointed out that many creative-class havens often underperform economically compared to their less hip counterparts. More liberal academic analysts have denounced the idea as “ exacerbating inequality and exclusion.” One particularly sharp critic, the University of British Columbia’s Jamie Peck see it as little more than a neo-liberal recipe of “biscotti and circuses.”

    Urban thinker Aaron Renn puts it in political terms: “the creative class doesn’t have much in the way of coattails.”

    Why Hipness Can’t Save New York

    The sad truth is that even in the more plausible “creative class” cities such as New York and San Francisco, the emphasis on “hip cool” and high-end service industries has corresponded with a decline in their middle class and a growing gap between rich and poor. Washington D.C. and San Francisco, perennial poster children for “cool cities,” also have among the highest percentages of poverty of any major urban center—roughly 20 percent—once cost of living is figured in.

    Nowhere are the limitations of coolness more evident than in New York, our country’s cultural capital and now one of Florida’s three residences, along with Toronto and Miami Beach. Manhattan suffers by far the highest level of inequality among the country’s 25 most populous counties, a gap between rich and poor that’s the widest it’s been in a decade. New York’s wealthiest one percent earns a third of the entire city’s personal income—almost twice the proportion for the rest of the country.

    This geography of inequality is now extending to the outer boroughs. In nouveau hipster and increasingly expensive Brooklyn, nearly a quarter of people live below the poverty line. While artisanal cheese shops and bars that double as flower shops serve the hipsters, one in four Brooklynites receives food stamps. New York has seen the nation’s biggest rise in homelessness; the number of children sleeping in the shelters of Mike Bloomberg’s “luxury city” has risen 22 percent in the past year.

    The Issue of Race

    On paper, the “creative class” theory worships at the altar of diversity. “The great thing about cities,” Florida told NPR last year, “is they’re diverse. There’s diverse people in them.” Yet even leaving aside their lack of economic diversity, the exemplars of “hip cool” world, notes urban analyst Renn, tend to be vanilla cities with relatively small minority populations. San Francisco, Portland and Seattle are becoming whiter and less ethnically diverse as the rest of the country, and particularly the suburbs, rapidly diversify.

    Creatives may espouse politically correct views, but the effect of Florida’s policy approach, notes Tulane sociologist Richard Campanella, often undermine ethnic communities. As they enter the city, creatives push up rents, displacing local stores and residents. In his own neighborhood of Bywater, in New Orleans, the black population declined by 64 percent between 2000 and 2010, while the white population increased by 22 percent.

    In the process, Campanella notes, much of what made the neighborhood unique has been lost as the creatives replace the local culture with the increasingly predictable, and portable, “hip cool” trendy restaurants, offering beet-filled ravioli instead of fried okra, and organic markets. The “unique” amenities you find now, even in New Orleans, he reports, are much what you’d expect in any other hipster paradise, be it Portland, Seattle, Burlington, Vermont or Williamsburg.

    Families and the Future

    Campanella also suggests another byproduct of hipster gentrification: a dearth of families. Ten years ago his increasingly “creative class” neighborhood of Bywater was family oriented. Now, it’s “a kiddie wilderness.” In 2000, 968 youngsters lived in the district. Just 10 years later, the number had dropped by 70 percent, to 285. When his son was born in 2012, it was the first post-Katrina birth on his street, the sole child on a block that had 11 when he first arrived from Mississippi in 2000.

    Unsurprisingly, there’s not much emphasis about families in Florida’s work, in part because his basic theory puts focuses largely on groups like singles, childless young professionals and gays. He largely discounts suburbs, generally the nation’s nurseries, as outdated for the “creative age” and considers homeownership and single family houses, also vastly preferred by families, as fundamentally passé.

    Indeed, the places that most attract “the creative class” are also the ones with the fewest families and children, led by San Francisco, Seattle, Manhattan, and rapidly gentrifying Washington, D.C. The very high prices per square foot, understandably celebrated by urban real estate boosters, have made it hard not only on the poor but on middle- and even upper-middle-class families. When you have children, you often have to let go of your bohemian fantasies; it’s hard to imagine being a parent in a place like San Francisco where there are a raging debates about the right of people to walk around naked.

    The Real Geography of Opportunity

    To be sure, the leading “creative class” cities have much to recommend them, and some of them, such as Portland and Boston, have registered impressive rises in their per capita income in recent years. But over the past decade, most “cool cities” have not been enjoying particularly strong employment or population growth; in the last decade, the populations of cities like Charlotte, Houston, Atlanta, and Nashville grew by 20 percent or more, at least four times as rapidly as New York, Los Angeles, San Francisco, or Chicago. This trend toward less dense, more affordable cities is as evident in the most recent census numbers than a decade.

    One reason for this: the fastest job growth has taken place in regions—Houston, Dallas, Oklahoma City, Omaha—whose economies are based not on “creative” industries but on less fashionable pursuits such as oil and gas, agriculture and manufacturing. Energy mecca Houston, for example, last year enjoyed the largest GDP growth of any major American city, easily outpacing “creative” urbanist favorites like Chicago, New York, San Francisco, or Boston. The other two top GDP gainers were Dallas-Fort Worth and, surprisingly, Detroit, largely as a result of the auto industry’s comeback.

    Of course, some these ascendant cities now are sprouting their own “hip” neighborhoods. But these regions also accommodate far faster growth in rapidly expanding, family-friendly suburbs and exurbs. Equally important, none, including “creative class” hotspots Raleigh and Austin, are dense, transit-centered places of the kind urbanists suggest create economic vibrancy and attract the largest number of migrations.

    In fact both Raleigh and Austin are both very low-density regions with only compact urban pockets surrounded by vast suburban communities. Take a walk in downtown Raleigh sometime; about five minutes from the densest central areas and you find yourself on tree-lined streets with nice single-family houses, essentially, older suburbs. Austin, too, is a relatively low-density place surrounded by the kind of suburban sprawl detested by Floridians; this is also the case with Charlotte, Atlanta, and other fast-growing cities.

    These facts, of course, are unlikely to interfere with the self-interested lobbying by large developers for subsidies for downtown development much less the defined prejudices of the urban-centric media. But contrary to the narrative espoused by Florida and other proponents of high-density cities, the predominant future urban form in America is emerging  (largely unrecognized to the media) elsewhere, in places less dense, economically diverse and, perhaps, just a bit less hip and cool.

    Joel Kotkin is executive editor of NewGeography.com and a distinguished presidential fellow in urban futures at Chapman University, and a member of the editorial board of the Orange County Register. He is author of The City: A Global History and The Next Hundred Million: America in 2050. His most recent study, The Rise of Postfamilialism, has been widely discussed and distributed internationally. He lives in Los Angeles, CA.

    This piece originally appeared in the The Daily Beast.

    Seattle photo by Bigstock.

  • America’s Fastest- and Slowest-Growing Cities

    Since the housing crash of 2007, the decline of the Sun Belt and dispersed, low-density cities has been trumpeted by the national media and by pundits who believe America’s future lies in compact, crowded, mostly coastal and northern, cities. But apparently, most Americans have not gotten the memo — they seem to be accelerating their push into less dense regions of the Sun Belt.

    An analysis of population data by demographer Wendell Cox, including the Census report for the most recent year released late last week, shows that since 2000, virtually all the 10 fastest-growing metropolitan areas in the United States are located in Sun Belt states. The population of the Raleigh, N.C., metropolitan statistical area has expanded a remarkable 47.8% since 2000, tops among the nation’s 52 metro areas with over 1 million residents. That is more than three times the overall 12.7% growth of those 52 metro areas.

    Austin, Texas, and Las Vegas also expanded more than 40%, putting them second and third on our list. The populations of the other metro areas in the top 10 all expanded by at least 25%, or twice the national average. This jibes nicely with domestic migration trends and growth in the foreign-born population, both of which have been strongest in many of these same cities.

    The most recent numbers, covering July 2011 to July 2012, also reveal some subtle changes in the Sun Belt pecking order. Over the 2000-2012 period, the growth winners   included places like Las Vegas, Riverside-San Bernardino and Phoenix, all of which suffered grievously in the housing bust. Although they all clocked population growth better than the national average over the past year, none, besides Phoenix, ranked in the updated top 10.

    Growth momentum has shifted decidedly toward Texas. Austin’s population expanded a remarkable 3% last year, tops among the nation’s 52 largest metro areas. Three other Lone Star metropolitan areas — Houston, San Antonio and Dallas-Ft. Worth — ranked in the top six and all expanded at roughly twice the national average. The other fastest-growing metros over the past year include Raleigh, Orlando, Phoenix, Charlotte and Nashville. One unexpected fast-growth area has been Oklahoma City, which ranked 20th between 2000 and 2012, but notched the 12th spot last year, with a growth rate 60% above the national average.

    What explains these subtle shifts? Some of it can be traced, of course, to the stronger growth in energy-rich areas such as Texas as well as Oklahoma City. The differences are particularly striking when looking at varying economic growth rates among the country’s largest regions. In 2011 the Houston metro area, whose population is up by 1.4 million since 2000, also enjoyed the fastest GDP growth, at 3.7%, of any of the nation’s top 20 regions. Dallas-Fort Worth clocked a respectable 3.1%.

    In contrast, the GDP growth rates for the hip, dense metro areas lagged behind. Among the elite cities, the tech hubs of San Francisco , Seattle and Boston have done the best, posting GDP growth around 2.5%. But the economies of New York, Los Angeles, Philadelphia and, surprisingly, Washington D.C., grew at roughly half the rate of Houston.

    But it’s not just economic factors at play. One remarkable similarity in all the fastest-growing areas is their relatively low population densities. Although Raleigh and Austin are held out as “hip” cities, they have very low-density urban cores. Not one of the top 10 growth cities for 2010 to the present, or last year, had urban core densities more than a half of those of places like Boston (40th for 2000 to the present), New York (41st),  Los Angeles (42nd) or Chicago (43rd).

    At the same time, we have to consider the issue of housing affordability, something that rarely comes up among proponents of “cool” cities. In contrast to slower-growing San Francisco, New York and Los Angeles, most of the fastest-growing cities have lower housing prices relative to income. Particularly notable are the low prices in areas such as Austin, Raleigh, Houston and Dallas-Fort Worth, where housing costs are half or less than in the more highly regulated “cool” cities.

    Lower housing costs also seem to impact another critical growth component: family formation. Immigrants and domestic in-migrants are important to population growth but equally critical is whether longtime residents in a region choose to have children. Virtually all the top 10 metro areas, both last year and since 2000, have also ranked among the fastest growing in terms of the population under 15; Raleigh’s child population alone has expanded by almost 45% since 2000, compared to 2% nationally;  Austin’s toddler population surged a remarkable, 38%. The child populations of Houston, Dallas-Fort Worth, Atlanta, Phoenix, Las Vegas and Orlando all  increased by 20% or more.

    In contrast, none of the hip cities posted under 15 population growth better than 5%. The number of children has actually declined in many, including New York, Los Angeles, Boston, San Francisco and Chicago. Even with substantial influxes from abroad, particularly in New York, it’s difficult for these areas to sustain population increases when the number of children keeps dropping.

    The problem may be even more intense in Los Angeles and Chicago, whose economies continue to lag further behind. But the demographic challenges of the Big Orange and the Windy City pale compared to those faced by many cities in the old industrial Rust Belt, which have either lost population or posted only weak increases.

    Cleveland’s population is down 3.9% since 2000, the worst performance among the nation’s biggest metro areas apart from disaster-struck New Orleans. Cleveland lags in both family formation and has seen strong outmigration, but also attracts few foreign-born residents. Much the same can be said of Providence, R.I., Pittsburgh, Buffalo and Detroit. Nor do things seem to be improving with time; these areas continued to inhabit the nether regions in the most recent Census reports.

    So what do these trends tell us about the demographic evolution of our major metropolitan areas? Certainly sustained economic growth, low density and more affordable housing all clearly continue to push the center of population gravity toward certain Sun Belt cities, primarily in the Southeast and Texas. It turns out that neither the Great Recession, the housing bust or a much hyped preference for dense urbanity is turning this around.

    Major Metropolitan Areas (Over 1,000,000) Population
    Ranked by Population Change Percentage: 2000-2012 (2013 Geography)
    Rank Metropolitan Area 2000 2012 2000-2012 Growth 2000-2012 % 2011-2012 %
    1 Raleigh, NC           804,436        1,188,564        384,128 47.8% 3.3%
    2 Austin, TX        1,265,715        1,834,303        568,588 44.9% 3.1%
    3 Las Vegas, NV        1,393,370        2,000,759        607,389 43.6% 3.1%
    4 Orlando, FL        1,656,835        2,223,674        566,839 34.2% 2.5%
    5 Charlotte, NC-SC        1,729,023        2,296,569        567,546 32.8% 2.4%
    6 Riverside-San Bernardino, CA        3,277,578        4,350,096     1,072,518 32.7% 2.4%
    7 Phoenix, AZ        3,278,661        4,329,534     1,050,873 32.1% 2.3%
    8 Houston, TX        4,716,964        6,177,035     1,460,071 31.0% 2.3%
    9 San Antonio, TX        1,719,262        2,234,003        514,741 29.9% 2.2%
    10 Dallas-Fort Worth, TX        5,239,149        6,700,991     1,461,842 27.9% 2.1%
    11 Atlanta, GA        4,297,419        5,457,831     1,160,412 27.0% 2.0%
    12 Nashville, TN        1,387,274        1,726,693        339,419 24.5% 1.8%
    13 Jacksonville, FL        1,126,224        1,377,850        251,626 22.3% 1.7%
    14 Sacramento, CA        1,808,442        2,196,482        388,040 21.5% 1.6%
    15 Denver, CO        2,194,022        2,645,209        451,187 20.6% 1.6%
    16 Washington, DC-VA-MD-WV        4,862,582        5,860,342        997,760 20.5% 1.6%
    17 Salt Lake City, UT           942,666        1,123,712        181,046 19.2% 1.5%
    18 Portland, OR-WA        1,936,108        2,289,800        353,692 18.3% 1.4%
    19 Tampa-St. Petersburg, FL        2,404,273        2,842,878        438,605 18.2% 1.4%
    20 Oklahoma City, OK        1,097,874        1,296,565        198,691 18.1% 1.4%
    21 Seattle, WA        3,052,379        3,552,157        499,778 16.4% 1.3%
    22 Richmond, VA        1,058,816        1,231,980        173,164 16.4% 1.3%
    23 Indianapolis. IN        1,664,431        1,928,982        264,551 15.9% 1.2%
    24 Columbus, OH        1,681,865        1,944,002        262,137 15.6% 1.2%
    25 Miami, FL        5,025,806        5,762,717        736,911 14.7% 1.1%
    26 San Diego, CA        2,824,987        3,177,063        352,076 12.5% 1.0%
    27 Minneapolis-St. Paul, MN-WI        3,044,901        3,422,264        377,363 12.4% 1.0%
    28 Kansas City, MO-KS        1,818,073        2,038,724        220,651 12.1% 1.0%
    29 Louisville, KY-IN        1,123,966        1,251,351        127,385 11.3% 0.9%
    30 Memphis, TN-MS-AR        1,216,293        1,341,690        125,397 10.3% 0.8%
    31 San Jose, CA        1,739,669        1,894,388        154,719 8.9% 0.7%
    32 Birmingham, AL        1,053,394        1,136,650          83,256 7.9% 0.6%
    33 San Francisco-Oakland, CA        4,136,658        4,455,560        318,902 7.7% 0.6%
    34 Baltimore, MD        2,557,501        2,753,149        195,648 7.6% 0.6%
    35 Grand Rapids, MI           934,388        1,005,648          71,260 7.6% 0.6%
    36 Virginia Beach-Norfolk, VA-NC        1,584,042        1,699,925        115,883 7.3% 0.6%
    37 Cincinnati, OH-KY-IN        1,999,787        2,128,603        128,816 6.4% 0.5%
    38 Philadelphia, PA-NJ-DE-MD        5,693,275        6,018,800        325,525 5.7% 0.5%
    39 Hartford, CT        1,150,915        1,214,400          63,485 5.5% 0.4%
    40 Boston, MA-NH        4,402,611        4,640,802        238,191 5.4% 0.4%
    41 Los Angeles, CA      12,398,950      13,052,921        653,971 5.3% 0.4%
    42 New York, NY-NJ-PA      18,976,899      19,831,858        854,959 4.5% 0.4%
    43 Chicago, IL-IN-WI        9,117,732        9,522,434        404,702 4.4% 0.4%
    44 St. Louis,, MO-IL        2,678,224        2,795,794        117,570 4.4% 0.4%
    45 Milwaukee,WI        1,502,305        1,566,981          64,676 4.3% 0.4%
    46 Rochester, NY        1,066,335        1,082,284          15,949 1.5% 0.1%
    47 Providence, RI-MA        1,586,744        1,601,374          14,630 0.9% 0.1%
    48 Pittsburgh, PA        2,429,023        2,360,733        (68,290) -2.8% -0.2%
    49 Buffalo, NY        1,169,159        1,134,210        (34,949) -3.0% -0.3%
    50 Detroit,  MI        4,457,471        4,292,060      (165,411) -3.7% -0.3%
    51 Cleveland, OH        2,147,948        2,063,535        (84,413) -3.9% -0.3%
    52 New Orleans. LA        1,336,795        1,227,096      (109,699) -8.2% -0.7%

    Analysis by Wendell Cox, Demographia

    Joel Kotkin is executive editor of NewGeography.com and a distinguished presidential fellow in urban futures at Chapman University, and a member of the editorial board of the Orange County Register. He is author of The City: A Global History and The Next Hundred Million: America in 2050. His most recent study, The Rise of Postfamilialism, has been widely discussed and distributed internationally. He lives in Los Angeles, CA.

    This piece originally appeared at Forbes.com.

  • Chicago: Outer Suburban and Exurban Growth Leader

    Greg Hinz at Crain’s Chicago Business congratulates Chicago for its nation-leading population growth. Heinz also notes that the far suburbs also gained population strongly, but there had been losses in the areas between the two. He asks: "the question now is whether the area can prosper with a thriving core but sinking neighborhoods and inner-ring suburbs around it."

    The area within 2 miles of downtown gained nearly 50,000 people between 2000 and 2010. No other US metropolitan area equaled this urban core population increase.

    The article cites a number of factors beyond population growth to indicate that the city of Chicago is outperforming the suburbs. Retail sales tax collections have increased faster in the city. However, Hinz also notes that there has also been a sizable proliferation of big-box stores (Target and Wal-Mart), which is made it possible for residents to shop in the city instead of the suburbs.

    Empty Nesters Not Flocking to Downtown

    Hinz notes that "empty nesters" are moving to the urban core. Yet this is not confirmed by the data. Between 2000 and 2010, the age cohort that was from 55 to 64 years old in 2000 dropped by 55 percent as a share of the population in the fast growing core census tracts of central Chicago. In contrast, in the city of Chicago overall, the loss was 25%, and the reduction was 24% in the entire metropolitan area (Figure 1). Our previous national research showed that the population losses in this cohort were the greatest in the core cities among the 51 major metropolitan areas.

    The article goes on to quote Alan Ehrenhalt to the effect that an "inversion" of the city to suburban movement pattern is occurring, and "it’s happening more in metropolitan Chicago than just about any other city in the country."

    "Inversion" implies "turning upside down." For an inversion to have occurred, there would need to have been a reversal of the trend in movement from the core cities to the suburbs. The most important indicator of any such inversion would be that domestic migration would show a flow from a suburbs to cities. It does not. Domestic migration from Cook County, in which Chicago is located, was minus 740,000 between 2000 and 2011 (Note). Domestic migration in the suburban counties was a plus 139,000. Thus, there was no net migration from the suburbs to Cook County (Figure 2).  

    The City of Chicago Outside Downtown

    The story was much different outside the core area. The balance of the city, where 93 percent of the people live, lost 250,000 residents – a loss greater than that of any municipality in the nation over the period – including Detroit. The losses were pervasive. More than 80 percent of the city’s 77 community areas located outside the core lost population.

    Thus, the core area boom is far more than negated by the losses in the balance of the city. The losses that were sustained in the area between the urban core and the outer suburbs and exurbs were virtually all in the city itself.

    Inner Suburbs

    At the same time, the inner ring suburbs (between the city and 20 miles from the core for this analysis) grew only modestly, gaining less than 20,000 between 2000 and 2010. This is not unexpected, especially in a metropolitan area with slow growth, like Chicago. Urban areas tend to grow organically, with the greatest growth on the urban fringe. As the urban fringe moves further from the core, growth will be less in the established developed areas. 

    An important exception is the small pockets of growth developing and occupying previously disused warehouse and commercial and even railroad yard areas. The core of Chicago is among these, along with Portland’s Pearl District, the Washington Avenue corridor in St. Louis, the Third Ward in Milwaukee, and others. The exit of commercial activities permitted conversion to residential uses, often decades after the abandonment of previous uses.

    Outer Suburban and Exurban Growth

    The overwhelming reality of metropolitan growth in Chicago, however, is that the outer suburbs and exurbs continue to capture virtually all growth. Overall, areas outside 20 miles from the core of Chicago gained 573,000 residents between 2000 and 2010. By contrast, the entire metropolitan area gained only 362,000 residents. As a result, these outer suburbs and exurbs accounted for 158% of the Chicago metropolitan area’s population growth between 2000 and 2010. The core gains, city and inner suburban losses are illustrated in Figure 3.

    Approximately 52 percent of the metropolitan area population is now in the outer suburbs and exurbs. If Chicago’s outer suburbs and exurbs were a separate metropolitan area, they would rank as the 10th largest in the nation, with a population of nearly 5 million, between Atlanta and Boston.

    Chicago: Outer Suburban and Exurban Growth Leader

    As significant as Chicago’s core population growth has been over the last decade, it has been substantially overshadowed by outer suburban and exurban growth. Approximately 12 residents were added in the outer suburbs and exurbs for each new resident in the urban core. Like its urban core growth, Chicago’s growth in the urban core led the nation. Only one other metropolitan area, St. Louis, exceeded 100 percent in its population growth outside a 20 mile radius from downtown (Figure 4).

    Wendell Cox is a Visiting Professor, Conservatoire National des Arts et Metiers, Paris and the author of “War on the Dream: How Anti-Sprawl Policy Threatens the Quality of Life.

    Photograph: Outer suburbs of Chicago (by author)

    Note: Domestic migration data is not available below the county level.

  • The Psychology of the Creative Class: Not as Creative as You Think

    “Innovation distinguishes between a leader and a follower”
    –Steve Jobs

    Behind every sociological movement is a psychology. The ever-growing creative classification of America is no different. The following teases the psychology of the movement apart.

    Why do this?

    Because it is needed. The costs of blindly acquiescing to copycat community building are too great. These costs are not simply aesthetic, even economic, but are costs in the ability to distinguish creativity from repetition, and ultimately: truth from fiction.

    Be Creative or Die

    “Anxiety is the dizziness of freedom”
    –Kierkegaard

    You may think creative classification—or the commoditization of cities as products to be consumed by creative people with means in the name of economic growth—begins with happiness. It doesn’t. It begins with anxiety. Writes Richard Florida on page 12 in The Rise of the Creative Class:

    [T]he September 11, 2001, tragedy and subsequent terrorist threats have caused Americans, particularly those in the Creative Class, to ask sobering questions about what really matters in our lives. What we are witnessing in America and across the world extends far beyond high-tech industry or any so-called New Economy: It is the emergence of a new society and a new culture — indeed a whole new way of life. It is these shifts that will prove to be the most enduring developments of our time. And they thrust hard questions upon us. For now that forces have been unleashed that allow us to pursue our desires, the question for each of us becomes: What do we really want?

    By tapping the defining moment of a generation of young people—a moment, mind you, defined by terror, insecurity, and “what if”— Florida begins his path to individual and societal progress from a point common to thinkers since the beginning of time, i.e., what does it all mean?

    In fact, if I was going to start a galvanizing societal theory, I’d begin there too, as uncertainty, if not fear, is a great motivator and catalyzer. Fearing failure, loneliness, meaninglessness, regret—it’s all fuel in the search for meaning, for life. And while this intrapersonal battle is stoked inside the individual, it becomes actualized in the world around us, not least in that relationship between a person and a place.

    Hence, the creative class credo: if you want to “live” you need to go to where the “action” is, else succumb to missing out. Such existentially-fueled place-pedestaling is perhaps the driving tenant of creative class urbanism. Writes Frank Bures:

    I know now that this was Florida’s true genius: He took our anxiety about place and turned it into a product. He found a way to capitalize on our nagging sense that there is always somewhere out there more creative, more fun, more diverse, more gay, and just plain better than the one where we happen to be.


    Courtesy of kenfager.com

    Of course many of us in “flyover country” can identify with this: our cities “suck”, and the lights of aspiration shine brighter elsewhere, particularly on the coast. And it’s a kind of self-loathing grown particularly virulent in the Rust Belt—that bastion of decay and anti-vibrancy. Regardless of the validity, the mesofact is out there: the Rust Belt is dead, go away to really live. Take this 2002 article entitled (aptly) “Be creative—or die”. Here, Florida, in a interview, states:

    They [cool cities] created a lifestyle mentality, where Pittsburgh and Detroit were still trapped in that Protestant-ethic/bohemian-ethic split, where people were saying, “You can’t have fun!” or “What do you mean play in a rock band? Cut your hair and go to work, son. That’s what’s important.” Well, Austin was saying, “No, no, no, you’re a creative. You want to play in a rock band at night and do semiconductor work in the day? C’mon! And if you want to come in at 10 the next morning and you’re a little hung over or you’re smoking dope, that’s cool.” I went to the Continental Club — I was invited by Austin’s leading political officials — and we went to see Toni Price the singer-songwriter, and there were hippies smoking dope right there on the back porch.

    Florida’s advice to city leaders? If you are uncool be cool, because cool nurtures a vibrant city, and a vibrant city attracts the crème de la crème who are different, unique, and anxious to suck the marrow out of life—and they will eventually spit it out into insights and innovation.

    Freedom Can Be Frightening

    One does not become fully human painlessy–Rollo May, existential psychologist.

    Recently on Twitter, Florida brought out the virtual creative class conch to alert to his followers that Yahoo was yanking its work-at-home privileges due to concerns over worker productivity. In a series of Tweets that lasted most of two days, Florida lambasted the decision, in effect showing how the 10 am start time has been liberalized over the years to not having to come into the office at all:

    1. Working from home = focus. 2. Office =distraction. 3. Innovation more a product of “urban” interaction than in-office interaction.

    — Richard Florida (@Richard_Florida) February 25, 2013

    Yahoo end game … Stars leave. Slackers go to office where they distract others. Result: Reduced overall productivity.

    — Richard Florida (@Richard_Florida) February 26, 2013

    Yahoo’s decision goes against, according to writer Charles Shaw: “‘the élan vital of the Creative Class [which] is “take me as I am and facilitate the use of my unique skills, but don’t expect me to buy into some corporate culture that requires me to change who I am’”.

    Explicit in such discourse is the unusual levels of individuality that’s supposedly threaded in the DNA of the creative class. No doubt, the concept of “individuality” in creative class theory is important, as unique, free-thinking creative-types are said to be the engine of the innovation economy, with the thinking that such individuals aren’t saddle-bagged with conformity and convention in their pursuit for fresh ideas.

    But is this true? Is the creative class really beyond the bounds of social conformity?

    To examine this, we return to the building blocks of creative class theory; namely, fear and anxiety.

    In Erich Fromm’s 1942 classic Escape from Freedom, the author takes pains to emphasize that freeing oneself from societal conventions is not a fun process, as “freedom can be frightening”. While his delineation of the lineage of modern man’s loneliness is spelled out extensively in the book, it is enough here to say that while market capitalism enabled a freedom in the pursuit of happiness through technological and democratic innovations, it also chained us because “the self” had become a commodity. Writes Fromm:

    “Man does not only sell commodities, he sells himself and feels himself to be a commodity…If there is no use for the qualities a person offers, he has none…Thus, the self-confidence, the “feeling of self”, is merely an indication of what others think of the person…If he is sought after, he is somebody; if he is not popular, he is simply nobody. The dependence of self-esteem on the success of the “personality” is the reason why for modern man popularity has this tremendous importance.”

    Fromm was damn prescient, as today more than ever there’s a tremendous amount of pressure to create a “false self” if you are interested in successfully navigating established social structures. This false self accepts not what it wants, but what it is supposed to want. To buck the system—that is, to emphasize the components of the “true self” that often have little value in a hyper-competitive society in which avatars compete in a virtual 24/7 spit-off so as to game a personal brand—we must, according to Fromm, realize that to know what one wants is not easy “butone of the most difficult problems any human being has to solve”.


    Courtesy of Jeff Bullas

    Of course many don’t solve this. We know this. We live it. Struggle with it, including this author. Instead, individuality is commonly sacrificed for the comfort in conformity. Writes Fromm:

    “[We] become a part of a powerful whole outside of oneself, to submerge and participate in it…By becoming part of a power which is felt as unshakably strong, eternal, and glamorous, one participates in its strength and glory.”

    It says here that one of these “powerful wholes” is to be able to self-identify with membership in the creative class. This is not a leap. Instead, the evidence of creative class conformity is increasingly clear in cities where creative class enclaves are thickest.

    Uniquely Conforming and Creatively Monotononizing

    In a time of deceit telling the truth is a revolutionary act–George Orwell

    One of Florida’s greatest accomplishments was to imbue a sense of distinctiveness in the millions upon millions of individuals that make up the creative class. This in itself is a feat, as it involves convincing persons that it is their own uniqueness that makes them a special, if massive, group. Writes Florida (The Rise of the Creative Class, 2002, 315, 326) via Jamie Peck:

    [The creative class] needs to see that their economic function makes them the natural — indeed the only possible — leaders of twenty-first century society . . .

    …[W]e must harness all of our intelligence, our energy and most important our awareness. The task of building a truly creative society is not a game of solitaire. This game, we play as a team’.

    Yet while preaching uniqueness to the self-believers as a galvanizing gimmick is clever, the problem for Florida is that those actually greasing the rails of creative classification on the ground are developers (Forest City’s Albert Ratner called Florida’s book the “playbook” for developers), and the only individuality they care about is the marketing kind, or the “you-are-so-special-you-deserve-this-condo” kind. Here, “individuality” and “diversity” aren’t meant to be taken literally, but as words to coax want so as to placate the shitty feeling of being a conformer, with of course conforming only placating the shitty feeling of loneliness.

    From an article “How to Brand Your City”, which covered Forest City’s Alexa Arena’s recent presentation about her San Francisco development project called “5M”:

    She said cultural diversity is a key ingredient in shaping a hub for innovation. Some of the best ways to promote diversity are restaurants, trendy corner shops and community events — all staples of 5M’s plan.

    Courtesy of Bold Italic

    Courtesy of Bold Italic

    Of course uttering such nonsense is beyond laughable–somewhat terrifying even–and if Arena and her ilk really believe such then they got their vested heads in the sand, fantasizing about diversity while monotone forms around them.

    Regardless, for others watching reality as it really happens they see creative class gentrification for what it is: a process of homogenization. In fact the sheer number of creative class = vanilla articles popping up everywhere of late may indicate that the jig is up (see here, here, here, and here), and those who actually moved to Big City for “the real”, or who grew up in Big City when it was in fact diverse before planned diversification, well, they are getting snarly. Writes Charles Hurbert in the “Homogenization of San Francisco”:

    Take a walk down Valencia Street today and you’ll find yourself waiting in line at a Disneyland of pop-culture opulence. Oblivious of the stark irony, graphic designers and marketing managers frequent $50/seat old-time barbershops and shop at retail boutiques obsessed with the rugged appeal of working-class fashion. Simultaneously, the actual businesses and experiences the proprietors are emulating are unable to compete in the increased rental market. What we’re left with are stage props and costumes in an increasingly detached culture of disingenuous, blue-collar nostalgia.

    This is not to say that the creative class movement will go down without a fight. Part of the fight is to acknowledge creative classification’s faults, with Florida himself–the “Urban Prophet” as he was recently donned in Property Week–out front and center owning the solutions to the consequences of his own policy. For instance, there is the Atlantic Cities “Class-Divided Series” which vividly demonstrates the extent the creative class forms enclaves in Global City space, thus exacerbating disparity. And there is a recent NPR Morning Edition interview that states “Urban scholar Richard Florida has found a problem with the way our cities are evolving”, ignoring of course the work of scholars like Jamie Peck who have been “finding” problems for the past decade.

    And then there is the other part of the fight which simply means believing it doesn’t exist. Here, economic development types carry the pail largely through good, old-fashioned “nothing to see here” pieces that serve to obfuscate the truth. Like this one in the San Francisco Chronicle entitled “Gentrification is no longer a dirty word” that I just picked up from Florida’s Twitter feed, which basically smashes a happy face over the pain creative classification can make:

    “Young people with talent are the new movers and shakers in the city,” says [30-year real estate veteran] Thompson, who says the city sells itself. “Last weekend I had some clients who were looking in the Mission. We drove by Dolores Park, and it was packed. They said, ‘Is there a street fair?’ “

    Nope, just another afternoon in trendy town.

    Again, the creative class movement will not walk gently into the art-festival-lit night. There is too much at stake. Too much money, and too much psycho-sociological comfort in being able to believe your part of a privileged group that has both force and uniqueness: a kind of snowstorm in which no two creative class snowflakes are alike.

    Largely, this fight will be played out in a clash of ideas in which reality versus relativism takes center stage in a battle for meaning versus no meaning: an Orwellian sociological/psychological shit show to determine whether or not 2 plus 2 = 5, diversity = homogeneity, individuality = conformity, authenticity = fake, and a life of meaning = the deep existential loneliness occurring when the false self aches.

    Nothing less than the integrity of creativity is at stake.

    Richey Piiparinen is a writer and policy researcher based in Cleveland. He is co-editor of Rust Belt Chic: The Cleveland Anthology. Read more from him at his blog and at Rust Belt Chic.

    Lead photo: The vibe in Cleveland. Courtesy of David Jurca

  • Communities Need to Build Better Millennial Connections

    A remarkable, but mostly unnoticed, 2012 study found a powerful correlation between a community’s civic health and its economic well being. The analysis by the National Conference on Citizenship (NCoC) and its partners found that the density of non-profits whose purpose was to encourage their members’ participation within the community   correlated strongly with the ability of a locality to withstand the effects of the Great Recession. The same analysis revealed that those municipalities having the greatest amount of “social cohesion,” defined as “interacting frequently with friends, family members, and neighbors,” also showed greater resilience in ameliorating job losses during economic downturns, independent of the density of their non-profit sector.

    The numbers are startling. States with high social cohesion had unemployment rates two percentage points lower than their less connected counterparts, even controlling for demographics and economic factors. A county with just one additional nonprofit per 1,000 people in 2005 had half a percentage point less unemployment in 2009. And for individuals who held jobs in 2008, the odds of becoming unemployed were cut in half if they lived in a community with many nonprofit organizations rather than one with only a few, even if  the two communities were otherwise similar. Given these results, every community interested in improving its economic vitality should be devising strategies to increase the civic health of their locality.

    One way to accomplish this goal is to attract members of the hyper-connected but locally-focused Millennial Generation (born 1982-2003).  People in their thirties – a group millennials are just entering but will soon dominate – and early forties, the age when people are building families and careers, constitute the essential social ballast for any community, city or suburb. For the rest of this decade as well as the next, Millennials will comprise the cohort entering this key phase of life, contributing both economic stimulus and a new sense of community wherever they choose to live. Fortuitously, the same organization (NCoC) that produced the original report has just released a new study suggesting several strategies cities could use to attract America’s most community-oriented generation.

    According to this year’s study, more densely populated communities face a major challenge in attracting civic-oriented Millennials. This is contrary to much of the conventional wisdom about both millennials and “community”.  It found that members of the generation who reside in denser urban communities are less likely to engage in the type of service activities that nonprofits are designed to encourage. Except in the South, Millennials living in suburbia or more rural settings were more likely to engage in service activities with their peers than their urban counterparts. In fact, the worst community participation rates by far were found among Millennials in the country’s Northeastern cities.

    A recent analysis by demographer Wendell Cox of Millennial living patterns validated these findings. He found that those major metropolitan areas with the least density gained the lion’s share of increases in populations of 25 to 34 year olds in the first decade of this century. Another, as yet unpublished study by Cox, has found that the same holds true for 20-24 year olds. 

    To fix that problem and increase their economic resiliency, more densely populated communities should actively encourage the formation of military veteran’s groups and other nonprofits that foster citizen participation and leadership skills. Other types of nonprofits that the earlier NCoC study suggested would help improve a city’s civic and economic vitality are sports clubs, labor unions and those that offer job-training opportunities. By providing such nonprofits with the space and resources to attract and engage America’s largest and most diverse generation, communities can gain the economic benefits that service organizations, such as Kiwanis and the Elks, brought to their communities in the past.

    A recent review of the seven best cities for Millennials to obtain an initial foothold for their economic future placed greater Seattle at the top of the list. It was followed by Dallas; Minneapolis; Athens, Georgia; Ithaca, New York; Oklahoma City; and Phoenix.  () Most of these communities combine relatively lower levels of density with lower rates of unemployment making them especially attractive to Millennials.  

    One way for denser urban centers to compete with such localities is to gain a broad mix of educational attainment among their younger populations, thereby increasing their social cohesion and, ultimately, economic resiliency. This is because Millennials without a high school diploma are least likely to trust their neighbors but most likely to help those very same neighbors on a regular basis. Meanwhile, Millennials who attend college become more trusting of their neighbors wherever they end up settling, but less likely to help them out. In order to build both a trusting community and one where friends and neighbors help each other out, communities need to provide a broad range of jobs requiring various levels of education and encourage Millennials to stay in the place where they grew up or return there upon graduation.

    Communities interested in enhancing their social cohesion should take a close look at the example set by the civic leaders of Kalamazoo, Michigan. Under its Kalamazoo Promise program, families that enroll their children in the local school district get help with college tuition on a sliding scale based on how many grades of education the child completes in the city’s schools. The strategy, which has led to greater demand for housing within the school district’s boundaries as well, encourages the development of a community with a wide range of educational success among its residents.  

    The most recent study also found that once Millennials complete their schooling and begin to settle down their civic engagement increases. In fact, those 29 and under who are married and have children are more likely than those over thirty who do not have a family to participate in activities, such as helping neighbors, that in turn lead to greater social cohesion.

    One strategy for encouraging college educated Millennials to settle in the community where they grew up, may lie with making the cost of college locally more affordable. For example, in contrast to many states that are shortsightedly reducing their subsidies of in state tuition, North Dakota is using some of its increased tax revenue from the state’s explosion in energy production to limit tuition increases for their residents and increasing the amount of needs-based tuition aid and scholarships for those who decide to attend any college in the state.

    Building better communities requires encouraging the human interaction and connectivity that make a municipality more resilient in times of economic difficulty. Building this type of social capital comes naturally to Millennials, the nation’s most connected generation.   Non-profits that attract younger people should be actively encouraged to set up shop in cities and localities across the country. Programs that support educational attainment and employment opportunities for Millennials should be viewed as another essential element of economic strategy.  Today, community’s economic health is inextricably intertwined with the type of civic vitality that local Millennials can generate.  

    Morley Winograd and Michael D. Hais are co-authors of the newly published Millennial Momentum: How a New Generation is Remaking America and Millennial Makeover: MySpace, YouTube, and the Future of American Politics and fellows of NDN and the New Policy Institute.

    Homes image by BigStock.

  • The Age of Bernanke

    To many presidential idolaters, this era will be known as the Age of Obama. But, in reality, we live in what may best be called the Age of Bernanke. Essentially, Obamaism increasingly serves as a front for the big-money interests who benefit from the Federal Reserve’s largesse and interest rate policies; progressive rhetoric serves as the beard for royalist results.

    Overall, the impacts of ultralow interest rate, cash-machine policies of Fed Chairman Ben Bernanke trump everything else. The presidential stimulus was, at best, modestly effectively, and certainly did little to turn around the fortunes of most Americans or spark much economic growth. Unemployment remains stuck at around 8 percent and 8.5 million workers have exited the labor force.

    But the Bernanke policies have succeeded in reshaping the economic landscape in ways that, while good for the plutocracy and Wall Street, are not particularly positive for the vast majority of Americans.

    Economic Losers

    Many of the biggest losers in the Bernanke era are key Democratic constituencies, such as minorities and the young, who have seen their opportunities dim under the Bernanke regime. The cruelest cuts have been to the poor, whose numbers have surged by more than 2.6 million under a president who has promised relentlessly to reduce poverty.

    Things, of course, have not too great for the middle-age and middle-class – more of them now supporting both aging parents and underemployed children. Median income in America is down 8 percent from 2007, and dropping. Things, in reality, are not getting better for anyone but the most affluent.

    A particular loser has been small business. As we enter the sixth year since the onset of the Great Recession, and nearly four years after the "recovery" officially began, small business remains in a largely defensive mode. Critically, start-up rates are well below those than following previous downturns in 1976 and 1983. The number of startup jobs per 1000 – a key source of job growth in the past – over the past four years is down a full 30 percent from the Bush and Clinton eras. New firms – those five years or younger – now account for less than 8 percent of all companies, down from 12 percent to 13 percent in the early 1980s, another period following a deep recession.

    With demand and growth still weak, small business enters the new year with among the lowest expectations of any large economic sector. As Gallup points out, one in five small companies expects to lower its employee count, one in three expect to decrease capital spending and almost as many expect to be in more severe cash-flow troubles by the end of the year.

    This decline of small-business sentiment constitutes arguably the biggest reason for our poor job-creation numbers. If small business had come out of the recession maintaining just the rate of start-ups generated in 2007, notes McKinsey, the U.S. economy would today have almost 2.5 million more jobs than it does.

    Smaller Banks

    One source for this decline lies in the difficulties faced by smaller community banks, which tend to be those most likely to lend to entrepreneurial firms. Jeff Ball, chairman-elect of the California Bankers Association and founder of Whittier-based Friendly Hills Bank, suggests the Fed’s policies – as well as growing regulatory policies – has led to an unprecedented concentration of financial assets in the hands of a few large "too big to fail banks" while the number of smaller community banks has been shrinking.

    "Everywhere you turn there’s a ‘gotcha’ from the regulators," Ball notes. "The big banks can deal with the regulations far more easily than the community banks. And because some banks are perceived as ‘too big to fail,’ there’s easier access to credit, and they are perceived to be better to invest in."

    So, who have been the big winners in the Age of Bernanke? The very people who were supposed to be the bête noires of the age of Obama: the large financial institutions. In 2013, the top four banks controlled more than 40 percent of the credit markets in the top 10 states, up by 10 percent from 2009 and roughly twice their share in 2000. At the same time, since the passage of the Dodd-Frank financial regulations, there are some 330 fewer small banks. Under the current regime, the oligopolization of the credit markets will continue apace, as much, or even more, than if Mitt Romney had won the presidency.

    Higher Profits

    Under these circumstances, it’s not surprising that large financial institutions and hedge fund have enjoyed close-to-record profits under Obama. This fall, for example, Wells Fargo and JP Morgan announced record profit. And despite widespread condemnation their executives have continued to enjoy outsized compensation, often greater than under George W. President Bush.

    Unlike smaller firms, or the middle class, the big financial institutions have feasted like pigs at the trough, with the six largest banks borrowing almost a half-trillion dollars from Uncle Ben Bernanke’s printing press. While millions of Americans have lost homes and much of their net worth, there has been not a single high-level prosecution by the Obama administration of the grandees of the very financial giants at the heart of the mass misery.

    Even the nascent housing recovery – which could create wealth for the middle class – appears largely to be creating opportunities for wealthy investors. In California, as well as other hard-hit real estate markets, such as in Florida, Arizona and Nevada, private investors constitute a large portion of buyers. The big private-equity firm Blackstone recently announced plans to buy $100 million in homes every week.

    These wildly divergent results between the hoi polloi and the financial elites do not seem to bother our "organizer in chief," particularly with re-election behind him. Instead, the Bernanke regime seems to be cementing a strong alliance of convenience between the government sector – which needs low interest rates to keep funding itself – and those with the easiest access to cheap money.

    Some observers, such as former Clinton Administration advisor Bill Galston, suggest we could see the emergence of a closer political alliance between big business and the public sector interests. Democrats, he suggests, have a natural alliance with larger firms, not only in the financial industry, while small-business lobbies remain "a building-block of the Republican base."

    New Corporatism

    This new corporatism that is becoming an integral part of the supposedly middle-class oriented Democratic Party. Close Obama advisers, like disgraced investment banker and political fixer Steven Rattner, Obama’s czar for the auto bailout, justify collusional capitalism, both in China and in America’s "too big to fail" regime.

    The reality remains that, rhetoric aside, corporate cronyism remains at the core of this administration and, sadly, the once-proudly populist Democratic Party. After his confirmation, we can expect former Citigroup profiteer Jacob Lew to follow Treasury Secretary Timothy Geithner, working along with Bernanke, to make sure the big Wall Street firms continue to thrive – even if the rest of us don’t.

    All this is reminiscent of something out of the declining days of the Roman Empire. The masses get bread (food stamps) and circuses, with virtually all of Hollywood and much of the media ready to perform on cue. The majority, losers in the Bernanke economy, lack the will and, maybe, the attention span to realize what is happening to them.

    "The Roman people are dying and laughing," the fifth-century Christian writer Salvian wrote. Like America today, entertainment-mad Rome suffered from a declining middle class, mass poverty and domination by a few wealthy patricians, propped up by a compliant government. Unless Americans of both left and right wake up to reality, our civilization could suffer a similar inexorable decline in the Age or Bernanke.

    Joel Kotkin is executive editor of NewGeography.com and a distinguished presidential fellow in urban futures at Chapman University, and a member of the editorial board of the Orange County Register. He is author of The City: A Global History and The Next Hundred Million: America in 2050. His most recent study, The Rise of Postfamilialism, has been widely discussed and distributed internationally. He lives in Los Angeles, CA.

    This piece originally appeared in the Orange County Register.

  • The Beauty of Urban Planning from the Ground

    In a piece called The Beauty of Urban Planning from Space, the Sustainable Cities Collective highlights views from space of uniquely designed street pattern designs in various cities around the world. There are ten examples that illustrate the zenith of urban planning.

    As attractive as the street patterns are, they highlight the inevitable inability of designers, or anyone else for that matter, to influence much more than small changes in the overall urban form.

    The Incomplete Street Patterns

    This point is evident in eight of the 10 urban areas illustrated, where the unique street pattern comprise only part of a much bigger city. The eight are Belo Horizonte, Brazil; Brasilia, Brazil, Washington, DC; New Haven, CT; La Plata, Argentina; Jaipur, India; Adelaide, Australia; and Canberra, Australia.

    The best known example may be Washington, DC, where L’Enfant’s street pattern served most of the city for more than a century, which is probably a world record for a growing urban area. Yet, today, L’Enfant’s design covers less than five percent of the urban area that today has more people than the nation at the time L’Enfant received his position.

    In La Plata (See end note on La Plata) the street design comes the closest to covering the whole urban area (Figure 1, from Google Maps). Taking design a bit further, every street is numbered in this city that was planned to be the capital of Argentina’s largest province (Buenos Aires, which is separate from the provincial equivalent city of Buenos Aires). Three other of the examples were also new cities planned as capitals, including Brasilia, Canberra and, of course, Washington.

    Stagnant Cities

    The other two examples are a dying mining town (El Salvador, Chile), which has lost more than two thirds of its population and an Italian medieval fortress town, Palmanova. The latter is more a museum than a dynamic urban area. It is confined to its original area and its population could fit into London’s Royal Albert Hall (approximately 5,000).

    Belo Horizonte, Brazil

    The Belo Horizonte Centro (Note on Belo Horizonte) street pattern is unique. It was part of the inspiration for my Urban Tours by Rental Car website (rentalcartours.net) and a map of Centro was incorporated into the logo (Figure 2).


    Figure 2

    In Centro, diagonals are superimposed on a conventional north-south/east-west street pattern (Figure 3, from Google Earth). However Centro’s street pattern covers less than one percent of the Belo Horizonte urban area, three square miles out of more than 400 (five square kilometers out of 650). Figure 4 shows Centro in red, engulfed by the much larger urban area, outlined in yellow.

    The first rental car tour described the Belo Horizonte Centro street pattern:

    Belo Horizonte represents both the best and worst in urban planning. The core has, at least from map inspection, a pleasing street layout. In a flair that outdid L’Enfant’s Washington diagonals, Belo Horizonte Centro has a grid of streets on which is superimposed a grid of diagonals. Of course, the resulting eight street intersections make traffic more of a difficulty than with the four that are usual or the grade separations of Brasilia. Centro has a number of wide boulevards, many with green, treed medians and, in the Brazilian style, some with four roadways — center express lanes and outside local lanes. These “three median” streets, give a pleasing feeling. The overall result is an impression similar to that of Barcelona, and a particularly attractive core that would do most European cities proud. 

    But, not far from Centro the randomness begins. To the north is the river, and clearly no attempt
    was made to continue the pattern beyond that. To the south are hills that would have precluded expansion of the plan. Nor does the pattern extend far to the less challenging east or west

    Unscrambling Means and Ends

    Street patterns from space provide no indication of urban planning’s effectiveness, nor of urban policy of which planning is a part. Planning is a means, not the end of cities.

    Over the past two centuries, billions of people have moved to cities. They did not move for the fountains, architecture, or museums (otherwise they would all live in the ville de Paris or Manhattan). In short, urban planning principles of any era have had little impact in the growth of cities.

    Urban planning’s current "top-down" genre is rather new. Until the British Town and Country Planning Act of 1947 and similar measures, planners contented themselves to design street networks (which the Sustainable Cities Coalition highlights so well) and other necessary infrastructure, such as water and sewer networks. Their handiwork is obvious in the 19th century designed street grid of Manhattan, the straight streets of Phoenix and the modified grid of the Toronto metropolitan area. These are the broad functions emphasized by New York University Professor Shlomo Angel in his Planet of Cities.

    Now, urban planning can work against the very justification of cities, the prosperity of its residents.

    Successful Cities

    The success of urban policy (and urban planning) can be judged by how well the purpose of the city is served – the reason people moved there in the first place. The purpose of the city was well articulated by former World Bank principal planner Alain Bertaud:  Large labor markets are the only raison d’être of large cities. Cities are much more about economics than aesthetics. (See end note on Sustainability).

    The successful city will facilitate greater affluence – higher discretionary incomes – among its residents.

    Regrettably, there are notable failures in this regard. For example, the urban containment policies of smart growth, which ration land and raise the price of housing relative to incomes, have been adopted in cities from Sydney to Toronto and Portland. As a result, residents have less money to spend after taxes and paying for necessities and are less affluent than they would be without such policies. In his introduction to the 9th Annual Demographia Housing Affordability Survey, New Zealand’s Deputy Prime Minister Bill English pointed out that higher house prices that occur when land is "made artificially scarce by regulation that locks up land for development."

    Another problem is evident in excessive traffic congestion and slower travel times. Getting around town quickly contributes to greater economic growth and discretionary incomes. Public policy must facilitate mobility throughout the urban area. The mode — the means — is not important, the access is. Transit services are appropriate where time competitive with the automobile, such as to the largest downtowns (See Transit Legacy Cities). However, because of its unparalleled ability to provide rapid mobility throughout the urban area, public policy must also ensure a minimum of traffic congestion and effective access by cars and commercial trucks. The evidence is clear that the higher densities preferred by modern urban planning impede rapid mobility throughout the urban area (see Urban Travel and Urban Population Density).

    Finally, by facilitating housing affordability and more free-flowing traffic, the important objective of alleviating poverty is served (an objective that cannot sustainably be served without economic growth)

    The Beauty of Urban Planning from the Ground

    The "beauty of urban planning" is reliably appreciated from the ground, not from space. The test is how well people live, not what the city looks like. The subject is people, not architecture or urban form (see Toward More Prosperous Cities: A Framing Essay on Urban Policy, Planning, Transport and the Dimensions of Sustainability).

    Wendell Cox is a Visiting Professor, Conservatoire National des Arts et Metiers, Paris and the author of “War on the Dream: How Anti-Sprawl Policy Threatens the Quality of Life.

    —–

    Note on La Plata: La Plata is in the Buenos Aires metropolitan area, approximately 35 miles (60 kilometers) south of Centro in Buenos Aires. However, it is a separate urban area because of a comparatively break in the continuous urbanization between La Plata and Buenos Aires. Buenos Aires province is by far the nation’s largest provincial level jurisdiction, with a population five times as great as the city of Buenos Aires. Much of the population is concentrated near the city of Buenos Aires, with which it forms one of the world’s megacities. The Buenos Aires also has the largest land area and would rank 6th if it were in the United States (nearly as large as New Mexico).

    Note on Belo Horizonte: Belo Horizonte is capital of the state of Minas Gerais. Belo Horizonte is Brazil’s third largest urban area, after Sao Paulo and Rio de Janeiro, with a population of more than 5 million — approximately the population of the Miami urban area (which stretches from southern Dade County to northern Palm Beach County)

    Note on Sustainability: Urban policies that would artificially constrain urban expansion (such as with urban growth boundaries) and discourage automobile travel have often been cited as principal strategies for reducing greenhouse gas emissions. However, important reports indicate little potential for greenhouse gas reductions from these policies, with the overwhelming share resulting from improved fuel economy. Moreover, recent research in England suggested that such policies should not "automatically be associated with the preferred growth strategy" (see Questioning the Messianic Conception of Smart Growth).

    Photo: Belo Horizonte Centro from Nova Lima (by author)

  • Gentrification and its Discontents: Notes from New Orleans

    Readers of this forum have probably heard rumors of gentrification in post-Katrina New Orleans. Residential shifts playing out in the Crescent City share many commonalities with those elsewhere, but also bear some distinctions and paradoxes. I offer these observations from the so-called Williamsburg of the South, a neighborhood called Bywater.

    Gentrification arrived rather early to New Orleans, a generation before the term was coined. Writers and artists settled in the French Quarter in the 1920s and 1930s, drawn by the appeal of its expatriated Mediterranean atmosphere, not to mention its cheap rent, good food, and abundant alcohol despite Prohibition. Initial restorations of historic structures ensued, although it was not until after World War II that wealthier, educated newcomers began steadily supplanting working-class Sicilian and black Creole natives.

    By the 1970s, the French Quarter was largely gentrified, and the process continued downriver into the adjacent Faubourg Marigny (a historical moniker revived by Francophile preservationists and savvy real estate agents) and upriver into the Lower Garden District (also a new toponym: gentrification has a vocabulary as well as a geography). It progressed through the 1980s-2000s but only modestly, slowed by the city’s abundant social problems and limited economic opportunity. New Orleans in this era ranked as the Sun Belt’s premier shrinking city, losing 170,000 residents between 1960 and 2005. The relatively few newcomers tended to be gentrifiers, and gentrifiers today are overwhelmingly transplants. I, for example, am both, and I use the terms interchangeably in this piece.

    One Storm, Two Waves

    Everything changed after August-September 2005, when the Hurricane Katrina deluge, amid all the tragedy, unexpectedly positioned New Orleans as a cause célèbre for a generation of idealistic millennials. A few thousand urbanists, environmentalists, and social workers—we called them “the brain gain;” they called themselves YURPS, or Young Urban Rebuilding Professionals—took leave from their graduate studies and nascent careers and headed South to be a part of something important.

    Many landed positions in planning and recovery efforts, or in an alphabet soup of new nonprofits; some parlayed their experiences into Ph.D. dissertations, many of which are coming out now in book form. This cohort, which I estimate in the low- to mid-four digits, largely moved on around 2008-2009, as recovery moneys petered out. Then a second wave began arriving, enticed by the relatively robust regional economy compared to the rest of the nation. These newcomers were greater in number (I estimate 15,000-20,000 and continuing), more specially skilled, and serious about planting domestic and economic roots here. Some today are new-media entrepreneurs; others work with Teach for America or within the highly charter-ized public school system (infused recently with a billion federal dollars), or in the booming tax-incentivized Louisiana film industry and other cultural-economy niches.

    Brushing shoulders with them are a fair number of newly arrived artists, musicians, and creative types who turned their backs on the Great Recession woes and resettled in what they perceived to be an undiscovered bohemia in the lower faubourgs of New Orleans—just as their predecessors did in the French Quarter 80 years prior. It is primarily these second-wave transplants who have accelerated gentrification patterns.

    Spatial and Social Structure of New Orleans Gentrification

    Gentrification in New Orleans is spatially regularized and predictable. Two underlying geographies must be in place before better-educated, more-moneyed transplants start to move into neighborhoods of working-class natives. First, the area must be historic. Most people who opt to move to New Orleans envision living in Creole quaintness or Classical splendor amidst nineteen-century cityscapes; they are not seeking mundane ranch houses or split-levels in subdivisions. That distinctive housing stock exists only in about half of New Orleans proper and one-quarter of the conurbation, mostly upon the higher terrain closer to the Mississippi River. The second factor is physical proximity to a neighborhood that has already gentrified, or that never economically declined in the first place, like the Garden District.

    Gentrification hot-spots today may be found along the fringes of what I have (somewhat jokingly) dubbed the “white teapot,” a relatively wealthy and well-educated majority-white area shaped like a kettle (see Figure 1) in uptown New Orleans, around Audubon Park and Tulane and Loyola universities, with a curving spout along the St. Charles Avenue/Magazine Street corridor through the French Quarter and into the Faubourg Marigny and Bywater. Comparing 2000 to 2010 census data, the teapot has broadened and internally whitened, and the changes mostly involve gentrification. The process has also progressed into the Faubourg Tremé (not coincidentally the subject of the HBO drama Tremé) and up Esplanade Avenue into Mid-City, which ranks just behind Bywater as a favored spot for post-Katrina transplants. All these areas were originally urbanized on higher terrain before 1900, all have historic housing stock, and all are coterminous to some degree.


    Figure 1. Hot spots (marked with red stars) of post-Katrina gentrification in New Orleans, shown with circa-2000 demographic data and a delineation of the “white teapot.” Bywater appears at right. Map and analysis by Richard Campanella.

    The frontiers of gentrification are “pioneered” by certain social cohorts who settle sequentially, usually over a period of five to twenty years. The four-phase cycle often begins with—forgive my tongue-in-cheek use of vernacular stereotypes: (1) “gutter punks” (their term), young transients with troubled backgrounds who bitterly reject societal norms and settle, squatter-like, in the roughest neighborhoods bordering bohemian or tourist districts, where they busk or beg in tattered attire.

    On their unshod heels come (2) hipsters, who, also fixated upon dissing the mainstream but better educated and obsessively self-aware, see these punk-infused neighborhoods as bastions of coolness.

    Their presence generates a certain funky vibe that appeals to the third phase of the gentrification sequence: (3) “bourgeois bohemians,” to use David Brooks’ term. Free-spirited but well-educated and willing to strike a bargain with middle-class normalcy, this group is skillfully employed, buys old houses and lovingly restores them, engages tirelessly in civic affairs, and can reliably be found at the Saturday morning farmers’ market. Usually childless, they often convert doubles to singles, which removes rentable housing stock from the neighborhood even as property values rise and lower-class renters find themselves priced out their own neighborhoods. (Gentrification in New Orleans tends to be more house-based than in northeastern cities, where renovated industrial or commercial buildings dominate the transformation).

    After the area attains full-blown “revived” status, the final cohort arrives: (4) bona fide gentry, including lawyers, doctors, moneyed retirees, and alpha-professionals from places like Manhattan or San Francisco. Real estate agents and developers are involved at every phase transition, sometimes leading, sometimes following, always profiting.

    Native tenants fare the worst in the process, often finding themselves unable to afford the rising rent and facing eviction. Those who own, however, might experience a windfall, their abodes now worth ten to fifty times more than their grandparents paid. Of the four-phase process, a neighborhood like St. Roch is currently between phases 1 and 2; the Irish Channel is 3-to-4 in the blocks closer to Magazine and 2-to-3 closer to Tchoupitoulas; Bywater is swiftly moving from 2 to 3 to 4; Marigny is nearing 4; and the French Quarter is post-4.

    Locavores in a Kiddie Wilderness

    Tensions abound among the four cohorts. The phase-1 and -2 folks openly regret their role in paving the way for phases 3 and 4, and see themselves as sharing the victimhood of their mostly black working-class renter neighbors. Skeptical of proposed amenities such as riverfront parks or the removal of an elevated expressway, they fear such “improvements” may foretell further rent hikes and threaten their claim to edgy urban authenticity. They decry phase-3 and -4 folks through “Die Yuppie Scum” graffiti, or via pasted denunciations of Pres Kabacoff (see Figure 2), a local developer specializing in historic restoration and mixed-income public housing.

    Phase-3 and -4 folks, meanwhile, look askance at the hipsters and the gutter punks, but otherwise wax ambivalent about gentrification and its effect on deep-rooted mostly African-American natives. They lament their role in ousting the very vessels of localism they came to savor, but also take pride in their spirited civic engagement and rescue of architectural treasures.

    Gentrifiers seem to stew in irreconcilable philosophical disequilibrium. Fortunately, they’ve created plenty of nice spaces to stew in. Bywater in the past few years has seen the opening of nearly ten retro-chic foodie/locavore-type restaurants, two new art-loft colonies, guerrilla galleries and performance spaces on grungy St. Claude Avenue, a “healing center” affiliated with Kabacoff and his Maine-born voodoo-priestess partner, yoga studios, a vinyl records store, and a smattering of coffee shops where one can overhear conversations about bioswales, tactical urbanism, the klezmer music scene, and every conceivable permutation of “sustainability” and “resilience.”

    It’s increasingly like living in a city of graduate students. Nothing wrong with that—except, what happens when they, well, graduate? Will a subsequent wave take their place? Or will the neighborhood be too pricey by then?

    Bywater’s elders, families, and inter-generational households, meanwhile, have gone from the norm to the exception. Racially, the black population, which tended to be highly family-based, declined by 64 percent between 2000 and 2010, while the white population increased by 22 percent, regaining the majority status it had prior to the white flight of the 1960s-1970s. It was the Katrina disruption and the accompanying closure of schools that initially drove out the mostly black households with children, more so than gentrification per se.1  Bywater ever since has become a kiddie wilderness; the 968 youngsters who lived here in 2000 numbered only 285 in 2010. When our son was born in 2012, he was the very first post-Katrina birth on our street, the sole child on a block that had eleven when we first arrived (as category-3 types, I suppose, sans the “bohemian”) from Mississippi in 2000.2

    Impact on New Orleans Culture

    Many predicted that the 2005 deluge would wash away New Orleans’ sui generis character. Paradoxically, post-Katrina gentrifiers are simultaneously distinguishing and homogenizing local culture vis-à-vis American norms, depending on how one defines culture. By the humanist’s notion, the newcomers are actually breathing new life into local customs and traditions. Transplants arrive endeavoring to be a part of the epic adventure of living here; thus, through the process of self-selection, they tend to be Orleaneophilic “super-natives.” They embrace Mardi Gras enthusiastically, going so far as to form their own krewes and walking clubs (though always with irony, winking in gentle mockery at old-line uptown krewes). They celebrate the city’s culinary legacy, though their tastes generally run away from fried okra and toward “house-made beet ravioli w/ goat cheese ricotta mint stuffing” (I’m citing a chalkboard menu at a new Bywater restaurant, revealingly named Suis Generis, “Fine Dining for the People;” see Figure 2). And they are universally enamored with local music and public festivity, to the point of enrolling in second-line dancing classes and taking it upon themselves to organize jazz funerals whenever a local icon dies.

    By the anthropologist’s notion, however, transplants are definitely changing New Orleans culture. They are much more secular, less fertile, more liberal, and less parochial than native-born New Orleanians. They see local conservatism as a problem calling for enlightenment rather than an opinion to be respected, and view the importation of national and global values as imperative to a sustainable and equitable recovery. Indeed, the entire scene in the new Bywater eateries—from the artisanal food on the menus to the statement art on the walls to the progressive worldview of the patrons—can be picked up and dropped seamlessly into Austin, Burlington, Portland, or Brooklyn.


    Figure 2. “Fine Dining for the People:” streetscapes of gentrification in Bywater. Montage by Richard Campanella.

    A Precedent and a Hobgoblin

    How will this all play out? History offers a precedent. After the Louisiana Purchase in 1803, better-educated English-speaking Anglos moved in large numbers into the parochial, mostly Catholic and Francophone Creole society of New Orleans. “The Americans [are] swarming in from the northern states,” lamented one departing French official, “invading Louisiana as the holy tribes invaded the land of Canaan, [each turning] over in his mind a little plan of speculation”—sentiments that might echo those of displaced natives today.3 What resulted from the Creole/Anglo intermingling was not gentrification—the two groups lived separately—but rather a complex, gradual cultural hybridization. Native Creoles and Anglo transplants intermarried, blended their legal systems, their architectural tastes and surveying methods, their civic traditions and foodways, and to some degree their languages. What resulted was the fascinating mélange that is modern-day Louisiana.

    Gentrifier culture is already hybridizing with native ways; post-Katrina transplants are opening restaurants, writing books, starting businesses and hiring natives, organizing festivals, and even running for public office, all the while introducing external ideas into local canon. What differs in the analogy is the fact that the nineteenth-century newcomers planted familial roots here and spawned multiple subsequent generations, each bringing new vitality to the city. Gentrifiers, on the other hand, usually have very low birth rates, and those few that do become parents oftentimes find themselves reluctantly departing the very inner-city neighborhoods they helped revive, for want of playmates and decent schools. By that time, exorbitant real estate precludes the next wave of dynamic twenty-somethings from moving in, and the same neighborhood that once flourished gradually grows gray, empty, and frozen in historically renovated time. Unless gentrified neighborhoods make themselves into affordable and agreeable places to raise and educate the next generation, they will morph into dour historical theme parks with price tags only aging one-percenters can afford.

    Lack of age diversity and a paucity of “kiddie capital”—good local schools, playmates next door, child-friendly services—are the hobgoblins of gentrification in a historically familial city like New Orleans. Yet their impacts seem to be lost on many gentrifiers. Some earthy contingents even expresses mock disgust at the sight of baby carriages—the height of uncool—not realizing that the infant inside might represent the neighborhood’s best hope of remaining down-to-earth.

    Need evidence of those impacts? Take a walk on a sunny Saturday through the lower French Quarter, the residential section of New Orleans’ original gentrified neighborhood. You will see spectacular architecture, dazzling cast-iron filigree, flowering gardens—and hardly a resident in sight, much less the next generation playing in the streets. Many of the antebellum townhouses have been subdivided into pied-à-terre condominiums vacant most of the year; others are home to peripatetic professionals or aging couples living in guarded privacy behind bolted-shut French doors. The historic streetscapes bear a museum-like stillness that would be eerie if they weren’t so beautiful.

    Richard Campanella, a geographer with the Tulane School of Architecture, is the author of Bienville’s Dilemma, Geographies of New Orleans, Delta Urbanism, Lincoln in New Orleans, and other books. He may be reached through richcampanella.com, rcampane@tulane.edu, and nolacampanella on Twitter.

    ——–

    1 The years-long displacement opened up time and space for the ensuing racial and socio-economic transformations to gain momentum, which thence increased housing prices and impeded working-class households with families from resettling, or settling anew.

    2 These Census Bureau race and age figures are drawn from what most residents perceive to be the main section of Bywater, from St. Claude Avenue to the Mississippi River, and from Press Street to the Industrial Canal. Other definitions of neighborhood boundaries exist, and needless to say, each would yield differing statistics.

    3 Pierre Clément de Laussat, Memoirs of My Life (Louisiana State University Press: Baton Rouge and New Orleans, 1978 translation of 1831 memoir), 103.