Category: Urban Issues

  • Is Urbanism the New Trickle-Down Economics?

    The pejoratively named “trickle-down economics” was the idea that by giving tax breaks to the wealthy and big business, this would spur economic growth that would benefit those further down the ladder. I guess we all know how that worked out.

    But while progressives would clearly mock this policy, modern day urbanism often resembles nothing so much as trickle-down economics, though this time mostly advocated by those who would self-identify as being from the left. The idea is that through investments catering to the fickle and mobile educated elite and the high end businesses that employ and entertain them, cities can be rejuvenated in a way that somehow magically benefits everybody and is socially fair.

    Trickle down economics type policies failed both because while they contained a great deal of truth – tax rates do matter in economic development – they were a reductionist oversimplification, and perhaps more importantly were self-interested recommendations of the very class that would benefit from them. The tax breaks for the wealthy and big business were in fact the real goals, not primarily policies intended for socially beneficial consequences it was said would result from them.

    As it turns out, urbanism in its current form appears to suffer from the exact same problems, as Richard Florida has just documented in an article over at Atlantic Cities called “More Losers Than Winners in America’s New Economic Geography.”

    A key question remains: Who benefits and who loses from this talent clustering process? Does it confer broad benefits in the form of higher wages and salaries to workers across the board or do the benefits accrue mainly to smaller group of knowledge, technology, and professional workers?

    The University of California, Berkeley’s Enrico Moretti suggests a trickle-down effect, arguing that higher-skill regions benefit all workers by generating higher wages for all workers. Others contend that this new economic geography is at least partially to blame for rising economic inequality.
    ….
    I’ve been examining the winners and losers from this talent clustering process in ongoing research with Charlotta Mellander and our Martin Prosperity Institute team….Our main takeaway: On close inspection, talent clustering provides little in the way of trickle-down benefits. Its benefits flow disproportionately to more highly-skilled knowledge, professional and creative workers whose higher wages and salaries are more than sufficient to cover more expensive housing in these locations. While less-skilled service and blue-collar workers also earn more money in knowledge-based metros, those gains disappear once their higher housing costs are taken into account.

    In short, there’s no flow through to people who aren’t directly tapped into the knowledge economy itself. I might add that this probably does include a number of service sector workers like celebrity chefs and personal trainers who cater to the luxury end of services. But the majority of residents are missing out.

    To put it in political speak, the creative class doesn’t have much in the way of coattails.

    These findings also foot to the implications of Saskia Sassen’s global city theories, in which the global city functions of a region comprise a sort of “city within a city” which has little in common with the rest of the metro region as thus perhaps little impact on it. Indeed, we might even view the two economic geographies as being in conflict.

    Florida and Sassen are academics and so can’t necessarily be seen as advocates for the phenomena they describe. They are describing what is, not what should be. The question is, what have policy makers done with this information?

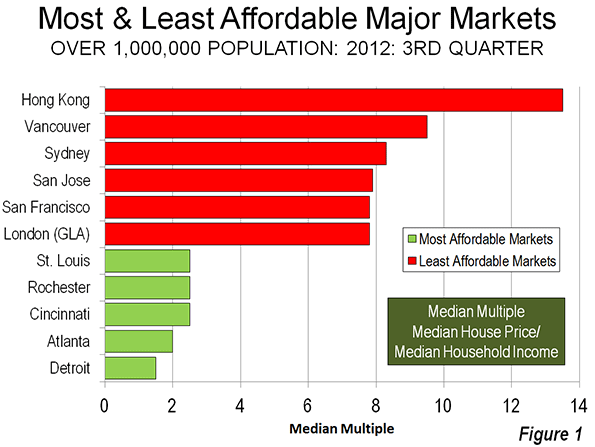
    As with the tax rate example, there really is an importance to attracting educated people to your city. College degree attainment explains almost everything about per capita income in a region. (Though as Florida notes, per capita values, as means, can be misleading and median is a better way to do analysis where it’s available).

    Have urbanists used this as a call to arms to put all of their energy into helping those left behind in the knowledge/creative class economy? No. Instead, urban advocates have gone the other direction, locking onto this in a reductionist way to develop a set of policies I call “Starbucks urbanism.” That is, the focus is on an exclusively high end, sanitized version of city life that caters to the needs of the elite with the claim that this will somehow “revitalize” the city if they are attracted there.

    As with trickle-down economics, this a) doesn’t work and b) is being promoted by the self-interested.

    Firstly, it doesn’t work because it more or less operates on the basis of displacement. So it might revitalize certain select districts, but only as physical geographies not human ones. This is exactly because of the phenomenon Florida identified: there are few trickle down benefits to be had. Also, this only works in a handful of districts or in cities that are so small that you can plausibly gentrify the entire thing. The area left behind in these places, as the in the violence stricken neighborhoods of Chicago that are making national news, receive virtually no benefit. And as Bill Frey of Brookings once said, “There aren’t enough yuppies to go around to save Detroit.” Thus only a comparatively small number of cities benefit from talent concentrations anyway. (Indeed, the notion of “concentration” is inherently a relative one).

    Secondly, and here I go beyond Florida’s article, urban advocates are a largely self-interested class. Everybody knows that a hedge fund plutocrat is looking out for number one and has a class interest, but if we were honest with ourselves, most of us probably do the same at some different level. For example, it’s easy to cry nepotism when a politician’s relative gets put on the payroll, but if a man gets his son on at the ironworkers union, it generally flies under the radar. I don’t claim to be exempt from this myself.

    The people most aggressively pushing urbanist policies like bike lanes, public art, high end mixed use developments, high tech startups, swank boutiques and restaurants, greening the city policies, etc. are disproportionately those who want to live that lifestyle themselves, or hope to someday. Like me in other words. The fact that you’re a Millennial who rides around to microbreweries on your fixie without necessarily having a high paying job yourself (yet) doesn’t matter. You are still advocating for your own preferred milieu, and that of others who think like yourself.

    I have observed that when challenged on this, urbanists grow indignant, talking about their commitment to the planet or how transit benefits the poor, etc. But ultimately as with the tax cut advocates, that’s just a self-justification. With some notable exceptions, you don’t see social justice and equity issues front and center in the urbanists discussions outside of old-school community organizing/activism circles, groups that are almost totally distinct from Atlantic Cities style urbanism.

    Most urbanists I know are quick to advocate tax increases for the 1% but fail to see how their own policies contribute to a widening of the income gap and class divide in their own cities. Even if they are genuinely motivated to help the entire civic commonwealth, hopefully they recognize that they at least have the same conflict of interest situation they would be quick to highlight in a businessman or politician.

    The answer isn’t to junk urbanism. Just as class warfare rhetoric that demonizes the wealthy and business and wants to tax the daylights out of them isn’t the solution to what ails our economy, neither is abandoning many of the principles of urbanism. After all, tax rates do matter for economic growth. Similarly, liveable streets and such are indeed very important to urban revitalization.

    What’s needed is a new orientation of these ideas so that we don’t end up with an explicitly elitist policy rationale and policy set that caters to the already privileged at the expense of the poor and middle classes of our cities. We need to be asking the question of what exactly we are doing to benefit the people without college degrees beyond assuring them that if we attract more people with college degrees everything will be looking up for them. We need to sell ideas like transit in a way that isn’t totally dependent on items like “enabling us to attract the talent we need for the 21st century economy.” If I read half as much about providing economic opportunity and facilitating upward social mobility for the poor and middle classes as I do about green this, that, or the other thing, we’d be getting somewhere. (Observe Robert Munson’s recent call to broaden the practical definition of green as one example of starting to think this way). I need to do this as much as anyone.

    It’s easy to see why people default to trickle-down type theories even beyond class interest. Both sets of prescriptions – tax cuts for the elite and urbanism for the elite – took place against a backdrop of globalization and deindustrialization that eviscerated the engines of traditional working and middle class prosperity. The answers to how to fix this core problem aren’t obvious. Richard Longworth recently put together a compilation of views on middle class malaise and it is sobering reading.

    In a sense, elite boosting policies have “worked” because they’ve successfully boosted the elite – a reasonably tractable problem in the new economy. But they’ve had few benefits to anyone else and have fueled huge class-based resentments that threaten civic cohesion. But just because the problem of opportunity for the poor and middle classes isn’t easy, doesn’t mean it doesn’t need to be solved. Indeed, rebuilding an engine of broad-based prosperity and upward mobility is the signature challenge of our age, and one to which urbanists should be encouraged to apply their fullest efforts.

    Aaron M. Renn is an independent writer on urban affairs and the founder of Telestrian, a data analysis and mapping tool. He writes at The Urbanophile, where this piece originally appeared.

    Chicago skyline photo by Bigstock.

  • Dispersion in the World’s Largest Urban Areas

    No decade in history has experienced such an increase in urban population as the last. From Tokyo-Yokohama, the world’s largest urban area (population: 37 million) to Godegård, Sweden, which may be the smallest (population: 200), urban areas added 700 million people between 2000 and 2010.

    Nearly one in 10 of the world’s new urban residents were in the fastest growing metropolitan regions (see: Definition of Terms used in "The Evolving Urban Form" Series), which added nearly 60 million residents. They ranged from a an estimated increase of more than 8.5 people in Karachi (Note 1) to 3.9 million people in Mumbai (Figure 1). The average population growth in these 10 metropolitan regions was 6 million, approximately the population of Dallas-Fort Worth or Toronto, which were fast-growers on their own in comparison to other high income world cities.

    By comparison, the largest growth over any single decade over the past half century in US metropolitan areas has been less than one half of the 6 million average: 2.43 million in New York (1920s) and 2.37 million in Los Angeles (1950s). Only Tokyo-Yokohama (1960s) and Shenzhen (1990s) have added more than 5 million people in a single decade before the last decade.

    Growth has been overwhelmingly concentrated outside the urban cores (Note 2) in these 10 fastest growing metropolitan region. Excluding Karachi (for which sufficient data is unavailable), approximately 85 percent of the growth was outside the urban cores (A 42 million increase in the suburbs and 8 million in the urban cores).

    Dispersion in World Megacities

    This is consistent with the findings of The Evolving Urban Form series, which is now two years old. These analyses have generally demonstrated that urban spatial expansion (pejoratively called "sprawl") is world-wide and contrary to some perceptions, not limited to the United States. Cities expand geographically as they add population, though this organic tendency is sometimes contained by urban planning. Peripheral growth is virtually always at lower densities than in urban cores, which means that as cities grow they tend to become less dense (Note 3).

    This process ironically is sometimes accelerated by planning decision-making. London‘s greenbelt —which banned the extension of housing into the near periphery of the city — has result in even greater sprawl to far outside the principal urban area. This trend since World War II, has forced commuters to travel longer times and distances to the urban core (All of metropolitan London’s growth has been suburban for 100 years, with a loss of 1.8 million in inner London, while the suburbs and exurbs grew by 10.5 million).

    The Evolving Urban Form has now covered 23 of the world’s 28 megacities (Note 4). As the Table indicates, population growth has been strongly oriented away from the urban cores and toward more suburban areas

    Table
    Summary of Megacity Population Trends
    URBAN AREA CORRESPONDING METROPOLITAN REGION
    Bangkok 10 Years: 55% of growth outside core municipality
    Beijing 10 Years: 99% of growth outside core districts
    Buenos Aires 60 Years: 100%+ of growth outside core municipality
    Cairo 16 Years: 2/3 of growth outside core governate
    Delhi 10 Years: 90% of growth outside core districts
    Dhaka 10 Years: 50% of growth outside core municipalities
    Guangzhou-Foshan 10 Years: 75%+ of growth outside core districts
    Istanbul 25 Years: 100%+ growth outside core districts
    Jakarta 20 Years: 85% of growth outside core jurisdiction
    Kolkata 20 Years: 95% of growth outside core municipality
    Los Angeles 60 Years: 85% growth outside core municipality
    Manila 60 Years: 95% growth outside core municipality
    Mexico City 60 Years: 100%+ of growth outside core districts
    Moscow 8 Years: 95% of growth outside core districts
    Mumbai 50 Years: 98% of growth outside core districts
    New York 60 Years: 95% growth outside core municipality
    Osaka-Kobe-Kyoto 50 Years: 95% of growth outside core municipalities
    Rio de Janeiro 10 Years: 95% of growth outside core districts
    Sao Paulo 20 Years: 2/3 of growth outside core municipality
    Seoul 20 Years: 115%+ of growth outside core municipality
    Shanghai 10 Years: 99% of growth outside core districts
    Shenzhen 10 Years: 70%+ of growth outside core districts
    Tokyo 50 Years: 95% of growth outside core municipalities


    In US examples, New York and Los Angeles, 95 percent and 85 percent of growth respectively of their corresponding metropolitan region growth has occurred outside the core municipalities since 1950. But these US regions are joined by middle income Buenos Aires and Mexico City where all growth has been outside urban core since 1950. In lower income Manila, 95 percent of the growth has been outside the urban core since 1950.

    The world’s largest metropolitan region, Tokyo-Yokohama, has experienced a virtual monopoly of suburban growth over the past 50 years, as has Japan’s second largest metropolitan region, Osaka-Kobe-Kyoto.

    Over the past quarter century, all of Istanbul‘s growth has been outside the urban core. The urban expansion has been going on for much longer, as is illustrated over the past 60 years (Figure 2). Cairo‘s urban expansion is similarly substantial (Figure 3). In one of the developing world’s poorer megacities, nearly all population growth in the Mumbai region has been outside the urban core for 50 years

    For the last 20 years, more than 115 percent of the growth in the Seoul-Incheon metropolitan region has been outside the core city. In the world’s second largest urban area, Jakarta (Jabotabek), growth is also strongly suburban, accounting for 85 percent of growth over the past two decades. In Kolkata suburban growth has been 95 percent over the same two decades.

    The same tendency is evident in the other megacities. Over the past decade or two, nearly all population growth in China’s four megacities (Shanghai, Beijing, Guangzhou-Foshan and Shenzhen), Delhi and Rio de Janeiro has been outside the urban cores.

    Dispersion in Other Large Urban Areas

    The Evolving Urban Form has also examined smaller urban areas. The same pattern of dispersal is evident there as well even in traditionally compact cities. Zürich, for example has had all of its growth outside the core city since 1950. All of the growth in Barcelona and Milan has been outside the core cities for 40 years. Even high density Hong Kong has experienced all of its growth outside the urban core for three decades. Low income Addis Abeba indicates a pattern of urban expansion is not unlike that of Istanbul or Cairo (Figure 4). In megacity wannabe Chicago (1.4 million short), 125 percent of growth since 1950 has been outside the core; this number reflects that the central city has been shrinking even as the periphery expands. Even in fast-growing Dallas-Fort Worth, more than 80 percent of population growth over the past 60 years has been outside the city of Dallas (which itself is largely suburban in form, see Suburbanized Core Cities).

    The one notable exception to the peripheral growth model is Quanzhou (Fujian, China), which is developing under an even more dispersed pattern, described by Yu Zhu, Xinhua Qi, Huaiyou Shao and Kaijing He at Fujian Normal University. Typically, urban areas expand from an urban core on the periphery. Quanzhou is experiencing "in situ" urbanization, the spontaneous conversion of rural areas into urban development that does not expand from the urban core. The result is a sparsely developed urban area (especially for China), with plenty of land for potential infill development in the future.

    The Future of Urbanization

    It is likely that urban areas will continue to expand as they grow larger, consistent with what appears to be both economic pressures and market preferences for lower cost, more spacious housing. For example, fast growing Ho Chi Minh City is expected to see virtually all of its population increase over the next 15 years outside the urban core. Not surprisingly Shlomo Angel, Jason Parent, Daniel Civco, Alexander Blei and David Potere at the Lincoln Land Institute project significant expansions of urban land by mid-century. And, Angel, in his Planet of Cities, notes how important it is to allow the expansion, in order to improve the quality of life for the majority of people, who deserve to live as well as people in the West.

    —-

    Note 1: Incomplete results of the 2011 Pakistan census have been reported by media in both Pakistan and India. However, no official announcement of the results has been identified from Pakistan census authorities. The Karachi population increase would be the largest metropolitan region 10 year rate of increase in history.

    Note 2: Urban cores are generally the core historical jurisdiction, which often contains substantial non-core areas, even outside the United States. Core district data within these jurisdictions is used where available. Thus, this estimate over-states the urban core population increase.

    Note 3: The driving factor in declining densities is principally transportation advances. Substantial urban expansion began with the coming of mass transit in the 19th century. However an even greater expansion began occurring with the availability of the automobile. As automobile orientation replaces transit orientation, densities tend to decline until it nearly all travel is by automobile. Even among automobile oriented urban areas, there can be large differences in urban densities. For example, transit’s market share in the Boston urban area is substantially greater than in the Los Angeles urban area. Yet the Los Angeles urban area has a population density of 7000 per square mile (2,700 per square kilometer), more than three times that of the Boston urban area, at 220 per square mile (850 per square kilometer). The difference is that in Los Angeles residential development has largely occurred densities determined by the market, with single-family housing being typically built on 1/4 acre lots. In Boston, suburban lot sizes were forced higher by urban planning requirements for large lot zoning. The result is much greater land consumption than would have occurred if people’s preferences (the market) had driven development. If Los Angeles had been developed at the same low density as Boston, its urban land area would equal that of the state of Connecticut.

    Note 4: Megacities are urban areas with more than 10 million population. Five megacities remain to be described in The Evolving Urban Form (Karachi, Lagos, Nagoya, Paris and Teheran). Corresponding metropolitan regions are used for this analysis, since historic urban area data (areas of continuous urban development) is not available for most nations.

    Wendell Cox is a Visiting Professor, Conservatoire National des Arts et Metiers, Paris and the author of “War on the Dream: How Anti-Sprawl Policy Threatens the Quality of Life.”

    —–

    Photo: New detached housing, suburban Tokyo-Yokohama (by author).

  • Why Are There So Many Murders in Chicago?

    After over 500 murders in Chicago in 2012, the Windy City’s violence epidemic continues – 2013 saw the deadliest January in over a decade – and continues to make national news.  The New York Times, for example, ran a recent piece noting how Chicago’s strict gun laws can’t stem the tide of violence.

    The NYT piece predictably spurred much debate over gun policy, but that distracts from the real question: why exactly does Chicago have so many murders?  Chicago had 512 murders in 2012. New York City – with three times Chicago’s population – had only 418 murders, the lowest since record keeping began in the 1960s.  Los Angeles, with over a million more people than Chicago, had only 298 murders.  These other cities can’t be accused of lax gun laws or somehow being immune to guns being brought in illegally from more lenient jurisdictions. So what’s different about Chicago?

    It’s impossible to say for certain what is causing Chicago’s unique murder problem, but a few possibilities suggest themselves.

    1. The number of police officers.  Depending on the report, Chicago’s police department is about 1,000 officers short of authorized strength and is facing a large number of looming retirements while few new recruits are brought in due to budget constraints. This clearly has had an impact. However, NYPD has also seen a decline in the number of officers without this effect.
    1. Police tactics. New York has made headlines with controversial, but apparently effective, tactics like the so-called “stop and frisk” policy.  The city hasn’t hesitated to defend these, even in the face of enormous negative press and lawsuits. Los Angeles has made huge strides in moving past its Detective Mark Furhman era reputation to build bridges to minority communities while Chicago has spent years and millions of dollars ignoring and defending officers who used torture to extract confessions. New York and Los Angeles also have more experience with statistically driven policing than Chicago.
    1. Politically controlled policing.  Mayor Daley hired Jody Weis from the FBI as police superintendent, but neutered his ability to run the department by assigning a political operative as Weis’ chief of staff.  Similarly, Rahm Emanuel, a fan of centralized control, has been heavily involved in driving major decisions like disbanding the anti-gang strike forces. It’s not clear whether police decisions have been driven by purely professional crime fighting concerns or, as in likely given the city’s culture, political considerations.
    1. William Bratton. Both New York and Los Angeles saw the start of their major successes against crime under the leadership of William Bratton. Los Angeles in particular was extremely smart to go hire him after his success in New York. While other cities have experienced murder declines, often with similar strategies, they are not places of the same scale, demographic diversity and political complexity of New York and LA. Perhaps Chicago should have spent whatever it took to get Bratton as police superintendent, though whether Bratton would have been willing to come into a place with such a history of political meddling with the police is uncertain.
    1. Gang fragmentation. Local and federal officials had great success taking out the leadership of many of the city’s gangs. The result has been significant gang fragmentation and a lack of hierarchical control over the rank and file that some have blamed for contributing to the violence epidemic.
    1. Depopulation. Few analyses of Chicago’s murder problem focus on the city’s very poor demographic performance.  New York City and Los Angeles are at all time population highs. Other urban areas like Boston and Washington, DC have started rebounding from population losses. However, Chicago lost a stunning 200,000 people in the 2000s and now has a population rolled back to levels not seen since 1910.  Loss of population in many neighborhoods has had many pernicious effects, including a loss of social capital (notably middle class families), loss of businesses due to loss of customers, and a diminished tax base.  It’s hard to maintain social cohesion in the face of both extreme poverty and population decline.  Similarly, the Chicago region had the worst jobs performance of any large metro in the US during the 2000s, which couldn’t have helped.
    1. Public housing demolitions. Chicago’s high rise projects like Cabrini-Green and the Robert Taylor Homes were yesterday’s national shame as hotbeds of crime and the killing of youths. Chicago was one of the most aggressive demolishers of these, with all of the high rises effectively destroyed. While this perhaps reduced localized crime, it destroyed the only homes many people had ever known, and, like depopulation, destroyed significant social capital and possibly simply redistributed and dispersed crime, as some research in other cities has suggested.  New York’s public housing is hardly problem free, but NYC  took a very different approach, investing in the high-rises rather than destroying them.  It’s hard not to speculate on what this has meant to the trajectory of crime in those two cities.

    Whatever the actual answer may be, Chicago’s murder epidemic continues to ravage families and neighborhoods. Given the results in January, it would appear the city is no nearer to getting a handle on it than it was a year ago. A reconsideration of the differences between Chicago and other large cities, and a resulting adjustment in strategy, would seem to be long overdue.

    Aaron M. Renn is an independent writer on urban affairs and the founder of Telestrian, a data analysis and mapping tool. He writes at The Urbanophile.

    Chicago photo by Bigstock.

  • Gentrification as an End Game, and the Rise of “Sub-Urbanity”

    “It took a bit of wind out of my sails, watching what happened in this neighborhood, watching how it happened…I don’t know how to beat this [gentrification]. I don’t know how anyone can beat this machine.”—From the article The Ins and Outs

    The Generalization of Gentrification

    The forces of gentrification are taking hold in America’s alpha cities. You can check the numbers or see the maps, but to get a good idea of its unprecedented rapidity, I’d suggest the blog Vanishing New York. There, you will see nearly each day the announcement of yet another old-school establishment losing the rent battle: Lenox Lounge in Harlem, Suzies Chinese Restaurant on Bleeker St., the Central Iron and Metal scrap yard below the High Line. And with the small-business soul of the city goes the regulars that gave places like New York City its identity before its global city branding.

    For instance, speaking about the closing of the Big Apple meat market in Hell’s Kitchen, writer Jeremiah Moss vents on the city’s whitewashing:

    The [Big Apple] exterior is wonderfully dreary, covered in graffiti and pigeon shit. Standing here, you could dream yourself into a lost New York. But not for long. It’s all coming down for more glass, more chain stores.

    A couple of years ago, the Times did a piece on Big Apple. The article includes a wonderful slideshow of photos, featuring the sort of person who shops at Big Apple, the sort of person that is also vanishing from New York, replaced by the svelte and distracted, the hollow men and women, tapping away at iPhones in sterilized Whole Foods aisles.


    Courtesy of The New York Times

    This is not a localized thing, as cities everywhere are grappling with the abruptness and consequences of such change. And while gentrification has been occurring here and there for decades, with community capital unwound on a street-by-street basis for higher returns and bigger tax receipts, the sheer push from above, like meat through a grinder, is now so systematic—and no longer personified by the Robert Moses’s of the world but by a kind of faceless force blowing a current of yield and tidiness in—that it has just become what is, with the late scholar Neil Smith referring to this latest iteration as the “generalization of gentrification”.

    In his article “New Globalism, New Urbanism: Gentrification as Global Urban Strategy”, Smith examines how gentrification has morphed from an unfortunate effect to an outright aim. One explanation for this relates to the ever-morphing private-public partnership in cities in which elected officials have forgone governing for investing, with policy no longer aspiring to guide economic growth but rather being crafted to “fit in the grooves” of market forces, particularly in the realm of real estate.

    Why real estate?

    Part of the reason is that economic leaders now primarily see Americans as consumers as opposed to producers, and so cities—particularly alpha dog global cities—have shifted their focus from payrolls to price per square feet, making real estate an increasingly important productive engine of cities as opposed to the productive capacity of the citizen. Enter, then, the volitional push of attracting as many creative class gentry as possible into the confines of a place, with real estate gimmicks—such as Mayor Bloomberg’s recent microapartment push—aimed at further squeezing blood from areas with far more density than available space.

    Does such wealth-packing inject capital into a given space? Yes. Is it a viable economic growth model? Wrote Aaron Renn in a recent New Geography piece:

    Indeed, all too much urbanism amounts to a sort of trickle down economics of the left, in which a “favored quarter” of artists, high end businesses, and the intelligentsia are plied with favors and subsidies while precious little ever makes it to those at the bottom rungs of society.

    This is not to disown the fact that global cities are economic engines in their own right. They are. It is only to state that their long-term economic growth prospects are being sold down the river at an exorbitant price. After all, people develop, not places.

    Gentrification of the Mind

    Allocating supply is one thing, but stoking the psychogeography of the creative class to want and squeeze into high-priced real estate is another. Historically, the common desire to move to an alpha dog city is to be where the action is. Moreover, NYC, Chicago and the like can graduate you. They can defang your limits while toiling the mind to the experiencing of new people and ideas. Said John Lennon:

    I regret profoundly that I was not an American and not born in Greenwich Village. It might be dying, and there might be a lot of dirt in the air you breathe, but this is where it’s happening.

    Yet this “if you can make it here you can make it anywhere” pull is arguably not what’s driving the generalization of gentrification. Rather, it is the idea of big city suburbanization, or more exactly: the hybridization of city “vitality” with the comforts of suburbanization, creating for a kind of third place called “sub-urbanity”.

    In many respects, this is not surprising, as the most recent “return-to-city” movement is largely fueled by younger suburbanites who are tired of missing out on big city action. Not the action per se of Charles Bukowski’s L.A. or Patti Smith’s New York, but the action of, well, Chandler, Kramer, and Carrie. Said Alan Ehrenhalt, author of The Great Inversion and the Future of American Cities:

    This is the generation, don’t forget, that watched Seinfeld and Sex and the City and Friends – usually from sofas safe in the confines of the suburbs. I think they find suburban life less exciting than urban life. While they are in a single or childless situation, they’re particularly eager to try it.

    And try it they should: varied experiences make varied lives make more richly contextualized societies. But the rub here is that the mentality sewn from “the confines of the suburbs” is not being sacrificed for the beautifully unnerving experience that is “the real” of city life, but rather that creative class enclaves are increasingly being appropriated into the domesticated lifestyle embodied by traditional suburbia.

    Of course John Lennon’s Greenwich Village this is not. And this bodes ill for alpha dog cities in that vanilla-ing a people and a place is a death knell to collective urgency, if only because comfort puts to sleep the burn that has traditionally sparked the next generation of ideas. Writes Sarah Schulman, author of The Gentrification of the Mind: Witness to a Lost Imagination:

    Gentrification is a replacement process. So it is where diversity is replaced by homogeneity, and this, I believe, undermines urbanity and changes the way we think because we have much less access to a wide variety of points of view. We are diminished by it. So literally, the range of our mind’s reach is much more limited because of gentrification.

    But again: lest we think this is all a mistake, or simply the byproducts of shifting demographics or economic and cultural change. Rather, it is the point. It is today’s path toward urban renaissance. And it’s a path creating for a “sub-urbanity” that is emerging when the generalization of gentrification meets the gentrification of the mind.

    So, what does this mean for the future of urban development? My guess is that there will be a growing unhappiness with sub-urbanity that’s going to create for a lot of people left wanting, be they young suburbanites longing for urban authenticity or indigenous urbanites who are tired of the schtick. As such, cities would do well to prepare for the “return-of-the-city movement”, which means prioritizing urban integrity and community capital against the temptations of the gentrifying machine.

    Richey Piiparinen is a writer and policy researcher based in Cleveland. He is co-editor of Rust Belt Chic: The Cleveland Anthology. Read more from him at his blog and at Rust Belt Chic.

    Lead photo by Liz Ferla, flickr user lism.

  • The Evolving Urban Form: Rio de Janeiro

    Rio de Janeiro was the capital of Brazil from before independence from Portugal was declared in 1822. That all changed in 1960, when the capital moved to the modern planned city of Brasilia, more than 500 miles (800 kilometers) inland. The move, however, did nothing to slow Rio de Janeiro’s growth, as the metropolitan area (as designated by Brazil’s census agency, the Instituto Brasileiro de Geografia e Estatística),  added 7 million people – a 150 percent increase in population – over the ensuing 60 years

    The placement of the federal government in Brasilia has had positive economic impacts on the interior, but it did not make Rio de Janeiro less crowded (factor Indonesian officials should note as they consider moving the capital from Jakarta,).

    The Urban Area

    However, it is clear that Rio de Janeiro has fallen behind even faster growing Sao Paulo, which has become one of the world’s 10 largest urban areas (with a population of approximately 20.5 million in 2013). Nonetheless, as an urban area with a 2013 population of 11.6 million (Figure 1) Rio de Janeiro still ranks among the world’s megacities (urban areas over 10 million).

    The urban area covers 720 square miles (1,870 square kilometers),   a population density of 16,100 per square mile (6,200 per square kilometer). This is similar to the density of Sao Paulo, 20 percent above that of Buenos Aires, but 35 percent less dense than the western hemisphere’s most dense megacity, Mexico City. In contrast, Rio is more than twice as dense as the most dense Canadian and US urban areas, Toronto and Los Angeles, but less than 1/6th the density of Dhaka, the world’s most dense megacity.

    Metropolitan Dispersion

    As this series on world urbanization has shown, cities tend to become less dense as they grow (at least until they reach predominantly automobile oriented densities). This can be seen in Rio de Janeiro as well. Since the 2000 census, virtually all of the population growth has been in less dense areas. The inner core (the districts or bairros of Zona Centro), for example, accounted for two percent of the urban area’s growth over the past decade. The larger, inner core (around the urban core) accounted for three percent of the growth (principally the Zona Sul and some additional bairros adjacent to Zona Cento and Zona Sul).

    A Suburbanized Core City: Like many core municipalities around the world, Rio de Janeiro contains large expanses of suburbanization (Photo: Rio’s In-City Suburbs). The suburban portions of the municipality accounted for 43 percent of the growth, while the outside-the-municipality suburbs and exurbs (inside the metropolitan area, but outside the urban area) represented 53 percent of the growth (Figure 2). Most of the growth outside the municipality of Rio de Janeiro has been across Guanabara Bay, with the large suburbs of Niteroi and São Gonçalo, and to the north, where there are a number of large municipalities (such as Duque de Caxias and Nova Iguaçu).


    Photo: Rio’s In-City Suburbs

    This preponderance of growth outside the dense core has been developing since 1950. The municipality of Rio de Janeiro has added 3.9 million residents since 1950, while the suburbs and exurbs have added 4.8 million. The municipality continues to have more than half of the population (53 percent), down from 76 percent in 1950 (Figure 3). However, the retention of this strong share of the population has been made possible only by the large amount of land available for suburban development within the municipality (this is similar to the experience of other suburbanized core cities, such as San Jose, Edmonton, Phoenix, Denver, and Kansas City).

    The Physical Setting

    Rio de Janeiro sits on the Atlantic Coast and is one of the world’s leading tourist beach areas (Copacabana and Ipanema). The urban area straddles Guanabara Bay, with the municipality of Rio de Janeiro on the west side. A bridge leads to Niteroi, on the east side. The municipality of Rio de Janeiro covers virtually the same land area as the city of Los Angeles and like its American counterpart also includes mountainous areas. The mountains include Sugar Loaf and Corcovado, site of the world famous "Cristo Redentor" statue ("Christ the Redeemer") and others.  North and West of the mountains are the broad plains that contain most of the suburbanization (both within and outside the municipality).

    Favelas

    Favelas, also called shantytowns or informal housing proliferate throughout much of Latin America. It is estimated that 20 percent of new municipality’s population lives in favelas. The largest of these is Rocinha, which accounted for a full one third of the inner and outer core growth over the last 10 years, despite having less than 5% of the population. Rocinha is located on a steep hill adjacent to affluent São Conrado, which provides employment for many residents. This is typical for shantytowns around the world, which are located near principally domestic labor opportunities, since residents generally have only limited mobility options to employment in the rest of the urban area. The favela to affluent neighborhood model represents an effective example of a "jobs – housing balance," though   rooted in poverty and gaping class distinctions. (Photo: Rocinha Favela & São Conrado, top).

    Transport

    Mass transit is very important in Rio de Janeiro. More than one half of all travel is on the Metro, commuter railways, buses and informal vans. In recent decades, the rail share of travel has been falling substantially, while the van share of travel has increased substantially. Vans have also made serious inroads into mass transit ridership in other urban areas of Brazil.

    This dependence on transit does not mean that the roads are uncongested. For example, Avenida Brasil, the main arterial leading to Centro from the North carries more than 200,000 vehicles each day, a figure that exceeds that of many US urban freeways. A new peripheral freeway is under construction arcing around the urban area from west to east.

    Gross Domestic Product

    According to the Brookings Institution Global Metro Monitor, Rio de Janeiro had a gross domestic product per capita of approximately $16,300 in 2012. This would rank Rio de Janeiro 100th out of the 300 top metropolitan area economies in the world (Note 1). This is below Latin American leaders Buenos Aires ($26,100) and Sao Paulo ($23,700). It is also below the more affluent Chinese metropolitan areas, such as Shenzhen ($28,000) and Shanghai ($21,400). Rio, however, ranked above Cape Town ($15,700) and Cairo ($10,000).

    Life After the Capital Leaves

    The growth of Rio de Janeiro shows that there is, indeed, life after the national capital leaves. Rio has experienced strong economic growth in recent years and remains a dynamic urban region.

    Wendell Cox is a Visiting Professor, Conservatoire National des Arts et Metiers, Paris and the author of “War on the Dream: How Anti-Sprawl Policy Threatens the Quality of Life.”

    —-

    Note: These rankings are based on the 300 metropolitan areas with the largest total gross domestic product (not per capita gross domestic product). As a result, many metropolitan areas that are more affluent per capita are not included because their total gross domestic product is not rank in the top 300. This would include a large number of metropolitan areas in the United States, Europe Canada and elsewhere. The ranking of metropolitan areas in China is adjusted for the 2010 census, which includes migrant workers. Additional details are provided in Endnote 19 in the Brookings Global Metro Monitor.

    Top Photo: Rocinha Favela & São Conrado (photos by author)

  • Britain’s Housing Crisis: The Places People Live

    For twenty years British house building has fallen behind demand, forcing up prices and rents. Here’s a series of photos showing some of the things people have had to do to live.

    Victoria Campbell was living in a shed in her parents’ garden in Havant, while she and her fiance saved up for a deposit, but the Council has told her that she has to move out.


    This family in Plashet Park have been living in a shed for some time.


    In East London, council officers are going checking out garden sheds to make sure that they are not being rented out, as they check too to see if houses are over-occupied.

    In Caledonian Road, super-exploiting landlord Andrew Panayi converted unprofitable shops into money-making flats, and decided to convert their cellars into more flats.


    This is the flats’ skylight, outside.


    This is the passage and stairway down to the flats.


    This is the underground landing with the flats’ front doors.


    And this is the interior.

    These garden sheds in Southall have been turned into homes, and ones like them are rented out to labourers.

    Carl Bond and Stacey Drinkwater converted a double-decker bus for somewhere to live.

    In Crystal Palace Laura Park lives in this converted public toilet.

    Many people have tried to evade the planning laws that stop people from building, but disguising homes as sheds or barns.

    Alan and Sarah Beesely built their home inside a barn, as you can see from the skylights. They were told by the council to knock it down.

    Carl Jones built this garage, but building inspectors decided it was really a house, and told him to take it down.

    So too this toolshed in a garden centre in Stroud was found to be a home, and ordered was ordered to come down.

    In the Pembrokshire National Park Brithdir Moor, Janet and Tony Wrench built the Roundhouse, which was also ordered taken down.

    For years now housebuilders in Britain have failed to build enough homes for people to live in.

    We were told that more homes would encroach on the ‘green belt’ and the countryside. Foolish commentators like Simon Jenkins and Tristram Hunt warned – laughably – of a ‘Tsunami of concrete’ threatening the countryside. Powerful lobbies like the Campaign to Protect Rural England, the Urban Taskforce and the Green Party did all they could to stop new building. But it turns out that less than one tenth of Britain is developed.

    Instead of developing the land we need government and municipal authorities said that they would ‘build up, not out’, and that they could get more people, into less space, by more compact, smart growth. At the time the development advocacy Audacity told them that this could only lead to overcrowding, and that their ‘smart growth’ would take us back to Victorian social problems.

    Today, more people are willing to acknowledge that there is a problem with a shortage of affordable housing – but too few are willing to grasp the nettle and say we need to build many, many more houses to meet housing need.

    Some commentators have made the point that there should be council housebuilding to meet the need. Others that the planning laws should be liberalised so that private developers can build. Both of those would be a good idea, but neither should be turned into a dogma that must be observed before new homes are built. The issue is that however it is done, Britain needs to build the houses that people need to live in.

    James Heartfield’s book Let’s Build! Why We Need Five Million New Homes in the next 10 Years is available from Amazon.

  • Detroit Future City

    Recently the Detroit Works Project released their long awaited strategic plan for the city. This is the one led by Toni Griffin that produced a lot of public controversy because of suggestions it would result in the planned shrinkage or decommissioning (or even forced residential relocations) in sparsely populated neighborhoods.

    Called “Detroit Future City,” this plan doesn’t shy away from facing the tough realities that face Detroit, but its recommendations are somewhat muted with regards to shrinkage. Nevertheless, the message is clear: in a broke, declining city, neighborhood triage is a must.

    The full document is 184 pages. I perused it, but wasn’t able to review at the level of detail I normally like to. Partially this is because it was published in a hyper-annoying “cinemascope” type format that makes it almost impossible to read on screen without magnification and lots of horizontal scrolling. This aspect of the plan’s publication was an immediate knock against it in my view. However, it will share a few observations I gleaned.

    Neighborhood Development

    The plan is notable for admitting that Detroit can never be repopulated. In fact, its only goal is to stabilize population loss 20 years from now, and settle in for a population of 600-800,000 people, or approximately the same as now.

    The plan is frank about the scale of the challenges, including 150,000 vacant and abandoned parcels, empty land equal to the area of Manhattan, and vastly oversized infrastructure relative to the population and industrial base, along with poor service delivery in areas ranging from public safety (Detroit has the second highest violent crime rate in the country) to street lighting (about half of the street lights don’t work).

    Part of that does involve identifying how to deploy infrastructure in neighborhoods. Here’s a graphic on that which will no doubt get some airplay:


    Some areas are slated for upgrades, others reductions, and some perhaps “decommissioning.”

    The strength of the plan, however, is in its approach to development in which the core concept is to develop a multi-nodal network of neighborhoods, and to have neighborhoods that are strategically differentiated from each others. This is very different from the core-centric or “hub and spoke” model that exists today, and is somewhat similar to my “100 Monument Cirles” concept for Indianapolis. Suffice it to say, I like it. What was missing from this was strengthening neighborhood identify, something Pete Saunders identified as a key weakness of the city.

    A lot of the content behind this is disappointingly standard, however. The focus is green infrastructures, transit, mixed use neighborhoods, etc. This is basically planning conventional wisdom that would be at home in lots of different cities.

    I was pleased to see that they de-emphasized rail transit. Only the M-1 light rail on Woodward remains. The rest of the core network would be BRT. I’d argue that reliable and higher frequency “plain old bus service” is the core need, however. There’s the proposed transit map:


    Some may decry this, but in a city that’s over-infrastructured as it is, the last thing you need is more physical plant to maintain over time.

    And perhaps the focus on green is to some extent understandable given the vast quantity of vacant land in Detroit. One of their intriguing concepts is “landscape as infrastructure”, though it didn’t fully connect with me. They did talk about ideas like medium intensity agriculture and new urban forest typologies. The Hanzt Farm example shows this already underway.

    Lastly, the focus, and especially the near term recommendations around, regulatory restructuring is critical. Detroit benefits today from a sort of laissez-faire environment because government is so ineffective. If government effectiveness were restored, it could easily strangle the good things happening in Detroit, which are largely non-conforming. The answer is to get the regulatory system up to date with what we want to see. I would have preferred to see some types of harder targets around this, such as “85% of new development approved as of right.”

    Economic Development

    The plan considers boosting the number of jobs in Detroit as the most important mission. The city today has the 5th lowest number of jobs per resident of any of the top 100 cities in America, this despite large population losses. Jobs in the city are needed both for residents and rebuild the tax base.

    The numbers on this seemed a bit squishy though. The report says that there is one job for ever four residents of Detroit. As there are about 700,000 residents, this would mean about 175,000 jobs. Yet they say there are 350,000 jobs. (If the resident figure included only working age adults, the projected number of current jobs would be even lower than my estimate).

    The goal by 2030 is to increase this to between 2 and 3 jobs for every resident. This implies simply staggering job growth. Their mid-point population estimate for 2030 is still 700,000, so to go from 0.25/1 to 2/1 or 3/1 implies 700-1100% job growth. This is a CAGR of 11-13% – off the charts. To put it in perspective, metro Houston’s job growth CAGR from 2000 to 2011 was only 1.3%.

    I may be totally off base on what they were getting at in these numbers, but having solid and realistic projections is critical, and, alas, all too rare. Unrealistic growth rate assumptions are common in civic plans, as I highlighted in the example of Cincinnati’s Agenda 360 plan.

    [ Update: I was contacted by someone from the study’s technical committee indicating that the 2 or 3 jobs per resident figure was an error in the PDF that was not present in the official version of the plan. There are apparently about 193,000 jobs in the city, with the plans actual goal a doubling of that over 30 years. Still ambitious, but not mathematically impossible. ]

    The job growth is projected to come from four key target sectors: eds and meds, digital and creative, industrial, and local entrepreneurship. These sectors are reasonable as these things go given where Detroit is, but seem unlikely to drive the major growth they seek, excepting possibly entrepreneurship.

    Neither Wayne State nor Detroit’s health care/life science infrastructure is nation leading. Every city and state in America is chasing eds and meds, and as I noted, the great growth curve in these industries may be over. Additionally, the trend nationally seems to be towards more decentralization of health care infrastructure in metro areas. While I’m sure there will be some growth here, I’m not optimistic about major expansion.

    Similarly, digital and creative jobs are the fad du jour. I strongly doubt anyone will even consider there to be categories of jobs called “digital” or “creative” by 2030. These will be absorbed into industry generally. These are also the same types of sectors being pursued everywhere. Detroit certainly has a concentration of these because of its auto design cluster and just simply being a big city. But other than autos, does it really have a competitive advantage here? The big expansion opportunity would seem to be mostly suburban relocations of the type spearheaded by Dan Gilbert. I wonder how much gas is left in that tank, however.

    The other two are more promising. Local entrepreneurship is a catch-all, but clearly indigenous startups are a great way to boost the economy. The report’s focus on equipping and facilitating minority entrepreneurship was especially relevant. Given the collapse of the city, Detroit’s residents have had to become innovative and self-sufficient of necessity. These skills from the school of hard knocks are in many ways worth much more than formal education when it comes to starting a business. If the city can figure out how to marry these “survival skills” of residents with a commercial orientation, it could be powerful. The same recipe of figuring how to do business in unstable and tough environments is common in the Middle East, where there’s a longstanding entrepreneurial and trading tradition. Unsurprisingly, Middle Easterners have been prominent among those who’ve thrived in Detroit. The challenge is how to activate the similar skills in other ethnicities for business purposes.

    Industrial employment would also seem to be a possible area of growth, but not in the way envisioned in this plan. Industrial employment has been in decline, and new industrial facilities have tended to locate in outlying areas, not traditional urban manufacturing zones.

    However, there are types of industrial businesses that can have a hard time finding a home. For places that are willing to welcome them, there could be opportunity. I noted this around the heavy industrial zone in Northwest Indiana.

    This involves being willing to take on more brown than green industry, however. And it raises a whole host of issues around environmental justice, etc. However, Detroit, as this plan notes, is desperate for jobs. Trade-offs at least need to be considered. Rather than “focusing on the look and feel” of industrial areas, as the plan put it, why not roll out the red carpet for businesses like tanneries, scrap metal processing, etc. that are increasingly unwelcome in places like Chicago? Being friendly to to these types of businesses is probably the most likely road to success in industrial employment.

    Conclusion

    On first read, there’s some interesting stuff in here. They plan is less creative than I’d hoped overall, but probably takes the most aggressive line that was politically realistic. The real questions is, what happens next? Can any of this actually be actioned, or will fiscal and other problems effectively render it a dead letter? Only time will tell.

    Aaron M. Renn is an independent writer on urban affairs and the founder of Telestrian, a data analysis and mapping tool. He writes at The Urbanophile, where this piece originally appeared.

  • World’s Most Affluent Metropolitan Areas: 2012

    Late in 2012, the Brookings Institution published its annual Global Metro Monitor (by Emilia Istrate and Carey Anne Nadeau), which estimates economic data for the 300 world metropolitan areas with the largest gross domestic product (GDP). The Global Metro Monitor also provides estimates of the GDP per capita for each of the qualifying metropolitan areas. The surprising news: after at least five years of the most laggard economic performance in adult memory, the United States continues to dominate the highest GDP per capita data.

    Summary by Geography

    Among the 10 metropolitan areas with the highest GDP per capita, nine are in the United States (Figure 1). Hartford ($79,900 per capita), for the second year in a row, was ranked the most affluent metropolitan economy by Brookings. The US accounts for 36 of the top 50 metropolitan economies, and 67 of the top 100.

    Europe is also strongly represented, with 23 of the most affluent 100 economies as rated by Brookings. Yet for the most part European metropolitan regions were concentrated between 50th and 100th. Only seven European metropolitan areas made the top 50. The highest ranking was Edinburgh, Scotland ($59,400), at 21st. Two former East Bloc European metropolitan economies also broke into the top 100, Prague at 70th and Moscow at 92nd.

    East Asia placed 3 metropolitan areas in the top 100. Singapore ($62,500) did best at 14th.  Singapore’s ranking behind so many US metropolitan areas may be surprising, since Singapore has a higher GDP per capita than the United States. However, the most affluent US metropolitan areas are more affluent than Singapore, which is both a city and a country. The highest ranking Chinese metropolitan area was Macau, the former Portuguese Special Administrative Region, which ranked 26th.

    No mainland Chinese metropolitan area was in the top 100. However, should China’s economic growth continue at its fast pace, it will not be long before the most affluent metropolitan areas break into the top 100. The strongest candidates could be Suzhou and Wuxi (between Shanghai and Nanjing) and Hong Kong neighbor Shenzhen (Note).

    Two Middle Eastern metropolitan economies were represented in the top 100, both in the top 50. Oil-rich Abu Dhabi ($66,500) was the only metropolitan area outside the United States to place in the top 10, ranking 8th, while Kuwait City ($56,100) ranked 32nd.

    Three of Canada’s largest metropolitan areas made the list, led by Calgary ($61,600), which ranked 15th, while Edmonton ($52,000) rounded out the top 50. Two of Australia’s largest metropolitan areas were represented. The most affluent was Perth ($63,400), which ranked 11th and was the second ranking metropolitan area outside the United States (Figure 2). Perth was also the only Australian metropolitan area to rank in the top 50.

    None of the metropolitan areas of Latin America, South Asia (such as India or Indonesia) or Africa was ranked in the top 100.

    Highlights: Metropolitan Area Highlights

    Some of the metropolitan areas that might have been expected to be ranked the highest were instead well down on the list.

    This is particularly evident with respect to the large financial centers. New York ranked 12th, behind Perth and immediately ahead of Des Moines, which experienced the greatest percentage growth in financial sector jobs in the United States over the last five years (See: The Dispersion of Financial Center Jobs). Other principal financial centers were ranked even lower, London was ranked 51st, behind its perennial competitor, Paris, which was 43rd.

    Other money centers did even worse, with Frankfurt 53rd, Hong Kong 65th, and Tokyo 112th. Canada’s principal financial center, Toronto, was ranked 96th, well behind Calgary and Edmonton (but ahead of Ottawa at 108th, Vancouver at 114th, and Montreal at 150th). Australia’s leading financial center, Sydney, was ranked 88th, far behind Perth but ahead of Melbourne (113th).

    Information technology centers were well represented in the top 10, including San Jose (2nd), Boston (5th), Durham, home to most of Research Triangle Park (6th), San Francisco (7th), and Seattle (9th).

    The high rankings of Abu Dhabi, Perth, Calgary, as well as Houston (10th), Kuwait City (32nd), Oslo (34th) and Edmonton (50th) demonstrate the importance of natural resources to metropolitan economies.

    GDP Per Capita and Urban Population Density

    There has been considerable confusion about cities, productivity and population density. For example, the urban scaling research of the Santa Fe Institute has been misinterpreted to indicate that higher density cities are more productive. In fact, the research specifically denies any such relationship, finding that productivity generally rises simply as a function of higher metropolitan populations (see Density is not the Issue: The Urban Scaling Research). Further, it has often been suggested that as cities grow they become more dense. In contrast, the evidence is overwhelming that cities tend to become less dense as they grow (see The Evolving Urban Form).

    Supplementing the Brookings Institution GDP per capita estimates with population density estimates (from Demographia World Urban Areas) provides further indication that greater affluence is not associated with higher population density.

    For example, Hartford, with the highest GDP per capita of all 300 metropolitan areas covered by Brookings has an urban area density (1,800 per square mile or 7000 per square kilometer) similar to that of Atlanta, the least dense urban area in the world with more than 2 million population. Bridgeport and Durham (North Carolina) have similarly low densities and are ranked in the top 10. San Jose (5,800 per square mile or 2,200 per square kilometer) and San Francisco (6,300 per square mile or 2,400 per square kilometer) have the highest density urban areas among the 10 most affluent metropolitan areas, though their densities are low to middling by European standards and well below East Asian densities (Figure 3).

    Out of the 100 most affluent metropolitan areas (Figure 4), 35 have population densities under 2,500 per square mile (1,000 per square kilometer). Many have very low densities, with 17 have density similar to or lower than Atlanta (such as Knoxville, TN, Little Rock, AR, Worcester, MA and Columbia, SC).

    Another 33 metropolitan areas have urban densities between 2,500 and 5,000 per square mile (1,900 per square kilometer). This includes metropolitan areas such as Denver, Perth, Dallas-Fort Worth, Houston, Vancouver, Portland and Seattle. There are also 26 metropolitan areas with between 5000 and 10,000 per square mile (3,900 per square mile), such as Los Angeles, Paris, Stockholm, Toronto and Vienna. There were only six metropolitan areas with urban densities above 10,000 per square mile (3,900 per square kilometer), Macau, Hong Kong, Singapore, London, Kuwait City and Prague.

    The Future?

    The continued strong showing of the United States in the world affluent metropolitan area league tables cannot be taken for granted. While it seems likely that US metropolitan areas will not be displaced by their European counterparts, the strong growth in Canada and Australia could propel their metropolitan areas much higher. And then, there is always China and other increasingly affluent cities of east Asia.

    Wendell Cox is a Visiting Professor, Conservatoire National des Arts et Metiers, Paris and the author of “War on the Dream: How Anti-Sprawl Policy Threatens the Quality of Life.”

    —–

    Note: The GDP per capita of metropolitan areas in China is adjusted, using the population figures from the 2010 census (which included the urban migrant population). The issue is described in Endnote 19 in the Brookings Global Metro Monitor.

  • Applying the Urbanophile’s Beliefs About Cities to Houston

    Last month The Urbanophile posted his statement of beliefs about cities, and a lot of them resonated with me about Houston.  Here are some favorite excerpts along with my own thoughts.

    * Great cities, like great wines, have to express their terroir. There is no one-size-fits-all model of urban success. Our cities are as diverse as their citizenry. To succeed, they need to express their own essential and unique character.  

     This is why you always have to be skeptical when somebody says something like "For Houston to be world class we have to do X like city Y."  I believe that especially applies to heavy rail commuter transit in our decentralized, car-based city, but it also applies to recent questions like "Why can’t Houston have downtown retail like Chicago’s Magnificent Mile or New York’s Fifth Avenue?"  Because we’re not like them, and we already have our pedestrian-oriented upscale shopping district: it’s called The Galleria, one of the largest malls in the country, and with plenty of parking and climate control to boot!

    * Don’t try to beat other cities at their game. Instead, make them beat you at yours. Cities are unique – yours included. Instead of fretting about measuring up to the planet’s elite metropoli or trying to emulate them, cities should figure out their unique strengths that other places can’t match.

    Hear, hear! To quote an old post of mine: "Houston starts the 21st-century with a set of amenities 99% of the planet’s cities would kill for: a vibrant core with several hundred thousand jobs; a profitable and growing set of major industry clusters (Energy, the Texas Medical Center, the Port); the second-most Fortune 500 headquarters in the country (26); top-notch museums, festivals, theater, arts and cultural organizations; major league sports and stadiums; a revitalized downtown; astonishing affordability (especially housing); a culture of openness, friendliness, opportunity, and charity (reinforced by Katrina); global diversity; a young and growing population; progressiveness; entrepreneurial energy and optimism; efficient and business-friendly local government; regional unity; a smorgasbord of tasty and inexpensive international restaurants; and tremendous mobility infrastructure (including the freeway and transit networks, railroads, the port, and a set of truly world-class hub airports)."

    * It says something powerful about a city when people vote with their feet to move there, to plant their flag, to seek their fortune. There is no more telling statistic about a place than in-migration. It’s important to know if people are moving into or out of a city–and why.

    The most ignored statistic of the creative class city boosters, because their idols – NYC, Boston, Chicago, SF, LA – fail horribly on it.

    * Moreover, new blood isn’t just nice to have, it’s essential. In an ever-more globalized, rapidly changing, competitive world, a city’s best interests are not served by being populated with people who’ve never lived anywhere else.

     Points for our global diversity.

    * But it isn’t just about the best and brightest, either. Attracting the educated is important, but cities are also where the poor come to become middle class, where immigrants come to build a better future for themselves and their families. Their needs must be taken up, too–and equally.

    Hallelujah for Opportunity Urbanism (and more here).

    * A great city needs great suburbs. To pull our cities up, there’s no need to tear our suburbs down. To be successful in the modern era, its important for every part of a metropolitan region to thrive and bring its “A game”. 

    * “Building on assets” is a trap. The only reason we have any man-made assets in the first place is that previous generations of leaders didn’t follow that strategy. Only building on assets is a strategy about defending the past, not embracing the future. It is the spending down of our urban inheritance. Yes, leverage assets, but also add totally new things to the pot for future generations.

    Absolutely.

    * We need to look forward, not backward. There is no more corrosive force than nostalgia. We should know where we’ve come from and what we stand for. But we can’t become imprisoned by a yearning for an imagined past that never really was.

    * We need to embrace a 21st century vision of urbanism. Urbanism – Yes, but trying to copy Greenwich Village 1950 is not the answer. To find it, we must boldly re-imagine the possibilities of what a city can be and bravely identify what works today-and what doesn’t.

    Yep – time to rethink Jane Jacobs.

    * We don’t know where this ride is taking us. We’re at a pivotal time in America’s urban history. So much is changing, and more change is yet to come. For our own sake, we should not assume that we’ve arrived where we’re headed, or that we have the answers. If there’s one thing we should take away from the urban planning failures of the past, it is a strong dose of humility.

    "Planning for utopia" doesn’t work.  Cities need the freedom to evolve organically.

    This piece first appeared at Houston Strategies.

  • Demographic and Economic Challenges: The 9th Annual Demographia International Housing Affordability Survey

    The just released 9th Annual Demographia Housing Affordability Survey (pdf) indicates that housing affordability has deteriorated modestly in the last year. A number of major metropolitan areas remain severely unaffordable.

    Highlights: Metropolitan Areas

    Among the 337 Metropolitan markets analyzed, Hong Kong remained the most unaffordable, with a median multiple (median house price divided by pre-tax median household income) of 13.5, up nearly a full point from last year’s 12.6. No other housing market has ever reached such an intense level of unaffordability since the Survey began (Los Angeles reached 11.5 in 2007).

    Rounding out the least affordable major markets (over 1,000,000 population) were Vancouver at 9.5, Sydney at 8.3, San Jose (US) at 7.9, and a tie in fifth place between San Francisco and London (Greater London Authority) at 7.8. The most affordable markets were Detroit at 1.5 (Note 1); Atlanta, at 2.0 (Note 2); and Cincinnati, Rochester (US), and St. Louis at 2.5 (Figure 1).

    Rating Housing Affordability

    The Demographia Housing Affordability Surveydefines four housing affordability categories (Table 1), starting with "affordable." Affordable housing markets have a median multiple of 3.0 or less, the upper bound of overall housing affordability that existed virtually across all major markets in the United States, the United Kingdom, Canada, Australia, Ireland and New Zealand before the adoption of urban containment policy (also called densification policy, urban consolidation, compact cities, smart growth, or growth management).


    Table 1

    Demographia International Housing Affordability Survey

    Housing Affordability Rating Categories

    Rating

    Median Multiple

    Severely Unaffordable

    5.1 & Over

    Seriously Unaffordable

    4.1 to 5.0

    Moderately Unaffordable

    3.1 to 4.0

    Affordable

    3.0 & Under


    Highlights: Nations

    Of all nations, only the United States has affordable major markets and a strong representation in the moderately unaffordable category. Six major markets in the United States were rated in the severely unaffordable category, including San Jose, San Francisco, San Diego, Los Angeles and New York.

    Canada had two markets rated moderately unaffordable, while one half of its major markets were rated severely unaffordable, including Vancouver, Toronto and Montréal. Ireland’s one major market, Dublin, was rated moderately unaffordable.

    One half of the major markets in the United Kingdom were also rated severely unaffordable, including London (GLA), Plymouth & Devon, the London Exurbs (Southeast and East of England), Bristol, Liverpool, Newcastle, Birmingham, and Sheffield. All of the major markets in Australia (Sydney, Melbourne, Brisbane, Perth and Adelaide), China (Hong Kong), and New Zealand (Auckland) were rated severely unaffordable (Table 2).

    Hong Kong and Singapore are the world’s largest city-states. An analysis of a large share of the Singapore market suggests a median multiple of approximately 6.0, which is substantially more affordable than Hong Kong.

    Table 2

    Housing Affordability Ratings by Nation: Major Markets (Over 1,000,000 Population)

     Nation

    Affordable

    (3.0 & Under) 

    Moderately

    Unaffordable (3.1-4.0)

    Seriously Unaffordable (4.1-5.0)

    Severely Unaffordable (5.1 & Over)


    Total


    Median

    Multiple

     Australia

    0

    0

    0

    5

    5

    6.5

     Canada

    0

    2

    1

    3

    6

    4.7

     China (Hong Kong)

    0

    0

    0

    1

    1

    13.5

     Ireland

    0

    1

    0

    0

    1

    3.6

     New Zealand

    0

    0

    0

    1

    1

    6.7

     United Kingdom

    0

    0

    8

    8

    16

    5.1

     United States

    20

    20

    5

    6

    51

    3.2

     TOTAL

    20

    23

    14

    24

    81


    Longer Term Trends

    Over the years of the Demographia International Housing Affordability Survey, housing affordability has improved by far the most in Ireland. It has also improved in the United States. Affordability in Canada’s major markets was the most favorable in 2004, but has seen large Median Multiple increases in each of the three largest metropolitan areas. As a result, there is increasing concern about housing affordability in Canada.

    Australia and New Zealand have had the most unaffordable major markets, with every market being severely unaffordable in every year, reflecting earlier adoption of densification policy by states and metropolitan areas. Housing affordability has also been severely unaffordable in United Kingdom major markets over the period covered (Figure 2).

    A Competitive Land Supply: Key to Housing Affordability

    Overwhelming economic evidence indicates that urban containment policies, especially urban growth boundaries raise the price of housing relative to income. This inevitably leads to a reduced standard of living and increases poverty rates, because the unnecessarily higher costs of housing leave households with less discretionary income to spend on other goods and services. The higher costs ripple into rental markets, tightening the budgets of lower income households, who already suffer from lower discretionary incomes.

    The principal driver of unaffordable housing relative to median incomes is failure to maintain a "competitive land supply." Brookings Institution economist Anthony Downs describes the process, noting that more urban growth boundaries can convey monopolistic pricing power on sellers of land if sufficient supply is not available, which, all things being equal, is likely to raise the price of land and housing that is built on it. This has, more often than not, been associated with urban containment policy and virtually never with the more liberal land use policy that preceded it.

    Recent Policy Developments

    The last year has seen public policy progress. The New Zealand central government plans to expand the land supply and provide alternatives for infrastructure finance, both of which are likely to lead to improved housing affordability. In his Introduction to this years’ Survey, Hon. Bill English, Deputy Prime Minister of New Zealand pinpoints the factors leading to the policy changes:

    It costs too much and takes too long to build a house in New Zealand. Land has been made artificially scarce by regulation that locks up land for development. This regulation has made land supply unresponsive to demand. When demand shocks occur, as they did in the mid-2000s in New Zealand and around the world, much of that shock translates to higher prices rather than more houses.

    The Conservative-Liberal Democrat Coalition is proposing policies to build housing on more competitively priced land, to improve housing affordability. Planning Minister Nick Boles has called Britain’s lack of housing affordability "the biggest social justice crisis we have," and called it bigger than education and unemployment (video). These proposals have been long in coming. It has been four decades since Sir Peter Hall and associates documented the consequences of urban containment, and nearly a decade since the similar conclusions of Kate Barker for the Labour Government.

    In Hong Kong, facing public demonstrations on issues such as housing affordability, the government has adopted a plan to improve housing affordability.

    However, the policy is deteriorating in California, where state regulations could virtually outlaw new single-family housing on the urban fringe. In the last year housing affordability losses have been substantial and could portend another housing bubble in this state that precipitated Great Financial Crisis with its egregious house price increases.

    Evolving Perspectives

    Planning perspectives could be evolving. New York University Professor Shlomo Angel writes in his book Planet of Cities of the importance of housing affordability and argues against urban planning restrictions that restricting adequate housing to ordinary households.

    A team of UK academic researchers questioned the "default" preference for urban containment policy. This is an important development, since much of urban planning is committed to outlawing more liberal land-use policies.

    The Economic Challenge

    Nations around the world face serious economic challenges. Governments have taken on unaffordable obligations, and repayment continues to elude authorities in the United States, the European Union, and elsewhere. Future demographic trends are likely to only exacerbate this difficulty, driven by plummeting birth rates and a rising elderly population (See The Rise of Post-Familialism: Humanity’s Future?).

    Urban policy needs a "reset." The emphasis should be shifted away from "designing" urban areas toward facilitating a better standard of living for the people who live in them. In his epic Civilization: The West and the Rest, historian Niall Ferguson, in his Civilization notes that

    The success of the civilization is measured not just in its aesthetic achievements but also, and surely more importantly in the duration and quality of life of its citizens.

    This requires greater affluence and less poverty, both of which require more affordable housing.

    —–

    Note 1: The city of Detroit has experienced a severe economic decline. However, the Detroit metropolitan area (which includes the city, the suburbs and exurbs) has fared much better. The city (municipality or local government authority of Detroit experienced a population loss from 1,850,000 to 714,000 in the last 60 years, while suburban and exurban areas added 2.2 million. There are a variety of theories about Detroit’s municipal decline, involving both "push" and "pull" factors (such as the incompetence and corruption of the municipal government to the not unrelated attraction of suburban living).  Further, the overall population growth rate of the Detroit metropolitan area has not been strong, but exceeded that of the other three worst hit "Rust Belt metropolitan areas, Cleveland, Buffalo and Pittsburgh (which lost population). Metropolitan Detroit’s growth rate was similar to that of the New York metropolitan area (35 percent compared to 42 percent), which ranked 46th in growth (out of 51) compared to Detroit’s 48th.

    Note 2: At the peak of the housing bubble, affordability deteriorated to a moderately unaffordable 3.1 in Atlanta. Atlanta had been among the high income world’s fastest-growing metropolitan areas for at least three decades, but slowed briefly during the Great Financial Crisis. Growth has returned, with Atlanta ranking third in net domestic migration among US metropolitan areas with more than 5 million population.

    —-

    Photograph: Hong Kong (by author)

    Wendell Cox is a Visiting Professor, Conservatoire National des Arts et Metiers, Paris and the author of “War on the Dream: How Anti-Sprawl Policy Threatens the Quality of Life.”