Category: Urban Issues

  • Demography as Destiny: The Vital American Family

    Recent reports of America’s sagging birthrate ‑ the lowest since the 1920s, by some measures ‑ have sparked a much-needed debate about the future of the American family. Unfortunately, this discussion, like so much else in our society, is devolving into yet another political squabble between conservatives and progressives.

    Conservatives, including the Weekly Standard’s Jonathan Last, regularly cite declining birth and marriage rates as one result of expanding government ‑ and a threat to the right’s political survival. Progressives, meanwhile, have labeled attempts to commend a committed couple with children as inherently prejudicial and needlessly judgmental.

    Yet family size is far more than just another political wedge issue. It is an existential one – essentially determining whether a society wants to replace itself or fall into oblivion, as my colleagues and I recently demonstrated in a report done in conjunction with Singapore’s Civil Service College. No nation has thrived when its birthrate falls below replacement level and stays there – the very level the United States are at now. Examples from history extend from the late Roman Empire to Venice and the Netherlands in the last millennium.

    Falling birthrates and declining family formation clearly effect national economies. One major United States’  advantage has long been high birthrates, akin to a developing nation’s, as well as a vibrant family-oriented culture. This was largely because of immigrants and their children, striving first- and second-generation Americans. The United States, according to the U.S. Census Bureau, is expected to have a roughly 40 percent growth in its workforce in the first half of this century, largely thanks to immigration.

    In contrast, the Census Bureau predicts that leading U.S. competitors, notably Japan, Europe and South Korea, will likely suffer a decline of 25 percent or more over that time. Even China, whose birthrate has dropped precipitously under its one-child policy and rapid urbanization, is expected to see a sharp drop in its labor force over the next decade.

    Perhaps the greatest threat from collapsing fertility is the aging of society. Consider “the dependency ratio,” which measures the number of people in the workforce compared to retirees, in effect, how many working people are needed to support those over age 65. In 1960, before the decline in birthrates, that ratio was 9 percent in the 23 most developed countries. Today, it is 16 percent across these advanced countries. By 2030 it could reach as high as 25 percent.

    Countries with the longest history of declines in fertility face the biggest fiscal crises. By 2050, for example, Germany and Singapore  are predicted to have roughly 57 people above age 65 for every 100 workers. In the United States, this ratio will rise by 50 percent, to roughly 35 per 100 workers, even if the current decline is eventually reversed.

    If birthrates continue to decline, Western nations may devolve into impoverished and enervated nursing homes. And without strong families, children are likely to be more troubled and less productive as adults.

    You don’t need a crystal ball to see what this future could look like. Consider Japan. By 2050, there are expected to be three people above age 65 for every person in Japan under 15. In fact, more people are expected to be over 80 than under 15.

    This demographic shift signals a kind of death sentence for that once thriving, but now declining, nation. Not only are Japanese couples having far fewer children, sociologist Mike Toyota notes, roughly one-third of Japanese women in their 30s are not getting married ‑ which, in that conservative society, essentially means they are unlikely to have children. Even teenagers, according to a recent government-commissioned study by the Family Planning Association, seem oddly indifferent to dating and sex.

    Given the stakes, Americans must forgo political squabbles and focus on practical ways to remove barriers to marriage and child-rearing. One crucial component for strong birthrates is steady economic growth. Before the 2008 economic collapse, the U.S. fertility rate  was 2.12, the highest in 40 years. But the tumultuous economic problems since then have helped drive the fertility rate to 1.9 per woman, the lowest since the economic malaise era under President Jimmy Carter in the late 1970s.

    Even amid increasing awareness of the country’s demographic problems, however, political extremes focus on their own ideological spin. Conservatives set their arguments in neo-traditionalist terms, embracing right-wing tropes against gay marriage and abortion while blaming expansive government and rampant individualism. Others on the extreme right link declining fertility rates, particularly among Caucasians, to what Pat Buchanan calls “the end of white America.”

    Yet conservatives must recognize that fertility is not just a white or high-income Asian issue. Fertility and even marriage rates are, for example, declining throughout much of the Muslim Middle East, in some cases below our own levels, as my colleague Ali Modarres has shown.

    Nor is “white America” likely to be demographically overwhelmed by the current dramatic influx of Latino immigrants, particularly Mexicans, as many on the far right insist. Within a generation, Mexican-Americans immigrants’ fertility rates decline to that of native-born U.S. citizens. In fact, as Mexico modernizes, its fertility rates are falling to U.S. levels.

    Conservatives also seem to have a hard time admitting that one major culprit ‑ particularly in the United States and East Asian countries such as Singapore ‑ is modern capitalism. Young workers building their careers can face consuming demands for long work hours and substantial amounts of travel. Many confront a choice between a career and family.

    “In Singapore,” Austrian demographer Wolfgang Lutz observes, “women work an average of 53 hours a week. Of course they are not going to have children. They don’t have time.”

    For hard-pressed low-wage workers, raising children can be even harder. Indeed, much of the decline in child-rearing in the U.S. can be traced to a fall-off among immigrants, particularly Latinos, who fared particularly poorly in the long recession.

    On the other side, many Democrats praise the rise of “singlism” ‑ demonstrated by  the women in their 40s who never had offspring. This cohort has more than doubled since 1976. Pollsters like Stan Greenberg hail single women as “the largest progressive voting bloc in the country,” and Ruy Texeira, a leading political scientist, asserts that singletons are critical to the “emerging Democratic majority.”

    Progressives also embrace urban density ‑ a residential pattern that discourages child-rearing. Unlike the wave of immigrants or rural migrants who flooded the American metropolises of the early 20th century, urbanites today are not raising large families in cramped spaces. Instead, in virtually all high-income societies, high density today almost always translates into low marriage rates and fertility rates.

    The causes of this radical change are diverse. But crucial reasons include decline of extended family support networks; erosion of traditional, often religiously based values; and a culture that celebrates individualism.

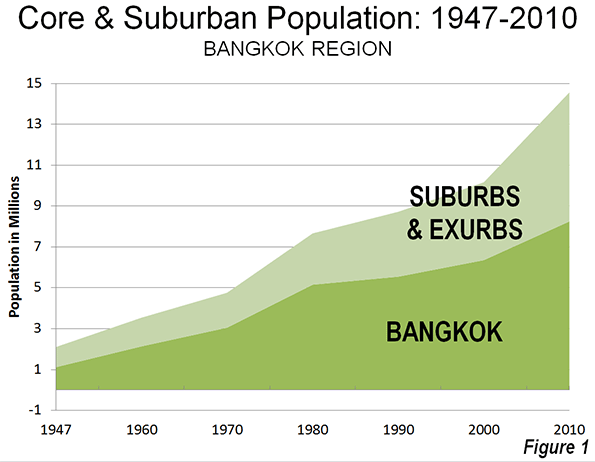
    We no longer see family-centered urban neighborhoods like those depicted in the Chicago of Saul Bellow’s novel The Adventures of Augie March. Instead, many urban centers today are among the most “child free” ‑ whether in Manhattan, San Francisco, inner London or Paris, Singapore, Hong Kong or Tokyo.

    In contrast, America’s nurseries are in the suburbs, exurbs and lower-density greater-metropolitan areas. The metropolitan regions of Atlanta, Dallas-Fort Worth, Houston and Salt Lake City have above-average numbers of children. The percentage of children, according to the census, under age 15 in these cities is almost twice that of Manhattan or San Francisco.

    Many progressives don’t seem to care much if the birthrate falls. Some green activists seem to actually prefer it –  perhaps viewing offspring, particularly in wealthy countries, as unwanted carbon emitters. They seem to have taken up the century-old Malthusian concerns about overpopulation and environmental ruin. “A whole lot of people don’t have kids BECAUSE they’re worried about the future,” explains one critic of our report, suggesting that concern for the environment may justify the decision not to have children.

    Before signing on to a low-fertility agenda, American progressives as well as conservatives might want to consider the long-term consequences. The long fertility-rate declines in Europe and Japan occurred as economic growth flagged. Diminishing expectations of the future, painfully evident in countries such as Spain, Italy and Greece, are now further depressing marriage and childbirth.

    As to the culture wars between religious social conservatives and progressives, let’s declare a truce. Spiritual values and traditional families are precious resources to be nurtured. Mormons, evangelicals, practicing Catholics and highly self-identified Jews, all of whom largely favor big families, help make up for the almost certain continued expansion of single, and often childless, people.

    Social conservatives also need to champion more than the narrowly defined “natural family.” Many children, whether because of divorce or diverse family circumstances, must look to someone other than their birth parents for nurturing. Adoptive parents, grandmothers, uncles or aunts or other sorts of extended-family units also need to be cherished as committed caregivers.

    Popular TV shows like Modern Family show the wide range of family types today. The crucial element is that family obligation often extends well beyond “likes” and ties exist over generations. This can be true for gay couples or “blended families” in a way that can rarely be said of people who are dating, or friends, both of the real and Facebook variety.

    Fortunately, the long-term prognosis is not all bad. Pew Research Center reports that the emerging millennial generation rank being good parents, owning a home and having a good marriage as their top three priorities. Generational chroniclers Morley Winograd and Mike Hais, in their book Millennial Momentum: How a New Generation is Remaking America, suggest that the younger generation is as family-oriented as their elders, albeit with a greater emphasis on shared responsibilities and more flexible gender roles.

    “No matter how many communes people invent,” the anthropologist Margaret Mead once remarked, “the family always creeps back.” Let’s hope she’s right, not only about the past but the future as well.

    Joel Kotkin is executive editor of NewGeography.com and is a distinguished presidential fellow in urban futures at Chapman University, and contributing editor to the City Journal in New York. He is author of The City: A Global History. His newest book is The Next Hundred Million: America in 2050, released in February, 2010.

    This piece originally appeared at Reuters.

    Baby photo by Bigstock.

  • “Livability” vs. Livability: The Pitfalls of Willy Wonka Urbanism

    livability: (livable) fit or suitable to live in or with; “livable conditions”.

    “Livability” has been a buzz word in city development for some time, and for good reason, as who doesn’t want livability, outside the zombie cohort? Things get hairy, though, when “livability”—as an economic development strategy—gets unpacked, because questions arise: “Livability” for whom? “Livability” at what cost?

    Making a city “livable” these days largely means appealing to a select group of folks so as to form “an attractive economic place”. This notion of “livability” really came on in the late 1980’s, and was done under the presumption that certain cities offered higher quality of life, read: better lifestyles. For instance, in 1989 geographer David Harvey wrote that cities need to “keep ahead of the game [by] engendering leap-frogging innovations in life-styles, cultural forms, products, and service mixes…if they are to survive.” This was a radical departure from previous societal efforts to make quality of life a priority (think: pollution remediation) in that “life” was swapped out for “lifestyle”.

    You could argue, then, that the original sin of “livability”-driven economic development begins right there. Namely, the emphasis will not be on the people of a city, but on potential consumers, particularly high-valued consumers with means, subsequently referred to as the “creative class”. As for creative class wants? They are, according to Richard Florida, “[an] indigenous street-level culture – a teeming blend of cafes, sidewalk musicians, and small galleries and bistros…” In this sense, the idea of “livability” gets precariously slimmed out.

    Nonetheless, this thinking has penetrated mainstream economic development, with cities attempting to one-up each other in their want to attract a slice of the “livability” electorate. The consequences have become predictable: more comfort for some, less comfort for most.

    ***

    Perhaps the city most famous for livability-driven economic development is Portland. It is America’s amenity apex, and a recent study showed it attracts the young by the boatload due to a certain leisure-lifestyle it affords.

    For example, from a recent article entitled “(P)retirement’s new frontier”, the author interviews a 36-year old who is “underemployed on purpose”, as well as a couple who quit their jobs in Austin, sold their car, and have backyard chickens, yet now feel “much richer”. Such folks are referred to by economist Joe Cortright as “lifestyle entrepreneurs”. Part of this entrepreneurial output, touched on in the article, is a website called Badass that rates Portland neighborhoods for amenities like pinball machines, food carts, and access to bike lanes. At times the article reads like Portland was dreamed up by Willy Wonka.

    Here, I half kid. From a description of the movie Charlie and the Chocolate Factory, notice the parallel themes: the Peter Pan motif, an escape from an unsatisfactory reality, and the promise of limitless sensory and savory experiences:

    The Chocolate Room is designed to look like an outdoor landscape complete with trees, flowers and a waterfall, but Wonka has made the entire scene out of candy and chocolate. Charlie and the other children see some doll-sized human beings in the Chocolate Room, and Wonka explains they are Oompa-Loompas whom he saved from the dangerous country of Loompaland. The Oompa-Loompas agreed to work for Wonka and live in his factory in exchange for a safe home and an endless supply of their favorite food, cacao beans.


    Courtesy of Knotworkshop

    Swap out the over-educated and underemployed for the Oompa-Loompas, chocolate for lifestyle amenities, and the Chocolate Room for the concept of “Portland-as-place”, and you got yourself a sequel. But there are problems with such city building: it’s too often defined by the ephemera, or that “transitory matter not intended to be retained or preserved”. And while the ephemera aren’t building blocks to economic growth—but instead represent America’s tendency to fix hard structural deficits with the airy promises of the pleasure principle—they are nonetheless a main cog in the modern day city-making machine. From an article entitled “Placemaking Revolution: the powerful role of ephemera and the arts in our cities”:

    Coletta addressed the question of how ephemeral events can have lasting impacts in cities. “I think you can do temporality with regularity. Some temporary events are so powerful that they stay in the memory for a long time, and spark the imagination.

    But I would argue that now more than ever we need less fantasy in city building than we do reality—as reality can’t keep being handed off to folks who are unable to consume their way to imagining existence as anything but decidedly not livable.

    ***

    “Livability” backlashes are becoming increasingly common across the country. For instance, a piece in Crain’s Chicago questions whether Chicago’s catering to the global creative class is worth the debt it is incurring, and whether the split between the amenity-rich rich neighborhoods and the amenity-poor poor neighborhoods is worth the investment, particularly given the record levels of violence that is tearing parts of the city to pieces. And while Mayor Emanuel’s bike-pathing of the City moves forward because “he wants all of [Seattle’s] bikers”, libraries are closing, red light cameras are ubiquitous, taxes are rising, and the city has a police manpower shortage of 1,000 that can’t be plugged because there’s no money. In fact things are so desperate that the City recently turned to Twitter to fight crime.


    Stop-The-Violence Campaign in Chicago. Courtesy of Metropolis Coffee

    In New York, the President of NYU is under a vote of no confidence for his plans to extend the creative classification of the campus into Greenwich Village. And while this has been ongoing—for instance, one commenter in the bookWhile We Were Sleeping: NYU and the Destruction of New York” states “There are days when I feel like I’m stranded in some upscale mall in Pasadena”—the recent city-sanctioned plan to bulldoze and “mix use” a residential neighborhood for “livability” purposes in order to “attract ambitious students and faculty to sustain the region’s economic base and quality of life” has pushed faculty and the community over the edge.

    Perhaps not coincidentally, the plan—and fight for it—comes at a time with Richard Florida joining NYU as a Global Research Professor, with the President commenting on the unison this way:

    There is a certain symmetry here: Richard Florida is joining NYU…at a moment when the University has begun responding to the forces that give rise to his most trenchant insights.

    Even in Portland, the “livability” backlash is present. A September 2012 article entitled “Portland’s livability conflicts: Contradictions of affluence and affliction” states:

    With its tree-lined streets, bike paths and transit options, Portland is beautiful and very safe. But behind that facade, Portland is also a city of contradictions.

    These contradictions, according to the author, involve the discordance brewing between the poverty and “alarmingly large number of hypodermic needle” situation on one hand, and the topographical layering of that “everything is fine” sheen that remains intact for many coming to seek it.

    Others in the community are questioning the theory of livability-driven economic development in its own right. For instance, in a piece entitled “The Portland Question: Livability or Job Growth?”, the author notes the growing worries in the region as to the path Portland is on:

    Last year, Portland’s own catalyst for economic change, the Portland Development Commission, warned that the city’s traditional focus on livability projects such as streetcars and housing had not delivered the job growth needed to stay competitive. That’s a strong statement considering that livability has become what largely defines Portland’s character.

    ***

    Taken together, perhaps it’s time for city leaders and citizens alike to take stock in how cities are being made, and for whom the making is focused. In fact maybe it’s time to drop the “livability” gimmicks that define Willy Wonka urbanism–or to squeeze “the style” out of “lifestyle” so as to expose the highest priority, the highest necessity: which is life.

    So, you wanna make your city “hot”? Then cook the irons of affordable housing, mobility, education, and solid jobs.

    Or, you know: livability.


    Richey Piiparinen is a writer and policy researcher based in Cleveland. He is co-editor of Rust Belt Chic: The Cleveland Anthology. Read more from him at his blog and at Rust Belt Chic.

    Kauffman Performing Arts Center photo by Bigstock.

  • The Evolving Urban Form: Bangkok

    Since 2000, the Bangkok region has experienced annual population growth 2.5 times the rate of growth from 1980 to 2000. By 2010, the Bangkok region – which includes the provincial level city of Bangkok and the provinces of Samat Prakan, Samut Sakhon, Pathum Thani, Nonthaburi and Nakhon Pathom –  was nearing a population of 15 million (Note 1).

    As is characteristic of urbanization in both developing and developed countries, much of Bangkok’s recent growth has occurred outside the city, in suburban (and exurban) areas. Between 2000 and 2010, the city grew by 30%, while the suburban provinces grew more than twice as quickly, at 66%. The city’s population growth was 1.9 million, while the suburban provinces added 2.5 million population (Figure 1).

    Much of the urban expansion has been on the periphery both within the city of Bangkok and in the provinces of Samut Prakon to the east, Samut Sakhon to the west and Pathum Thani to the north. Unlike most cities in Asia, where new development has taken high-rise form, much of this new development has been townhouses and detached housing. (Photo: Detached housing).


    Photo: Detached Housing in the Bangkok city eastern sector

    The Urban Area

    The urban area, or area of continuous urban (and suburban) development will reach 14.5 million residents in 2013, according to United Nations projections. The urban area (Figure 2) covers approximately 900 square miles (2,330 square kilometers) and has a population density of the urban area is 16,200 per square mile (6,200 per square kilometer). This is 1.5 times the density of the Paris urban areas and more than 2.5 times that of the Los Angeles. However, Dhaka (Bangladesh), the most dense urban area, is at least eight times as dense.

    Bangkok’s high density and inadequate road system combine to make Bangkok’s traffic among the worst in the world. The Bangkok region is well served by freeways but government authorities have failed to provide the necessary arterial road (secondary road) infrastructure, as noted by Shlomo Angel, Stephen C. Sheppard, and Daniel L. Civco in a World Bank report (Note 2). As a consequence, they said that:

    The cost of reducing congestion in Bangkok is now higher—by one or two orders of magnitude—from what it would have been had adequate rights-of-way been secured earlier.  

    Bangkok is not the first urban area to have made this mistake. Atlanta’s traffic congestion is substantially worsened by its failure to provide a proper arterial roadway system.

    Bangkok’s best chance of reducing its traffic congestion lies in the expansion of its underdeveloped arterial roadway system. Nonetheless, the scattered development has preserved opportunities to develop arterial roads cost effectively in some suburban areas. The siting of more commercial and employment growth in these areas would also help.

    Some officials have suggested that expanded rapid transit would reduce traffic congestion. Bangkok has been expanding its small rapid transit system (as can be appropriate in very high density centers). There is little potential, however, for transit to reduce traffic congestion, as the intense traffic congestion and long commutes in cities well served with transit indicates (See photo at top and Note 3)

    Suburban and Exurban Bangkok

    Suburban expansion has been made possible by the increasing affluence of the Bangkok area, inexpensive land and house construction prices and the rising share of households with personal motorized vehicles (automobiles and motorcycles). Suburban dwellers are in the process of obtaining their own "Thai Dream" of home ownership, the popularity of which is demonstrated by the continuing draw of households to these rapidly developing areas.

    Angel, et al noted that the Bangkok area had become “model of a well–functioning land and housing
    market," and that:

    Affordable and minimally–serviced land was brought into the market by the efficient creation of a minimal number of narrow tertiary roads that connected building plots to the existing road system; mortgages became widely available; and private developers went down–market in large numbers, selling land–and–house packages that were affordable for more than half the urban households.

    Data from the Real Estate Information Centre of Thailand indicates that average new house prices remain similar in relation to average household income as a decade ago. By maintaining a competitive land market for new housing, Bangkok has retained housing affordability. 

    However there are difficulties. Some suburban areas, particularly in Pathum Thani, were hard hit by the 2011 floods. There has been controversy on this issue, as governments, national and local have come under criticism for their failures to control the flooding. At a minimum, the failure of the Bangkok region governments to coordinate their efforts contributed to the seriousness of this disaster. Nonetheless, new house construction continues in the suburbs and exurbs.

    The City ("Bangkok Metropolis")

    The core city of Bangkok is a provincial level jurisdiction, referred to popularly as the "Bangkok Metropolis" (Note 4). Bangkok is not a compact city, however, covering 605 square miles (1.570 square kilometers). This is 15 times the land area of the ville de Paris and larger than either Houston or Los Angeles, two of the most geographically expansive municipalities in the United States.  

    Beyond central Bangkok, the north, east and west sectors of the core city have experienced strong growth in detached and attached (row house or townhouse) construction.

    Bangkok’s commercial core is dispersed, like many other Asian cities, in China and elsewhere.  Manila is every bit as polycentric as Los Angeles or Atlanta. Bangkok, however, may be the ultimate core dispersion. There are at least five areas of high-rise commercial concentration, and large office buildings are sprinkled throughout the large central area (Photo: Dispersed core development). The UITP Millennium Cities Database indicated that only 11 percent of employment was in the central business district in the middle 1990s. With the ongoing dispersion, this figure may be lower now.


    Photo: Dispersed core development

    An Economic Success

    Bangkok residents live well compared to many living in other East Asian cities. Not only is their housing more affordable, but they have achieved much higher incomes. According to the most recent Brookings Global Metro Monitor, Bangkok has gross domestic product per capita of $23,400 annually (based on purchasing power). This is more than all but four of Latin America’s metropolitan economies (Brasilia, Monterrey, Buenos Aires and Sao Paulo), according to the Brookings the data. If Bangkok were in China, its per capita GDP would rank in the top quarter  of metropolitan economies (Note 5).

    Challenges Facing the Bangkok Region

    Bangkok seems likely to continue to grow rapidly, simply because it is virtually the only "urban draw" in Thailand. None of the world’s megacities (over 10 million population) is larger relative to other urban areas in the nation. Bangkok has more than 20 times the population of the next largest urban area in Thailand (Chon Buri). Strong population growth always presents formidable challenges for governments. The Bangkok region’s principal tasks will be to retain housing affordability by ensuring a competitive land market, and by providing a road system that reduces its exceedingly long travel times.  

    —–

    Note 1: There has been confusion about the Bangkok region’s total population. As late as 2009, the city of Bangkok projected the 2010 regional population, excluding Nakhon Pathom’s fewer than 1 million population at 10.3 million. The population as counted in the 2010 census was 3.3 higher.

    Note 2: Developers (and thus home buyers) pay for building the tertiary road systems that serve the new housing developments, similar to the practice in nations like the United States, Canada, Australia and New Zealand.

    Note 3: This is illustrated by Tokyo and Hong Kong, which each have one-way work trip travel times of 46 minutes — the longest reported in high-income world metropolitan areas. Tokyo has the world’s largest transit system and Hong Kong has the highest average urban density in the high-income world. By contrast, Los Angeles, where transit carries a small share of travel, and which has much lower densities than Tokyo or Hong Kong, has a one-way average work trip travel time of 27 minutes.

    Note 4: The city of Bangkok is a provincial level jurisdiction, formally called the Bangkok Metropolitan Administration. This use of the term "metropolitan" can be confusing, since much of the metropolitan area is outside the city (in between two and four other provinces, depending on the definition. This is similar to Tokyo and the former situation in Toronto. The prefecture of Tokyo is referred to as the "Tokyo Metropolis," which comprises barely one-third of the population of the Tokyo metropolitan area. Before the formation of the present city of Toronto, the regional authority was called the "Municipality of Metropolitan Toronto," however contained barely one half of the metropolitan area population. These semantic issues have been the source of considerable misunderstanding, not only by casual observers, but also by some academics.

    Note 5: The ranking for Chinese metropolitan areas is adjusted in China, using the population figures from the 2010 census (which included the urban migrant population). The issue is described in Endnote 19 in the Brookings Global Metro Monitor.

    Wendell Cox is a Visiting Professor, Conservatoire National des Arts et Metiers, Paris and the author of “War on the Dream: How Anti-Sprawl Policy Threatens the Quality of Life.”

    ——

    Photo: Rapid transit and traffic congestion in Bangkok (all photographs by author)

  • Is America’s Future Progressive?

    Progressives may be a lot less religious  than conservatives, but these days they have reason to think that Providence– or Gaia — has taken on a bluish hue.

    From the solid re-election of President Obama, to a host of demographic and social trends, the progressives seem poised to achieve what Ruy Texeira predicted a decade ago:  an “emerging Democratic majority”.

    Virtually all the groups that backed Obama — singles, millennials, Hispanics, Asians — are all growing bigger while many of the core Republican groups, such as evangelicals  and intact families, appear in secular decline.

    And then, the Republicans, ham handed themselves, are virtually voiceless (outside of the Murdoch empire) in the mainstream national media.

    Whatever the issue that comes up — from Hurricane Sandy to the Newtown shootings or the “fiscal cliffs” — the Republicans, congenitally inept to start with, end up being portrayed as even more oafish.

    Not surprising then that progressive boosters feel the wind of inexorability to their backs. Red states, and cities, suggests Richard Florida are simply immature versions of blue state ones; progress means density, urbanity, apartment living and the decline of suburbs. Republicans, he argues, are “at odds with the very logic of urbanism and economic development.”

    Yet I am not sure all trends are irredeemingly progressive. For one thing, there’s this little matter of economics. What Florida and the urban boosters often predict means something less progressive than feudalist. The Holy Places of urbanism such as NewYork, San Francisco, Washington DC also suffer some of the worst income inequality, and poverty, of any places in the country.

    The now triumphant urban gentry have their townhouses and high-rise lofts, but the service workers who do their dirty work have to log their way by bus or car from the vast American banlieues, either in peripheral parts of the city (think of Brooklyn’s impoverished fringes) or the poorer close-in suburbs. This progressive economy works from the well-placed academics, the trustfunders and hedge funders, but produces little opportunity for a better life for the vast majority of the middle and working class.

    The gentry progressives don’t see much hope for the recovery of blue collar manufacturing or construction jobs, and they are adamant in making sure that the potential gusher of energy jobs in the resurgent fossil fuel never materializes, at least in such places as New York and California. The best they can offer the hoi polloi is the prospect of becoming haircutters and dog walkers in cognitively favored places like Silicon Valley. Presumably, given the cost of living there, they will have to get there from the Central Valley or sleep on the streets.

    Not surprisingly, this prospect is not exciting many Americans. So instead of heading for the blue paradises, but to lower-cost, those who move now tend towards low-cost, lower-density regions like Dallas-Fort Worth, Houston, Atlanta, Austin, Charlotte and Raleigh. Even while voting blue, they seem to be migrating to red places. Once there, one has to doubt whether they are simply biding their time for Oklahoma City to morph into San Francisco.

    In this respect, the class issue so cleverly exploited by the President in the election could prove the potential Achilles heel of today’s gentry progressivism. The Obama-Bernanke-Geithner economy has done little to reverse the relative decline of the middle and working class, whose their share of national income have fallen to record lows. If you don’t work for venture-backed tech firms, coddled, money-for-nearly-free Wall Street or for the government, your income and standard of living has probably declined since the middle of the last decade.

    If the main focus of progressives was to promote upward mobility, they would deserve their predicted political hegemony. But current-day leftism is more about style, culture and green consciousness than jobs and opportunity. It’s more Vogue’s Anne Wintour than Harry Truman. Often times the gentry agenda — for example favoring higher housing and energy prices — directly conflicts with the interests of middle and working class families.

    The progressive coalition also has little to offer to the private sector small business community, which should be producing jobs as they have in the wake of previous recessions but have failed to do so this time. A recent McKinsey study  finds that small business confidence is at a 20 year low, entrepreneurial start-ups have slowed, and with it, the innovation that drives an economy from the ground up.

    These economic shortcomings are unlikely to reverse themselves under the Obama progressives. An old Democrat of the Truman and Pat Brown, perhaps even Bill Clinton, genre would be pushing our natural gas revolution, a key to blue-collar rejuvenation, instead of seeking to slow it down. They would be looking to raise revenues from Wall Street plutocrats rather than raise taxes on modestly successful Main Street businesses. A HUD interested in upward mobility and families would be pressing for more detached housing and dispersal of work, not forcing the masses to live in ever smaller, cramped and expensive lodgings.

    Over time, the cultural identity and lifestyle politics practiced so brilliantly by the President and his team could begin to wear thin even with their core constituencies.  Hispanics, for example, have suffered grievously in the recession — some 28%  now live in poverty, the highest of any ethnic group.

    It’s possible that the unnatural cohesion between gentry progressives and Latinos will tear asunder. For one thing Hispanics seek out life in suburbs with homes and backyards, and often drive more energy-consuming cars that fit the needs of family and work, notably construction and labor blue collar industries — all targets of the gentry and green agenda.

    Arguably the biggest challenge for the blue supremacists may prove the millennials, a group I have called the screwed generation. They have been vulnerable in a torpid recovery following a deep recession since they depend on new jobs or having their elders move to better ones; more than half of those under 25 with college degrees are either looking for work or doing something that doesn’t require tertiary education.

    For now, millennials — socially liberal, ethnically diverse and concerned with economic inequality — naturally tilt strongly to the President. Their voting power continue to swell as they enter the electorate. As Morley Winograd and Mike Hais have demonstrated, if they remain, as they predict, solidly Democratic, the future will certainly be colored blue.

    But this result is not entirely assured. Now that the first wave of millennials are hitting their thirties, they may not want to remain urban Peter Pans, riding their bikes to their barista jobs, as they age. A growing number will start getting married, looking to buy homes to raise children. The urban developers and gentry progressives may not favor this, preferring instead they remain part of “generation rent”  who remain chained to leasing apartments in dense districts.

    And then there’s the economy. What happens if in two or four years, millennials find opportunity still lagging?  Cliff Zukin, at Rutger’s John J. Heidrich Center for Workforce Development, predicts the young generation will “be permanently depressed and will be on a lower path of income for probably all their life”. One has to wonder if, at some point, they might rebel against that dismal fate. Remember the boomers too once tilted to the left, but moved to the center-right starting with Reagan and have remained that way.

    Of course, the blues have one inestimable advantage: a perennially stupid Republican party and a largely clueless, ideologically hidebound conservative movement. Constant missteps on issues like immigration and gay rights could keep even disappointed minority or younger votes in the President’s pocket. You can’t win new adherents by being the party of no and know-nothing. You also have to acknowledge that inequality is real and develop a program to promote upward mobility.

    Unless that is done, the new generation and new Americans likely will continue to bow to the blue idols, irrespective to the failures that gentry progressivism all but guarantees.

    Joel Kotkin is executive editor of NewGeography.com and is a distinguished presidential fellow in urban futures at Chapman University, and contributing editor to the City Journal in New York. He is author of The City: A Global History. His newest book is The Next Hundred Million: America in 2050, released in February, 2010.

    This piece originally appeared at Forbes.com.

    Barack Obama photo by Bigstock.

  • America the Mostly Beautiful

    In the fall of 2010, as part of a book project, ex-newspaperman Bill Steigerwald retraced the route John Steinbeck took in 1960 and turned into his classic “Travels With Charley.” Steigerwald drove 11,276 miles in 43 days from Long Island to the top of Maine to Seattle to San Francisco to New Orleans before heading back to his home in Pittsburgh.  In “Dogging Steinbeck,” his new e-book about how he discovered “Charley” was not nonfiction but a highly fictionalized and dishonest account of Steinbeck’s real trip, Steigerwald describes the America he saw.

    "Big."

    "Empty."

    "Rich."

    "No change since 1960."

    Long after the old farms and new forests of New England disappeared in my rearview mirror, I was still scrawling those words in the reporter’s notebook on my knee. Big, empty, rich and unchanged – that’s a pretty boring scouting report for the America I “discovered” along the Steinbeck Highway. You can add a bunch of other boring but fitting words – “beautiful,” “safe,” “friendly,” “clean,” and “quiet.”

    Like Steinbeck, I didn’t see the Real America or even a representative cross-section of America, neither of which exist anyway. Because I went almost exactly where Steinbeck went and stopped where he stopped, I saw a mostly White Anglo Saxon Protestant Republican America, not a “diverse and politically correct” Obama one. Mostly rural or open country, it included few impoverished or crime-tortured inner cities and no over-developed/underwater suburbs.

    America the Beautiful was hurting in the fall of 2010, thanks to the bums and crooks in Washington and on Wall Street who co-produced the Great Recession.  It still had the usual ills that make libertarians crazy and may never be cured: too many government wars overseas and at home, too many laws, politicians, cops, lawyers, do-gooders and preachers.

    But America was not dead, dying or decaying. There were no signs of becoming a liberal or conservative dystopia. The U.S. of A., as always, was blessed with a diverse population of productive, affluent, generous, decent people and a continent of gorgeous natural resources.

    Everyday of my trip I was surrounded by undeniable evidence of America’s underlying health and incredible prosperity. Everywhere I went people were living in good homes, driving new cars and monster pickup trucks and playing with powerboats, motorcycles and snowmobiles. Roads and bridges and parks and main streets were well maintained. Litter and trash were scarce. Specific towns and regions were hurting, and too many people were out of work, but it was still the same country I knew.

    I didn’t seek out poverty or misery or pollution on my journey, and I encountered little of it. The destitute and jobless, not to mention the increasing millions on food stamps, on welfare or buried in debt, were especially hard to spot in a generous country where taking care of the less fortunate is a huge public-private industry – where even the poor have homes, cars, wide-screen TVs and smart phones.

    I saw the familiar permanent American socioeconomic eyesores – homeless men sleeping on the sidewalks of downtown San Francisco at noon, the sun-bleached ruins of abandoned gas-stations on Route 66, ratty trailer homes parked in beautiful locations surrounded by decades of family junk. I saw Butte’s post-industrial carcass, New Orleans’ struggling Upper Ninth Ward and towns that could desperately use a Japanese car plant.

    But the country as a whole was not crippled or even limping. In the fall of 2010, nine in 10 Americans who said they wanted jobs still had them. The one in 10 who were jobless had 99 weeks of extended unemployment benefits and more than 90 percent of homeowners were still making their mortgage payments.

    Most of the states I shot through – including Maine, northern New Hampshire and Vermont, upstate New York, Wisconsin, Minnesota, North Dakota, Montana – had unemployment and foreclosure rates well below the national averages.

    I didn’t visit the abandoned neighborhoods of poor Detroit. I didn’t see battered Las Vegas, where 14.5 percent of the people were unemployed and one in nine houses – five times the national average – had received some kind of default notice in 2010. But I spent almost two weeks in the Great Train Wreck State of California, where jobless and foreclosure rates were higher than the national average and municipal bankruptcies loomed.

    America had 140 million more people than it did in 1960, but from coast to coast it was noticeably quiet – as if half the population had disappeared. Despite perfect fall weather, public and private golf courses were deserted. Ball fields were vacant. Parks and highway rest stops and ocean beaches were barely populated. Except for metropolises like Manhattan and San Francisco and jumping college towns like Missoula and Northampton, people in throngs simply did not exist. I went through lots of 30-mph towns that looked like they’d been evacuated a year earlier.

    As I drove what’s left of the Old Steinbeck Highway – U.S. routes 5, 2, 1, 11, 20, 12, 10, 101 and 66 – it was obvious many important changes had occurred along it since 1960. Industrial Age powerhouses like Rochester, Buffalo and Gary had seen their founding industries and the humans they employed swept away by the destructive winds of technology and global capitalism. Small towns like Calais in northeastern Maine had lost people and jobs, and vice versa.

    New Orleans had shrunk by half, and not just because of Katrina. The metro areas of Seattle, San Francisco and Albuquerque had exploded and prospered in the digital age. The populations of the West Coast and the Sunbelt had expanded since 1960. The South had shed its shameful system of apartheid and its overt racism, as well as much of its deep-rooted poverty and ignorance. The Northeast had bled people, manufacturing industries and its once overweening role in determining the nation’s political and cultural life.

    Change is inevitable, un-stoppable, pervasive. Nevertheless, it was clear that a great deal of what I saw out my car windows had hardly changed at all since Steinbeck and his French poodle Charley raced by.

    He saw more farmland and fewer forests than I did, especially in the East. But in many places I passed through almost nothing was newly built. Many farms and crossroads and small towns and churches were frozen in the same place and time they were eons ago, particularly in the East and Midwest.

    In Maine the busy fishing village of Stonington was as picturesque as the day Steinbeck left it. He’d recognize the tidy farms of the Corn Belt and the raw beauty of Redwood Country and the buildings if not the people of the Upper Ninth Ward. And at 70 mph whole states – North Dakota and Montana – would look the same to him except for the cell towers and Pilot signs staked out at the interstate exits.

    Steinbeck didn’t like a lot of things about Eisenhower America – sprawl, pollution, the rings of junked cars and rubbish he saw around cities. And he lamented – not in “Charley” but in letters to pals like Adlai Stevenson – that he thought America was a rotting corpse and its people had become too soft and contented to keep their country great and strong.

    But Steinbeck had America’s future wrong by 178 degrees. Fifty years later, despite being stuck in an economic ditch, the country was far wealthier, healthier, smarter and more globally powerful and influential than he could have imagined. Its air, water and landscapes were far less polluted. And, most important, despite the exponential growth of the federal government’s size and scope and its nanny reach, America in 2010 was also a much freer place for most of its 310 million citizens, especially for women, blacks, Latinos and gays.

    You don’t have to be a libertarian to know America is not as free as it should be. But there’s no denying that today our society is freer and more open than ever to entrepreneurs, new forms of media, alternative lifestyles and ordinary people who want to school their own kids, medicate their own bodies or simply choose Fed Ex instead of the U.S. Post Office.

    As for the stereotypical complaints about America being despoiled by overpopulation, overdevelopment and commercial homogenization, forget it. Anyone who drives 50 miles in any direction in an empty state like Maine or North Dakota – or even in north-central Ohio or Upstate New York – can see America’s problem is not overpopulation. More often it’s under-population. Cities like Butte and Buffalo and Gary have been virtually abandoned. Huge hunks of America on both sides of the Mississippi have never been settled.

    From Calais, Me., to Pelahatchie, Miss., I passed down the main streets of comatose small towns whose mayors would have been thrilled to have to deal with the problems of population growth and sprawl.  If anyone thinks rural Minnesota, northwestern Montana, the Oregon Coast, the Texas Panhandle or New Orleans’s Upper Ninth Ward have been homogenized, taken over by chains or destroyed by too much commercial development, it’s because they haven’t been there.

    The America I traveled was unchained from sea to sea. I had no problem eating breakfast, sleeping or shopping for road snacks at mom & pop establishments in every state. The motels along the Oregon and Maine coasts are virtually all independents that have been there for decades. You can go the length of old Route 66 and never sleep or eat in a chain unless you choose to.

    Steinbeck, like many others have since, lamented the loss of regional customs. (I don’t think he meant the local “customs” of the Jim Crow South or the marital mores of the Jerry Lee Lewis clan.)  I didn’t go looking for Native Americans, Amish, Iraqis in Detroit, Peruvians in northern New Jersey or the French-Canadians who have colonized the top edge of Maine.  But I had no trouble spotting local flavor in Wisconsin’s dairy lands, in fishing towns along Oregon’s coast, in the redwood-marijuana belt of Northern California, in San Francisco’s Chinatown or the cattle country of Texas.

    Not to generalize, but the New York-Hollywood elites believe the average Flyover Person lives in a double-wide or a Plasticville suburb, eats only at McDonald’s, votes only Republican, shops only at Wal-Mart and the Dollar Store, hates anyone not whiter than they are, speaks in tongues on Sunday and worships pickup trucks, guns and NASCAR the rest of the week.

    Those stereotypes and caricatures are alive and well in Flyover Country. But though I held radical beliefs about government, immigration and drugs that could have gotten me lynched in many places, I never felt I was in a country I didn’t like or didn’t belong in. Maybe I just didn’t go to enough sports bars, churches and political rallies, but for 11,276 miles I always felt at home.

    Bill Steigerwald, born and raised in Pittsburgh, is a former L.A. Times copy editor and free-lancer who also worked as a docudrama researcher for CBS-TV in Hollywood before becoming a reporter for The Pittsburgh Post-Gazette and a columnist for The Pittsburgh Tribune-Review. He recently retired from daily newspaper journalism.

  • America’s Baby Boom And Baby Bust Cities

    At this most familial time of the year, as recent events make us hold our children even closer, we might want to consider what kinds of environments are most conducive to having offspring. Alarm bells are beginning to ring in policy circles over the decline of the U.S. birth rate to a record low. If unaddressed, this could pose a vital threat the nation’s economic and demographic vitality over the next few decades.

    In contrast to last week, when we examined the nearly uniform aging of America’s biggest cities over the last decade, the decline in the country’s youth population has been in relative terms. In 2000, roughly 21.4% of Americans were under 15; in 2010, that percentage had dropped to 19.8%. However, unlike in parts of Europe and East Asia, the number of American children did not decline – there were over a million more in 2010, a 1.7% increase.

    Yet since children are by definition the bearers of the future, knowing where new families and households are forming should be of critical interest not only to demographers, but to investors, businesses and, over time, even politicians. Demographer Wendell Cox crunched Census data for Forbes on the youth populations of the 51 largest U.S. metropolitan statistical areas. His analysis reveals sharp differences between various regions of the country, and suggests where future growth in the country may be the strongest.

    The youth population expanded in 31 of the 51 metro areas from 2000 to 2010. The 10 regions that posted the strongest growth were in Texas, the Southeast and the Intermountain West. Leading the nation is Raleigh, N.C., where the number of children under 15 rose a whopping 45%, or 77,421. Texas is experiencing something of a baby boom, paced by Austin, second among America’s largest metro areas with a youth population expansion of 38%; Dallas-Ft. Worth (sixth); Houston (eighth); and San Antonio (11th).

    Out west, Las Vegas (third place) and Phoenix (fifth) may be better known as retirement destinations, but also have become increasingly attractive to families. Other western cities with a strong increase in children include Riverside-San Bernardino, Calif. (12th), Salt Lake City (13th) and Oklahoma City (15th). Surprisingly some Midwestern cities also perform relatively well, led by Indianapolis (16th) and Columbus, Ohio (18th).

    If these regions are attractive to young families, which ones are not? Outside of last place New Orleans, whose demographic data was distorted by the massive outflow of population due to the Katrina disaster, the sad sacks on this list include many of the usual suspects: aging industrial centers. Buffalo’s youth population declined 16%, Detroit’s, 15%; and Cleveland’s 14%. In these cities, notes Cleveland policy researcher Richey Piiparinen, pessimism about the future, for you and your children, naturally results from “being born into post-industry.”

    Not having kids in what may seem to be a ruined economy is understandable. But many metro areas that are usually associated with youthfulness and aspiration are producing fewer children, including Los Angeles (sixth place on our list of baby bust cities with a decline of 12.4%), New York, NY-NJ-PA (eighth, down 7%) and San Francisco-Oakland (16th, -2.7%). Over the past decade these metro areas have lost hundreds of thousands from their under 15 population; Los Angeles has an astounding 360,000 fewer 15 year olds than in 2000 while New York has almost 270,000 fewer and Boston some 62,000 less.

    What do these trends mean for the future? New York has lost about as many children as Dallas-Ft. Worth has gained — a difference of a half million. The gap between increasingly childless Los Angeles and Houston is even wider, and approaches 600,000. These numbers suggest a tremendous shift in the future locations of new American households, with all that implies for retail sales, workforce growth and residential construction demand.

    Indeed a recent Pitney-Bowes study projects that the largest absolute growth in households in the next five years will be in Houston, with a gain of 140,000, or 6.7%,  while Atlanta is projected to add slightly over 100,000 households, 5.4% more.

    In contrast the largest metropolitan area in the country, the New York region, will grow by a mere 75,000 households, a paltry 1.7% clip, while Los Angeles will add only 46,000. Chicago, the third largest metro area, is only expected to add 33,000 households, a growth rate of barely 1.2%.

    Why is household formation and child-rearing so anemic in these places, which are often celebrated for being attractive to the young and dominate so many key industries? One key reason, suspects demographer Cox, is housing prices relative to incomes. This is largely due to high regulatory costs that discourage new housing supply, particularly the single-family homes preferred by most families. Housing costs relative to incomes are more than two times higher in New York or Los Angeles than in Houston, Dallas-Fort Worth, Atlanta or, for that matter, virtually all the metropolitan areas most attractive to families.

    Another factor may be the impact of density, which, Cox demonstrates, tends to depress fertility rates not only here in the United States, but through much of the world. The fastest-growing youth populations tend to be in lower-density regions such as Austin, Raleigh and Atlanta; the slower growth, outside of the old industrial belt tends to be in the high-density regions.

    These differences also exist on the metro level. Within regions, certain areas attract more families than others. For the most part, despite the media hype about families returning to the city, the biggest declines in the under 15 population tend to be in the core urban areas.

    Take New York, our greatest city and one that has experienced considerable improvement in quality of life over the last two decades. Yet despite this, the under 15 population of New York County (Manhattan) dropped nearly 10% over the past decade, a net loss of 21,000. Barely 12% of Manhattanites are under 15, far below the national rate of 19.8%. Similar declines have occurred as well in Brooklyn, a borough that many priced-out Manhattan couples have seen as a refuge for young families.

    So where are the kids being born in the New York area? The only gainers were in the much-despised, lower-density exurbs such as Rockland County, N.Y., and New Jersey’s Ocean County. A similar, if even more marked pattern can be seen in the greater Chicago area, where Cook County, which contains the Windy City, suffered a 160,000 net drop over the decade in its under 15 population; with an 18% decrease in its student body, it’s not surprising that half of Chicago’s public schools are considered underutilized. Meanwhile exurban Will and Kane counties together have gained some 56,000 children under 15, up over 20%.

    Similar phenomena can be observed in most metropolitan areas, including San Francisco, which increasingly resembles a child-free zone. With just 11.2% of the population under 15, the City by the Bay now has the lowest percentage of children of any large county in the nation.

    These numbers tell us some intriguing things about our demographic future, and perhaps suggest how to address a potential “birth death.” As the percentage of children relative to adults, and particularly seniors, declines, it’s imperative to identify environments attractive to young families. For the most part, this means areas that offer the best mix of job opportunities, reasonable housing costs and, for the most part, lower density living. If developers and investors can transcend the incessant urban hype and look at the numbers, they may want to look more closely at these places as most likely to enjoy future growth.

    Change in Population of Children Under Age 15, 2000-2010
    Rank by % Change Geography Population Under 15, 2000 Population Under 15, 2010 Percent Change
    1 Raleigh-Cary, NC 171,779 249,712 45.4%
    2 Austin-Round Rock-San Marcos, TX 266,816 368,852 38.2%
    3 Las Vegas-Paradise, NV 300,700 408,053 35.7%
    4 Charlotte-Gastonia-Rock Hill, NC-SC 287,728 382,071 32.8%
    5 Phoenix-Mesa-Glendale, AZ 739,916 928,284 25.5%
    6 Dallas-Fort Worth-Arlington, TX 1,222,705 1,488,383 21.7%
    7 Atlanta-Sandy Springs-Marietta, GA 955,906 1,162,405 21.6%
    8 Houston-Sugar Land-Baytown, TX 1,145,997 1,389,377 21.2%
    9 Orlando-Kissimmee-Sanford, FL 341,258 409,103 19.9%
    10 Nashville-Davidson–Murfreesboro–Franklin, TN 272,777 324,763 19.1%
    11 San Antonio-New Braunfels, TX 404,441 478,769 18.4%
    12 Riverside-San Bernardino-Ontario, CA 860,121 992,097 15.3%
    13 Salt Lake City, UT 245,938 280,656 14.1%
    14 Denver-Aurora-Broomfield, CO 467,812 533,326 14.0%
    15 Oklahoma City, OK 231,567 263,717 13.9%
    16 Indianapolis-Carmel, IN 343,176 384,015 11.9%
    17 Tampa-St. Petersburg-Clearwater, FL 438,834 484,416 10.4%
    18 Columbus, OH 347,692 379,627 9.2%
    19 Jacksonville, FL 244,723 265,118 8.3%
    20 Sacramento–Arden-Arcade–Roseville, CA 406,444 439,086 8.0%
    21 Washington-Arlington-Alexandria, DC-VA-MD-WV 1,023,931 1,104,688 7.9%
    22 Kansas City, MO-KS 407,217 435,884 7.0%
    23 Portland-Vancouver-Hillsboro, OR-WA 411,430 438,944 6.7%
    24 Louisville/Jefferson County, KY-IN 242,945 255,445 5.1%
    25 Richmond, VA 229,341 240,779 5.0%
    26 Seattle-Tacoma-Bellevue, WA 624,007 651,605 4.4%
    27 Minneapolis-St. Paul-Bloomington, MN-WI 663,817 680,322 2.5%
    28 Birmingham-Hoover, AL 219,064 223,621 2.1%
    29 San Jose-Sunnyvale-Santa Clara, CA 366,072 373,089 1.9%
    30 Memphis, TN-MS-AR 285,823 287,894 0.7%
    31 Miami-Fort Lauderdale-Pompano Beach, FL 988,407 987,881 -0.1%
    32 Cincinnati-Middletown, OH-KY-IN 443,771 441,086 -0.6%
    33 San Diego-Carlsbad-San Marcos, CA 611,119 596,168 -2.4%
    34 San Francisco-Oakland-Fremont, CA 783,554 764,185 -2.5%
    35 Milwaukee-Waukesha-West Allis, WI 329,359 315,745 -4.1%
    36 Chicago-Joliet-Naperville, IL-IN-WI 2,055,882 1,956,235 -4.8%
    37 Baltimore-Towson, MD 540,894 511,503 -5.4%
    38 Philadelphia-Camden-Wilmington, PA-NJ-DE-MD 1,205,561 1,136,468 -5.7%
    39 Hartford-West Hartford-East Hartford, CT 233,267 219,315 -6.0%
    40 St. Louis, MO-IL 585,403 549,544 -6.1%
    41 Virginia Beach-Norfolk-Newport News, VA-NC 348,293 324,478 -6.8%
    42 New York-Northern New Jersey-Long Island, NY-NJ-PA 3,808,773 3,537,709 -7.1%
    43 Boston-Cambridge-Quincy, MA-NH 868,251 805,699 -7.2%
    44 Providence-New Bedford-Fall River, RI-MA 317,329 281,422 -11.3%
    45 Los Angeles-Long Beach-Santa Ana, CA 2,915,391 2,558,983 -12.2%
    46 Rochester, NY 221,349 192,407 -13.1%
    47 Pittsburgh, PA 447,278 384,818 -14.0%
    48 Cleveland-Elyria-Mentor, OH 455,074 390,730 -14.1%
    49 Detroit-Warren-Livonia, MI 996,019 845,894 -15.1%
    50 Buffalo-Niagara Falls, NY 236,269 198,371 -16.0%
    51 New Orleans-Metairie-Kenner, LA 289,988 225,512 -22.2%
    Source: U.S. Decennial Census 2010 and 2000


    Joel Kotkin is executive editor of NewGeography.com and is a distinguished presidential fellow in urban futures at Chapman University, and contributing editor to the City Journal in New York. He is author of The City: A Global History. His newest book is The Next Hundred Million: America in 2050, released in February, 2010.

    This piece originally appeared at Forbes.com.

    Crossing the street photo by Bigstock.

  • A Volunteer Army’s Attempt to Fill the New York Hurricane Response Gap

    On November 6, eight days after Hurricane Sandy’s surge waters flooded the streets, I started volunteering in the Rockaways, where I stayed for much of the next three weeks.

    On that first day, I joined an ad hoc group of volunteers and took a school bus full of supplies donated by my Brooklyn neighbors out to a church on Beach 67th Street. Unloading the bus alongside parishioners at the Battalion Pentecostal church I learned that it was the first shipment they had received for the immediate area since the storm, and that aside from the traffic cops waving cars through and a National Grid trailer parked in the church lot, there was still no official presence in the neighborhood.

    The donations we brought were being carried away even before the last of them was off the bus, as word spread through the row houses that lined the block. The mother of a disabled girl carried a box of canned food to her powerless apartment and came back to ask for more. Her fridge and cupboards were already emptied.

    The other volunteers and I took the empty bus back to Brooklyn to refill it with more supplies and return later that day. On the drive back, only a mile away from the church, I saw a supermarket parking lot with truckloads of donated material guarded by police and national guardsmen. The people around the church, many of whom lost their cars in the flood, had no way to get the supplies from the parking lot back to their homes, which was incidental since most of them, cut off from any news that didn’t pass by mouth, didn’t even know that the goods were there.

    On my second day in the Rockaways I took some time to drive around and see how things were in other neighborhoods, looking for places like the church on 67th Street that were not yet being helped. I found that at the St. Francis de Sales church in Belle Harbor, on 129th Street, some supplies were already being turned away, as boxes had filled the large main hall and were now overflowing into additional rooms to accommodate the constant influx of donations.

    Several days later I returned to Francis de Sales to ask that they send food to an apartment complex I had found on the tip of the peninsula near Nassau county, where hundreds of elderly residents were living without heat or power, rationing canned goods and prescription medicine. An Australian volunteer at the church told me that he would take care of it, and while I believed he meant it, I also knew that he might be gone the next day, back to work or to his life outside volunteering.

    No one was keeping track.

    There is a city agency charged with just that: the Office of Emergency Management (O.E.M.). Emergencies are, by definition, chaotic, and the office is there to do two things: to compile block-by-block information into a unifying big picture, and to ensure responders and resources are allocated in accordance with that picture. In short: triaging, first understanding needs, and then prioritizing among them. But O.E.M. was conspicuously absent while I was in the Rockaways, and according to volunteers and officials I spoke with while reporting this story.

    Trying to get people food and basic supplies took up much of my first week in the Rockaways, and yet there was no problem with scarcity. The city spent close to $3 million for food and water distribution and, as of November 26, had distributed over 2 million meals, while donations poured in from New York and out-of-state charities.

    Individuals and small groups were doing their best to attend to immediate need, but the lack of direction was acute, resulting in a feast-or-famine situation that varied block by block.

    I visited the parking lot where I had seen the trucks of supplies parked and asked if they could be moved to the under-served church on 67th Street but the National Guardsman posted there explained apologetically that taking supplies neighborhood-to-neighborhood, a more effective manner of distribution, didn’t match their orders.

    Though city officials had been working hard since even before the storm struck, one thing they weren’t doing was taking control of the situation on the ground, canvassing neighborhoods to determine needs and directing services and supplies accordingly. Nor, since they may not have enough staff to do this all themselves, were they effectively organizing and commanding the hodge-podge of official and unofficial groups and the steady stream of volunteers attempting to make themselves useful.

    Relief supplies managed by the city were being delivered to a handful of centralized points without much of a plan for getting them to the people in need, even as the National Guard and the many volunteers looked for ways to help.

    Some volunteer groups had identified this issue early on and attempted to deal with it, on their own, in various ways.

    Some drove around with supplies until they found people who obviously needed them, and some groups like Occupy Sandy and Save the Rockaways used social media and web presence to post alerts identifying where food and volunteers were needed.

    Team Rubicon, a veteran-led relief group, took things even further, using a computer program called Palantir to create an annotated map of conditions in the Rockaways and by stepping up to fill the leadership vacuum. Palantir is a data visualization platform used by the military and intelligence agencies to track and analyze the information gathered from complex environments. It can be highly effective but ultimately relies on human users inputting information gathered from the field.

    The group was initially collecting handwritten work orders and reports on local conditions from team members and local residents to track what work was ongoing and what remained to be done. The task of gathering intelligence and feeding into a single model, whether by writing on a map or using a digital database, is a basic pre-condition for conducting any complex operation—you need to understand an environment in order to address its problems. Once they had Palantir added to their system, Team Rubicon could take any report and add it to their database to create a single fluid model of conditions on the ground.

    When they first arrived in the Rockaways Team Rubicon intended to be a labor force moving supplies and shoveling out flooded basements. But as the crisis dragged on and more volunteers began arriving in the thousands without any government agency directing their work, Rubicon’s leaders shifted their priorities. Rather than doing all the shoveling themselves, they organized the incoming volunteers into small groups with one Rubicon member assigned to each as a team leader, and dispatched the groups to fill the hundreds of work orders that they had compiled through their canvassing.

    As effective as Team Rubicon’s approach was, their reach was limited by their size and the fact that they were only one group among many without any official authority to direct overall efforts. Rubicon’s methodology, collecting and centralizing information in order to coordinate actions, could have been used by the city and implemented on a larger scale and in fact is precisely the approach outlined in the city’s own emergency relief protocols. But, over a month after the hurricane hit, the city’s relief effort still lacks the crucial aspect that has been missing from the start—an effective overhead body leading operations.

    Information management is not just an issue for the next emergency: inefficiencies and failures are still occurring because different volunteer groups are not forced to share information and none of them, despite their working relationships, are really on the same page as the city. As one official in a volunteer group that worked with the city during relief efforts put it, “The city had the intel arms in place, the volunteer groups out in the neighborhoods, but they had no system to receive our reports.”

    When the city finally started to use volunteer groups for canvassing, it appears to have done so only at the urging of those groups, long after the storm hit.

    A Times article details the city housing authority’s failure to properly account for and provide relief to city residents, many of them elderly and unable to evacuate, stuck for weeks in buildings without power or heat. Almost two weeks after the storm, the city called on volunteer groups to go door to door in public housing in Coney Island, surveying to establish how many thousands were stuck in the buildings and what their immediate needs were.

    Responding to complaints from volunteers about the city’s lack of leadership in those relief efforts, Nazli Parvizi, the city’s commissioner for community affairs, is quoted in the Times piece saying that the she didn’t want to disturb the volunteers’ good work by taking control of the situation.

    According to Parvizi, “I wasn’t here to change that narrative [of volunteers leading while the city played a supporting role]. I was asking them, ‘What do you need?’”

    Give Parvizi credit for being honest and not pretending, as many officials have, that the city was aggressively leading relief operations.

    The task of coordinating the efforts of various government agencies, volunteers and non-governmental organizations, and providing an overarching structure for emergency response, is precisely what New York City’s Office of Emergency Management (O.E.M.) was created to do.

    On its website O.E.M. lists “on-scene coordination” as one of the core responsibilities it assumes an emergency. Yet it was only seen sporadically in the hardest-hit parts of the city—including the Rockaways, Staten Island and Coney Island—and was entirely absent from the wave of city-official-sourced tick-tocks and other stories.

    Founded in 1996 by an executive order from Rudy Giuliani, the office effectively took responsibility for emergency planning and response away from the NYPD and gave it directly to the mayor’s office, reportedly to the displeasure of Howard Safir, who was the police commissioner at the time.

    In 2001 after becoming its own independent department outside of the mayor’s office and proving its worth in the eyes of many by its response to the attacks of 9/11, O.E.M. seemed to have justified its founding mission and earned an enduring presence. But things changed when Bloomberg was elected and Ray Kelly returned to take over the NYPD. According to multiple sources and news accounts, Kelly, like Safir before him, saw O.E.M. as an affront to the primacy of the police department’s role in ensuring public safety and pressured the mayor to marginalize the organization.

    Apparently he had some success in this regard. In 2005, O.E.M. commissioner Joseph Bruno testified before the City Council in a hearing over Bloomberg’s decision to place responsibility for handling hazardous materials in a potential terrorist incident into the hands of the NYPD.

    In his testimony, Bruno stated that his office had been more powerful under Giuliani and that in the event of a dispute between the FDNY and NYPD on the site of an emergency he would “give advice,” but “O.E.M. is not going to come in and say, ‘We’ll tell you how to do it.’”

    According to a high-ranking official in a prominent volunteer relief organization who has worked closely with both the mayor’s office and O.E.M., tensions between the offices were obvious during the initial, crucial days following the hurricane and communications terse and perfunctory. This official said that whenever there were disagreements between O.E.M. and the mayor’s office, the mayor’s office won.

    O.E.M. declined to provide comment for this story, but conversations with sources with knowledge of O.E.M.’s operations and a review of the organization’s history and the turf wars that have shaped its current role provide some insight into what went wrong, and ideas about why those problems are likely to recur in the next disaster. On paper, OEM had all of the tools and resources in place to address these problems. The Citywide Asset and Logisitics Management System (CALMS), created in 2003, is touted by the office as its means of facilitating the movement of supplies in emergency response, and as a crucial part of their mission to “[work] with government agencies and nonprofit organizations to provide assistance to disaster victims and manage relief efforts, donations, and spontaneous volunteers.” According to the O.E.M. website, “CALMS integrates multiple resource management systems and provides a single view of the resources managed or accessible to response agencies.”

    But at a meeting held two weeks ago by the New York City chapter of Voluntary Organizations Active in Disaster (VOAD), with an O.E.M. liaison in attendance, the system’s shortcomings were made clear.

    VOAD, which brings together a coalition of volunteer groups to plan and coordinate relief efforts and which has been meeting regularly since before Hurricane Sandy, seems not to have been connected to O.E.M.’s system. The volunteer official that I spoke with attended the VOAD meeting last week and told me that a member of Occupy Sandy stood up to plead for help with ongoing food shortages while across the table a Red Cross official offered that he had a fleet of trucks loaded with food and only needed to know where to send them.

    A second official in a volunteer group I spoke to described driving around the Rockaways on the day of the Northeaster that followed Hurricane Sandy, canvassing neighborhoods to find the people most vulnerable to the coming snowfall. Seeing an O.E.M. setup, he stopped to do some coordination and trade notes and found that the O.E.M. officials were packing up to leave the Rockaways and return to Manhattan in anticipation of the storm.

    “Here we were, volunteers going into the storm, and they were leaving,” he said. “It was just gross negligence on their part.”

    Media coverage of the city’s reaction to the storm mostly reflects the overriding political priority, which is getting as much federal aid money as possible, and figuring out the expected tens of billions in funding once it begins to come in.

    Bloomberg, aware that the polls showed a big majority of New Yorkers approved of the administration’s response to the storm, has focused his limited criticism on flaws in preparedness and on the question of whether to build sea walls.

    A full accounting of the city’s performance will take time and the disclosure of public records not yet available, but the process can start with some simple questions. What should New Yorkers expect of the city when disasters occur? What agencies are responsible for the unique and critical needs that arise from emergencies? Whose job is it to feed individuals and families stuck in homes without power? What is the role of volunteer organizations in disasters of this kind, and to whom are they accountable?

    The core elements of OEM’s mission—on-scene coordination, logistics management, directing government and non-government groups—constitute a short list of the critical functions that have been most lacking in the city’s response. New Yorkers will need real transparency from the office and an accounting of the functioning of city agencies during and after the storm.

    As of this writing, the records of O.E.M.’s action since the hurricane are still minimal, and the office has yet to initiate its own after-action review.

    This piece first appeared at Capital New York.

    Jake Siegel was born and raised in Brooklyn. His writing has appeared in The New York Times, New York Press and New Partisan. HIs short story will appear in "Fire and Forget" an anthology of fiction written by Iraq and Afghanistan veterans being released by Da Capo on February 12, 2013.

    Rockaway Beach hurricane response photo by Bigstock.

  • Alleviating World Poverty: A Progress Report

    There has been a substantial reduction in both the extreme poverty rate and the number of people living in extreme poverty since the early 1980s, according to information from the World Bank poverty database. The World Bank maintains data on developing world nations, which include both low income and middle income nations. The analysis below summarizes developing world (low and middle income nations) poverty trends from 1981 to the latest available year, 2008 (Table and Figure 1).

    Evolution of Low and Middle Income World Poverty: 1981-2008
      Poverty Rate Change in Millions % of New Population Not in Poverty
          People in Poverty People Not in Poverty
    POVERTY RATE & Region 1981 2008
    EXTREME POVERTY LINE  ($1.25/Day per capita)      
    East Asia and Pacific 77.2% 14.3%           (812)           1,374 >100.0%
    Europe and Central Asia 1.9% 0.5%                (6)                50 >100.0%
    Latin America and the Caribbean 11.9% 6.5%                (6)              212 >100.0%
    Middle East and North Africa 9.6% 2.7%                (8)              155 >100.0%
    South Asia 61.1% 36.0%                  2              655 99.6%
    Sub-Saharan Africa 51.4% 47.5%             181              233 56.3%
    Total 52.2% 22.4%           (649)           2,679 >100.0%
    DEVELOPING WORLD POVERTY LINE ($2.00/Day per capita)    
    East Asia and Pacific 92.5% 33.4%           (652)           1,214 >100.0%
    Europe and Central Asia 8.4% 2.2%              (26)                70 >100.0%
    Latin America and the Caribbean 23.8% 12.4%              (16)              221 >100.0%
    Middle East and North Africa 30.2% 14.0%                (7)              155 >100.0%
    South Asia 87.3% 71.1%             316              341 51.9%
    Sub-Saharan Africa 72.3% 69.3%             275              139 33.5%
    Total 69.7% 43.1%           (109)           2,140 >100.0%
    US POVERTY LINE: FAMILY OF FOUR ($13.50/Day per capita)    
    East Asia and Pacific 99.8% 96.6%             499                64 11.3%
    Europe and Central Asia 88.3% 72.1%              (38)                82 >100.0%
    Latin America and the Caribbean 86.3% 79.7%             139                66 32.1%
    Middle East and North Africa 96.0% 95.3%             140                   8 5.5%
    South Asia 100.0% 99.7%             652                   5 0.8%
    Sub-Saharan Africa 98.7% 98.6%             408                   6 1.5%
    Total 96.9% 94.0%          1,799              231 11.4%
    Source: World Bank PovcalNet database
    Poverty rates lines in 2005 US$ per capita

    Extreme Poverty Line ($1.25 Daily per Capita)

    Extreme poverty is defined as an income of $1.25 daily per capita, measured in 2005 United States dollars. The extreme poverty line is the average of the poverty rate among the "10 to 20" lowest income nations.

    The World Bank data indicates a nearly 60 percent reduction in the extreme poverty rate between 1981 and 2008, from 52.2 percent to 22.4 percent. By far the largest reduction was in the East Asia and Pacific region (which includes the large nations of China, Indonesia, Viet Nam, the Philippines stretches westerly to Myanmar) where the extreme poverty rate dropped more than 80 percent from 77.2 percent to 14.3 percent. Reductions of more than 70 percent were also experienced in the Middle East and North Africa and Europe and Central Asia, which is by far the most affluent of the developing world regions as designated by the World Bank (generally Eastern Europe, including Russia and Ukraine and the Central Asian nations to the western border of China, such as Kazahkstan).

    In 2008, approximately 650 million fewer people were living in extreme poverty than in 1981. This gain was dominated by East Asia and the Pacific, which experienced a reduction of 812 million people living below the extreme poverty line. Nearly all of the increase (181 million) in people living below the extreme poverty line occurred in Sub – Saharan Africa, a result of surging populations and still insufficient economic growth.

    Even so all six of the regions experienced an increase in the number of people living above the extreme poverty line. Further, in four regions, the increase in people above the extreme poverty line was greater than the overall population increase, and was nearly equal in a fifth. The increase in above extreme poverty population was less than the overall increase only in Sub-Saharan Africa.

    More than one half of the new population living above the extreme poverty line (1.37 billion) are in East Asia and the Pacific. Another quarter (0.65 billion) were in South Asia, which includes India, Pakistan and Bangladesh. Gains of from 155 million to 233 million were made in Sub-Saharan Africa, Latin America and the Caribbean and the Middle East and North Africa (in descending order). The sixth region, Europe and Central Asia had by far the lowest extreme poverty rate among the region, yet still managed a 50 million person improvement.  

    Developing World Poverty Line ($2.00 Daily per Capita)

    The success in reducing poverty was even more skewed to East Asia and the Pacific as measured against a somewhat higher average developing world poverty line of $2.00 daily per capita. The developing world under $2.00 poverty rate declined approximately one-third, from 69.7 percent to 43.1 percent

    The largest reduction was in Europe and Central Asia, where such poverty is rapidly becoming a thing of the past. The poverty rate declined almost three-quarters, to 2.2 percent. The $2.00 poverty rate fell 64 percent in East Asia and the Pacific, from 92.5 percent to 33.4 percent. Each of the other four regions also experienced declines in the $2.00 poverty line.

    There were 109 million fewer people living below the $2.00 poverty line in 2008 than in 1981. The improvement was heavily skewed toward East Asia and the Pacific, where there was a reduction of more than 650 million living below the $2.00 poverty line. There were, however, substantial increases in the number of people living below the $2.00 poverty line in South Asia (275 million) and Sub-Saharan Africa (316 million).

    Nonetheless, more than 2.1 billion additional people lived above the $2.00 poverty line in 2008 than in 1981. All regions experienced gains. East Asia and the Pacific accounted for 1.2 billion of this number, followed by South Asia (341 million) and Latin America and the Caribbean (221 million).

    United States Poverty Line ($13.50 Daily per Capita)

    Despite these gains, the extent of poverty in the developing world is substantial compared to high income world standards. For comparison, the 2008 poverty line for a family of four in the United States is used, which was $13.50 daily per capita. This is more than 10 times the extreme poverty line and nearly 7 times the $2.00 developing world poverty line.

    Between 2001 and 2008, the percentage of people in the developing world living below the US poverty line is estimated to have declined from 96.9 percent to 94.0 percent. Progress was made in each of the six regions, but even in the most affluent developing world region of Europe and Central Asia the poverty rate relative to the US standard remained at 72 percent. Even in largely middle-income Latin America and the Caribbean, the poverty rate, measured by the US standard was 80 percent. All of the other regions were at 95 percent or more. The highest poverty rate relative to the US standard was in South Asia, at 99.7 percent.

    Overall, nearly 1.8 billion additional people lived below the US poverty standard in 2008. The number of people living below the poverty standard declined only in the Europe and Central Asia. The largest increase in people living below the US poverty standard was in South Asia, at 652 million, while both East Asia and the Pacific and Sub – Saharan Africa added between 400 million and 500 million.

    The increase in the number of people living above the US poverty standard was modest, at 231 million. The largest increase was in Europe and Central Africa, at 82 million, while East Asia and the Pacific and Latin America and the Caribbean added approximately 65 million each.

    National Highlights

    East Asia and the Pacific have experienced the greatest reduction in poverty rates, as has been shown above. This is largely due to the substantial progress made by its largest nation, China. China experienced the largest reduction in its extreme poverty rate in the world, with a drop from 84.0 percent in 1981 to 13.1 percent in 2008. Among other developing world nations with more than 100 million population, eight experienced significant declines in their extreme poverty rates. One, however, Nigeria, had an increase. There was no data for Russia (Figure 2).

    China’s below extreme poverty line population declined 662 million, more than 10 times the second largest reduction, in Indonesia at 56 million. In fact, China’s reduction in its extreme poverty population exceeded that of the rest of the world (Figure 3).

    The number of people living above the extreme poverty line is increasing across the developing world.
    Nearly 85 percent of China’s 2008 population lived above the extreme poverty line, an increase of nearly one billion from 1981. In India nearly 60 percent of its 2008 population lived above this line, an increase of 450 million. Other large nations experienced large increases in the number of people living above extreme poverty, such as Indonesia (135 million) and Pakistan (115 million) (Figure 4).

    Only a few nations had reductions in their number of people living above the extreme poverty rate. The Democratic Republic of the Congo had the largest increase, at 6 million.

    Eradicating Poverty: The Highest Priority

    The story on world poverty contains both good news to bad news. There is clearly substantial progress is being made in reducing extreme poverty in East Asia and the Pacific but this has not been replicated in other parts of the developing world. The bad news is that, for all the progress, the standards of living for the overwhelming majority of people remain far below first world poverty levels.

    Yet, there are signs of hope. A recent report by the Institute of International Finance indicates that over the last decade, Sub-Saharan Africa, long perceived to be synonymous with the world’s most intense poverty, has ranked second in economic growth only to East Asia for a decade.

    Yet, it can only be hoped that the natural aspiration of the world’s billions for much better lives will be achieved. The highest priority should be placed on eradicating poverty, as the recent Rio +20 Conference declared.

    —–

    Wendell Cox is a Visiting Professor, Conservatoire National des Arts et Metiers, Paris and the author of “War on the Dream: How Anti-Sprawl Policy Threatens the Quality of Life.”

    Photograph: New houses in León (Guanajuato) Mexico (by author)

  • Aging America: The Cities That Are Graying The Fastest

    Notwithstanding plastic surgery, health improvements and other modern biological enhancements, we are all getting older, and the country is too. Today roughly 18.5% of the U.S. population is over 60, compared to 16.3% a decade ago; by 2020 that percentage is expected to rise to 22.2%, and by 2050 to a full 25%.

    Yet the graying of America is not uniform across the country — some places are considerably older than others. The oldest metropolitan areas, according to an analysis of the 2010 census by demographer Wendell Cox, have twice as high a concentration of residents over the age of 60 as the youngest. In these areas, it’s already 2020, and some may get to 2050 aging levels decades early.

    For the most part, the oldest metropolitan areas — with the exception of longtime Florida retirement havens Tampa-St. Petersburg and Miami — tend to be clustered in the old industrial regions of the country. These are regions that have suffered mightily from deindustrialization and the movement of people toward the South and West. These metro areas now make up eight of the 10 oldest among the nation’s 51 largest metropolitan statistical areas.

    The oldest city in America is Pittsburgh, where 23.6% of the metro area’s population is over 60 (see the full list in the table below). The old steel capital is followed by such former robust manufacturing hubs as Buffalo (No. 3 on our list), Cleveland (fifth), and Detroit (ninth).

    How did these places get so old? The biggest factor: migration deficits. More Americans have been leaving these cities than moving there, and people who move tend to be younger. Meanwhile these graying cities attract relatively few immigrants from abroad. Pittsburgh, for example, ranks 34th among the 51 biggest metro areas in net domestic migration, losing some 2% of its population to other places over the past decade. It also stands 50th in foreign immigration over the same period. Buffalo has fared even worse: it’s 40th in domestic migration and 49th in new foreign-born residents.

    Another factor is low birth rates. An aging population, not surprisingly, does not produce many children. In 2000 only three U.S. metro areas had more elderly than children under the age of 15 (Pittsburgh, Miami and Tampa-St. Petersburg, Fla.). The 2010 Census showed we now have 10, with the addition of Buffalo, Boston, Cleveland, Hartford, Providence, Rochester and San Francisco to the first three. Thus the elderly population is overtaking the younger population not only in Florida’s retirement havens, but in a number of Rust Belt and Northeastern cities — and the West Coast may not be far behind.

    The graying trend, like aging itself, is pervasive. The number of children relative to elderly declined over the past decade in every one of the 51 largest major metropolitan areas.

    But not all of America’s most rapidly aging cities are in Florida and the Rust Belt. Even the New York metro area, usually associated with the “young and restless,” is also getting senescent, with an elderly population nearly equal to that of the young. It ranks 15th on our list of the grayest cities. This is surprising, since like more-old-than-young San Francisco (17th place), immigration from abroad has been strong.

    Other metropolitan areas widely celebrated as magnets for the young and hip are also aging rapidly. For example, while Portland remains younger than average, it rose from 36th oldest in 2000 to 29th oldest in 2010. Even Seattle got older, rising from 39th place in 2000 to 34th in 2010.

    This pattern is surprisingly prevalent even in the urban cores that are at the heart of these regions. In New York County, better known as Manhattan, roughly 19% of the population is over 60, well above the national average. In San Francisco the percentage of elderly is a tad higher at 19.2%. These choice places are expensive to move into, so getting there some decades ago is a big plus. As the entrenched populations age, these places may become far more geriatric than commonly assumed.

    But it’s not just the core cities that are getting older. In fact, in terms of rate of aging, some of the places going gray the fastest include suburbs of these cities that used to be the primary destinations of young families. Among the most rapidly aging places within the country’s largest metro areas are New York City’s bedroom communities of Nassau County, N.Y., and Bergen County, N.J.; Middlesex outside of Boston; and suburban St. Louis County.

    What does this mean to employers, investors, and, most importantly, residents of these regions? In some cases there are positives in the near-term economic picture. Some aging metro areas like Pittsburgh and Boston have done relatively well over the course of the recent long recession. This may be in part because older homeowners were less impacted by the housing bubble than younger ones, who tend to cluster in Sun Belt cities such as Atlanta.

    In some cases, inertia from a large employed base of older skilled workers may have also insulated local economies. Older workers have tended to weather the recession better than younger ones and a surprising number have managed to stay in the workforce. Indeed, senior employment has jumped 27% in the last five years while that of younger and middle aged workers has fallen notably.

    Seniors may also become something of an entrepreneurial engine for local economies, notes one recent Kauffman Foundation Study. In fact, the share of new entrepreneurs who are 55 to 64 year old has risen from 14.3% in 1996 to 20.9% in 2011.

    Yet there are also long-term problems implicit in too rapid graying, chiefly in the prospect of a deficient future workforce. In Massachusetts, known among some demographers as “the granny state,” the population under 18 fell 5% over the past decade and there was a slightly larger drop in the 18 to 44 demographic. As the population of those 45 and older grows, there may not be sufficient new income to cover the rising costs for elder care.

    More troublesome may be the labor force impacts of rapid aging, as there is a shortage of some skilled workers, both in the Rust Belt and tech centers, particularly younger ones. This reality is already causing problems in Europe, particularly in the economically devastated south, and also more prosperous East Asia, particularly Japan.

    An older population, and fewer families, tend to depress economic growth, consumer demand and entrepreneurial creativity. Japan today is not only much older, but also more financially hard-pressed than in its ’80s heyday, heavily in debt and losing its once dominant position in several critical industries.

    It is conceivable that some now rapidly aging metropolitan areas will be able to shrug off these effects, by attracting immigrants and newcomers from other parts of the country. But to do so, they will have to become more attractive to families, by creating more affordable, lower density housing and growing the local economy.

    This, however, may prove difficult to achieve, especially in cities that seeking to severely limit or even outlaw “family friendly” detached housing (such as in California and the Northwest). Economic growth could also be hampered as the electorate ages and political pressure builds to increase support for the elderly (a dynamic already evident in Europe and Japan), even at the expense of future generations.

    Major Metropolitan Areas Ranked by 60 & Over Share of Population
    Metropolitan Area 2000 Rank 2010 Change
    1 Pittsburgh, PA 22.1% 2 23.6% 6.8%
    2 Tampa-St. Petersburg, FL 23.8% 1 23.5% -0.9%
    3 Buffalo, NY 19.9% 4 21.6% 8.6%
    4 Miami, FL 20.6% 3 21.3% 3.5%
    5 Cleveland, OH 18.6% 5 21.2% 14.0%
    6 Hartford, CT 17.9% 7 20.0% 11.7%
    7 Providence, RI-MA 18.1% 6 19.9% 9.8%
    8 Rochester, NY 16.5% 12 19.8% 20.0%
    9 Detroit,  MI 15.6% 18 18.9% 21.5%
    10 St. Louis,, MO-IL 16.8% 9 18.9% 12.2%
    11 Birmingham, AL 16.8% 10 18.8% 11.8%
    12 Philadelphia, PA-NJ-DE-MD 17.2% 8 18.7% 8.7%
    13 Louisville, KY-IN 16.2% 14 18.7% 14.9%
    14 Boston, MA-NH 16.3% 13 18.6% 13.9%
    15 New York, NY-NJ-PA 16.6% 11 18.4% 11.1%
    16 Baltimore, MD 15.9% 17 18.2% 14.9%
    17 San Francisco-Oakland, CA 15.4% 20 18.1% 17.6%
    18 New Orleans. LA 15.0% 25 18.0% 19.4%
    19 Jacksonville, FL 14.7% 28 17.9% 21.6%
    20 Richmond, VA 15.1% 23 17.9% 18.2%
    21 Milwaukee,WI 16.1% 16 17.8% 10.4%
    22 Cincinnati, OH-KY-IN 15.4% 21 17.7% 15.0%
    23 Orlando, FL 16.2% 15 17.6% 8.8%
    24 Phoenix, AZ 15.5% 19 17.5% 12.6%
    25 Sacramento, CA 14.9% 27 17.3% 16.2%
    26 Kansas City, MO-KS 15.2% 22 17.2% 13.8%
    27 Oklahoma City, OK 15.1% 24 17.0% 12.7%
    28 Las Vegas, NV 14.9% 26 16.9% 13.1%
    29 Portland, OR-WA 13.6% 36 16.8% 22.9%
    30 Virginia Beach-Norfolk, VA-NC 13.8% 34 16.7% 21.2%
    31 Chicago, IL-IN-WI 14.4% 29 16.4% 14.0%
    32 San Diego, CA 14.3% 30 16.1% 12.7%
    33 San Antonio, TX 14.3% 31 16.0% 12.4%
    34 Seattle, WA 13.4% 39 15.9% 18.6%
    35 Nashville, TN 13.9% 33 15.9% 14.4%
    36 Indianapolis. IN 14.1% 32 15.8% 12.0%
    37 Memphis, TN-MS-AR 13.5% 38 15.8% 17.4%
    38 Los Angeles, CA 13.0% 41 15.7% 21.0%
    39 Columbus, OH 13.5% 37 15.7% 16.3%
    40 San Jose, CA 12.9% 42 15.7% 21.6%
    41 Minneapolis-St. Paul, MN-WI 12.8% 43 15.6% 22.1%
    42 Denver, CO 12.1% 45 15.2% 25.6%
    43 Washington, DC-VA-MD-WV 12.4% 44 15.0% 21.2%
    44 Charlotte, NC-SC 13.2% 40 15.0% 13.6%
    45 Riverside-San Bernardino, CA 13.7% 35 15.0% 9.5%
    46 Atlanta, GA 10.8% 48 13.8% 28.2%
    47 Raleigh, NC 11.0% 46 13.6% 23.7%
    48 Dallas-Fort Worth, TX 10.8% 47 13.3% 23.2%
    49 Houston, TX 10.8% 49 13.2% 23.0%
    50 Salt Lake City, UT 10.7% 50 12.7% 19.3%
    51 Austin, TX 9.8% 51 12.4% 26.4%
    Data from US Census


    Joel Kotkin is executive editor of NewGeography.com and is a distinguished presidential fellow in urban futures at Chapman University, and contributing editor to the City Journal in New York. He is author of The City: A Global History. His newest book is The Next Hundred Million: America in 2050, released in February, 2010.

    This piece originally appeared at Forbes.com.

    “Senior Citizens Crossing” photo by Flickr user auntjojo.

  • Hong Kong’s Decentralizing Commuting Patterns

    Hong Kong is a city of superlatives. Hong Kong has at least twice the population density of any other urban area in the more developed world, at 67,000 per square mile or 25,900 per square kilometer. The Hong Kong skyline is rated the world’s best by both emporis.com (a building database) and diserio.com, which use substantially different criteria. This is an honor that could not have been bestowed on any city outside New York for most of the 20th century.

    No world city is better suited to mass transit than Hong Kong. Hong Kong may also be the best served — it has the transit usage levels to prove it. According to Hong Kong 2011 census data, 87 percent of combined transit and car work trip travel in Hong Kong is by transit, though this is a small decline from the 90 percent of 2001. This is the highest transit market share of any high-income world metropolitan area.

    Change in Work Access Patterns

    Between 2001 and 2011 Hong Kong’s employment increased nine percent. Most of these new workers (38 percent), however, did not travel to fixed work locations in Hong Kong. Reflecting continuing decentralization and the impact of information technology, 62 percent of the new workers (1) worked at home, (2) had no fixed place of work or (3) worked outside Hong Kong, especially in Macau and the province of Guangdong, principally in Shenzhen (Figure 1). The 2001 and 2011 census data is summarized in the table below.

    HONG KONG WORK ACCESS: METHODS: 2001 AND 2011
    2001 2011 Change % Change Share: 2001 Share: 2011
    MASS TRANSIT   2,091,552  2,226,818    135,266 6.5% 70.4% 70.1%
    Bus & Coach  1,400,770  1,188,897  (211,873) -15.1% 47.2% 37.4%
       Large Bus   1,118,388     938,467   (179,921) -16.1% 37.7% 29.5%
       Minibus (Public Light)      226,646     217,219      (9,427) -4.2% 7.6% 6.8%
       Residential Coach       55,736       33,211    (22,525) -40.4% 1.9% 1.0%
    Rail     690,782  1,037,921   347,139 50.3% 23.3% 32.7%
       Metro (Original MTR)      495,128     697,475    202,347 40.9% 16.7% 21.9%
       Suburban Rail (Original KCR)      195,654     297,416    101,762 52.0% 6.6% 9.4%
       Light Rail              –         43,030     43,030 NA 0.0% 1.4%
    CAR & TAXI      232,978     333,192    100,214 43.0% 7.8% 10.5%
    WALK      335,859     266,574    (69,285) -20.6% 11.3% 8.4%
    OTHER      123,455       68,509    (54,946) -44.5% 4.2% 2.2%
    TRAVEL TO HK FIXED PLACE OF WORK   2,783,844  2,895,093    111,249 4.0% 93.8% 91.1%
    WORK AT HOME      185,367     283,497     98,130 52.9% 6.2% 8.9%
    FIXED PLACE OF WORK   2,969,211  3,178,590    209,379 7.1% 100.0% 100.0%
    NO FIXED WORK PLACE      188,998     247,916     58,918 31.2%
    WORK IN HONG KONG   3,158,209  3,426,506    268,297 8.5%
    WORK OUTSIDE HONG KONG       94,497     120,858     26,361 27.9%
    WORKING RESIDENTS   3,252,706  3,547,364    294,658 9.1%
    EXHIBIT
    Travel to Work in Hong Kong   2,783,844  2,895,093    111,249 37.8%
    Home, No Fixed Place, Outside HK      468,862     652,271    183,409 62.2%
    TOTAL   3,252,706  3,547,364    294,658 100.0%
    Source: Hong Kong Census, 2001 & 2011
    No Fixed Place of Work: Access method not determined


    The Shift from Bus to Rail: Transit’s overall share of work trip access was 70.1 percent in 2011 (all methods). This is a slight decline from the 70.4 percent in 2001. Over the last decade, Hong Kong has substantially expanded its urban rail system, including major improvements such as a new tunnel under Hong Kong Harbor and the new West rail line (former Kowloon Canton Railway) to Yuen Long and Tuen Mun. I wrote a supporting commentary in the Apple Daily (Hong Kong’s largest newspaper) supporting the rail expansion program in 2000.

    The results are apparent in the ridership data. The rail work access market share rose nearly 10 points to 32.7 percent. At the same time, the bus market share dropped nearly 10 points to 37.4 percent. Overall, in a modestly growing labor market, transit added 135,000 new one away work trips.

    Car Commuting Up: Cars and taxis experienced a much larger percentage gain, largely as a result of starting from a much smaller base. The car and taxi work trip access market share rose from 7.8 percent to 10.5 percent. Overall, approximately 100,000 more people commuted one way by car to work in 2011 than in 2001. The median incomes of car and taxi commuters are the highest, at more than twice that of rail and bus users.

    More Working at Home:Hong Kong’s working at home grew the most of any category, rising 53 percent from 185,000 to 283,000 daily. As a result, working at home now accounts for 8.9 percent of work access, compared to 6.2 percent in 2001. Hong Kong’s reliance on working at home was greater than that of the United States in the early 2000s. Over the last decade Hong Kong’s 53 percent increase in working at home was well above the 41 percent increase in the United States. In Hong Kong, 33 percent of new employment was home-based work between 2001 and 2011. This is greater than in the US, where 20 percent of new jobs involved working at home as the usual mode of access between 2000 and 2010.

    The Decline of Walking: Given Hong Kong’s intensely high densities, it may come as a surprise that there was a huge loss in walking to work. Nearly 70,000 fewer people walked to work in 2011 than in 2001, as the walking market share dropped 21 percent. In 2011, commuters who walked (and those who used light rail) had the lowest incomes. In 2001, more people walked to work than either travelled by car or work at home. By 2011, fewer people walked to work than travel by car or work at home.

    There was also a nearly 55,000 loss in work access by other modes (such as ferries, motorized 2-wheelers and cycling).

    Finally, Hong Kong separately categorizes workers without a fixed place of employment and does not obtain information on how they access work. This category experienced an increase of nearly 60,000 from 2001 to 2011.

    The Decentralization of Hong Kong’s Labor Markets

    The distribution of employment changed little over the 10 years, with Hong Kong Island and Kowloon sectors retaining two-thirds of the jobs. These two areas also have more than one-half of the population.  Even so, the Hong Kong labor market followed the global pattern of decentralization.   More people traveled outside their home areas in 2011 than in 2001. Among resident workers living on Hong Kong Island and in Kowloon, there was an 18 percent increase in working outside these home sectors. Further, the increase in people with no fixed place of work reflects greater mobility and labor force decentralization.

    Jobs-Housing Balance? Not Much

    The high density of jobs and population, its short trip distances, its extraordinary transit system and its high transit market share would seem to make Hong Kong a poster city for the jobs – housing balance ("self containment") that urban planners seem so intent to seek. The data indicates no such thing.

    Hong Kong’s 18 districts illustrate a comparatively low rate of self containment. Only 21.4 percent of working residents are employed in their home districts, including those who work at home. This is only slightly higher than in highly decentralized suburban Los Angeles County, where 18.5 percent of resident workers are employed in their home municipalities. With far lower population and employment densities and a 50 percent smaller geographical size, the suburban municipalities of Los Angeles County (city of Los Angeles excluded, see Note below) nearly equal the local-area jobs-housing balance of the Hong Kong districts (Figure 4).

    This tendency to work away from home districts contributes to Hong Kong’s extraordinarily long average commute times. In 2002, the average work trip was 46 minutes, longer than any high-income world metropolitan area except Tokyo. By comparison, Dallas-Fort Worth, with a similar population and a population density less than 1/20th that of Hong Kong, has an average work trip travel time of 26 minutes. Los Angeles, with its world-class traffic congestion has a work trip travel time of 27 minutes, principally because its automobile dominant commuting is much faster than Hong Kong’s world class, rail based transit system.

    These data, both in Hong Kong and Los Angeles, show that, within a metropolitan area (labor market),  people will tend to seek the employment that best meets their needs, just as employers will hire the people best suited to theirs. Within a labor market, this can be anywhere, subject to the preferences of people and employers, not of planners. This is the basis of former World Bank principal planner Alain Bertaud’s caution that a city’s economic efficiency requires … avoiding any spatial fragmentation of labor markets.

    The Mistake of Trying to Emulate the Unique

    It is a mistake to think that urban planning can emulate Hong Kong. Besides its superlatives, Hong Kong did not become so dense as a result of urban planning or the unfettered preferences of people (market forces). Hong Kong’s uniqueness is the result of unique geo-political influences. This history forced an unprecedented accommodation of millions in a small space, especially in the third quarter of the 20th century when it stood as a capitalist island in the midst of a Communist sea.

    Hong Kong is unique and will be for a long time.

    Note: The city Los Angeles has a very high jobs-housing balance (61 percent). However, this is largely due to its huge geographic size (more than 40 times the average suburban jurisdiction).

    Wendell Cox is a Visiting Professor, Conservatoire National des Arts et Metiers, Paris and the author of “War on the Dream: How Anti-Sprawl Policy Threatens the Quality of Life.”

    —-

    Photo: West Rail Line, Tin Shui Wai Station bus interchange, Yuen Long (by author)