Category: Urban Issues

  • The Cities Creating the Most Tech Jobs in 2017

    A growing tech industry is often considered the ultimate sign of a healthy local economy. By that measure, the Bay Area still stands at the top of the heap in the United States, but our survey of the metropolitan areas with the strongest tech job growth turns up some surprising places not usually thought of as tech meccas.

    Charlotte, N.C., is more often associated with banks than bots. Yet from 2006 to 2016, tech businesses in the Queen City expanded their job count by 62%, with 18% growth from 2014-16, the fastest clip in the nation. Meanwhile, over the past decade, the metro area logged a 23% increase in the number of workers in STEM occupations (science, technology, engineering and mathematics-related jobs). This rapid job growth and strong recent momentum, driven partly by health care and environmental technology, ranks it second on our list. In the past 10 years, the region has added 7,400 jobs in two key high-tech business services sectors, custom programming and systems design services, along with nearly 700% growth in software publishing employment. To be sure, the share of tech jobs in Charlotte’s economy remains one third that of Silicon Valley, and the tech and STEM workforces are far smaller, but quality of life, lower housing prices, as well as decent plane connections, seem likely to help it to continue to attract tech workers.

    To determine the metro areas that are generating the most tech jobs, Mark Schill of Praxis Strategy Group analyzed employment data from the nation’s 53 largest metropolitan statistical areas from 2006 to 2016, with extra weighting for growth from 2014-16 to give credit for current momentum. Half our ranking is based on employment growth at companies in high-technology industries, such as software and engineering services. (This includes all workers at these companies, some of whom, like janitors or receptionists, do not perform tech functions). Half is based on changes in the number of workers classified as having science, technology, engineering and mathematics-related jobs (aka STEM). This captures the many tech workers in industries not primarily associated with technology, such as finance and business services. Data is sourced from EMSI.

    Another surprising up and comer is Indianapolis in fifth place. The share of STEM jobs in the local economy, 5%, is close to the national average but STEM employment is up 18% since 2006. Tech employment has grown rapidly, with the job count at tech companies up an impressive 68% since 2006, led by 1,700% growth at Internet-based businesses and 8,100 new jobs in custom programming and systems design.

    California-based companies are in the forefront such as Salesforce, which is adding 800 employees to its already 1,600-person office in Indianapolis. Similarly No. 7 Nashville is poaching jobs from the Bay Area with firms such as Lyft but also developing its own roster of defense and health-related tech firms. Since 2006, Nashville added jobs in nearly every tech industry we track, led by 3,700 new jobs in systems design, 1,800 in data processing, and 1,100 in engineering services.

    The Bay Area continues to excel in large part as a product of the rapid growth over the past decade of social media and business applications for technology. The San Francisco metro area, which includes tech-heavy suburban San Mateo County, ranks first. The City by the Bay and its environs, a hub for technical service firms like Uber and Salesforce.com, has experienced remarkable 90% growth in tech employment and a 36.5% expansion in STEM jobs from 2006 to 2016. Silicon Valley, with a concentration of tech industry workers 75% higher than upstart San Francisco, has also achieved rapid job creation, with tech industry employment up 80% and the number STEM workers increasing 32%, ranking it fourth. STEM employment per capita is roughly twice that of San Francisco.

    Other familiar faces make the top 10: No. 3 Austin, No. 6 Raleigh-Durham, No. 8 Seattle and No. 10 Denver. These lower-cost alternatives to the Bay Area have all been attracting people and companies from pricier California. Yet these areas too face rising housing prices, which is a challenge particularly for workers entering their early 30s and looking to settle down.

    Easily the biggest surprise on the list is Detroit, which improved its position to ninth, a remarkable 30-place jump from the last edition of this list in 2015. It generated 26% growth in high-tech jobs and boosted its STEM employment by 8.4%. Despite the decline of the central city, the Detroit metro area has never faded as a technical center; due largely to the auto industry its per capita STEM employment has long been above the national average. This is reflected in a post-recession boom in engineering services in the region – some 14,000 new jobs since 2006 – leaving Detroit with a concentration of engineering services more than three times the national average. Its percentage of STEM workers is 50% above the U.S. norm, roughly equivalent to that of Raleigh-Durham, Boston and Denver.

    More help could be on the way from a reviving urban core, says Chicago-based analyst Pete Saunders, himself a Detroit native. There is some evidence that the city itself is beginning to attract skilled and better educated workers. Microsoft has set up an outpost downtown for 165 employees and there is a small but evolving start-up scene.

    Winners, Losers and Stagnaters

    Detroit’s rise since our last study tells us something about the importance of industry to tech and the allure of lower housing prices. Another clear Rust Belt winner in this year’s survey is Pittsburgh. Still an energy and industrial center, and with low housing prices, the former steel capital jumped 10 places on our list to 21st. Pittsburgh has gained tech momentum as a center for autonomous vehicles, with Uber and Ford setting up operations there to tap talent at Carnegie Mellon. Like other upstart regions, Pittsburgh has seen a rise in high-tech business services, with 2,400 new jobs in engineering and 3,900 in systems design.

    Rochester, N.Y., is up 13 places to 36th, and Washington, D.C., gained 12 spots to 38th, while No. 41 Milwaukee and No. 25 New York both rose 10 places. New York’s improvement is tied to social media and a surge in biotech research and development. The region saw nearly 400% growth in employment at internet and web-based firms, but was not as competitive in many other tech sectors in our analysis. This plays to the city’s communications industry strengths, as well as Wall Street-connected fintech growth. While the metro area has by far the nation’s largest number of STEM workers at 450,500, in part by virtue of its massive population, New York is certainly not likely to emerge as a Silicon Valley competitor –the number of STEM jobs per capita in the New York metro area remains below the national average.

    Many traditional tech powerhouses have just held onto their positions, with little movement up or down. No. 16 Portland and No. 18 Boston held their own. So too, despite the excitement around Snapchat’s IPO, did Los Angeles at 37th. Its per capita STEM employment has now disturbingly dropped below the national average.

    And then there are the big losers, which include some traditional tech powerhouses. Despite its powerful medical and chip technology industry, San Diego dropped sixteen places to 39th. Houston dropped the most, some 39 places to 43rd, due to the energy bust. Yet it’s too early to count either of these places out in the long run since they both retain larger than average shares of STEM workers. A Trump defense boom could help jumpstart San Diego and Houston’s energy industry could be a prime beneficiary of the President’s “America first” energy policy.

    Future Prospects

    In the immediate future, no place will challenge the Bay Area as the mecca of technology and STEM employment. Other metro areas may now be growing as fast — and Charlotte even faster — but the Bay Area juggernaut has a big lead, even if it may finally be slowing down. James Doti, who directs the regional forecast at Chapman University, estimates that the job growth rate in the Valley’s information technology sector dropped to 2% in 2015 from a torrid 9% the previous year.

    Doti and other observers trace this in large part to the area’s soaring housing costs, now the highest in the nation. This particularly impacts millennials, many of whom are now entering their 30s, the prime age for family formation and home buying. If millennials continue their current rate of savings, notes one study, it would take them 28 years to save up enough to afford a median-priced house in the San Francisco area, but only five years in Charlotte, or three years in Atlanta.

    In 2015 7,500 more Americans left the Valley than arrived, the first time there’s been a net loss since 2011, according to the Silicon Valley Competitiveness and Innovation Project.

    If these trends represent the future, there could be an increasing exodus of jobs and talent from the Valley. In many of the upstart regions, there likely will be opportunities for economic migrants in the robustly growing (if less “sexy”) tech services sector, which includes engineering, systems design and custom programming.

    The big question is who will be the biggest beneficiaries, already established tech hubs like Seattle or Denver, or a long list of rising wannabes?

    In a word, as Sherlock Holmes would say, “the game’s afoot.” The future of regional economies around the nation could be at stake.

    2017 Metropolitan Tech-STEM Growth Index
    Rank Region (MSA) Score 2006-2016 Tech Industry Growth 2014-2016 Tech Industry Growth 2016 Tech Industry LQ 2006-2016 STEM Occuptn Growth 2014-2016 STEM Occuptn Growth 2016 STEM Occuptn LQ
    1 San Francisco 98.7 90.0% 17.5% 2.87 36.5% 9.9% 1.79
    2 Charlotte, NC 88.7 62.1% 18.0% 0.91 28.5% 10.4% 1.01
    3 Austin 86.2 76.6% 14.0% 1.93 35.4% 7.4% 1.76
    4 San Jose 85.9 79.6% 12.5% 5.12 32.2% 8.6% 3.43
    5 Indianapolis 72.4 68.1% 16.8% 0.96 17.8% 5.3% 0.98
    6 Raleigh, NC 70.3 46.9% 8.2% 2.07 31.9% 7.0% 1.56
    7 Nashville 65.7 75.6% 12.4% 0.71 13.7% 4.5% 0.80
    8 Seattle 62.7 47.7% 6.9% 2.32 28.5% 4.7% 1.89
    9 Detroit 61.6 26.1% 14.8% 2.12 9.6% 8.4% 1.50
    10 Denver 60.8 40.3% 6.9% 1.72 25.6% 5.5% 1.48
    11 Salt Lake City, UT 60.2 38.9% 6.5% 1.41 24.5% 6.0% 1.19
    12 Dallas 59.7 43.2% 9.3% 1.13 20.5% 5.0% 1.17
    13 Phoenix 59.5 48.5% 12.2% 0.93 10.1% 5.8% 1.16
    14 Grand Rapids 58.8 34.0% 8.9% 0.46 13.4% 7.9% 0.88
    15 Kansas City, MO 57.1 37.5% 9.8% 1.48 15.7% 5.5% 1.16
    16 Portland, OR 53.4 30.4% 7.4% 1.07 16.2% 5.5% 1.36
    17 Tampa 52.4 20.9% 10.6% 0.94 3.8% 8.3% 0.90
    18 Boston, MA 50.5 38.4% 6.6% 2.21 15.3% 3.8% 1.55
    19 Louisville, KY 50.4 27.6% 8.3% 0.57 15.0% 4.3% 0.69
    20 Atlanta 47.6 23.7% 7.7% 1.23 11.8% 4.6% 1.13
    21 Pittsburgh, PA 46.9 32.5% 7.8% 1.15 12.8% 2.8% 1.06
    22 San Antonio 46.1 28.2% 1.5% 0.82 22.2% 3.4% 0.83
    23 Orlando 45.9 8.5% 7.4% 0.89 8.4% 6.8% 0.78
    24 Cincinnati, OH 43.5 21.9% 6.6% 0.81 9.3% 4.1% 1.04
    25 New York 43.3 30.4% 7.7% 0.98 5.9% 3.4% 0.89
    26 Miami 41.9 8.9% 8.4% 0.62 2.3% 6.0% 0.63
    27 Sacramento 40.9 41.0% 7.5% 0.90 3.8% 1.7% 1.26
    28 Baltimore 39.7 25.1% 4.2% 1.52 12.5% 2.1% 1.38
    29 Minneapolis 39.4 18.2% 4.7% 1.04 9.3% 3.4% 1.29
    30 Richmond, VA 38.0 20.3% 6.2% 0.78 4.8% 3.1% 0.98
    31 Jacksonville, FL 37.9 23.1% 3.1% 0.80 7.3% 3.5% 0.76
    32 Chicago, IL 37.5 22.6% 6.8% 0.92 3.7% 2.5% 0.93
    33 Las Vegas 37.2 6.6% 5.6% 0.53 1.5% 5.6% 0.47
    34 Hartford 36.7 34.7% 4.3% 1.00 3.2% 2.1% 1.14
    35 Columbus, OH 36.5 9.9% 2.9% 1.05 11.9% 3.1% 1.18
    36 Rochester, NY 35.1 27.1% 5.1% 0.76 1.1% 2.5% 1.10
    37 Los Angeles 34.0 16.4% 6.6% 0.84 0.2% 2.7% 0.93
    38 Washington, DC 32.4 4.8% 3.8% 2.54 6.7% 2.7% 1.99
    39 San Diego 31.2 19.1% -2.2% 1.62 10.0% 2.6% 1.38
    40 Cleveland 29.0 14.1% 3.3% 0.73 1.4% 1.8% 0.97
    41 Milwaukee 28.7 2.9% 4.6% 0.77 1.0% 2.5% 1.02
    42 Oklahoma City, OK 28.6 7.1% 3.9% 0.52 8.4% 0.0% 0.96
    43 Houston 28.4 18.5% -2.3% 1.09 20.0% -1.8% 1.22
    44 St. Louis, MO 27.2 2.8% 4.5% 0.86 0.0% 2.0% 0.96
    45 Buffalo 27.1 22.9% 1.0% 0.77 2.4% 0.7% 0.79
    46 Memphis, TN 26.3 30.8% -5.8% 0.39 3.6% 2.6% 0.59
    47 Providence 25.0 8.0% 2.5% 0.72 0.4% 1.2% 0.88
    48 Philadelphia, PA 22.2 2.5% 1.7% 1.09 -1.8% 1.5% 1.06
    49 Virginia Beach 18.8 -3.0% -1.7% 1.03 2.2% 1.0% 1.09
    50 Birmingham 18.4 1.4% 2.0% 0.62 -4.2% 0.4% 0.81
    51 Riverside 16.5 -15.4% 0.8% 0.30 -4.6% 2.2% 0.48
    52 New Orleans 16.0 21.6% -1.9% 0.62 -0.8% -2.3% 0.67
    53 Tucson, AZ 15.9 6.0% -1.9% 86.8% -2.5% 0.0 1.1


    To determine the metro areas that are generating the most tech jobs, Mark Schill of Praxis Strategy Group analyzed employment data from the nation’s 53 largest metropolitan statistical areas from 2006 to 2016, with extra weighting for growth from 2014-16 to give credit for current momentum. Half our ranking is based on employment growth at companies in high-technology industries, such as software and engineering services. (This includes all workers at these companies, some of whom, like janitors or receptionists, do not perform tech functions). Half is based on changes in the number of workers classified as having science, technology, engineering and mathematics-related jobs (aka STEM). This captures the many tech workers in industries not primarily associated with technology, such as finance and business services. Data is sourced from EMSI.

    This piece originally appeared at Forbes.

    Joel Kotkin is executive editor of NewGeography.com. He is the Roger Hobbs Distinguished Fellow in Urban Studies at Chapman University and executive director of the Houston-based Center for Opportunity Urbanism. His newest book, The Human City: Urbanism for the rest of us, was published in April by Agate. He is also author of The New Class ConflictThe City: A Global History, and The Next Hundred Million: America in 2050. He lives in Orange County, CA.

    Mark Schill is a community and corporate strategy consultant with Praxis Strategy Group and Managing Editor of New Geography.

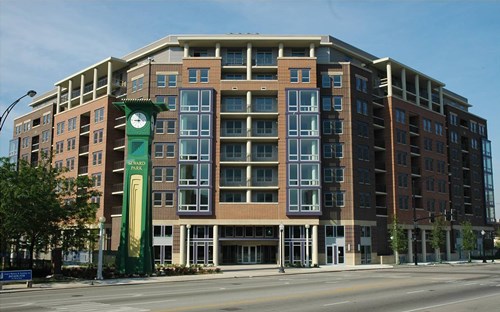
    Charlotte photo by Daritto7117 (Own work) [Public domain], via Wikimedia Commons

  • Taxpayers Need Protection from Dallas-Houston High Speed Rail Bailout? New Report

    The proposed privately financed high-speed rail line from Houston to Dallas is projected to have a revenue shortfall of $21.5 billion in its first 40 years of operation. This is the conclusion of a Reason Foundation report by Baruch Feigenbaum, the Foundation’s assistant director of transportation policy (Texas High Speed Rail: Caution Ahead). This and other concerns lead the Reason Foundation to indicate: “… we cannot support Texas Central’s proposed Dallas to Houston project.” This is an important development, since the Reason Foundation has been a strong supporter of privately financed transport infrastructure for decades.

    “Optimism Bias and Demand Exaggeration”

    Feigenbaum explains: “Our analysis indicates that Texas Central is exhibiting the same ‘optimism bias; and ‘demand exaggeration’ that have plagued many public infrastructure projects —and especially high-speed rail projects—for decades. Simply put, Texas Central has exaggerated its ridership projections while underestimating costs.” Feigenbaum adds: “…private sector involvement is not a panacea. A wildly unsuccessful project is not going to become feasible with private financing.”

    To any who follow infrastructure finance, these are familiar terms. The sorry record of major infrastructure forecasts has been documented by Oxford University professor Bent Flyvbjerg, along with Nils Bruzelius (a Swedish transport consultant) and Werner Rottenberg (University of Karlsruhe and former president of the prestigious World Conference on Transport Research). They reviewed 80 years of infrastructure projects and found initial cost estimates to routinely be low and demand (ridership) to have been routinely over-estimated (Megaprojects and Risk: An Anatomy of Ambition). They found passenger rail project cost overruns to be among the worst, averaging 45 percent. They also found ridership projections to be two-thirds too high in two-thirds of cases.

    Reason Foundation and State DOT Estimates

    The Reason Foundation report suggests that the Texas project might perform even more poorly. Feigenbaum estimates that the Dallas to Houston line would carry 1.4 million passengers by 2035. He also cites a Texas Department of Transportation analysis estimating annual riders at between 0.7 and 2.7 million trips, by 2035. The Texas Central estimates a considerably higher five million riders by 2025, 10 years earlier.

    But the difficulties do not stop there. The costs of construction projected by the Texas Central Railway, at a maximum of $12 billion, may be significantly underestimated. Feigenbaum conservatively estimates costs that are nearly 50 percent higher ($17.8 billion) and suggest that the cost could exceed $20 billion. This is similar to a State Department of Transportation estimate of $18.7 billion, according to the report.

    Either of these eventualities, both of which are fairly routine for such projects, would mean that the Texas Central Railway might not have enough money to operate the service, or even to finish construction, unless bailed out. Of course, it is hard to find investors for failed projects, and there would be strong political pressure for government grants and subsidies.

    The California Boondoggle

    California’s high speed rail project, well into the planning stage and about to lay some track, has already exceeded the Oxford research cost overruns with a vengeance. By 2012, construction costs had risen more than 60 percent compared to those publicized to obtain voter approval of bonds for the project in 2008. Worse, that’s after officials scaled back the system from high speed rail to a blend between conventional (commuter rail) and high speed rail.

    As if that were not enough, the first short segment, already under construction, according to a federal report   could have a cost overrun of up to $3.5 billion. The segment is approximately two-thirds the Dallas to Houston route length and is similarly flat, in the largely agricultural San Joaquin Valley. The Wall Street Journal referred specifically to the California high speed rail project in a recent editorial characterizing Sacramento as “America’s western swamp.”

    The International Experience

    Out of all of the high speed rail lines built in the world, only  two have avoided commercial losses (“broken even”) until recently (Tokyo to Osaka and Paris to Lyon). Both had very low construction costs, which made it possible to repay , unlike the highly escalated costs that have developed in subsequent projects. These have depended on taxpayer subsidies for their survival.

    More recently, the Shanghai to Beijing high speed line became profitable, though its superlatives are well beyond replication by any other project (at least of any planet discovered so far). The line is slightly shorter than the distance between New York and Atlanta, but directly serves a market larger than the population of the European Union (more than 520 million residents) and 60 percent more than the United States. The stations on the exclusively high speed rail line itself serve municipalities with more than 160 million people, more people than live in Japan and 2.5 times as many as residents as in France. Another 360 million residents are served by trains that directly access the Shanghai to Beijing line from outside the corridor for part of their journey.

    Whence the Bailout?

    Feigenbaum suggests the likely source of a bailout for the Dallas to Houston high speed rail line: “While Texas Central may not be intending to take any public funding, we believe that if construction starts, the project will inevitably have to be bailed out by the taxpayers of Texas, which is unacceptable” (our emphasis).

    He also notes that the Texas Central Railway plans to seek Railroad Rehabilitation and Improvement Financing (RRIF) program loan from the US Department of Transportation (USDOT). These below market rate loans are guaranteed by federal taxpayers. Of course, taxpayers already know how this works. Just a few years ago, Solyndra defaulted on a $0.5 billion federal loan, leaving taxpayers to “holding the bag.”

    A genuine privately funded project would raise sufficient funds from private investors and from non-subsidized commercial financing sources. It would also attract ridership large enough to produce sufficient to pay the loans and repay the investors. The Reason Foundation and the Texas Department of Transportation findings suggest otherwise

    All of this is disappointing to Feigenbaum, and also to me. After years of warning of taxpayer risks from such projects (Note ), I had hoped this one would be a genuinely commercial project, as this article from more than four years ago indicates (see: “Texas High Speed Rail: On the Right Track). It looks like it’s too good to be true.

    Making it Work?

    However, there may be a way to deliver the Texas Central project, while removing all potential taxpayer risk. According to the Dallas Business Journal Texas Central officials indicated that the Central Japan Railway would be the “primary investor”. There is also a report that Japan’s Government Pension Investment Fund may invest in US infrastructure, including the Texas high speed rail project. These organizations are more than financially capable of ensuring that there is no taxpayer risk.

    The Japanese know high speed rail. They are likely to invest only if they are confident they can recover their money, with a commercial profit. Moreover, any such investment needs to include financial guarantees that ensure there is no potential for either US or Texas taxpayers to be called upon for subsidies to cover cost overruns, operations or anything else. Any other approach could be foolhardy.

    Note: These publications include authoring or co-authoring a number of taxpayer risk reports on proposed high-speed rail lines, such as on Florida high-speed rail proposals between the 1990s and 2010s, the Xpress West Victorville to Las Vegas high-speed rail line, the first and second diligence reports on the California high-speed rail line, and a greenhouse gas emissions analysis of the California high-speed rail line. Sponsors included the Reason Foundation, the Howard Jarvis Taxpayers Association, Citizens Against Government Waste and the James Madison Institute.

    Wendell Cox is principal of Demographia, an international public policy and demographics firm. He is a Senior Fellow of the Center for Opportunity Urbanism (US), Senior Fellow for Housing Affordability and Municipal Policy for the Frontier Centre for Public Policy (Canada), and a member of the Board of Advisors of the Center for Demographics and Policy at Chapman University (California). He is co-author of the "Demographia International Housing Affordability Survey" and author of "Demographia World Urban Areas" and "War on the Dream: How Anti-Sprawl Policy Threatens the Quality of Life." He was appointed to three terms on the Los Angeles County Transportation Commission, where he served with the leading city and county leadership as the only non-elected member. He served as a visiting professor at the Conservatoire National des Arts et Metiers, a national university in Paris.

    Photograph: Texas flag

  • Canada’s Urban Areas: Descent from Affordability

    Canada is a nation of wide open spaces, yet it has high urban area densities recently driven higher by a redefinition of urban area criteria (Note 1). Canada’s largest urban area (population centre) is Toronto, with a population of 5.4 million continues to be the densest of the 59 with more than 50,000 residents. Toronto has a population of 3,028 per square kilometer (7,843 per square mile), approximately five percent above the European Union average. Montréal (population of 3.5 million) has a density of 2,720 per square kilometer (7,045 per square mile), followed by third ranked Vancouver (2,584/6,693), which has a population of 2.2 million.  The top ten is rounded out by Milton, a fast growing Toronto exurb with a density of 2,520 per square kilometer or 6.527 per square mile, Calgary (2,112/5,470), Regina, the capital of Saskatchewan (2,082/5,391) and Winnipeg, which has seen renewed recent growth (2,070/5,360).

    Four other population centres have densities greater than 1,950 per square kilometer (5,000 per square mile , including  Oshawa and Hamilton, which are adjacent to Toronto, as well as Saskatoon, Saskatchewan and Kanata, an exurb of Ottawa (Figure 2).

    Comparisons to the United States

    The new, higher density figures are not surprising considering the especially compact suburbs in view when landing at Pearson Airport in Toronto, or even in Calgary or Edmonton. A combined Canada-US urban area density list illustrates the higher density of Canadian urban areas relative to those in the United States.  Among the five densest urban areas in Canada and the United States, four are in Canada. Los Angeles, the densest large urban area in the United States for the last three censuses, ranks third behind Toronto and Montréal. Vancouver and Milton rank fourth and fifth, just ahead of 6th ranked San Francisco. Immediately behind San Francisco is virtually all post-World War II suburban San Jose. Delano, California, an exurb of Bakersfield in the San Joaquin Valley has about 55,000 residents and ranks 8th on the combined list.

    Residents of Calgary, Regina and Winnipeg, where densification advocates repeatedly condemn their perceived local urban sprawl (a pejorative term for urban dispersion) will doubtless be surprised to know that their population density exceeds that of New York. Only one more US urban area makes the top 20, Sacramento exurb Davis, at 14th, with a population of 73,000 (Figure 3).

    Where’s Portland?

    To those inclined to venerate Portland’s internationally famous densification policies, this list may be disconcerting. Calgarians who bemoan the inferiority of their city in relation to Portland should be heartened to find out that Calgary’s density is more than 50 percent higher than Portland’s (Calgary’s transit market share is more than double Portland’s).

    Portland is not among the densest 20 urban areas , but ranks 72nd, just behind all-suburban Riverside-San Bernardino and a bit ahead of Halifax. If Portland were in Canada, it would rank 38th in population density out of the largest 59 urban areas.

    And Boston?

    Boston has a reputation as one of the densest cities in the United States. Yet, Boston’s huge urban area  is denser than only three of Canada’s urban areas on the list, Belleville, ON, North Bay, ON and Fredericton, NB. Each is smaller than Boston suburb Somerville, which has about 75,000 residents. Among the urban areas of  Canada and the US Boston is 218th in density. (Note 3).

    Urban Containment Not Density Associated with Unaffordability

    Canada’s urban areas illustrate that density does not have to mean unaffordable housing. There has been some densification since 2000, but Canada’s urban areas were nearly as dense even then. For example, in the last 15 years, the completely developed city of Toronto, with all its new residential towers, has added only 10 percent to its population. Five of Canada’s six major metropolitan areas Toronto, Montréal, Ottawa-Gatineau, Calgary and Edmonton were affordable at the beginning of the new century, hovering around a median multiple 3.0.

    All that has changed, however, with the imposition of urban growth boundaries and equivalent policies. Ailin He and I showed in a Frontier Centre study (Canada’s Middle Income Housing Affordability Crisis) that house prices had “exploded” relative to household incomes between 2000 and 2015. This cannot be attributed to the modestly higher densities. The big change took place in land use policy, with, for example, Toronto and Calgary adopting urban containment policy that has been strongly associated with the destruction of housing affordability. Residents of Vancouver  — an urban area widely praised among planners —  have been paying the price for urban containment for much longer (Figure 4).

    Canada’s experience up to the end of the 20th century proves that dense and affordable urban areas can be achieved. But since that time, as house prices have risen relative to incomes, Canada’s experience shows that all that can be reversed in an environment of binding urban containment policy.

    Note 1: Between 2011 and 2016, Canada’s urban areas increased more than 40 percent in population density, according to Statistics Canada data. This, however, was not a miracle of urban containment policy or smart growth, it was rather an improved method adopted by Statistics Canada for measuring urbanization. Urban areas are the "physical city," which unlike the metropolitan area has only urban land. Canada now calls its urban areas "population centres," having changed to the new label in 2011, when the United Kingdom labeled them "built up urban areas."

    In 2011 and before, the Census had used municipalities as building blocks for urban areas. Often, those municipalities included large swaths of rural land (as did Los Angeles until well into the 1950s). Now, the building blocks for urban areas in Canada are "blocks", the lowest enumeration geography of the Census (the same revision was implemented by the US Census in 2000). Under the old definition, Canada’s urban areas had a density of 1,180 per square kilometer (3,057 per square mile) in 2011. Now it is 1,698 per square kilometer (4,397 per square mile), a 44 percent increase.

    Note 2: The comparisons are between the 2016 Census of Canada data and the 2010 US Census data, since urban area (population centre) data is only developed in the censuses (the next US census will be in 2020). The list is developed from the 59 urban areas in Canada and the 499 in the United States with 50,000-plus residents in the last censuses.

    Note 3:  A recent article found Boston to be almost five times as dense as Houston. However, this was in municipal (inside the city limits) density. City limits are artificial, political constructs that have nothing to with the organic city (the physical city , also called urban area or the economic city, or the metropolitan area , which is the labor market).  The Houston urban area, with its reputation for "sprawl" is actually one-third denser (1150/2979 ) than Boston’s (856 /2,278). At the physical city level, the urban area is the best indication of urban density. Using metropolitan density as an indicator of urban density is nonsensical, since all metropolitan areas include substantial rural territory.

    Wendell Cox is principal of Demographia, an international public policy and demographics firm. He is a Senior Fellow of the Center for Opportunity Urbanism (US), Senior Fellow for Housing Affordability and Municipal Policy for the Frontier Centre for Public Policy (Canada), and a member of the Board of Advisors of the Center for Demographics and Policy at Chapman University (California). He is co-author of the “Demographia International Housing Affordability Survey” and author of “Demographia World Urban Areas” and “War on the Dream: How Anti-Sprawl Policy Threatens the Quality of Life.” He was appointed to three terms on the Los Angeles County Transportation Commission, where he served with the leading city and county leadership as the only non-elected member. He served as a visiting professor at the Conservatoire National des Arts et Metiers, a national university in Paris.

    Photo: Suburban density in Toronto (Markham) by IDuke – English Wikipedia, CC BY-SA 2.5

  • Detroit’s Recovery? Oh Yeah, It’s Real Alright

    So it seems the debate has begun.  There’s been enough progress in Detroit to discuss whether its rebound is for real, or not.

    Two academics, Laura Reese of Michigan State University and Gary Sands of Wayne State University, wrote a piece for the Atlantic a couple weeks ago to counter the spreading narrative of Detroit’s comeback.  The article notes the Motor City’s rebound has caught the attention of the national media and parts of academia, but they aren’t so certain that the trend is real, or if it is, whether it’s indeed sustainable.  From the article:

    “These rosy descriptions were not consistent with the reality of what we continued to see in many Detroit neighborhoods. To provide perspective on Detroit’s comeback story, we examined trends in a variety of indicators including population, poverty, income disparities, business recovery, unemployment, residential sales prices and vacancies, and crime.

    Two major conclusions emerged from our data. First, by a number of measures Detroit continues to decline, and even when positive change has occurred, growth has been much less robust than many narratives would suggest. Second, within the city recovery has been highly uneven, resulting in increasing inequality.”

    In response to this article, blogger Lyman Stone added his take on Detroit’s recovery.  He seems to agree with Reese and Sands that, whatever is happening in Detroit, it’s not touching growing numbers of city residents, and therefore it’s not exactly a comeback:

    “I tend to be on team “Abandon all hope ye who enter here.” Saving Detroit is likely to be extremely costly while still holding a high risk of failure, in my opinion. But this view is predicated on a certain perspective of what it means to succeed. To some, success means population decline stops. To some, success means fewer empty buildings. To some, success means balanced municipal finances. To some, success means increasing employment. To me, I tend to think success means that huge population outflows will stop, and that population will begin to rise. Others may espouse other views, but I tend to think a locality’s ability to provide prosperity only matters in a general equilibrium framework, so a place that makes locals rich by culling the herd of non-rich locals is not “succeeding.” Success means that you offer prosperity to a rising share of the general population.”

    However, Stone notes that there are some positive demographic trends that are evident in Detroit, and seems to make the case that if Detroit is to get out of its hole, it’s at least stopping digging.

    The City Observatory’s Joe Cortright took a positive spin on Detroit in the Atlantic, going against the grain of both pieces and suggesting that Detroit’s comeback shouldn’t be dismissed:

    “Is Detroit “back?” As best I can tell, no one’s making that argument. The likelihood that the city will restore the industrial heyday of the U.S. auto industry, replete with a profitable oligopoly and powerful unions that negotiate high wages for modestly skilled work, just isn’t in the cards…

    That said, there’s clear evidence that Detroit has stanched the economic hemorrhage. After a decade of year-over-year job losses, Wayne County has chalked up five consecutive years of year-over-year job growth. True, the county is still down more than 150,000 jobs from its peak, but it has gained back 50,000 jobs in the past five years.”

    Honestly, I think each of the pieces — indeed, most people — underestimate the depths of Detroit’s collapse, and therefore underestimate the significance of its current recovery.  Detroit’s collapse was not simply an economic one, but a cultural, social and demographic one as well.  It lost virtually all connections with the networks of wealth and information that drive economic growth, and the city had such a pervasive negative perception that it was effectively erased from the minds of many.  What’s happening now is Detroit is reconnecting itself to the national and international network of cities, slowly returning to life among the living.  This is a necessary step for Detroit before any rebound that improves the lives of the majority its residents. 

    I view things this way.  While Detroit suffered immensely from the restructuring and decline of the auto industry, it likely suffered even more from demographic collapse.  Four years ago, I wrote a piece that showed the strength of the city’s demographic vacuum.  It’s not just that the city lost jobs and people moved.  People soured on Detroit in ways no other major city experienced, and left behind a city of concentrated poverty. I’ve often brought this graphic out, and it still amazes me:


    To his credit, Joe Cortright gets this in his article.  Where Reese and Sands argue that Detroit’s economic boost in the downtown and Midtown areas and some select nearby neighborhoods is raising income inequality, Cortright responds with a comment from the Brooking Institution’s Alan Berube: “Detroit does not have an income inequality problem—it has a poverty problem. It’s hard to imagine that the city will do better over time without more high-income individuals.”

    And that’s indeed the critical first step for Detroit.  It has to once again attract a critical mass of middle income and upper income residents who are ready, willing and able to invest in the city, before it can effectively take on its greater economic challenges. The post Great Recession recovery we’re witnessing now means the city is getting closer to being able to take on greater tasks.

    Pete Saunders is a Detroit native who has worked as a public and private sector urban planner in the Chicago area for more than twenty years.  He is also the author of “The Corner Side Yard,” an urban planning blog that focuses on the redevelopment and revitalization of Rust Belt cities.

    Top photo source tomabouttown.wordpress.com

  • A New Age of Progressive Suburbanism?

    We are living in a global suburban age… While statistics demonstrate that the amount of the world population in metropolitan areas is rapidly increasing, rarely is it understood that the bulk of this growth occurs in the suburbanized peripheries of cities. Domestically, over 69% of all U.S. residents live in suburban areas; internationally, many other developed countries are predominately suburban, while many developing countries are rapidly suburbanizing as well.”

    That’s not some anti-urban crackpot statement (as some inner urban elites might think) but from the introduction to a biennial theme of the MIT Center for Advanced Urbanism (USA). They understand that suburban and regional centres are not irrelevant for the future economy but highly important.  MIT are a pretty credible lot – hardly likely to pursue fringe urban planning or economic theories.

    In Australia, however, that message is not getting through. From the Prime Minister, down, there is a sense of irrational exuberance that the jobs of the future will mostly be concentrated in our CBDs and inner cities. Urban planning which supports increased concentration of employment through generous infrastructure allocations to inner urban areas is the manifestation of this inner urban obsession.  And while CBDs and inner urban areas are lavished with costly projects designed mainly to benefit the minority of people who work there, suburban and regional centres – where the majority live, work and play – have been largely left to fend for themselves.

    This process started in the late 1990s and early 2000s, notions about the “creative class” — many of which are being re-examined by author Richard Florida in a new book —   was a cause celebre amongst planning and government circles. It was widely argued that to attract the creative class of worker (synonymous with high skills and the new economy) cities needed to invest heavily in the quality of life in their downtowns. This was a precursor to the inner urban hipster, and, when real estate prices, rose their successors, the rise of the inner-city latte set.

    This thinking fit in well with two other trendy theories, New Urbanism and ‘Smart Growth’ (which redefined suburban progress as urban sprawl). The collective wisdom moved from supporting a growing suburban realm to one that disparaged it: the burbs were for bogans, the home of sprawl, “McMansions” full of low wage earning, culturally deficient and poorly educated masses, eating fast food diets and slurping sugar drinks. Inner cities by contrast were for educated, cultured and knowledgeable people – who had little need for suburban spaces or suburban habits but greater need for inner city waterfront cycle ways, museums, theatres and quality restaurants run by notable chefs. And, of course, lots of baristas. 

    Urban planning shifted quickly to a highly-regulated approach which promoted much higher densities of inner urban housing (and limits on outward expansion) because, after all, the inner city is where everyone in the future will want to live, right? The promises of these regional planning policies bordered on messianic. Take this example from the “Draft Metropolitan Strategy for Sydney to 2031” from the early 2000s:

    “A home I can afford. Great transport connections. More jobs closer to where I live. Shorter commutes. The right type of home for my family. A park for the kids. Local schools, shops and hospitals. Liveable neighbourhoods.”

    And what have we got thus? Some of the worst housing affordability in the world. Worsening congestion. Longer commutes. Limited housing choice, much of it not ideal for raising families.

    The ongoing policy focus and infrastructure obsession with centralisation is utterly at odds with economic and community signals. New economy industries in technical, scientific or professional services, or health and social care, have little interest in centralisation. Digital technology has broken that tyranny of distance. Undeterred though, we continue to watch as political and industry leaders promote costly infrastructure projects that enhance and support further centralised employment and a concentration of amenity in inner urban cores enjoyed by a privileged, mostly childless minority.

    For the record, the proportion of metropolitan wide jobs in the inner cities of Melbourne, Sydney and Brisbane was 11%, 13% and 12% respectively at the last census.  The reality remains that in our metropolitan centres, most people both live and work outside inner city bubbles of privilege. 

    The penny is finally dropping in some minds. Former Victorian Planning Minister, Matthew Guy (now Opposition Leader) once extolled the virtues of high density inner urban development. Looks like he has had a Damascus moment, commenting in The Australian (March 1, 2017) that: “Victoria is becoming a great, heaving, unsustainable mess. The whole of Victoria is just becoming an offshoot of Melbourne.”

    The emphasis on centralisation of jobs, housing and supportive infrastructure makes little sense in a country with such large land masses and capacity for expansion. Not only that, but the economic winds – enabled by rapid expansion of disruptive technology – are blowing the other way. Suburban and regional centres, long disparaged by the cognoscenti should instead be looked on as part of the solution to economic expansion and development. Where once we promoted urban renewal, we now need to turn our minds to suburban and regional renewal. We need to identify the critical infrastructure constraints of suburban and regional business centres and remedy them to encourage accelerated development of employment opportunities across the board.

    In a bid to put some balance into the discussions about urban development and growth, a Suburban Alliance (www.suburbanalliance.com.au) has been formed in Australia – with the intention of supporting research projects into the nature and needs of the suburban economy, and to use these as a platform for well-informed policy advocacy. Wish us luck. The initial focus starts in Brisbane but if the idea finds support, we’d like to see this expand to cover all major urban and regional centres. 

    The more supporters we can muster the sooner this absurd preoccupation with all things inner city can begin to be balanced with a better understanding of the important role played by suburban and regional business centres and why these are part of the solution to enhanced economic opportunity.

    Ross Elliott has more than twenty years experience in property and public policy. His past roles have included stints in urban economics, national and state roles with the Property Council, and in destination marketing. He has written extensively on a range of public policy issues centering around urban issues, and continues to maintain his recreational interest in public policy through ongoing contributions such as this or via his monthly blog, The Pulse.

    Photo: Photograph by Gnangarra [CC BY 2.5 au], via Wikimedia Commons

  • Chicago’s Crime Wave Understood: Complex Problem, Simple Formula

    Chicago’s violent crime problem can be understood through this formula:

    It’s a simplistic, reductionist, even crude, but it explains the roots of Chicago’s crisis as well as anything.

    It has been particularly grueling time in Chicago this recently.  We experienced the murders of at least ten Chicagoans, including two girls, age 12 and 11, shot within 30 minutes of each other in different locations, and a 2-year-old boy.  Once again, Chicago is thrust into the spotlight as President Donald Trump spoke of “two Chicagos” and renewed his pledge to send some kind of federal assistance to deal with the violence (note: you may have seen me refer to “two Chicagos” before, but I’m definitely uneasy with our current President making even starker distinctions between them).  And with each new story of violence, of television and newspaper reporters being sent out to document another life lost, of an expression of heartbreak from a grieving parent, we ask ourselves, “how did it get this way?  How do we solve it?”

    In many respects the violent crime wave is a reaction to the same trends that got our president elected, but coming from even deeper and longer lasting strains of dislocation and disenfranchisement.  It’s also a set of unintended consequences related to very specific policies undertaken by the city itself.  While Chicago’s experience is rather unique among American cities, other cities that exhibit similar traits are seeing the same spike as well.  In each case, the spike is decades in the making.

    Segregation

    It starts with segregation.  Chicago’s leaders during the early years of the twentieth century were the innovators of a segregation system that plagues the city to this day.  Natalie Moore, South Side bureau reporter for Chicago public radio station WBEZ and author of The South Side: A Portrait of Chicago and American Segregation, noted the pervasiveness of segregation in Chicago in this interview with the Chicago Tribune:

    “People know that segregation exists, but they don’t always think about it,” said Moore, WBEZ’s South Side Bureau reporter and the author of “The South Side: A Portrait of Chicago and American Segregation.” “It’s like air and water: You just kind of live it, but you don’t think about it.”

    And how was it established?  Tribune reporter Jeremy Mikula and Moore go on:

    “The institutional racism Moore charts in the book goes back generations and has its roots after the start of the Great Migration. Restrictive covenants prevented African-Americans from moving outside the city’s historic Black Belt until U.S. Supreme Court cases such as Hansberry v. Lee (1940) and Shelley v. Kraemer (1948) eliminated such restrictions in housing.

    Through that time, Moore writes, “the city designed a way for blacks to not fully participate in the freedoms of the North,” and later formulated subtle policy decisions that can still be felt today, she said.

    “All the things from redlining to the Home Owners’ Loan Corporation to blockbusting to white flight, there are so many things that happened in the 20th century that have lingering effects,” Moore said. “It’s never been about white people want to live there and black people want to live there. This is where the history is really important for us to understand.”

    Emphasis added. 

    Tools were developed and employed to create a segregated Chicago — restrictive covenants, redlining, exclusionary zoning, urban renewal, interstate highway development, public housing development, aggressive policing tactics and a judicial system that exploits inequality — and those tools are foundational to our understanding of the way the city operates today. 

    Chicago is not alone in its history of segregation, nor is it alone in its current spike in violent crime.  In fact, it may not even be the worst.  In late 2016, USA Today reported on the nation’s most violent cities, based on 2015 FBI violent crime data.  Chicago was not among the top ten.  The list was headed by St. Louis, followed by Detroit, Birmingham, Memphis, Milwaukee, Rockford, IL, Baltimore, Little Rock, AR, Oakland and Kansas City.  What’s dispiriting is the number of violent cities that are also among the most segregated.  St. Louis, Detroit, Birmingham, Memphis, Milwaukee and Kansas City are on most lists of highly segregated cities, as well as Chicago, Indianapolis, Cleveland, Cincinnati and Philadelphia.  Nearly all have seen violent crime increases.

    Neighborhood Destabilization

    So Chicago became a highly segregated city, with large numbers of blacks cut off from the economic and social networks necessary for upward mobility.  Old segregated spaces increasingly became impoverished spaces, as former white neighborhoods became new segregated spaces.  Concentrated poverty became super-concentrated with the development of the public housing in Chicago, and by the ’80s and ’90s Chicago was notorious for two features of its segregated system: 1) a gigantic collection of gangs operating as organized criminal enterprises; and 2) a depraved and dysfunctional public housing system, which also served as a base for gang activity.  To many, the dysfunction of Chicago’s public housing was crystallized in the story of the murder of Eric Morse, a 5-year-old taken to a vacant 14th floor Ida B. Wells public housing complex apartment by two preteens, and dropped to his death because he would not steal candy for them.  The city, and the nation, was outraged.

    It’s at this point that Chicago made a significant departure from other cities and pursued three policy choices that impacted the stability of its neighborhoods.  First, it made a concerted effort to lock up the leadership of the gang hierarchy, intent on “cutting off the head” of the gangs.  Second, the city recognized the failure of its public housing system, and elected to dismantle its most troublesome projects through its Plan for Transformation.  Third, in a cost-saving measure, the city closed nearly 50 public schools, with nearly all being in the highly segregated south and west sides.

    Each played a role in undermining the stability of Chicago’s south and west side neighborhoods, sending them into the violent crime spiral we see today.

    In the mid-’90s, Chicago police worked with the U.S. Attorney’s office to establish Operation Headache.  At the time the Chicago drug trade was largely controlled by gangs that were more akin to organized crime syndicates than gangs in the conventional sense.  The Gangster Disciples, the Black Disciples, the Vice Lords and the Latin Kings covered large parts of the city and developed distribution networks and open-air drug sales areas, and law enforcement found the problem nearly intractable.  Operation Headache represented a shift in tactics designed to bring them down.  Rather than focus on lower-level drug dealing youth who cycled in and out of the criminal system, they chose to go after gang leaders in an effort to destabilize them, and it was successful:

    “The first wave of convictions stemming from Operation Headache came in March 1996. But the biggest, most symbolically meaningful blow to the Gangster Disciples was delivered in May 1997, when Hoover was convicted of 42 counts of conspiracy to distribute drugs, received a sentence of six life terms, and was transferred to a supermax prison in Colorado, where his cell was located several stories underground and his ability to communicate with the remnants of his gang were severely constrained. Soon, the GDs in Chicago had been all but neutralized, and the authorities shifted their attention to decapitating the city’s other major drug organizations, the Black Disciples and the Vice Lords.

    Over the course of a roughly 10-year stretch starting in the mid-1990s, leaders from the GDs, the Vice Lords, the Black Disciples, and to a lesser extent, the Latin Kings were successfully prosecuted and taken off the street. The top-down assault appeared to work as Safer and his colleagues had hoped: violent crime in Chicago began to decline, with the city’s murder total dropping from a high of 934 in 1993 to 599 10 years later.”

    Beginning in 2000, the Chicago Housing Authority moved out public housing residents from developments that looked like this:

    and demolished them.  The goal was to replace them with less concentrated developments that would be integrated with their surrounding communities that looked more like this:

    or like this:

    The critical difference would be, however, that the CHA would now pursue a mixed-income approach to public housing development to address the city’s segregation problems and poverty concentration.  To do that, a third of residential units in new developments would be reserved for public housing residents, another third would be developed as affordable units for working-class and middle-class residents, and the last third would be sold or rented as market-rate properties. 

    Just as Operation Headache was successful in its early stages, so was the Plan for Transformation.  CHA worked closely with the U.S. Department of Housing and Urban Development to tear down the old public housing towers, and completed developments that did indeed appear more integrated into the surrounding neighborhood and fulfilled the mixed-income character that people desired.  By the mid-2000s both policies looked to be successful elements in the remaking of Chicago.

    But there were unintended consequences that law enforcement and housing officials did not see.  Violent crime in Chicago dropped to historic lows by 2005, leveled off for a few years, and started trending upward.  One reason cited?  Law enforcement became a victim of its success:

    “While experts say the Latin Kings, a Hispanic gang, continue to run a large and rigidly organized drug-selling operation on Chicago’s West Side, the majority of Chicago residents who call themselves gang members are members of a different type of group. Rather than sophisticated drug-selling organizations, most of the city’s gangs are smaller, younger, less formally structured cliques that typically lay claim to no more than the city block or two where they live. The violence stems not from rivalries between competing enterprises so much as feuds that flare up with acts of disrespect and become entrenched in a cycle of murderous retaliation.

    Many close observers of Chicago’s violence believe that, as well-intentioned as it was, the systematic dismantling of gangs like the Disciples led directly to the violence that is devastating the city’s most dangerous neighborhoods in 2016. Taking out the individuals who ran the city’s drug trade, the theory goes, caused a fracturing of the city’s criminal underworld and produced a vast constellation of new entities that are no less violent, and possibly even more menacing, than their vanquished predecessors.”

    Meanwhile, CHA was successful in the dismantling of old projects, but had limited success in the development of new ones, especially when trying to implement the mixed-income model.  In 1999, CHA committed to finding replacement housing for all public housing residents who would be displaced by the demolition, counting on their ability to construct mixed-income developments.  However, they soon ran into several challenges.  Private developers were finding it difficult to obtain financing for mixed-income developments, despite federal, state and local commitments.  But more importantly, market-rate buyers and renters, and even buyers and renters in the affordable range, showed little desire to share space with public housing residents. 

    This curtailed CHA’s ability to construct new developments, and forced them to rely much more heavily on Housing Choice Vouchers (HCVs, commonly referred to as Section 8 vouchers) to provide housing for former public housing residents.   An April 2011 report by CHA found that of the 16,500 public housing family households they committed to developing mixed-income units for, only 20% were actually in such developments.  There were 36% living in CHA projects that weren’t demolished, and 44% received HCVs and were living wherever their voucher would take them.

    Where did voucher holders go?  Generally to working-class black neighborhoods further south or west of former public housing sites on the south and west sides.  Many Robert Taylor and Stateway residents left Bronzeville and moved to the Englewood and Auburn-Gresham neighborhoods further south; many Horner and Rockwell residents left the near west side and Garfield Park and moved to Austin, further west. 

    The last straw was the closure of schools by the Chicago Public Schools in 2013.  By the mid-2000s, for anyone who cared to note it, there was growing evidence of conflict within the city’s public schools as children new to various neighborhoods competed with children of long-time residents.  At the same time the school system continued down its own budget spiral as the service delivery costs went upward and pension obligations went unmet.  That forced consideration of closures by CPS, much to the dismay of community residents familiar with the disruption caused by gang disorganization and an influx of poor residents.  Not only would the education of students be compromised by the closings, they argued, but the conflicts seen as voucher-holding residents moved into their communities would arise again.  New school boundaries would put combustible mixes of vulnerable children in new and dangerous environments.

    Globalization

    The election of Donald Trump as president has brought sharp focus to the polarization of our nation by economics, class and geography.  Well-educated and high-skilled workers are succeeding in today’s economy; less-educated and lower-skilled workers are failing.  A lot of people view this within the context of our nation’s white working class in small cities and rural areas, but the same applies to blacks in cities like Chicago as well.

    I’m going to plagiarize myself and pull some things about Chicago I wrote last year, when I saw six distinct categories of neighborhoods in the city.  Here’s the map:

    Gentrified Communities (dark green): Former middle and working-class neighborhoods that have firmly become well-to-do neighborhoods over the last 30 years or so. Home to a substantial amount of Chicago’s walkable urbanism inventory. Transit supported and amenity rich.

    Gentrifying Communities (light green): Historically similar to the adjacent gentrified communities, but part of a second or third wave of growth that emanated from the first group. Almost as affluent and educated as the first group, and quickly catching up, but not quite there yet.

    Frontline Communities (yellow): Largely working-class neighborhoods that may be experiencing development pressure generated in the gentrified/gentrifying communities. People in the above two areas may identify with communities here as places for authentic ethnic dining or shopping. Less wealthy and with more minorities than the gentrified/gentrifying communities, but less than those on its outer flank. In Chicago, at least, fear of the prospects of gentrification here may exceed reality.

    Stable Prosperous Communities (gold): Middle-class neighborhoods that sprouted in the city at the advent of the suburban era and have changed little since. Single-family home oriented and auto-oriented. In Chicago, home to many city workers who must remain in the city due to residency requirements. Rapidly growing older in its makeup.

    Transitioning Communities (orange): Structurally similar to the stable prosperous communities, but more deeply impacted by one or two transitions. Some are receiving a large influx of new minority residents, largely Latino. Others are experiencing a huge outflow of middle-class families, largely African-American. Those experiencing the Latino influx are becoming younger and less affluent; those experiencing the African-American outmigration are being hollowed out, leaving behind large numbers of older and younger less affluent residents.

    Isolated Communities (brown): Impoverished areas of the city. Middle-class white residents left here in the ’50s and ’60s, replaced by middle-class and working-class blacks who bore the brunt of job loss in the subsequent decades. Plenty of walkable urbanism exists here, but demolition means it’s fading away.

    Here are a few data pieces I gathered for each of the categories I identified (you can click to see bigger):

    Looking at the map, the green and light green neighborhoods have been Chicago’s winners in today’s global economy.  The gold neighborhoods have been doing reasonably well.  Depending on your perspective, the yellow neighborhoods are threatened with gentrification encroachment, or have a reasonable expectation of upcoming revitalization.  The orange and brown neighborhoods?  They’re not doing so well.  They’re the ones largely impacted by Chicago’s century-old segregation legacy, or in various stages of instability via the actions undertaken over the last 25 years. 

    Chicago’s rigid segregation patterns set the stage economic divergence before globalization did, but globalization made it worse.  And in the aftermath of the Great Recession, when globally connected communities returned to their upward trajectory, troubled communities sunk further into the abyss.

    Chicago’s violent crime spike will not be solved with National Guard troops patrolling the streets.  It will not be solved with greater emphasis on gun control laws.  It will not be solved by a wholesale reform of the Chicago Police Department, which has just come out of a year-long investigation by the U.S. Department of Justice that excoriated its “excessive force, lax discipline and bad training.”  All of these measures would have some incremental impact on violent crime.  Crime would go down, if only temporarily.  However, these measures treat the symptom.  None would do anything to address root causes and eliminate the problem for good.

    There is an answer to Chicago’s madness.  It would not solve the problem overnight, but it would have the potential to solve it for the long term.  I’ll outline it in my next blog post later this week.

    Pete Saunders is a Detroit native who has worked as a public and private sector urban planner in the Chicago area for more than twenty years.  He is also the author of “The Corner Side Yard,” an urban planning blog that focuses on the redevelopment and revitalization of Rust Belt cities.

    Top photo: A body is removed from the scene after a man was shot and killed in the 3000 block of West 53rd Place in Chicago. — Anthony Souffle, Chicago Tribune, April 13, 2014

  • Los Angeles Traffic: Likely To Worsen with Higher Densities

    A few recent days driving the Los Angeles freeways impressed me with how different they are from in most other places in the country. The intensity of the traffic is astounding. Even on the weekend, travel over Sepulveda Pass on the San Diego Freeway (I-405) was highly congested. Traffic really never stopped, but frustratingly inched along for parts of the way and approached 60 miles per hour on other parts. A Saturday trip I feared might take an hour and a half was completed from Simi Valley in less than 60 minutes. Caltrans and the local officials do an admirable job of keeping the traffic moving, which was obvious from the only slight delay near Sherman Way caused by an incident that required a fire truck.

    Traffic Per Lane Mile

    The latest Federal Highway Administration data indicates that nearly 23,000 cars are handled by each freeway lane on the average day. Among the larger urban areas, only San Jose and close-by Riverside-San Bernardino have a volume of more than 20,000 daily.

    The freeway lane volume in Los Angeles is up from 16,500 cars per lane mile in the early 1980s,  a more 37 percent increase in traffic (Figure 1). This is not surprising, because the urban area, which stretches from the San Fernando Valley to Pomona and Orange County to San Clemente has added almost the same percentage of residents. The city of Los Angeles itself, which covers virtually the same area as it did more than three decades ago has become significantly more dense, also adding about one third to its population.

    At the same time, public policy in California is calling for significant urban densification that will put an even greater strain on the roadway network. Any assumption that a more dense Los Angeles will be anything less than an even more horrific traffic environment is simply folly.

    Billions Spent on Rail: Yet Traffic is Much Worse

    Some, including me while I was on the Los Angeles County Transportation Commission, believe (or in my case “believed”) that an expansion of transit — especially adding urban rail service, would relieve traffic congestion. Los Angeles has now had nearly three decades of experience with that strategy. Yet, traffic has only become more intense.

    Indeed, despite the addition of a substantial urban rail system in Los Angeles County has been accompanied by a general decline in transit ridership on the Metropolitan Transportation Authority services compared to predecessor services operated by the Southern California Rapid Transit District in 1985. In 2016, ridership was even lower than the year before, despite the extensions of rail service to Santa Monica on the Expo Line and to Azusa on the Gold Line.

    Even work trip ridership, which transit serves best, is down. In 1980, transit’s market share was 7.0 percent in Los Angeles County. By 2015, transit’s market share had fallen slightly to 6.8 percent. Meanwhile, driving alone expanded significantly from 68.7 percent in 1980 to 73.0 percent in 2015. Working at home increased from 1.5 percent in 1980 to 5.1 percent in 2015 (Figure 2).

    Why Rail has Not Attracted Drivers

    There are two principal reasons the transit has not been able to attract drivers out of their cars and reduce freeway volumes. The first is that, for the most part, you cannot get from here to there on transit. That is, most jobs and places people are traveling cannot be conveniently accessed by transit. The University of Minnesota Accessibility Laboratory has found that 43.3 percent of jobs in the Los Angeles metropolitan area can be reached by car within 30 minutes. By contrast. Only 0.7 percent of jobs can be reached by transit within 30 minutes. In other words, the accessibility provided by cars is much greater than that of transit. For every job that can be reached by transit within 30 minutes, nearly 60 times as many jobs can be reached by car (Figure 3).

    Even where jobs can be reached by transit, it takes far longer. According to the latest American Community Survey data, the average one way work trip travel time for people driving alone in the Los Angeles metropolitan area is 27.9 minutes. By contrast, the average Metro Rail rider takes 52.2 minutes to reach work (Figure 4). It is not hard to imagine why people have not traded in their faster car travel times for slower trips on transit. Excess travel time, regardless of how traveled, takes away from other necessary activities and recreation.

    Further, with all the talk about “urban villages,” with the expected improved jobs housing balance, it is well to recognize such an achievement would be unprecedented. As former principal planner of the World Bank Alain Bertaud put it: “…the urban village "model does not exist in the real world because it contradicts the economic justification of large cities: the efficiency of large labor markets." The cold water of reality is that "… the urban village model exists only in the mind of urban planners."

    Of course, talk of people living near where they work is dubious, particularly in a metropolitan area where housing affordability  is challenging both for the vast majority of renters and potential buyers. When does anyone think this will happen? In “this life” or maybe in the “life to come?”

    The bottom line, unfortunate and politically incorrect as it is, is that transit simply cannot reduce traffic congestion. Some other strategy needs to be deployed.

    Prognosis: More Density, More Traffic

    Los Angeles traffic is likely to get much worse, especially if the development becomes substantially denser. All of the 12 world urban areas in the recent Tom Tom Congestion Index that have worse traffic than Los Angeles are denser. This is consistent with the international evidence that shows a strong association between higher densities, greater traffic congestion and lengthened work trip travel times. The experience in Los Angeles shows the same thing.

    Wendell Cox is principal of Demographia, an international public policy and demographics firm. He is a Senior Fellow of the Center for Opportunity Urbanism (US), Senior Fellow for Housing Affordability and Municipal Policy for the Frontier Centre for Public Policy (Canada), and a member of the Board of Advisors of the Center for Demographics and Policy at Chapman University (California). He is co-author of the "Demographia International Housing Affordability Survey" and author of "Demographia World Urban Areas" and "War on the Dream: How Anti-Sprawl Policy Threatens the Quality of Life." He was appointed to three terms on the Los Angeles County Transportation Commission, where he served with the leading city and county leadership as the only non-elected member. He served as a visiting professor at the Conservatoire National des Arts et Metiers, a national university in Paris.

    Photo: North on the 110 Toward Downtown, AM Peak (by author)

  • Is L.A. Back? Don’t Buy the Hype.

    With two football teams moving to Los Angeles, a host of towers rising in a resurgent downtown and an upcoming IPO for L.A.’s signature start-up, Snapchat parent Snap Inc., one can make a credible case that the city that defined growth for a half century is back. According to Mayor Eric Garcetti, the Rams, Chargers and the new mega-stadium that will house them in neighboring Inglewood, show that “that this is a town that nobody can afford to pass up.”

    And to be sure, Los Angeles has become a more compelling place for advocates of dense urbanism. Media accounts praise the city’s vibrant art scene, its increasingly definitive food scene and urbanist sub-culture. Some analysts credit millennials for boosting the population of the region and reviving the city’s appeal. Long disdained by eastern sophisticates, there’s an invasion from places like New York. GQ magazine called downtown L.A. “America’s next great city” last year.

    Downtown has transformed itself into something of an entertainment district, with museums, art galleries, restaurants, and sports and concert venues. Yet it has not become, like San Francisco or New York, a business center of note. In fact, jobs in the region have continued to move out to the periphery; downtown accounts for less than 5% of the region’s employment, one-third to half the share common in older large cities.

    Downtown’s residential growth needs to be placed in perspective. Since 2000 the population of the central core has increased by only 9,500; add the  entire inner ring and the population is up a mere 23,000. Meanwhile over the same span, the L.A. suburbs have added 600,000 residents. Jobs? Between 2000 and 2014, the core and inner ring, as well as older suburbs, lost jobs, U.S. Census data show, while newer suburbs and exurbs added jobs.

    In our most recent ranking of the metro areas creating the most jobs, Los Angeles ranked a mediocre 42nd out of the 70 largest metro areas; San Francisco ranked first. That’s well behind places like Dallas, Seattle, Denver, Orlando, and even New York and Boston, cities that we once assumed would be left in the dust by L.A.

    A New Tech Hub?

    The emergence of Snap has led some enthusiasts to predict L.A.’s emergence as a hotbed of the new economy. And to be sure, there is a growing tech corridor in the Santa Monica-Marina area that may gradually gain critical mass. Talk of a growing confluence between tech and entertainment content — the signature L.A. product — and the proliferation of new entertainment venues, could position the area for future growth. At the same time, the presence of Elon Musk’s Space X in suburban Hawthorne, near LAX, has excited local boosters.

    Yet despite these bright spots, Los Angeles’ current tech scene is almost piteously small. One consistent problem is venture capital. Despite the massive size of its economy, and huge population, Los Angeles garners barely 5% of the nation’s venture capital, compared to 40% for the Bay Area, 10% for New York and Boston. Companies that were born in L.A. often end up moving elsewhere, like virtual reality pioneer Oculus, which was frog marched to the Bay Area after being acquired by Facebook.

    Indeed, despite bright spots like Snap, since 2001 STEM employment in the L.A. metro area has been flat, in sharp contrast to high rates of job growth in the San Francisco Bay Area, Austin, Houston and Dallas, and the 10% national increase. Tech employment per capita in the L.A. area hovers slightly below the national average, according to a recent study I conducted at Chapman University. Los Angeles County, once the prodigious center of American high-tech, is also now slightly below the national average of engineers per capita.

    The Poverty Economy

    The regional economy, notes a recent Los Angeles Development Corporation report, continues to produce largely numbers of low-wage jobs, mostly in fields like health, hospitality and services. Sixty percent of all new jobs in the area over the next five years will require a high school education or less, the report projects.

    At the same time in the year ending last September, employment dropped in three key high-wage blue collar sectors: manufacturing, construction and wholesale trade notes the EDC The largest gains were in lower-wage industries like health care and social assistance, hospitality and food service.  Since 2007 Los Angeles County has 89,000 fewer manufacturing jobs, which pay an average of $54,000, but 89,000 more in food service that pay about $20,000. No surprise more than one out every three L.A. households have an income under $45,000 a year.

    All this works well for the people who are increasingly coming to enjoy L.A.’s great restaurants, hipster enclaves and art venues. The football teams will add to this mixture, offering employment selling peanuts, popcorn and hot dogs to generally affluent fans in the stands.

    Yet low wages could prove catastrophic in a region that lags only the Bay Area in housing costs. Some 45,000 are homeless throughout the metro area, concentrated downtown but spreading throughout the region all the way to Santa Ana, in the south. Housing prices have risen to five times median household income, highest in the nation and more than twice the multiple in New York, Chicago, Houston or Dallas-Ft. Worth. L.A. leads the nation’s big metro areas in a host of other negative indicators, including the percentage of income spent on housing, overcrowding and homelessness. A city which once epitomized middle class upward mobility is increasingly bifurcated between a wealthy elite, mostly Anglo and Asian, and a largely poor Latino and African-American community.

    A recent United Way study, for example, found that 37% of L.A. families can barely make ends meet, well above the 31% average for the state; the core city’s south and east sides have among the largest concentrations of extreme poverty in the state. Once a beacon for migrants from all over America, L.A. now has a similarly high rate of mass out-migration as New York. But unlike New York, where immigrants continue to pour in, newcomers to the U.S. are increasingly avoiding Los Angeles – it had the lowest growth in its immigrant population of any major metropolitan area over the past decade. Perhaps even more revealing, the Los Angeles area has endured among the largest drops in the number of children since 2000,notes demographer Wendell Cox,  more than New York, Chicago and San Francisco.

    Altered DNA

    The writer Scott Timberg notes that L.A.’s middle class, was once “the envy of the world.” L.A. used to be a place where firemen, cops and machinists could own houses in the midst of a great city. Dynamic, large aerospace firms, big banks and giant oil companies sustained the middle class.

    But the city has lost numerous major employers over the years, most recently longtime powerhouse Occidental Petroleum, and the U.S. headquarters of both Toyota and Nestle. The regional aerospace industry, which provided nearly 300,000 generally high-wage jobs in 1990, is now barely a third that size. High housing cost have devastated millennials, whose home ownership rate has dropped 30% since 1990, twice the national average.

    Many urbanists hail the emergence of a transit-oriented, dense city. Since 1990, Los Angeles County has added seven new urban rail lines and two exclusive busways at the cost of some $16 billion. Yet ridership on the Metropolitan Transportation Authority rail and bus services is now less than its predecessor Southern California Rapid Transit District bus services in 1985, before any rail services were opened. The share of work trips on transit in the entire five-county Los Angeles metropolitan region, has also dropped, from 5.1% in 1980 and 4.5% in 1990 to 4.2% in 2015. Meanwhile the city endures the nation’s worst traffic.

    Some longtime Angelenos are mounting a fierce ballot challenge — known as Measure S — to slow down ever more rapid densification. The ballot measure would bar new high-density construction projects for the next two years. “The Coalition to Preserve L.A.,” which is funding the measure, claims to be leading in the polls for the March 7 vote, but faces well-financed opposition from politically connected large developers, Mayor Garcetti, both political parties, virtually the entire city council, and much of the academic establishment. The L.A. Times denounced Proposition S as a “childish middle finger to City Hall” and its architecture critic Christopher Hawthorne, has urged the citizenry “to move past the building blocks of post-war Los Angeles, including the private car, the freeway, the single-family house and the lawn.”

    Proposition S proponents include many neighborhood and environmental groups, as well progressives and conservatives, including former Mayor Richard Riordan. The people controlling Los Angeles may dream of being the “next” New York but many residents, notes longtime activist Joel Fox, “are tired of the congestion and development and feel that more building will only add to congestion.”

    Renewing La La Land

    Of course, slowing or banning development by popular proposition is probably not the ideal  way to get control over the deteriorating situation. Yet it is clear that the current trajectory towards more dense housing is not addressing the city’s basic problems. Los Angeles, as the movie “La La Land so poetically portrays, remains a “city of dreams” but that mythology is clearly being eroded by a delusional desire to be something else.

    In my old middle-class neighborhood in the San Fernando Valley, heavily populated by people from the creative industry, the worsening congestion, the upsurge of ever taller buildings and ever more present homeless did not reflect the giddiness of “La La Land.”

    Yet despite all these problems, Los Angeles has the potential to make a great comeback. It has a dispersed urban form that allows for innovation and diversity, and an unparalleled physical location on the Pacific Rim. Its ethnic diversity can be an asset, if somehow it can generate higher wage employment to stop the race to the bottom. The basics are all there for a real resurgence, if the city fathers ever could recognize that the City of Angels needs less a new genome but  should build on its own inimitable DNA.

    This piece first appeared in Forbes.

    Joel Kotkin is executive editor of NewGeography.com. He is the Roger Hobbs Distinguished Fellow in Urban Studies at Chapman University and executive director of the Houston-based Center for Opportunity Urbanism. His newest book, The Human City: Urbanism for the rest of us, was published in April by Agate. He is also author of The New Class ConflictThe City: A Global History, and The Next Hundred Million: America in 2050. He lives in Orange County, CA.

    Photo: AdamPrzezdziek

  • Automation, Artificial Intelligence, and Projectile Wooden Shoes

    Sabotage has its root in the French word sabot, which is a kind of wooden shoe. In the early days of the Industrial Revolution craftsmen would throw their shoes into the gears of factory machines. Skilled labor was being replaced with mechanical production, undermining traditional professions, reducing incomes, and removing the social standing of workers. Wealth flowed up to the people who owned the factories and controlled the levers of political power. Sabotage was a form of negotiation. Industrial production was so incredibly efficient and profitable that the craft guilds had no chance of surviving over the long term. And since the cost of manufactured goods dropped like a stone with industrial processes society wasn’t inclined to turn back the clock. What unfolded over the course of a couple of centuries was a series of social, political, and economic convulsions including revolutions, wars, and mass migrations.

    screen-shot-2017-02-14-at-8-09-03-am

    screen-shot-2017-02-14-at-8-08-49-am

    screen-shot-2017-02-14-at-8-09-20-am

    I passed a construction site recently and saw this mobile surveillance pod. This is the beginning of the end of the night watchman. It’s part of the ever expanding panopticon of electronic monitors connected 24/7 to the cloud – complete with facial recognition software and the ability to cross reference an endless number of databases including everyone’s e-mails and geotagged cell phone records. Rent-a-cops are on the way out.

    screen-shot-2017-02-18-at-8-29-21-pm

    screen-shot-2017-02-18-at-8-30-14-pm

    screen-shot-2017-02-18-at-8-29-42-pm

    screen-shot-2017-02-18-at-8-30-03-pm

    Think this is only a big city thing? Try rural Montana. Same same. The squad car parked on the side of the highway with a radar gun is about to fade away. A far more effective and lucrative series of electronic devices will instill discipline in drivers and generate passive municipal revenue instead. Did I mention aerial drones? First they’re used in Afghanistan. Then along the Mexican border. Then poor high crime neighborhoods. Then your quiet little cul-de-sac in Indiana or South Carolina… The code enforcement people are going to love it.

    Screen Shot 2016-03-27 at 10.41.15 PM

    Screen Shot 2016-03-27 at 10.41.39 PM

    How much longer do you think it will be before long haul trucks are fully automated? Autonomous vehicles are cost cutting devices, not the latest upgrade for consumer convenience. What do you think will happen to all the roadside establishments that serve the needs of human truck drivers? Tick tock.

    screen-shot-2017-02-07-at-6-24-10-pm

    This is Google’s newest gadget. It’s comparable to Amazon’s Alexa and Apple’s Siri. Speak to these machines and they perk up. “Play Bohemian Rhapsody.” Or “Order four AA batteries.” Or “When is my next dentist appointment with Dr. Harris?” These devices search the internet and/or various personal files from your phone or computer and seamlessly give you what you want.

    screen-shot-2017-02-18-at-6-20-32-pm

    screen-shot-2017-02-18-at-6-20-54-pm

    Think you’ll be spared because you’re an educated professional? It’s only a matter of time before more advanced versions of artificial intelligence replace an army of human workers in more skilled positions. Medical centers will swap out administrative staff for a suite of voice activated algorithms. Computer programs will eventually read X-Rays and MRI results and provide preliminary diagnoses. Secure pill dispensing machines are already the norm in many hospital pharmacies. Tech support and customer service jobs will disappear. Accountants and paralegals are on that same list. Think outsourcing overseas was a problem for the former middle class? Think illegal immigrants drove down wages? Wait for what’s coming next.

    screen-shot-2017-02-11-at-5-26-33-am

    screen-shot-2017-02-11-at-5-24-40-am

    screen-shot-2017-02-11-at-5-23-25-am

    screen-shot-2017-02-11-at-5-25-55-am

    screen-shot-2017-02-11-at-5-25-03-am

    Here’s a common sight in Silicon Valley. Colonies of second hand RVs parked between a Burger King and a freeway off ramp are occupied by people who have no better option. The middle class tends to write off such populations as alcoholic schizophrenics. I interact with these folks on a regular basis and most have jobs. Some have two or three. They’re adamant that they did nothing wrong, but the larger society has simply discarded them. The median home price in San Jose is $1,085,000. Median rent for a studio apartment is $2,120. Moving to a “cheaper” place like Oakland is no longer an option. Two bedroom apartments there now rent for $3,500 – assuming you can find a vacancy. The minimum wage in these communities ranges between $10.30 and $15 an hour. The numbers don’t add up. There are an awful lot of these homeless camps everywhere these days. This is what a bifurcated economy looks like.

    A friend asked me to write about a possible Minimum Guaranteed Income. The concept is simple enough. If an individual or household earns less than a certain amount of money the government will fill the gap with a cash payment. I remember my social studies teacher talking about a “negative income tax” back in the 1970’s so this isn’t a new idea.

    My response was short and to the point. Not going to happen. Americans reject wealth transfers and chafe at any hint of “social engineering.” Anti-poverty programs are so deeply unpopular that a Minimum Guaranteed Income is a non-starter. And resistance is strongest from the people who would most benefit – the marginal declining middle class.

    The usual solutions aren’t going to work either. Dramatically raising the minimum wage will only encourage more employers to automate more agressively to squeeze labor out of their business models. Jacking up taxes will drive jobs and people out of the state (a process that is already well under way.) Building subsidized housing won’t scale up and is politically toxic. Rent control keeps some people in artificially affordable housing at the expense of their landlords, but does nothing to create new housing – quite the opposite. Reducing regulations and eliminating onerous bureaucracies is structurally impossible since the agencies that administer existing programs are a lot more powerful than the people they’re meant to serve. Moving to Texas works for people who already have a toehold in the middle class, but for those with less skills and no money life in Houston is merely slightly less miserable. The list goes on…

    screen-shot-2017-02-20-at-3-25-18-am

    screen-shot-2017-02-20-at-3-25-08-am

    screen-shot-2017-02-20-at-3-36-01-am

    Screen Shot 2016-02-04 at 7.58.45 PM

    My best guess is we’ll see the implementation of policies that achieve similar goals to a Minimum Guaranteed Income by other means. But they’ll need to be in keeping with the dominant cultural narrative: The Puritan Work Ethic. If you don’t work, you don’t eat. And they’ll have to be designed to filter out people who are deemed unworthy of inclusion. That’s been the pattern for centuries. The military is the primary model. Cradle to grave socialism is perfectly acceptable – often eagerly embraced – by American society if the wealth transfer is to people who are believed to be deserving. The militarization of domestic affairs is a distinct possibility.

    screen-shot-2016-10-12-at-9-23-39-am

    screen-shot-2016-10-12-at-9-49-12-am

    Massive infrastructure building projects are another viable option for employing large numbers of low skill workers. The cost, productive capacity, or return on investment of such projects is essentially irrelevant. Project funding will be allocated by a political process that prioritizes select populations in particular locations. This preserves the existing vested interests – a combination of corporations and big government. Republican. Democrat. Conservative. Liberal. It doesn’t matter. The goal is to allow business-as-usual to limp along for a while longer while mollifying the displaced population. This will work until the feds can no longer borrow and print money. The alternative is a Soviet Union style collapse.

    John Sanphillippo lives in San Francisco and blogs about urbanism, adaptation, and resilience at granolashotgun.com. He’s a member of the Congress for New Urbanism, films videos for faircompanies.com, and is a regular contributor to Strongtowns.org. He earns his living by buying, renovating, and renting undervalued properties in places that have good long term prospects. He is a graduate of Rutgers University.

    All photos by Johnny Sanphillippo

  • Dallas-Fort Worth & Dayton: World Large City Least Congestion: 2017 Tom Tom Traffic Index

    Dallas-Fort Worth and Dayton Ohio have the least traffic congestion among larger cities (urban areas) in the world, according to the 2017 Tom Tom Traffic Index. Dallas-Fort Worth had the shortest average all day delay, at 18 percent of the 43 cities with more than 5 million population. Dallas-Fort Worth also had the least average peak period traffic delay. This is the second year in a row the Dallas Fort Worth has had the best all day traffic congestion. Dayton had the best all day and average peak hour congestion among the 146 cities with between 800,000 and 5,000,000 population and tied with three others for the best in among all cities the least all-day congestion.

    All City Rankings

    Among all city sizes, Syracuse (NY), Greensboro (NC), Winston-Salem (NC) and Dayton had the best all day traffic, with a nine percent average delay. Cadiz, Spain had the best average peak hour congestion, with an 11.5 percent delay.

    Mexico City had the most intense all day congestion, at 66 percent, followed closely by Bangkok at 61 percent. Other cities with the most congestion include, not surprisingly, Chongqing, Jakarta, Istanbul and Beijing. All have large populations, high densities and millions of cars. A real surprise, however is Lodz, Poland, with a population of less than 750,000, which has the fourth worst congestion (Figure 1)

    Bangkok ranked the most congested city, in the AM and PM peak periods, with an average traffic delay of 104.5 percent. This means that it takes twice as long in Bangkok to make a trip as it would if traffic flowed freely. Mexico City had the second largest delay at 98.5 percent, followed by Bucharest (Romania) at 94.0 percent. Bucharest   heavy traffic congestion surprises, since it has, at best, only one-fifth the population of the largest seven most congested cities. Even more surprising is that much smaller Belfast is the sixth most congested, while Dublin, smaller than Bucharest, ranks seventh (Figure 2).

    Cities Over 5,000,000 Population

    Out of the 43 cities with more than 5 million population, three US cities (Philadelphia, Houston and Chicago) and Madrid join Dallas-Fort Worth in having the least all-day traffic congestion. The five cities with the most traffic congestion are Mexico City, Chongqing, Jakarta and Istanbul (Figure 3).

    Three of the cities with the least average peak congestion are in the United States, including Dallas-Fort Worth, second-ranked Philadelphia and fourth-ranked Chicago. Madrid, again makes the top five in third position, while Sao Paulo ranks fifth (Figure 4). The Chinese cities of Quangzhou and Suzhou rank surprisingly well, in view of the national traffic congestion level (Table), at 6th and 9th least congested.


    Cities with 800,000 to 5,000,000 Population

    All 10 of the least congested cities between 800,000 and 5 million population all day are in the United States. The least congested are Dayton, Knoxville, Richmond, Omaha and Indianapolis, in a fifth-place tie with Kansas City.

    Bucharest had the most all day congestion, followed by Tiainan, Changsha, Shijazhuang and Kaohsiung  (Figure 5).

    The eight least congested cities between 800,000 and 5 million population during peak periods are located in the United States, led by Dayton, Knoxville, Richmond, Tulsa, Worcester and Kansas City.

    The greatest traffic congestion in this population category is in Bucharest, which is followed by Shijiazhuang, Changsha, Auckland and Zhuhai (Figure 6).

    Cities with Less than 800,000 Population

    The four cities with less than 800,000 population and the least all-day traffic congestion are in the United States, Winston-Salem (NC), Syracuse (NY), Greensboro (NC) and Akron (OH). The fifth best traffic congestion is in Ljubljiana, the capital of Slovenia.

    The worst all day traffic congestion in this category is in already cited Lodz and Dublin, as well as Palermo, Belfast, Lublin (Poland) and Edinburgh (Figure 7).

    Cadiz, Spain has the least peak period congestion in this population category, followed by four US cities, Syracuse, Greensboro, Akron and Winston-Salem.

    The greatest average peak period congestion in the below 800,000 population category was in Belfast, followed by Dublin, Lodz, Wellington (NZ) and Edinburgh.


    Traffic Congestion by Country and Geography

    Among the nations, the US has the overall least traffic congestion, with a delay rate of 19.3 percent in all day congestion, followed by the Netherlands and Spain. The US leads in two population categories, 800,000 to 5,000,000 and under 800,000. Spain has the least over 5,000,000 congestion, where Madrid exhibits the impacts of its strong motorway system.

    East Asian cities have the greatest all-day traffic congestion, at 41.1 percent, though among the largest cities Latin America has have most congestion.

    In average peak period congestion, Spain shows the best results, with a delay rate of 29.0 percent, followed by the United States and the Middle-East. Spain leads in the over 5,000,000 category, Turkey in the 800,000 to 5,000,000 category and the United States in the under 800,000 category.

    East Asian cities also have the greatest average peak period congestion, at  67.3 percent. Among the largest cities, congestion is greatest in the Eastern European cities outside Poland and Turkey (Table).

    The Importance of Traffic Indexes

    Cities are more productive if they facilitate greater access throughout their urbanization, especially for work trips, as Remy Prud’homme and Chang-Woon Lee at the University of Paris and David Hartgen and M. Gregory Fields of the University of North Carolina, Charlotte have shown. Traffic indexes provide important metrics to aid city officials in “keeping the traffic moving,” which is essential in the modern metropolitan area. Significantly, worldwide traffic indexes are covering more cities. This year’s Tom Tom Traffic Index added important cities like Jakarta, Hong Kong, Buenos Aires, Santiago de Chile, and Kuala Lumpur, bringing the total to 390. Today’s policy makers have far more information on which to evaluate transport investments than ever before.

    Table
    Summary of Traffic Congestion by Geography
    ALL DAY CONGESTION AVERAGE AM-PM CONGESTION  
    Country/Geography Over 5 Million 800,000-5 Million Under 800,000 All Over 5 Million 800,000-5 Million Under 800,000 All Count by Population Category
    ASIA                  
    China 39.7% 36.3%   38.5% 67.2% 66.6%   67.0% 15, 8, 0
    East Asia: Other 43.0% 38.8%   41.1% 75.5% 57.1%   67.3% 5, 4, 0
    Middle-East\   26.2%   26.2%   35.6%   35.6% 0, 5, 0
    EUROPE                  
    France 38.0% 30.3% 23.5% 24.9% 67.0% 57.0% 42.0% 44.8% 1, 3, 21
    Germany   28.3% 24.5% 25.6%   47.6% 39.9% 42.0% 0, 7, 18
    Italy 30.0% 32.7% 23.8% 25.1% 57.5% 56.5% 37.7% 40.8% 1, 3, 21
    Netherlands     19.5% 19.5%     37.2% 37.2% 0, 0, 16
    Spain 25.0% 27.0% 20.3% 21.0% 45.5% 41.5% 27.1% 29.0% 1, 2, 22
    United Kingdom 40.0% 30.2% 29.7% 30.2% 66.0% 55.7% 55.8% 56.2% 1, 6, 18
    Western Europe: Other   29.3% 24.2% 25.1%   52.8% 42.1% 44.1% 0, 9, 38
    Poland   27.0% 32.7% 31.8%   48.3% 53.0% 52.2% 0, 2, 10
    Turkey 49.0% 26.0%   28.3% 77.0% 34.0%   38.3% 1, 9, 0
    Eastern Europe: Other 42.5% 31.6% 21.1% 27.9% 80.0% 61.1% 43.9% 55.3% 2, 7, 8
    NORTH AMERICA                  
    Canada 30.0% 27.2% 21.3% 24.5% 56.0% 46.8% 38.1% 43.2% 1, 5, 6
    United States 28.6% 18.5% 15.0% 19.3% 52.7% 34.6% 24.2% 35.5% 9, 62, 9
    AUSTRALASIA                  
    Australia     24.2% 27.5%   50.7% 38.5% 44.6% 0, 5, 5
    New Zealand   38.0% 28.2% 29.8%   74.5% 47.9% 52.3% 0, 1, 5
    OTHER                  
    Latin America 44.6% 29.1%   35.6% 72.9% 51.1%   60.2% 5, 7, 0
    South Africa 30.0% 35.0% 23.8% 26.7% 61.0% 71.0% 44.9% 51.9% 1, 1, 4

    Wendell Cox is principal of Demographia, an international public policy and demographics firm. He is a Senior Fellow of the Center for Opportunity Urbanism (US), Senior Fellow for Housing Affordability and Municipal Policy for the Frontier Centre for Public Policy (Canada), and a member of the Board of Advisors of the Center for Demographics and Policy at Chapman University (California). He is co-author of the “Demographia International Housing Affordability Survey” and author of “Demographia World Urban Areas” and “War on the Dream: How Anti-Sprawl Policy Threatens the Quality of Life.” He was appointed to three terms on the Los Angeles County Transportation Commission, where he served with the leading city and county leadership as the only non-elected member. He served as a visiting professor at the Conservatoire National des Arts et Metiers, a national university in Paris.

    Photo: A Bangkok freeway, by author