Category: Urban Issues

  • The Evolving Urban Form: Zürich

    Zürich is the largest urban area in Switzerland. The core city (stadt) of Zürich is located at the northern end of Lake Zürich, which is glacial and similar to the "finger lakes" of upstate New York. Lake Zürich is approximately 25 miles/40 kilometers long and 1-2 miles/1.5-3 kilometers wide. The urban area extends south along most of the lake and over hills to the East and West and further North.

    Zürich, like larger Paris and Barcelona is a favorite among urban aficionados. Two reasons: the apparent compactness of its urban core and it has one of the world’s best transit systems. Yet, as is shown below, Zürich looks and feels denser than the reality experienced by its citizenry. Moreover the urban core is surrounded by a sea of anything-but-compact suburbanization, as is the case in Paris and virtually all other large Western urban areas. A visit confined to the smallish, but architecturally pleasing precincts of the core can lead to a profound misinterpretation of the urban form (See Louvre Café Syndrome: Misunderstanding Amsterdam and America).

    The City of Zürich (Stadt)

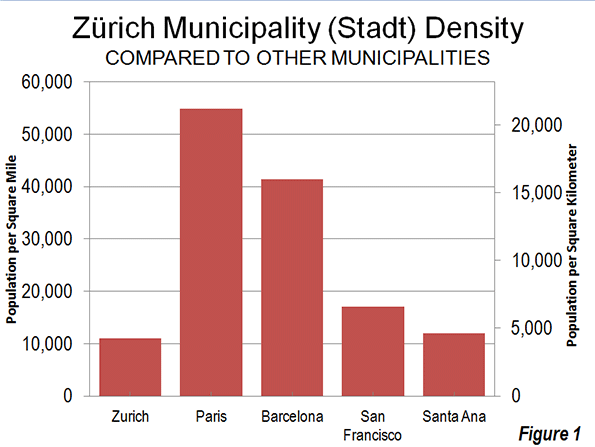
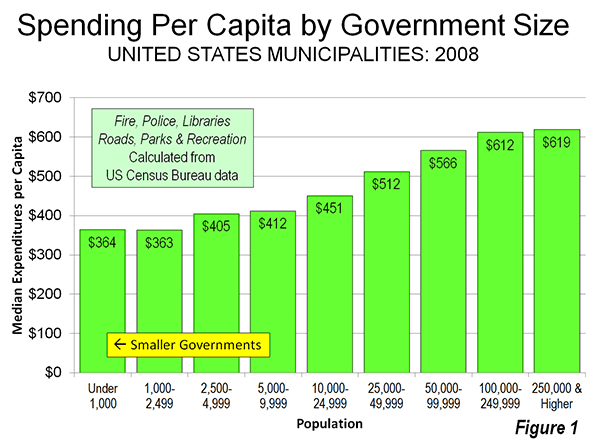
    Like virtually all European core cities that have not substantially annexed new land or consolidated with other jurisdictions, the city of Zürich has lost population. Zürich reached its population peak in 1960, with 440,000 people. Since that time, the population has fallen to 373,000, a loss of 15 percent. The city is not very dense despite its reputation to the contrary. The land area is 34 square miles/89 square kilometers, which yields a 2010 population density of 11,000 per square mile/4200 per square kilometer. This is less than two thirds the density of the city of San Francisco and similar to that of some Los Angeles suburbs, such as Santa Ana, Inglewood or Alhambra (Figure 1).

    The city is divided into nine districts. The densest, the 5th district, covers 1.1 square miles/2.9 square kilometers and has a density of 24,000 per square mile/9200 per square kilometer. By comparison, Westlake, the most densely populated community planning district in the city of Los Angeles covered three times as much land and had a population density of 34,000 per square mile/13,000 per square kilometer in 2000 (latest data available). This is 40 percent greater than the highest Zürich district density.

    The Urban Area

    According to the Federal Office of Statistics (FSO), the Zürich urban area (urban agglomeration) has a population of approximately 1.2 million and covers a land area of 420 square miles/1085 square kilometers. The population density is comparatively low, at 2800 per square mile/1075 per square kilometer.

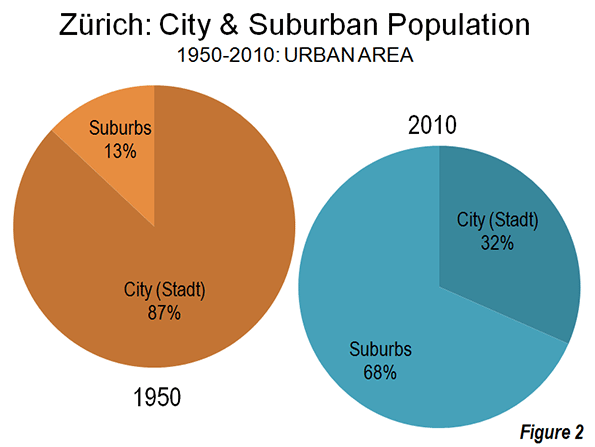
    Zürich’s development since World War II has mirrored the international trend towards suburbanization. In 1950, the urban area included the city of Zürich and 14 additional municipalities. The city, with a population of 390,000, contained more than 85 percent of the urban area population as defined at that time. Since 1950 all growth in the Zürich urban area has been in the suburbs. By 2010, the city of Zürich represented only 32 percent of the urban area population (Figure 2). Suburban areas account for 68 percent of the population and more than 90 percent of the urban land area.

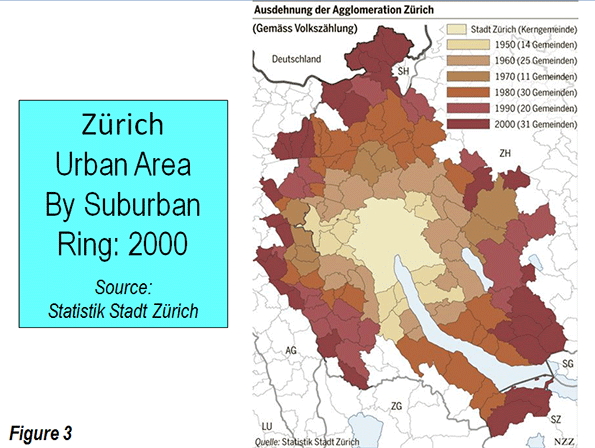
    At each decennial census year, FSO adds new municipalities to the urban area as appropriate. In 1950, the urban area included the city of Zürich as well as 14 additional municipalities. By 2000, the urban area included the city of Zürich and 130 other municipalities (Figure 3). FSO is reviewing 2010 census results and is likely to add more municipalities to the urban area within the next year. The population of the urban area as presently defined has nearly doubled since 1950. The population trend for the city of Zürich and the six suburban rings (as presently defined) is illustrated in the Table.

    Zürich Urban Area: Population of Core Municipality & Suburban Rings: 1950-2010
    1950 1960 1970 1980 1990 2000 2010
    Urban Area: (Agglomeration Zürich)   605,765   801,124   947,011   970,073   1,021,859   1,080,728   1,188,566
    City of Zürich (Stadt)   390,020   440,170   422,640   369,522      365,043      363,273      372,857
    1st Ring (1950)     59,324     97,124   132,014   136,787      135,777      138,936      153,674
    2nd Ring (1960)     45,989     73,560   120,492   140,088      154,226      168,812      192,469
    3rd Ring (1970)     13,396     19,135     44,178     59,823         67,567         73,364         82,693
    4th Ring (1980)     64,259     83,036   113,195   132,444      145,165      159,021      183,878
    5th Ring (1990)     32,777     41,483     52,329     60,240         72,402         82,862         94,244
    6th Ring (2000)     46,616     62,163     71,169         81,679         94,460      108,751
    1950 Population for 6th Suburban Ring (2000) Not Available
    Source: Statistik Stadt Zürich & FSO


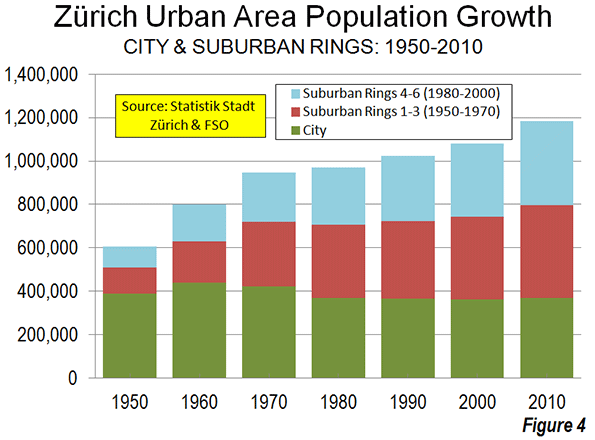
    In recent decades, population growth has gradually moved farther to the periphery of the urban area. This is illustrated by Figure 4, which shows a population trends for the city, the first three suburban rings (1950 to 1970) and the outer three suburban rings (1980 to 2000). By 2000, the three inner suburban rings exceeded the population of the city of Zürich. The outer three suburban rings passed Zürich in population by 2010 (Photo: Suburbs of Zürich).
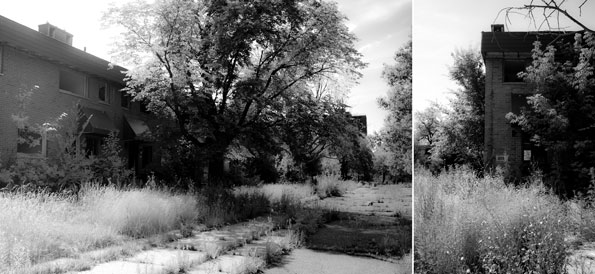
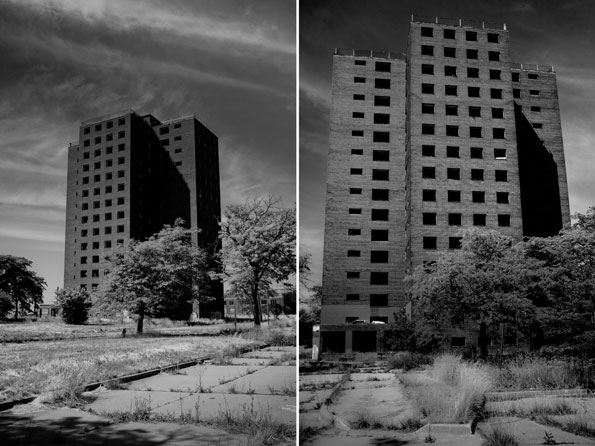
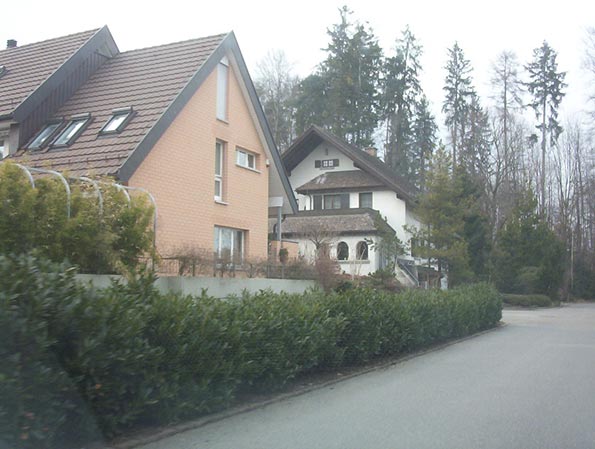
    Suburbs of Zürich

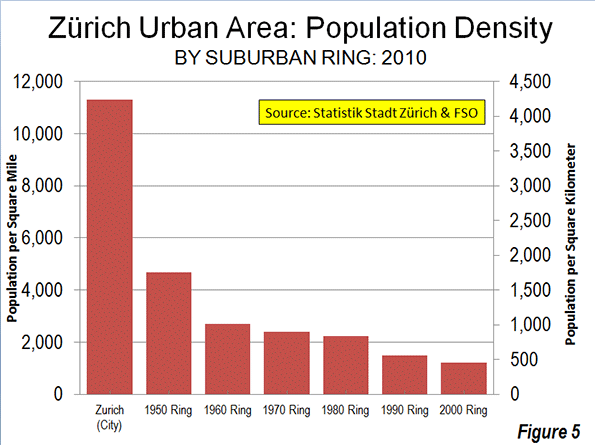
    Suburban densities are considerably lower than that of the city of Zürich. Suburban Zürich has an overall population density of approximately 2100 per square mile/800 per square kilometer. As would be expected, the population densities decline substantially with distance from the city of Zürich (Figure 5). The first ring suburbs (1950) have a population density of 4500 square mile/1800 per square kilometer. This is about a quarter higher than the aggregate suburban density of Portland or New York, but only two-thirds as dense as the Los Angeles suburbs. The lowest population density is in the sixth suburban ring (2000) at approximately 1200 per square mile/450 per square kilometer. This is slightly above the approximate 1000 per square mile/400 per square kilometer international standard used by national statistics agencies in designating urban areas (Note 1).

    Similarly, employment has become more dispersed as jobs follow residents toward lower density suburban areas. Less than 15 percent of the urban area’s employment is in the central business district, a figure similar to that the average of US, Canadian and Australian urban areas.

    Getting Around and To Zürich

    Zürich is served by one of the world’s most effective transit systems, which necessarily focuses on the central business district and provides an intense mesh of service in the core city. Among the approximately 90 urban areas of the world for which the Millennium Cities Database provides service information, Zürich ranked 22nd in transit service intensity (transit vehicle kilometers divided by urban area square kilometers), with a service-level approximately 15 percent that of Hong Kong (Note 3). Among the European urban areas surveyed, only Barcelona and Milan had more intense transit service.

    However, as is the case in all urban areas of Western Europe (as well as the United States, Canada and Australia), the overwhelming majority of motorized travel in the Zürich urban area is by car. Zürich’s automobile market share, in distance traveled, is approximately 75 percent, similar to that of Paris and approximately 15 percent below that of the New York, Toronto or Sydney urban areas.

    Zürich, as the nation’s largest urban area, is unique in not having been linked to its national freeway (motorway) system until recently. Only since 2009 has Zürich been connected to nearby Lucerne (only 30 miles/50 kilometers away) or beyond  through the St. Gotthard tunnel to Milan and the South. The new Uetliberg Tunnel (A4 motorway) connects to the exurb of Zug. For the first time Switzerland’s main north-south motorway connects to its principal route, the east-west A1 motorway   (Note 2).

    No motorway dissects the city of Zürich. However, a swath is cut through the city of Zürich by the national railway system. Starting at Zürich Station and extending to the north city limits, the railway divide is from 150 to 450 meters/650 to 1500 feet wide (Photo: Zürich Railway Divide). This may be wider than any freeway in the world. For example, the 26-lane Katy Freeway in Houston, the 18-lane Autopista Panamericana in Buenos Aires and the 14-lane MacDonald Cartier Freeway in Toronto all have average widths of 150 meters/650 feet or less.

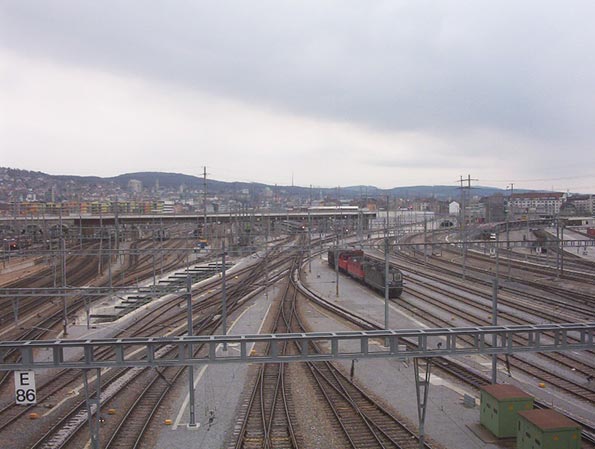
    Zürich Railway Divide (from Hardbrücke)

    Zürich: Compact Core, Suburban Reality

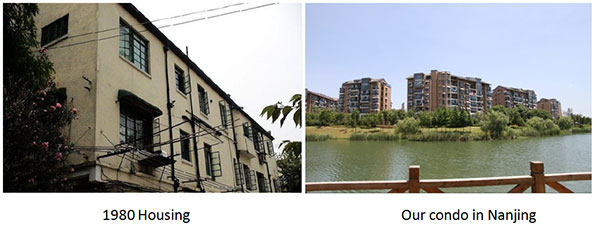
    Like urban residents throughout the high-income world, the residents of Zürich (and other Swiss urban areas) have chosen to live in larger, more comfortable houses, often with yards (gardens). At the same time, the historical urban core remains intact as a frequent or occasional destination for both tourists and residents, most of whom live in the suburbs.

    Wendell Cox is a Visiting Professor, Conservatoire National des Arts et Metiers, Paris and the author of “War on the Dream: How Anti-Sprawl Policy Threatens the Quality of Life.”

    —–

    Photo: Zürich Urban Core Street Scene (photos by author)

    Note 1: Such as INSEE (France), National Statistics (UK), Statistics Canada, United States Census Bureau, Census of India,

    Note 3: According to Millennium Cities Database information, only Manila had more intense transit service than Hong Kong (85 percent higher service intensity).

    Note 2: Switzerland speed limits are slow by European standards, but generally higher than those in the United States, Canada and Australia. The national speed limit on the motorway system is 120 kilometers per hour/75 miles per hour. Speed limits are higher in France and Italy at 130 kilometers per hour/81 miles per hour. In Germany, most of the autobahn system is not subject to speed limits. The highest speed limit in the United States is now planned for a new toll road (C-130) between San Antonio and Austin, at 85 miles per hour/137 kilometers per hour and on some other Texas and Utah roads at 80 miles per hour/129 kilometers per hour. Elsewhere in the United States, Canada and Australia, speed limits are lower than in Switzerland and nearly all Europe.

  • Brewster and Me: Photo Essay Exploring One of Detroit’s Notorious Abandoned Housing Projects

    This year marks the sixtieth anniversary of the Brewster-Douglass housing projects of Detroit Michigan and there is nothing to celebrate. More accurately, there is no one to celebrate. For several years now this section of the city, already infamous for its vacancy, has been completely abandoned. Rows of houses, full apartment blocks, schools empty.

    A cursory Google search will reveal many details regarding the architecture and planning employed at Brewster-Douglass . Diana Ross lived there. For my part, I didn’t want an explanation, but an experience.

    Throughout my years as an urban archeologist (an entirely fictitious title created to legitimate my somewhat antisocial tendencies), I have encountered and explored many beautiful and surreal derelict places. Churches, schools, insane asylums, power stations, you name it – many of these in Detroit itself. An entire abandoned neighborhood, though, had eluded my experience. Brewster-Douglass seemed like a good fit, the logical next step in my quest to photograph unseen urban space.  

    My online research regarding the Brewster-Douglass projects revealed almost nothing concerning the current internal state of the buildings. Friends would later tell me that even local explorers don’t venture inside the towers.  

    On my initial look over the massive property, I noticed that even the window-frames had been stripped from the four remaining 1952 brick towers. The roofs of the houses were torn to ribbons.  

    A car had to be stashed in some bushes, and where I would usually wait for traffic to die down before entry, I merely crossed the street. There were no other cars around. A maze of walkways made almost invisible by the overgrowth lead me past several rows of abandoned townhouses to a square, each corner marked by a virtually identical 14-storey red brick tower. Save for two benches, most of everything has been smashed to bits.

    "Great architecture has only two natural enemies: water and stupid men,” writes noted Chicago photographer Richard Nickel. The clouds in the sky that day were light, and there was no one around. So much for great architecture; this was Pruitt-Igoe without the wrecking ball.

    Let’s make a pilot for a television show here. We can call it ‘What Not to Plan’. I could see right through one house. Nature had made a convertible of its neighbor. Richard Nickel was buried alive when a section of a building he was documenting collapsed. I had better take care.

    From the roof of one of the towers, I gained a clearer view of the pathways below . In the middle sits the remains of a wooden playground, now splintered, scattered and sprayed. Here it is, Le Corbusier’s Radiant City — in ruins. I’ve found Paradise Lost, The Waste Land.   

    Visit this Flickr image set to view higher resolution versions of these photographs.

    If I were filling out a form for Brewster-Douglass, it would have many blank spaces, like the projects themselves — ‘not applicable.

    To understand Brewster-Douglass, one would have to understand Detroit. To understand Detroit, one would have to understand urban racial issues, the nature of the growth of cities, the nature of suburbs (‘sprawl’), and social demography. Economics might help as well. I do not pretend to understand any of these with any authority. I take photographs, and no, I don’t do weddings.

    Supposedly, plans for demolition of the Brewster-Douglass ruins have been set in order to make room for new housing developments. But like so much news from Detroit, I will believe it when I see it.  

    Visit this Flickr image set to view higher resolution versions of these photographs.

    Jonathan Castellino lectures on architectural photography at a school of restoration arts in Southern Ontario (CAN). His work has appeared in the Globe and Mail, Toronto Star, ToNight, Infiltration, Cardus’ Comment, and numerous city websites and publications.

  • Carmel, IN Named Best Small City in America to Live In But Can Others Follow?

    Money Magazine just named the Indianapolis suburb of Carmel as the top small city in America to live in. Fishers, another Indianapolis suburb, ranked #12.

    Any ranking survey, and particularly one done by a magazine, needs to be taken with a grain of salt. However, Carmel and Fishers (along with occasionally Noblesville), frequently show up high in various national rankings. For those interested in suburban living, these places offer a pretty strong combination of good schools, low real estate prices (Indianapolis is basically the cheapest big city housing market in America), low taxes, and fairly high quality of life. With populations of over 75,000 each, these communities also have the scale to efficiently provide quality public services.

    I personally think Fishers has long term sustainability issues. It has kept up with very rapid growth admirably, but it has really not done much to secure its long term future, and when it reaches buildout, I expect problems to set in.

    Carmel by contrast has invested heavily in building towards a future where greenfield growth is no longer the driver. It has invested in high quality public facilities, some of the best suburban transportation infrastructure in the nation, building new urbanist neighborhoods from scratch, upgrading utilities, improving the environment, etc. Dan McFeely of the Indianapolis Star covers Carmel and wrote a bit about this.

    I’ve covered Carmel extensively for years here on the blog, calling it the “next American suburb” and writing about its civic strategy, new urbanist approach, and various criticisms of its leadership.

    I think the Carmel story is an interesting one because it shows how a city, albeit an affluent one, in a very conservative state can fundamentally transform itself in a way that that demonstrates results. This includes urbanism standards and infrastructure standards that exceed those of the urban core of Indianapolis, with many of its public services being better as well.

    The results most notably show up in incomes. While incomes cratered relative to the US in both Indiana and metro Indianapolis, Carmel’s median household income actually inched up versus the US average despite starting from a higher base.

    In short, the strategy has been working, though obviously the national economy has had an effect. And I don’t necessarily support everything they have done. Their $150 million performing arts center, for example, all paid for with public funds, seems expensive for a city of this size, and has saddled the city’s redevelopment commission with debt. But on the whole, things seem to be paying dividends.

    This is part of the explanation for why Indianapolis as a region has done well while its urban core lags many other cities. The majority of people prefer suburbs, and Indy’s newer suburbs provide an exceptional value proposition.

    Ultimately to be successful, the region will have to fire on all cylinders. This means both urban and suburban, with each neighborhood and town bringing a unique approach and its A game to the table. It’s not an either/or situation. I want to build urban cores up, not tear suburbs down. (Downtown Indianapolis has its own game going. Despite some recent criticisms that I stand behind, downtown Indy has positive momentum in a lot of areas. For example, another 300 tech jobs were just announced yesterday).

    I previously highlighted Columbus, Indiana, which has accomplished something similar in a more blue collar environment. So positive stories based on different variations of the same playbook aren’t limited merely to upscale suburbs.

    In a state that has long lagged the nation in job and output growth, and where the very large decline in relative incomes has been a huge issue at all levels, you would think that leaders would be streaming in to study these successful models.

    Alas, that is not the case. Not only is there little interest in learning from models that are actually working (save perhaps for other Indy suburbs looking to Carmel), there’s actual hostility. It’s as I said in some recent posts: Indiana actively discourages the pursuit of excellence. They’d rather cut down the successful than bring up the failing. State level policy choices are trying to do just that.

    Start with school funding. As part of a property tax reform process, the state of Indiana took over 100% of all local school operating funding. However, they also changed the funding formula in a way that stuck well performing metro Indy districts at the bottom of the pile. Out of about 360 school districts statewide, Carmel is fourth from the bottom in per pupil funding from the state. Other regional districts like Fishers and Zionsville are also at the bottom. In effect, the state decided to starve fast growing and well performing suburban districts. Somehow this didn’t make the list of education reforms in that recent Economist article. For a state that claims to want to base its economic future on things like life sciences, this sure seems puzzling.

    The state has also sought to impose a one size fits all, least common denominator approach to services. While it didn’t affect Carmel directly since they already built their first class library, the state’s Department of Local Government Finance vetoed plans by the suburbs of Westfield and Greenwood to build new libraries (partially inspired by Carmel), even though the bonding plans survived a petition challenge. The state’s rationale was that the cost per resident was higher than the state average. It’s easy to see that a policy like this acts as a one way downward ratchet.

    The state also passed a law that not only capped property taxes as a percentage of assessed value – a measure I support – but also put in place a de facto spending freeze for all cities at current levels through a levy cap.* (This levy cap ignores growth in commercial tax base, so if a town built a 50 million square foot industrial park, it wouldn’t even be able to raise the revenues to provide services to it).

    This has left cities increasingly depending on gimmicks to finance anything. And every time a city figures something like that out, the state makes noises about shutting it down. The state has also refused to allow communities to even let their own citizens vote in favor of spending money on things like transit. Indiana has never particularly empowered municipalities, but recent years have seen a strong turn towards disempowerment, with the state’s General Assembly serving as a sort of uber-city council (and now uber-school board too).

    I’d be willing to venture that neither Carmel nor Columbus would be able to accomplish what they have if they were starting out on the journey today under the current state legal and political climate.

    This is not to say that spending money is a solution to problems. Actually, by national standards, places like Carmel and Columbus don’t spend very much money at all. With some exceptions like that performing arts center, they are actually quite frugal. They understood the concept of long term total cost of ownership, and as a result have kept taxes low by not being penny wise, pound foolish in the short term, while so many other places that thought only about the now have descended into a near death spiral of service cuts, tax increases, and abandonment. That’s the tragedy.

    In a rational world, one would think that we’d look at models that are producing population growth, job growth, corporate (including foreign) investment, high quality of services and quality of life, keeping incomes at or above US levels – and mostly importantly all while keeping taxes well below normal (at the bottom of the state in Carmel’s case) even by the standards of Indiana – and say to ourselves: how can we get more of that? Unfortunately, that’s not the case here. (Again, some other Indy suburbs excepted).

    Before proposing solutions to Indiana’s long term under-performing economy, I would suggest that the candidates for governor first take a look around the state to examine at the places that are already doing well and have been doing well over the last decade or more. Then ask the question: what are they doing different and right and what do we need to do to get other places doing those things? First among the places to visit would be suburbs like Carmel and industrial cities like Columbus. If you’re ranked #1 in America, you must be doing something right.

    * This is complicated, but my understanding is that the total property tax levy cannot grow faster than inflation + population growth. This has had many perverse incentives, including keeping entities like townships from lowering their tax levy even when possible because they’re afraid they’ll never be able to raise it again if needed.

    Aaron M. Renn is an independent writer on urban affairs and the creator of Telestrian, a data analysis and mapping tool. He writes at The Urbanophile, where this piece originally appeared.

    Carmel City Hall photo by Bigstock.

  • The Growing Number of Freelancers in Entertainment

    When people were preparing eulogies for the entertainment sector, Techdirt’s Mike Masnick popped out with his bold piece, “The Sky is Rising,” and poked holes in the gloomy forecast. His scrutiny of the numbers revealed that the entertainment industry is actually growing. Entertainment consumption per household increased from 2000 to 2008. Employment in the entertainment sector jumped 20% from 1998 to 2008. And the number of independent artists rose 43% over the same period.

    While the outlook for the sector might not be quite as sunny as Masnick indicates in his report (case in point: the share of household income spent on entertainment has declined every year since 2008), it’s true that entertainment employment is on the rise. Over the last decade-plus, the number of entertainment and sports-related jobs — a group of 10 occupations that includes actors, musicians, and dancers, as well as coaches and referees, etc. — has grown 30%.

    But much of this job growth, especially since the recession, is not of the traditional wage-and-salary variety. Instead, EMSI’s new class-of-worker data shows that proprietors account for 242,000-plus, or nearly 80%, of the jobs added since 2001 in the main entertainment and sports-related occupations. This includes workers whose main income comes from self-employment, and even more so those doing side gigs in addition to their day job (what EMSI labels as “extended proprietors” but might better be referred to as freelancers in this case).

    Note: EMSI’s employment estimates are a count of jobs, not a count of workers. One person can hold more than one job, and this is particularly the case with the types of worker activity tracked in our extended proprietor dataset.

    ENTERTAINMENT-RELATED JOBS (2001-2012)
    Source: EMSI 2012.2 Class of Worker
    2001 Jobs 2008 Jobs 2012 Jobs % Growth Since 2001 % Growth Since 2008 Avg. Hourly Wage
    Wage-and-Salary 492,960 549,333 556,765 13% 1% $19.32
    Self-Employed & Extended Proprietors 512,383 685,773 755,137 47% 10% $17.24
    Total 1,005,343 1,235,106 1,311,902 30% 6% $18.15


    Since 2001, employment in entertainment and sports among wage-and-salary workers (those who draw benefits and pay into the unemployment insurance program) has increased 13%. This is a solid gain, but consider that since ’08, the heart of the recession, the job gains have been minimal (1% growth, or 7,432 jobs added).

    But look at the self-employed and extended proprietors row in the above table: this part of the entertainment and sports-related workforce has mushroomed 47% since ’01, and 10% since ’08.

    The growth in proprietors makes sense when you think about the work being done in these fields — moms and dads coaching their kids (or serving as referees) in soccer, office workers moonlighting in a band that does local gigs, men and women working part-time for the local stage company as an actor or director. These are just a few examples. But it’s clear businesses that hire these types of workers require or prefer freelancers or part-timers; it’s just the nature of the work. And as families’ budgets get tighter or single people need extra (or any) income, these jobs are a welcomed option, at least in the short term.

    There are still more than a half million salaried jobs in these fields. But increasingly, freelance workers are becoming the norm in entertainment and sports.

    The Workforce Breakdown

    Overall, 58% of the “entertainers and performers, sports and related” workforce, as it’s classified by the Bureau of Labor Statistics, is made up of proprietors. That’s up from 51% in 2001 and 56% in 2008.

    The largest occupation in this sector, musicians & singers, is predominantly composed of those who do work on the side. Just over 265,000 of 440,000-plus musician jobs in the US fall under EMSI’s extended proprietor category, and there are nearly as many self-employed musicians (73,875) as traditional W-2 musicians (102,628).

    Musicians aren’t alone in this trend, of course. Of the 118,000-plus estimated actors in the US, almost half are extended proprietors and another 18,520 are self-employed. Dancers, coaches & scouts, and others have a similar labor force breakdown.

    The highest percentage growth since 2001 among these 10 occupations has come in coaches and scouts (51%). Second is actors at 42%; of the 34,706 new actors jobs in the last decade-plus, all but 2,230 have come in the self-employed and extended proprietor categories.

    SOC Code Description 2001 Jobs 2012 Jobs Change % Change Median Hourly Wage Education Level
    Source: EMSI 2012.2 Class of Worker – QCEW Employees, Non-QCEW Employees, Self-Employed, Extended Proprietors
    27-2011 Actors 83,451 118,157 34,706 42% $16.54 Long-term on-the-job training
    27-2012 Producers and Directors 126,576 124,670 -1,906 -2% $28.86 Bachelor’s or higher degree, plus work experience
    27-2021 Athletes and Sports Competitors 28,335 38,520 10,185 36% $27.30 Long-term on-the-job training
    27-2022 Coaches and Scouts 198,681 299,509 100,828 51% $13.89 Long-term on-the-job training
    27-2023 Umpires, Referees, and Other Sports Officials 25,547 34,447 8,900 35% $11.31 Long-term on-the-job training
    27-2031 Dancers 29,914 37,496 7,582 25% $14.70 Long-term on-the-job training
    27-2032 Choreographers 17,343 22,628 5,285 30% $18.30 Work experience in a related occupation
    27-2041 Music Directors and Composers 65,593 79,927 14,334 22% $19.31 Bachelor’s or higher degree, plus work experience
    27-2042 Musicians and Singers 324,934 441,882 116,948 36% $18.01 Long-term on-the-job training
    27-2099 Entertainers and Performers, Sports and Related Workers, All Other 104,970 114,665 9,695 9% $18.47 Long-term on-the-job training
    Total 1,005,343 1,311,902 306,559 30% $18.15


    Across the board, the job growth numbers look radically different if we take out proprietors. Looking just at EMSI’s QCEW dataset, which corresponds to published Quarterly Census of Employment and Wages data, only four of these occupations have had double-digit growth since ’01: coaches and scouts (39%); choreographers (32%); entertainers and performers, sports and related workers, all other (15%); and music directors and composers (13%).

    Top Metros for Entertainment

    We all know New York City and Los Angeles are major entertainment hubs. But EMSI’s data is still startling: The nation’s two largest cities account for nearly 1 out of every 5 entertainment and sports-related jobs in America. The New York City metro area has the most jobs in entertainment and sports-related fields of any MSA (with more than 116,000 estimated in 2012), followed by L.A. (112,528). These two have nearly four times the number of jobs as Chicago, which has the third-most in the US at nearly 37,000.

    Of the 50 most populous metros in the U.S., Los Angeles is also the most concentrated in entertainment and sports-related workers. With a location quotient of 2.06, L.A. is more than twice as concentrated as the national average of 1.0. Nashville, with an LQ of 2.02, is close behind, followed by San Francisco, New York, Las Vegas, and Austin, Texas.

    Since 2008, Austin has blown away every other big metro in terms of its job growth in entertainment and sports jobs (18.4%). Second is Richmond, VA (13.4%).

    ENTERTAINMENT-RELATED JOBS IN 50 LARGEST METRO AREAS
    Source: EMSI 2012.2
    MSA Name 2012 Jobs 2008-2012 Percentage Growth Median Hourly Earnings 2012 National Location Quotient
    Los Angeles-Long Beach-Santa Ana, CA 112,528 1.3% $26.22 2.06
    Nashville-Davidson–Murfreesboro–Franklin, TN 15,442 7.8% $22.12 2.02
    San Francisco-Oakland-Fremont, CA 30,667 5.6% $23.80 1.51
    New York-Northern New Jersey-Long Island, NY-NJ-PA 116,234 7.9% $23.81 1.43
    Las Vegas-Paradise, NV 10,242 5.0% $21.14 1.29
    Austin-Round Rock-San Marcos, TX 10,421 18.4% $16.51 1.27
    Orlando-Kissimmee-Sanford, FL 11,380 5.4% $17.42 1.22
    Portland-Vancouver-Hillsboro, OR-WA 11,953 6.2% $16.01 1.21
    Salt Lake City, UT 7,480 9.1% $18.46 1.20
    Boston-Cambridge-Quincy, MA-NH 26,143 5.1% $20.53 1.14
    New Orleans-Metairie-Kenner, LA 5,906 6.5% $15.85 1.13
    Seattle-Tacoma-Bellevue, WA 18,608 6.1% $19.06 1.13
    Minneapolis-St. Paul-Bloomington, MN-WI 17,912 4.0% $18.94 1.11
    Atlanta-Sandy Springs-Marietta, GA 24,329 12.9% $19.39 1.06
    Washington-Arlington-Alexandria, DC-VA-MD-WV 30,413 7.5% $19.64 1.06
    Milwaukee-Waukesha-West Allis, WI 7,385 -0.2% $16.21 1.05
    Denver-Aurora-Broomfield, CO 12,975 0.4% $18.08 1.04
    Hartford-West Hartford-East Hartford, CT 5,842 8.5% $19.33 1.02
    Indianapolis-Carmel, IN 8,184 11.3% $16.60 1.02
    Kansas City, MO-KS 9,226 10.7% $16.17 1.01
    Providence-New Bedford-Fall River, RI-MA 6,235 3.0% $16.47 1.00
    Raleigh-Cary, NC 4,897 8.7% $15.55 1.00
    Birmingham-Hoover, AL 4,713 5.6% $14.64 0.99
    Dallas-Fort Worth-Arlington, TX 28,900 13.2% $18.42 0.96
    Richmond, VA 5,363 13.4% $15.50 0.95
    Tampa-St. Petersburg-Clearwater, FL 10,409 9.5% $17.60 0.95
    St. Louis, MO-IL 11,182 2.7% $18.81 0.94
    Cleveland-Elyria-Mentor, OH 8,465 4.4% $14.95 0.93
    Sacramento–Arden-Arcade–Roseville, CA 7,844 1.2% $17.26 0.93
    San Diego-Carlsbad-San Marcos, CA 12,478 1.4% $21.90 0.93
    San Jose-Sunnyvale-Santa Clara, CA 7,991 8.2% $19.51 0.92
    Baltimore-Towson, MD 11,283 2.7% $18.28 0.91
    Jacksonville, FL 5,305 12.2% $17.98 0.91
    Charlotte-Gastonia-Rock Hill, NC-SC 7,130 5.4% $18.80 0.90
    Chicago-Joliet-Naperville, IL-IN-WI 35,828 4.8% $16.91 0.89
    Philadelphia-Camden-Wilmington, PA-NJ-DE-MD 21,974 7.3% $18.29 0.89
    Cincinnati-Middletown, OH-KY-IN 8,041 5.8% $17.61 0.88
    Columbus, OH 7,586 8.0% $16.84 0.88
    Miami-Fort Lauderdale-Pompano Beach, FL 20,187 5.4% $22.13 0.86
    Pittsburgh, PA 8,991 10.8% $17.61 0.86
    Louisville/Jefferson County, KY-IN 4,743 5.6% $15.98 0.85
    Detroit-Warren-Livonia, MI 13,422 0.0% $16.29 0.81
    Buffalo-Niagara Falls, NY 3,768 -0.2% $15.66 0.80
    Memphis, TN-MS-AR 4,531 7.0% $16.74 0.80
    Oklahoma City, OK 4,534 11.9% $15.62 0.79
    Virginia Beach-Norfolk-Newport News, VA-NC 5,814 4.8% $14.31 0.79
    Phoenix-Mesa-Glendale, AZ 13,194 6.7% $18.27 0.78
    Riverside-San Bernardino-Ontario, CA 9,203 1.6% $18.51 0.76
    San Antonio-New Braunfels, TX 6,732 11.2% $16.98 0.76
    Houston-Sugar Land-Baytown, TX 18,270 11.8% $18.87 0.69


    What About All MSAs?

    Among all MSAs in the US with at least 500 jobs in these fields, the highest concentration in the entertainment and sports-related sector belongs to Edwards, Colorado, which is just west of the resort community of Vail (home to the Vail Jazz Festival). The Edwards MSA has just 1,100 estimated entertainment and sports-related jobs. But with a location quotient of 8.42, it is more than eight times as concentrated as the national average in these fields.

    Next is an MSA that you’d probably expect to see this high on the list: Santa Fe, New Mexico (with an LQ of 4.01). Sante Fe is known for its art galleries, museums, and other tourist-friendly sites, and it has more than 2,000 entertainment and sports-related jobs.

    Joshua Wright is an editor at EMSI, an Idaho-based economics firm that provides data and analysis to workforce boards, economic development agencies, higher education institutions, and the private sector. He manages the EMSI blog and is a freelance journalist. Contact him here.

    Film crew photo by Bigstock.

  • Obama Fuel Economy Rules Trump Smart Growth

    The Environmental Protection Agency (EPA) has just finalized its regulation requiring that new cars and light trucks (light vehicles) achieve average fuel efficiency of 54.5 miles per gallon (MPG) by 2025 (4.3 liters per 100 kilometers). This increase in the "CAFE" standard (Corporate Average Fuel Efficiency) is the second major step in the Obama Administration’s program to improve light vehicle fuel efficiency. In 2010, EPA adopted regulations requiring 35.5 MPG average by 2016 (6.6 liters per 100 kilometers).

    The EPA standard is based upon carbon dioxide (CO2) grams emitted per mile of light vehicle travel, with an average of 163 grams per mile (101 per kilometer) to be achieved in 2025. This is slightly above the 2020 European Union standard of 152 grams per mile (95 grams per kilometer). Of course, the regulations have both supporters and detractors, with the automobile manufacturers being among the supporters.  

    Assuming the objectives are met, the reductions in CO2 emissions will dwarf the modest gains forecast from anti-suburban smart growth policies. For decades, this powerful movement has sought to limit or prohibit suburban expansion and even outlaw the detached housing that most people prefer. This includes railing against automobile use and seeking to coerce people out of their cars (as expressed by Secretary of Transportation Ray LaHood).

    The anti-suburban movement has many labels in addition to "smart growth," such as “densification policy," "compact cities," "growth management," "urban consolidation," etc. The origins can be traced back to just after World War II, with the enactment of the British Town and Country Planning Act. The policy origins of smart growth in the United States date from the 1960s (the state of Hawaii) and 1970s (the state of Oregon and California local jurisdictions).

    Forecast CO2 Emission Reductions from Smart Growth

    With concerns about greenhouse gas (GHG) emissions (principally carbon dioxide, or CO2), proponents saw the opportunity to force people back into the cities (from which most did not come) and turn smart growth into an imperative for "saving the planet." This is no exaggeration. As late as last month, this was claimed by fellow panelists at a Maryland Association of Counties conference. As is indicated below, the data shows no such association.

    Even forecasts by proponents fall short of demonstrating an apocalyptic necessity for smart growth. The Cambridge Systematics and Urban Land Institute Moving Cooler report attributed only modest reductions in CO2 emissions to smart growth’s land use and mass transit policies (Moving Cooler was criticized on this site by Alan Pisarski. See ULI Moving Cooler Report: Greenhouse Gases, Exaggerations and Misdirections). The data in Moving Cooler suggests an approximately 50 million ton reduction in CO2 emissions from these smart growth strategies by 2035 (interpolating between 2030 and 2050 figures).

    The more balanced Transportation Research Board Driving and the Built Environment: The Effects of Compact Development on Motorized Travel, Energy Use, and CO2 Emissions  produced similar figures, however it indicated skepticism about whether their higher range projections were "plausible."

    Comparing Smart Growth to the Previous Fuel Economy Standard

    At the 2005 fuel economy rate and the projected driving increase rate in the US Department of Energy Annual Energy Outlook:2008 (AEO), CO2 emissions from light vehicles would have increased 64 percent from 2005 to 2035 (Note 1). This could be called the "baseline" case or the "business as usual" case. This would have resulted in a CO2 emissions increase from light vehicles of approximately 0.75 billion tons.

    Using the more aggressive Moving Cooler forecast, the smart growth transport and land use strategies would only minimally reduce CO2 emissions from the baseline case (64 percent above 2005 levels) to 60 percent. This is "chicken feed" (Figure 1).

    Forecast CO2 Emission Reductions from the 54.5 MPG Standard

    Under the previous 35.5 MPG standard, AEO:2008 and AEO:2012,  a 19 percent reduction in CO2 emissions from cars and light trucks would occur from 2005 to 2035. We modeled the new regulations based upon AEO:2012 forecasts for the earlier regulation. This yielded a 2035 CO2 emission reduction of 35 percent from 2005 (Figure 2), despite a healthy one-third increase in driving volumes over the period. The calculation also includes an upward adjustment for the rebound effect, as lower costs of driving encourage people to drive more, which EPA estimates at 10 percent ("induced traffic"), which is indicated in Figure 3.


    Achievement of the 54.5 MPG standard would reduce CO2 emissions from light vehicles from 1.9 billion annual tons in 2035 under the 2005 baseline to approximately 0.750 billion metric tons in 2035. Approximately 70 percent of the decline in CO2 emissions would be from improved fuel economy, while 30 percent would be from slower annual increase in vehicle travel that has been adopted in AEO:2012 (Figure 4). The increase in driving is now forecast at 33 percent from 2005.

    The contrast between the potential CO2 emissions from smart growth and fuel economy is stark. By comparison, the annual overall reduction in CO2 emissions (from the 2005 baseline) would be virtually equal to the 30 year impact of smart growth (Figure 5).

    Comparison with Transit

    The 35.5 MPG standard would make cars and light trucks less CO2 intensive than transit. At work trip vehicle occupancy rates, the average new light vehicle would emit less in CO2 per passenger mile in 2016 than transit in all but eight of the nation’s 51 metropolitan areas over 1,000,000 population. The 2025 54.5 MPG standard would drop that number to two (Note 2). Even before these developments, there was only scant potential for replacing automobile use with transit (much less walking or cycling) because of its long travel times. According to data in a Brookings Institution report, less than 10 percent of jobs in the largest metropolitan areas can be reached by the average resident in 45 minutes on transit (Note 3).

    Smart Growth: Not Needed to "Save the Planet"

    Smart growth is an exceedingly intrusive policy that would attempt to enforce personal behaviors,    counter to people’s preferences, by attempting to dictate where people live and how they travel. This is expensive as well as intrusive. It is also detrimental to the economy, which is already taking a toll in lower household discretionary income (especially from higher house prices) and stunted economic growth.

    A report by The McKinsey Corporation and The Conference Board  indicated that sufficient CO2 emissions could be achieved with "…no downsizing of vehicles, home or commercial space and traveling the same mileage" and "…no shift to denser housing." Or, more directly, smart growth is unnecessary, in addition to producing little "gain" for the "pain."

    Wendell Cox is a Visiting Professor, Conservatoire National des Arts et Metiers, Paris and the author of “War on the Dream: How Anti-Sprawl Policy Threatens the Quality of Life.”

    —-

    Note 1: The 2030 to 2035 driving volume is estimated using the annual percentage increase from 2025 to 2030 in AEO: 2008, which has data through 2030.

    Note 2: Calculated from 2010 National Transit Database summary by Randal O’Toole of the Cato Institute. These calculations assume the 250 gram per mile standard for new light vehicles in 2016 and the vehicle occupancy ratio of 1.13 for work trips from the 2009 National Household Travel Survey.

    Note 3: Limited transit access is not just an American problem. In Paris, with arguably the best transit system in the western world, the average resident of a suburban new town on the regional metro (RER) can reach twice as many jobs by car as by transit in an hour, according to Fouchier and Michelon.

    Prius photo by Bigstock.

  • The Creative Destruction of Creative Class-ification

    Bits and pieces of ideal cities have been incorporated into real ones; traffic projects and housing schemes are habitually introduced by their sponsors as at least preliminary steps to paradise. The ideal city gives us the authority to castigate the real one; while the sore itch of real cities goads us into creating ideal ones. Jonathan Raban, from Soft City

    There’s a spot in Cleveland that is becoming what many had hoped for: a bit vibrant, a bit hip, with breweries, local retail, and farm-to-table restaurants turning that hard rawness of a disinvested Rust Belt city strip into a thing less raw.

    Actually, the current mix of grit and slight refinement works well on Cleveland’s W. 25th St in Ohio City. Characters abound. The racial and class mixing feels both natural and unforced. Place authenticity is there, aided no doubt by the presence of the 100-year old West Side Market anchoring what is an emerging neighborhood identity of an area where one can get a bite or sip of Cleveland amidst its architectural integrity. And the distinctive Cleveland-ness of it all is becoming ever more attractive, especially to those looking for something beyond that sea of cities sanitizing their urban terroir.

    West Side Market at night. Courtesy of the Plain Dealer

    I just wonder if the inevitable will happen.

    The inevitable, of course, is called “success”. Often, in the creative class-ification of the urban environment, “success” commonly proceeds this way: an area seeps in its own disability to achieve “highest and best use”—yet it’s cheap, intriguing even, particularly due to “the creative allure of urban grit”. Artists and bohemians make a home and create. A scene unfolds, thus laying the sluice gates toward beautification. Food and coffee places soon come to fill need. Retail locates near the foot traffic. Investment begets investment until all the dead buildings are freshly coated. The professional creative class eventually brings in the rear, effectively dictating a claim of “highest and best use”. Market studies by developers get corporate chains interested. Homogeneity ensues via the unforgiving force that is the economy of space, with income, race, and viewpoint converging into a slice of the urban electorate. This convergence is often presumed to result in the explosion of ideas via agglomeration of knowledge. But suppose it simply results in the deadening of insight via an agglomeration of group think.

    Take the case of Portland. It is a creative class darling, with the young and educated demographic inmigrating rapidly over the past decade. Proponents of the creative class suggest it is Portland’s place-based amenities—its density, its array of bike paths and coffee shops, its craft brews and locavore scene—that is attractive to the psychology of the mobile and modish. Let’s suppose this is true. No suppositions are necessary, however, when inferring what the decade-long demographic shift has done to the diversity of the city’s inner core.

    From an article entitled “In Portland’s heart, 2010 Census shows diversity dwindling”, the author writes:

    “Portland, already the whitest major city in the country, has become whiter at its core even as surrounding areas have grown more diverse…The city core didn’t become whiter simply because lots of white residents moved in…Nearly 10,000 people of color, mostly African Americans, also moved out…As a result, the part of Portland famous for its livability — for charming shops and easy transit, walkable streets and abundant bike paths — increasingly belongs to affluent whites.”

    Of course the irony here is that diversity and tolerance is said to attract a subgroup of forward-looking folks who then congregate using the grease of spatial economics to force said tolerance and diversity out. Given that diversity and tolerance have been argued to be key engines to idea production and subsequent economic growth, perhaps it’s no surprise Portland has not grown economically, regardless of the strained narrative stating otherwise.

    Diversity of people are not the only victims to creative class-ification, so is diversity of place. From a recent Atlantic Cities article, the former owner of the popular Mama’s Bar in the East Village talked about his taxes skyrocketing 380% as the reason he had to close. Later, the owner wonders about the cost of NYC’s decision to world-class the hell out of its urban intricacy and ambiguity:

    I think the thing that makes this city unique is it does have different neighborhoods that are specific and unique unto themselves. They have their own personality. What has happened — and I don’t want to blame the mayor, because it’s the evolution of the city — but things have become so expensive here…the only way businesses can survive in these neighborhoods is if they’re banks or corporate chains. These neighborhoods are being whittled down into carbon copies of each other.


    Mama’s Bar, now closed. Courtesy of community54.com

    Echoing this sentiment, the New York Times just ran an op-ed from the blogger at Vanishing New York about how the place-making standard bearer the High Line has created for a stretch of people lined like cattle amidst a neighborhood increasingly delineated into a pasture of consumption, not a hive of innovation. The author writes:

    [T]he idea was enticing: a public park above the hubbub, a contemplative space where nature softens the city’s abrasiveness…

    …My skepticism took root during my first visit. The designers had scrubbed the graffiti and tamed the wildflowers. Guards admonished me when my foot moved too close to a weed…

    …The neighborhood has since been completely remade. Old buildings fell and mountain ranges of glassy towers with names like High Line 519 and HL23 started to swell…

    Since the op-eds running, the blogger, Jeremiah Moss, has been derided as regressive, an obstructionist, with one commentator on his blog accusing Moss of being “a lazy critic” who is “not interested in either exploring the nature of our changing urban environment or discussing the merits of the [High Line’s] design”. But these critics miss Moss’s point, or that place-making is not simply about beauty, but so too the motive behind beautification. Often, that means economic gain, and often: that means at any cost. From a post in Art Info:

    The High Line — being such an alluring work of design — became, quite literally, a lure to attract groups powerful enough to steamroll socioeconomic diversity and reconstruct the neighborhood into a more glamorous version of New York.

    This was not how it was supposed to go. In a piece in Parks and Recreation, the author describes creative class theorist Richard Florida’s exemplifying of the High Line as an example of “communities transforming old industrial-age infrastructure into unusual and magnetic parks”. Florida explains many cities are figuring out that place has worth, and are prioritizing accordingly:

    The good news is that some cities have come to understand that great parks can rally citizens and hold communities together…and the most far-seeing mayors realize that.

    What is less discussed is how publicly-subsidized parks and other place-based jewels can be used as a hammer to polish out the vicinity around them; that is, how parks can be co-opted to break communities apart.

    Don’t get me wrong. I think place-making has its place. But its Frankenstein effects can’t be ignored. As—again—there is a contradiction at play in creative class theory; namely, that the preconditions of success: diversity, density, and tolerance, can create for a “success” that eats diversity and tolerance, particularly in those “special sauce” dense spots like East Village and downtown Portland that are harmonized to be vessels for new knowledge and thus new economies. In fact it can be argued that such outcomes deaden the long-term growth of cities in that traditional geographic and cultural hearts are being sold for the “gimme now” gains of taxation on objects from coffee to condos. And really: there is nothing much cool or creative about that. Rather, it’s selling your city to the highest bidder. It is mountains turned to coal.

    East Village Condo. Courtesy of http://cityofstrangers.net/

    Looking back, maybe this was all to be expected. Layering a cellophane of universal cool over the topography of distinct places to attract a slice of the urban electorate—many of which have no clue about the genius loci of each place—well, what would one expect?

    Still, there are lessons to be had here. Lessons for cities. Here’s hoping that those so-called failed and dead cities like Cleveland can resist getting their spots of raw locality from being entirely scrubbed out. In fact, in a world of inauthenticity it will be cities of realness that provide for environments fostering a stimulation of thought. It will be these cities collecting the hemorrhaging of thinkers and doers that can no longer stand the plasticity derived from the mold of “highest and best use”. It will be these cities providing for the creative destruction of creative class urbanity.

    Richey Piiparinen is a writer and policy researcher based in Cleveland. He is co-editor of Rust Belt Chic: The Cleveland Anthology. This piece originally appeared at his blog.

    Downtown Cleveland photo by Bigstock.

  • Livable China

    Recently, the McKinsey Global Institute published its report ‘The Most Dynamic Cities in 2025‘ in Foreign Policy, a highly respected US journal. On this list, 27 mainland Chinese cities as well as Hong Kong took top spots alongside Shanghai and Beijing, leaving many other world-renowned metropolises far behind.

    As a Chinese who has lived through China’s transformation over the past two decades, I was hardly surprised by the results of this report. What really shocked me was the doubt and controversy that this report generated in western media, especially the negativity in the heated discussions published in the very same issue of Foreign Policy.

    Among these, I was most taken aback by Mr. Isaac Stone Fish’s article ‘Unlivable Cities’. Having lived in several different Chinese cities over a 7-year period, Mr. Fish should be able to provide an objective prospective about China. Unfortunately, the takeaway from his article, in his own words is: ‘For all their economic success, China’s cities, with their lack of civil society, apocalyptic air pollution, snarling traffic, and suffocating state bureaucracy, are still terrible places to live.’

    First of all, when it comes to civilization, there are very few countries where civil society can be traced back 5000 years like China. Today’s China may be in some aspects less civilized compared with the more developed countries, but China has come a long way in creating a more civilized society in recent years. When the People’s Republic of China was founded in 1949, the illiteracy rate was more than 80% in China, but as of today, the illiteracy rate among Chinese born after 1980 is under 1%. In cities, 80% of students go on to post-secondary studies. These highly educated young Chinese will undoubtedly redefine China’s civilization. When it comes to parenting, the 80s generation, now mostly young parents, are studying how to be a parent, which would have been unheard of just a decade ago.

    The new Chinese parents are teaching their kids to use polite expressions like ‘thank-you’ and ‘sorry’, something generally neglected in the past. Pioneer cities like Shanghai and Guangzhou opened ‘Manner and Etiquette’ classes in most of their primary and high schools starting in 2006. Our education system is changing as well, gradually switching from being purely exam-oriented, to cultivating students with all around abilities. Our future generations will continue to bring China into a new era of civil society. It is ironic for Mr. Fish to call China ‘unlivable’ by describing China as having ‘lack of civil society’, yet in his own narration later he wrote: ‘Chinese cities have little crime, one can stroll safely through Beijing’s magnificent Temple of the Sun park at midnight’. How many of today’s ‘livable’ and ‘civilized’ North American cities can claim that?

    Air pollution is an issue in China, but no different than the smog that hung in the sky in Pittsburgh, London, or Los Angeles when those cities were going through their own vast development phases.   China is generating the greatest total greenhouse gas emissions in the world, but its greenhouse gas emission per capita in 2008 only ranks 78th of 214 countries in the world, while Australia ranks 11th, followed by USA (12th) and Canada (15th). China is manufacturing for the whole world, so in a sense it’s a scapegoat for countries that don’t want to or cannot make things for themselves. Yet even with that, air pollution in China never reaches the level described in Mr. Fish’s article. Take Nanjing (300 km northwest of Shanghai) as an example: in the one week Mr. Fish spent there, the only thing he saw was ‘smog the color of gargled milk’.

    Having lived in Nanjing for almost 10 years, I do not find Nanjing’s air quality unbearable. On the contrary, I love wondering on the streets of this ancient yet modern city, breathing the fresh air and enjoying the sweet scent given off by the Wutong Shu (Phoenix trees) erected on both sides of the streets. Every morning, citizens go outside to exercise in the mountains and parks. At night time, people take walks outside after dinner. Never would I suggest that Nanjing is an ‘unlivable’ city.


    Phoenix Trees in Nanjing

    In 2011, 14.5 million cars were sold in China. It has overtaken America as the largest automobile market. This has and will continue to cause significant traffic congestion, a worldwide issue most metropolises face today. However, China is very proactively providing solutions to this problem. In Beijing, Shanghai and Guangzhou, the local municipality limits the licenses plates issued every year in an attempt to relieve the burden caused by new traffic. Of course, China knows better than anybody that nothing will stop its citizens’ desire for car ownership as they get richer, so the only way to prevent future traffic problems is to invest in more quality highways, cleaner cars and better public transit systems.

    With China now spending approximately half a trillion dollars annually on infrastructure (9 percent of its GDP), visitors should not be surprised to see numerous highways and subways under construction in most Chinese cities. In 2010, Shanghai had the world’s most extensive subway system (429 km), followed by London (402 km) and then Beijing (372 km). By 2020, the total length of Shanghai’s subway lines will reach 877 km, more than double of New York’s current total length of subway lines. Meanwhile, China provides large subsidies to the taxi and bus industries. On top of that, with the world’s longest rail network, China’s high-speed rail system is changing the way people travel between Chinese cities. The newest bullet train from Beijing to Shanghai can bring passengers to their destination in less than five hours, while flying over the terrain at a maximum speed slightly over 300 km per hour.

    Bureaucracy has been rife in China literally for millennia, and the onset of a market economy has not changed that sad fact. Much of the criticism of China relates to censorship. Yet this is less an issue for most Chinese than for either westerners and some Chinese intellectuals. With the fast development of information science and the enormous variety of media available, people can freely choose what movie, play or art show they wish to watch, discuss anything they are interested in with their families and friends, and most importantly live the life styles they want. The ‘pervasive fear of censorship’ described by Mr. Fish literally does not exist for today’s average Chinese citizen.

    Mr. Fish also gave specific examples of ‘unlivable’ cities in China. Among them, Harbin, the capital city of Heilongjiang province, was voted the least livable metropolis mainly due to its cold winter. Personally, during my own time there, I was fascinated by Harbin’s characteristic Russian architecture, the massive and astonishingly beautiful ice sculptures, and the fun winter activities that were available. All these temperaments make Harbin an extraordinary city. I am currently studying in Canada, a country justly famous for freezing winters. Constantly hearing Canadians complain about their ‘unbearably cold’ winters makes me realize that if winter temperature is a key criteria to judge whether a city is livable or not, Winnipeg, Manitoba would probably be crowned the most unlivable city in the Western hemisphere. I can only imagine what Mr. Fish would have to say about cities like Oslo, Helsinki, Copenhagen, or Minneapolis.

    China clearly is no paradise, yet the world should recognize how significantly the quality of life has improved over the stereotypes of the past. Growing up in 40 square meter (430 square feet) ‘Dormitory Style Housing’ (as Mr. Fish put it), with my parents and grandparents, I remember vividly how our neighbors nearly burst through our door to see our newly purchased color TV, the first they had ever seen. My happiest moment was licking a popsicle to its last frozen drop in the summer heat. Considering my parents’ combined monthly salary about 20 USD in the 1980s, this popsicle was quite a treat. Two decades later, in the same summer heat, my husband and I moved into a brand new three-bedroom condo in Nanjing, fully equipped with the most modern electronic appliances. Our condo is surrounded by a beautiful pond, a gymnasium, a supermarket and a nearby subway station. We make 3400 USD a month, eat out often and travel every year. This is not atypical for most middle-class Chinese people now. The welfare system is improving, people are less worried about getting sick, a retirement fund is in place, people now travel not only domestically but also internationally, and many send their children abroad to receive higher education. Where we are now would have been unthinkable to most people only a few decades ago.

    I’m often deeply saddened by the way in which China is so often portrayed in western media. China’s growth and development over the past few decades has been vast, and it possesses potential for a more affluent future. Westerners may refer to China as ‘unlivable’ but for me, and hundreds of millions of people like me, China today is more than simply livable, and it will continue to improve as time goes by.

    Lisa Gu is a 28 year old Chinese national who lived in Nanjing, China. She is currently studying at Wilfrid Laurier University in Waterloo, ON, Canada.

    Photo by Wikicommons user shakiestone.

  • Evolving Urban Form: São Paulo

    São Paulo is Brazil’s largest urban area and ranks among the top 10 most populous in the world. Between 1950 and 1975, São Paulo was also among the globe’s fastest growing urban areas. For two decades starting in 1980 São Paulo ranked fourth in population among the world’s urban areas, but has been displaced by much faster growing urban areas like Manila and Delhi.

    São Paulo became Brazil’s largest urban area, displacing Rio de Janeiro, in the middle 1960s. There has been no looking back. By 2025, the United Nations forecasts that São Paulo will have 10 million more people than Rio (Figure 1).

    São Paulo is the capital of Brazil’s largest state, also called São Paulo. The 2010 census counted more than 41 million people in the state, more than live in California. The state of São Paulo is substantially more densely populated than California, occupying only two thirds of the land area (approximately the size of Oregon).

    There are other large urban areas in the vicinity of São Paulo. Campinas, an urban area of 2.5 million people, is located 60 miles (100 kilometers) north and San Jose dos Campos, an urban area of 600,000 is located 60 miles (100 kilometers) to the west.

    A 20th Century City

    Like many developing world megacities, São Paulo is a creation of the 20th century. In 1900, the population was 240,000. By 1950, the population had reached two million and now is approximately 20,200,000.

    São Paulo is located on a small plateau, over the mountains from the Atlantic Ocean 2500 feet (750 meters) above sea level, approximately the same elevation as Madrid. São Paulo is the world’s second largest urban area not located on an ocean or sea coast (Delhi is the largest).

    São Paulo is located 50 miles (80 kilometers) from the seaport of Santos, which is an urban area of 1.7 million. Santos is reached by one of the world’s most spectacular freeways, the Rodovia dos Imigrantes, which winds down the mountainside, with the southbound lanes crossing over the northbound lanes like the Interstate 5 Grapevine north of   Los Angeles, the grade down from Puebla (Mexico) to the city of Orizaba on Autopista 150D and a section of the N205 approaching Chamonix-Mont-Blanc in France.

    São Paulo’s Urban Expanse

    São Paulo is a comparatively dense urban area, at 16,500 persons per square mile, or 6400 per square kilometer. This makes São Paulo somewhat less than double the density of Paris, but still one quarter the density of Hong Kong or Mumbai and one seventh the density of Dhaka. The urban area covers 1,225 square miles (3,175 square kilometers), similar in size to the Miami and Washington DC urban areas.

    São Paulo is hardly a "compact city." The urban area stretches nearly 60 miles/100 kilometers east to west and more than 30 miles/50 kilometers north to south. The core city covers nearly as much area as the core city of Houston.

    Recent Growth and Suburbanization

    The central city (municipio) of São Paulo continues to grow. In the last 10 years, São Paulo  has grown from 10.4 million to 11.2 million. A majority of the urban area population, 57 percent, continue to live in the central city. However there is much stronger growth in the suburbs, reflecting the trends in nearly all other major urban areas of the world. Since 1950, São Paulo’s suburbs have experienced an explosive   growth, rising from under 200,000 residents to 8.4 million. This exceeds the core city’s growth over the same period of 7.46 million (Figure 2).

    In the last 10 years, suburban São Paulo has grown from 6.7 million to 8.4 million people, capturing   more than two thirds of the population growth. Since 1950, when the suburbs had approximately 5 percent of the population, they have increased their share in every census. However, if the strong growth of the city and the suburbs continues at the rates of the last 10 years, it could be 30 years before a majority of the population lives in the suburbs.

    Deficient Transport

    Like most nations, Brazil has a freeway or motorway system. There is a freeway between São Paulo and Rio de Janeiro and a freeway from São Paulo to the nation’s third largest urban area, Belo Horizonte. These and other freeways emerge from the urban periphery, without traversing the core.

    Yet, there is no way for trucks to traverse the São Paulo urban area from East to West without getting tied up in São Paulo’s monumental central area traffic. Nor is there a freeway for port traffic to cross the urban area south to north toward Campinas. Thus, truck traffic from the affluent urban areas of the South, such as Curitiba and Porto Alegre and the port at Santos is forced on to the Avenida Marginal Tiete and Avenida Marginal Pinheiros, forging an overused route adjacent to the urban core on both the west and north sides. East-west and north-south commercial traffic is combined on this roadway.

    However, São Paulo is building a long overdue ring road, the Mario Covas Beltway. Less than one half of this route is now in operation and the whole circle will not be completed until 2015.

    São Paulo is also on the trouble fraught high speed rail route proposed to run from Rio de Janeiro to Campinas. The route was roundly criticized by The Economist, which noted the low-balled costs, the astronomical ridership projections and the likelihood that Brazilian taxpayers would have to foot quite a bill to make it happen. This line was covered in more detail in Private Investors Shun Brazil High Speed Rail and High Speed Rail in Brazil: The Need for Guarantees.

    From Monocentricity to Polycentricity

    A number of other megacities in the developing world have added new commercial cores, becoming more polycentric, as the old central business district becomes comparatively less important. This is evident in Istanbul, Mexico City and Manila. In recent decades, most of the core-type commercial development has occurred along Avenida Paulista (two miles/three kilometers west of Centro) and then later, Luis Berrini (another 6 miles/10 kilometers further to the southwest).

    The Shantytowns

    As drivers travel on the Avenidas Marginal and the Mario Covas Beltway, they pass many shantytowns (favelas) close to the roadways. This can be a shocking site for North American rental car tourists. In more recent decades, favelas have developed not only on the urban fringe, but adjacent to affluent areas in the core (Photo). There are also corticos, which tend to be old subdivided houses and more centrally located. Both of these are increasingly interspersed through the urban area. A mid 1990s estimate placed the number of people living in this sub-standard housing at one quarter of the people in the central city of São Paulo.

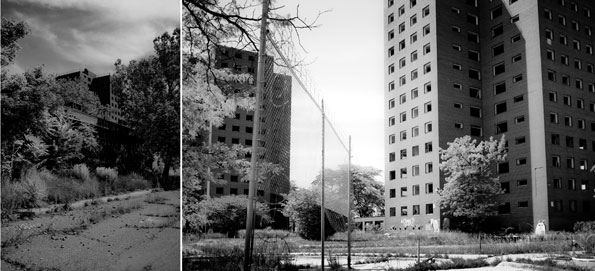
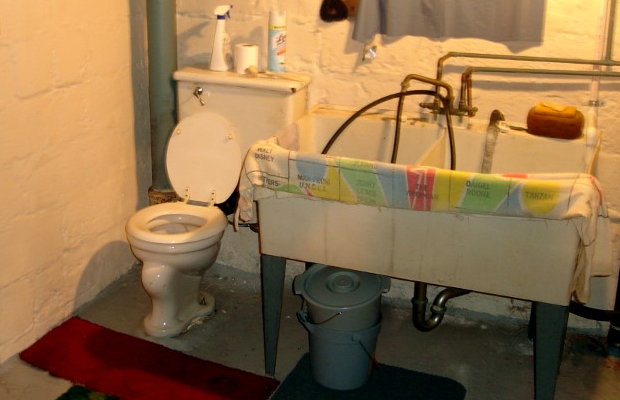
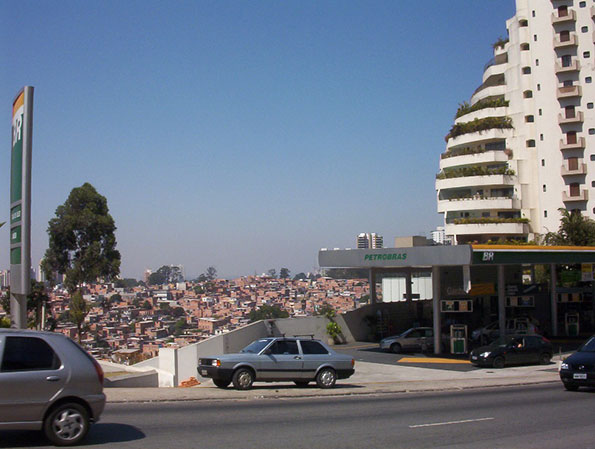
    Favela and Affluence, core city of São Paulo
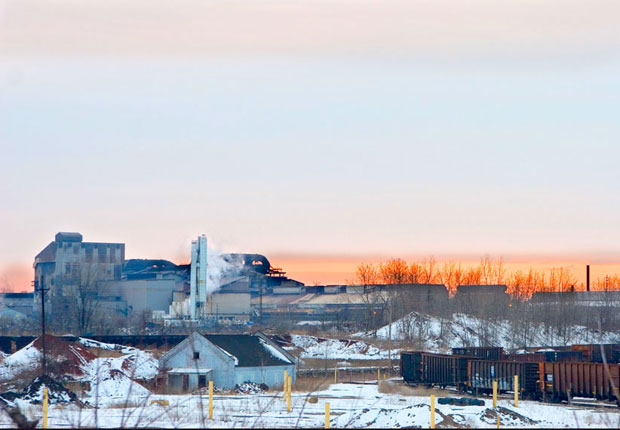
    City of Hope

    The origins of this movement to Sao Paulo are clear. People moved from the poor countryside, often from the sugar plantations of the Northeast. As bad as life may look to affluent northerners, things are much better here than back in the countryside. Otherwise they would go home, which occurs with no material frequency. São Paulo, like all big metropolitan areas, is a city of hope.


    Wendell Cox is a Visiting Professor, Conservatoire National des Arts et Metiers, Paris and the author of “War on the Dream: How Anti-Sprawl Policy Threatens the Quality of Life.”

    Lead Photo: Paulista Avenue (by author)

  • Anorexic Vampires and the Pittsburgh Potty: The Story of Rust Belt Chic

    “Rust Belt Chic is the opposite of Creative Class Chic. The latter [is] the globalization of hip and cool. Wondering how Pittsburgh can be more like Austin is an absurd enterprise and, ultimately, counterproductive. I want to visit the Cleveland of Harvey Pekar, not the Miami of LeBron James. I can find King James World just about anywhere. Give me more Rust Belt Chic.” Jim Russell, blogger at Burgh Diaspora

    National interest in a Rust Belt “revival” has blossomed. There are the spreads in Details, Atlantic Cities, and Salon, as well as an NPR Morning Edition feature. And so many Rust Belters are beginning to strut a little, albeit cautiously–kind of like a guy with newly-minted renown who’s constantly poking around for the “kick me” sign, if only because he has a history of being kicked.

    There’s a term for this interest: “Rust Belt Chic”. But the term isn’t new, nor is the coastal attention on so-called “flyover” country. Which means “Rust Belt Chic” is a term with history–loaded even–as it arose out of irony, yet it has evolved in connotation if only because the heyday of Creative Class Chic is giving way to an authenticity movement that is flowing into the likes of the industrial heartland.

    About that historical context. Here’s Joyce Brabner, wife of Cleveland writer Harvey Pekar, being interviewed in 1992, and introducing the world to the term:

    I’ll tell you the relationship between New York and Cleveland. We are the people that all those anorexic vampires with their little black miniskirts and their black leather jackets come to with their video cameras to document Rust Belt chic. MTV people knocking on our door, asking to get pictures of Harvey emptying the garbage, asking if they can shoot footage of us going bowling. But we don’t go bowling, we go to the library, but they don’t want to shoot that. So, that’s it. We’re just basically these little pulsating jugular veins waiting for you guys to leech off some of our nice, homey, backwards Cleveland stuff.

    Now to understand Brabner’s resentment we step back again to 1989. Pekar–who is perhaps Cleveland’s essence condensed into a breathing human–had been going on Letterman. Apparently the execs found Pekar interesting, and so they’d book him periodically, with Pekar–a file clerk at the VA–given the opportunity to promote his comic book American Splendor. Well, after long, the relationship soured. Pekar felt exploited by NYC’s life of the party, with his trust of being an invited guest giving way to the realization he was just the jester. So, in what would be his last appearance, he called Letterman a “shill for GE” on live TV. Letterman fumed. Cracked jokes about Harvey’s “Mickey Mouse magazine” to a roaring crowd before apologizing to Cleveland for…well…being us.


    Think of this incident between two individuals–or more exactly, between two realities: the famed and fameless, the make-up’d and cosmetically starved, the prosperous and struggled–as a microcosm for regional relations, with the Rust Belt left to linger in a lack of illusions for decades.

    But when you have a constant pound of reality bearing down on a people, the culture tends to mold around what’s real. Said Coco Chanel:

    “Hard times arouse an instinctive desire for authenticity”.

    And if you can say one thing about the Rust Belt–it’s that it’s authentic. Not just about resiliency in the face of hardship, but in style and drink, and the way words are said and handshakes made. In the way our cities look, and the feeling the looks of our cities give off. It’s akin to an absence of fear in knowing you aren’t getting ahead of yourself. Consider the Rust Belt the ground in the idea of the American Dream.


    2012-06-29-toledo_rust_harticle_intro.jpg

    Photo credit: Sean Posey

    Of course this is all pretty uncool. I mean, pierogi and spaetzle sustain you but don’t exactly get you off. Meanwhile, over the past two decades American cities began their creative class crusade to be the next cool spot, complete with standard cool spot amenities: clubs, galleries, bike paths, etc. Specifically, Richard Florida, an expert on urbanism, built an empire advising cities that if they want creative types they must in fact get ahead of themselves, as the young are mobile and modish and are always looking for the next crest of cool.

    These “Young and the Restless”–so they’re dubbed–are thus seeking and hunting, but also: apparently anxious. And this bit of pop psychology was recently illustrated beautifully in the piece “The Fall of the Creative Class” by Frank Bures:

    I know now that this was Florida’s true genius: He took our anxiety about place and turned it into a product. He found a way to capitalize on our nagging sense that there is always somewhere out there more creative, more fun, more diverse, more gay, and just plain better than the one where we happen to be.

    After long–and with billions invested not in infrastructure, but in the ephemerality of our urbanity–chunks of America had the solidity of air. Places without roots. People without place. We became a country getting ahead of itself until we popped like a blowfish into pieces. Suddenly, we were all Rust Belters, and living on grounded reality.

    Then somewhere along the way Rust Belt Chic turned from irony into actuality, and the Rust Belt from a pejorative into a badge of honor. Next thing you know banjo bingo and DJ Polka are happening, and suburban young are haunting the neighborhoods their parents grew up in then left. Next thing you know there are insights about cultural peculiarities, particularly those things once shunned as evidence of the Rust Belt’s uncouthness, but that were–after all–the things that rooted a history into a people into a place.

    Take the Pittsburgh Potty. For recent generations it was about the shame of having a toilet with no walls becoming the pride of having a toilet with no walls. From Pittsburgh Magazine:

    We purchased a house with a stray potty, and we’ve given that potty a warm home. But we simply pretended as if the stray potty didn’t exist, and we certainly didn’t make eye contact with the potty when we walked past it to do laundry.

    The Pittsburgh Potty is basically a toilet in the middle of many Pittsburgh basements. No walls and no stalls. It existed so steel workers can get clean and use the bathroom without dragging soot through ma’s linoleum.


    2012-06-29-PghPotty.JPG

    Photo credit: Brookline Connection

    Authentic: yes. Cool? A toilet?

    Only in the partly backward Rust Belt of Harvey Pekar and friends. From the twitter feed of @douglasderda who asked “What is a Pittsburgh Potty?” Some responses follow:

    “I told my wife I wanted to put ours back in, but she refused. I threatened to use the stationary tubs.”

    “In my house, that would be known as my husband’s bathroom.”

    “It’s a huge selling feature for PGH natives. I’m not kidding. We weren’t so lucky in our SS home.”

    “We’re high class people. Our Pittsburgh Potty has a bidet. Well, it’s a hose mounted on the bottom, but still ….”

    Eventually, this satisfaction found in re-rooting back into our own Rust Belt history has become the fuel of wisdom for even Coastal elites. Here’s David Brooks recently talking about the lessons of Bruce Springsteen’s global intrigue being nested in the locality that defines Rust Belt Chic:

    If your identity is formed by hard boundaries, if you come from a specific place…you are going to have more depth and definition than you are if you grew up in the far-flung networks of pluralism and eclecticism, surfing from one spot to the next, sampling one style then the next, your identity formed by soft boundaries, or none at all.

    Brooks continues:

    The whole experience makes me want to pull aside politicians and business leaders and maybe everyone else and offer some pious advice: Don’t try to be everyman…Go deeper into your own tradition. Call more upon the geography of your own past. Be distinct and credible. People will come.

    And some are coming, albeit slowly, unevenly. But more importantly, as a region we are once again becoming–but nothing other than ourselves.

    Authenticity, reality: this was and always will be the base from which we wrestle our dreams back down to solid ground.

    American splendor, indeed.

    This is an excerpt from the forthcoming book Rust Belt Chic: A Cleveland Anthology. It first appeared at RustBeltChic.com.

  • Regionalism: Spreading the Fiscal Irresponsibility

    Stanley Kurtz’s new book, Spreading the Wealth: How Obama is Robbing the Suburbs to Pay for the Cities describes political forces closely tied to President Obama who have pursued an agenda to “destroy” the suburbs for many years. He expresses concern that a second Obama term will be marked by an intensification of efforts to destroy the suburbs through eviscerating their independence thought the imposition of "regionalism". The threat, however, long predates the Obama administration and has, at least in some cases, been supported by Republicans as well as by Democrats.

    America is a suburban nation. Nearly three-quarters of the residents of major metropolitan areas (over 1,000,000 population) live in suburbs, most in smaller local government jurisdictions. Further, outside the largest metropolitan areas most people live in suburbs, smaller towns or smaller local government jurisdictions.

    Smart Growth

    The anti-suburban agenda has more than one dimension. The best known is smart growth, known by a variety of labels, such as compact development, growth management, urban consolidation, etc. Smart growth, from our research, also is associated with higher housing prices, a lower standard of living, greater traffic congestion and health threats from more intense local air pollution.

    Regionalism

    Another, less well-known anti-suburban strategy is regionalism, to which Kurtz grants considerable attention. Regionalism includes two principal strains, local government amalgamation and metropolitan tax sharing. Both of these strategies are aimed at transferring tax funding from suburban local governments to larger core area governments.

    Social welfare and differing income levels are not an issue at this level of government. Local governments, cities, towns, villages, boroughs and townships, finance local services principally with their own local taxes. The programs aimed at social welfare or providing income support are generally administered and financed at the federal, state or regional (county) level. Any suggestion that local suburban jurisdictions are subsidized by core local governments simply reveals a basic unfamiliarity with US municipal finance.

    Local Government Amalgamation

    Opponents of the suburbs have long favored amalgamating local governments (such as cities, towns, villages, boroughs and townships). There are two principal justifications. One suggests "economies of scale" — the idea that larger local government jurisdictions are more efficient than smaller governments, and that, as a result, taxpayers will save. The second justification infers that a larger tax base, including former suburbs, will make additional money available to former core cities, which are routinely characterized as having insufficient revenues to pay for their services. Both rationales are without foundation.

    Proponents of amalgamation incessantly refer to the large number of local governments in some states, implying that this is less efficient. The late Elinor Ostrum put that illusion to rest in her acceptance speech for the Nobel Prize in economics in 2009:

    Scholars criticized the number of government agencies rather than trying to understand why created and how they performed. Maps showing many governments in a metropolitan area were used as evidence for the need to consolidate.

    The reality is that there is a single measure of efficiency: spending per capita. Here there is a strong relationship between smaller local government units and lower taxes and spending. Our review of local government finances in four states (Pennsylvania, New York, Indiana and Illinois) indicates that larger local governments tend to be  less efficient, not more. Moreover, the same smaller is more efficient dynamic is evident in both metropolitan areas as well as outside. "Smaller is better" is also evident at the national level (Figure 1).

    Yet the "bigger is better" faith in local government amalgamation remains compelling to many from   both the Right and Left. Proponents claim that smaller local governments are obsolete, characterizing them as being from the horse-and-buggy era. The same logic could be used to eliminate county and even state governments. However, democracy remains a timeless value. If people lose control of their governments to special interests (which rarely, if ever, lobby for less spending), then democracy is lost, though the word will still be invoked.

    Support of local government amalgamation arises from a misunderstanding of economics, politics and incentives (or perhaps worse, contempt for citizen control). When two jurisdictions merge, everything is leveled up, from labor costs to service levels. The labor contracts, for example, will reflect the wage, benefit and time off characteristics of the more expensive community, as the Toronto "megacity" learned to its detriment.

    Further, special interests have more power in larger jurisdictions, not least because they are needed to finance the election campaigns of elected officials, who always want to win the next election. They are also far more able to attend meetings – sending paid representatives – than local groups. This is particularly true the larger the metropolitan area covered, since meeting are usually held in the core of urban area not in areas further on the periphery. This greater influence to organized and well-funded special interests – such as big real estate developers, environmental groups, public employee unions – and drains the influence of the local grassroots. The result is that voters have less influence and that they can lose financial control of larger local governments. The only economies of scale in larger local government benefit lobbyists and special interests, not taxpayers or residents.

    Regional Tax Sharing

    Usually stymied by the electorate in their attempts to amalgamate local governments, regional proponents often make municipal tax sharing a priority. The idea is that suburban jurisdictions should send some of their tax money to the core jurisdictions to make up for the claimed financial shortages of older cities. Yet this ignores the fact, as Figure 1 indicates, that larger jurisdictions generally spend more per capita already and generally tax more, as our state reports cited above indicate. Larger jurisdictions also tend to receive more in state and federal aid per capita.  A principal reason is that the labor costs tend to be materially higher in larger jurisdictions. In addition to paying well above market employee compensation, many larger jurisdictions have burdened themselves with pension liabilities and post employment health benefits that are well above what their constituencies can afford. The regionalist solution is not to bring core government costs in line with suburban levels but force the periphery to help subsidize their out of control costs.

    Howard Husock, of Harvard University’s JFK School of Government (now at the Manhattan Institute) and I were asked to evaluate a tax sharing a plan put forward by former Albuquerque mayor David Rusk for Kalamazoo County, Michigan (The Kalamazoo Compact) more than a decade ago. Our report (Keeping Kalamazoo Competitive)found no justification for the suburban areas and townships of Kalamazoo County to share their tax bases with the core city of Kalamazoo. The city already spent substantially more per capita, received more state aid per capita and had failed to take advantage of opportunities to improve its efficiency (that is, lower the costs of service without reducing services).  We concluded that the "struggling" core city had a spending problem, not a revenue problem. To the credit of the electorate of Kalamazoo County, the tax sharing proposal is gathering dust, having been made impractical by suburban resistance.

    Spreading the Financial Irresponsibility

    The wanton spending that has gotten many larger core jurisdictions into trouble should not have occurred. The core cities are often struggling because their political leadership has "given away the store," behavior that does not warrant rewarding. Elected officials in the larger jurisdictions had no business, for example, allowing labor costs to become higher than necessary or granting rich pension benefits paid for by private sector employees (taxpayers), most of whom  enjoy only  much more modest pension programs, if at all (See note below).

    The voters are no match for the spending interests with more efficient access to City Hall. The incentives in such larger jurisdictions are skewed against fiscal responsibility and the interests of taxpayers. Making an even larger pool of tax revenues available can only make things worse.

    At the same time, the smaller, suburban jurisdictions around the nation are often the bright spot in an environment of excessive federal, state and larger municipal government spending. Their governments, close to the people, are the only defense against the kind of beggar-the-kids-future spending that has already captured the federal government, state governments and some larger local jurisdictions.

    Either Way the Threat is Very Real

    Even if President Obama is not re-elected or if a second Obama Administration does not pursue the anti-suburban agenda, the threat to the suburbs will remain very real. This is not just about the suburbs, and it is certainly not some secret conspiracy. What opposing regionalism means is the preservation of what is often the last vestige of fiscal responsibility. It is not that the elected officials in smaller  jurisdictions are better or that the electorate is better. The superior performance stems from the reality that smaller governments are closer to the people, and decision-making tends more to reflect their interests more faithfully than in a larger jurisdictions.

    Ed. note: This piece was corrected to add quotation marks around the word “destroy” in the first paragraph. That clause is included in reference to Kurtz’s characterization, not the author’s.

    ——

    Note: A report by the Pew Charitable Trusts (Promises with a Price) indicated that "… in general, the private sector never offered the level of benefits that have been traditionally available in the public sector." The report further indicated that 90 percent of state and local government retirees are covered by the more expensive defined benefit pension programs, compared to 20 percent in the private sector. The median annual pension in the state and local government sector was cited at 130 percent higher than in the private sector. While 82 percent of state and local government retirees are covered by post-employment medical benefits, the figure is 33 percent in the private sector. According to the Bureau of Labor Statistics, after accounting for the one-third higher wages per hour worked among state and local government workers, employer contribution to retirement and savings is 160 percent higher than in the private sector (March 2012). A just published Pew Center on the States report (The Widening Gap Update) indicates that states are $1.3 trillion short of the funding required to pay the pension and post employment medical benefits of employees. This does not include programs administered by local governments.

    Wendell Cox is a Visiting Professor, Conservatoire National des Arts et Metiers, Paris and the author of “War on the Dream: How Anti-Sprawl Policy Threatens the Quality of Life.”

    Lead Photo: Damascus City Hall (Portland, Oregon metropolitan area) by Wiki Commons user Tedder.