Category: Urban Issues

  • State of Chicago: The Decline and Rise

    I’ve had it in my head for over a year now to do an in-depth exploration of Chicago, a project I’ve called “State of Chicago.” This is the first a series of pieces that expand on the themes in my recent article “The Second-Rate City?

    First, I’d like to list three reasons why I wrote that piece:

    1. To bring to the attention of Chicago the very poor statistical performance of the city on basic demographic and economic measures.
    2. To write a corrective to the many national puff pieces that have been written on the city that totally overlooked its real and serious problems.
    3. To lay out some frames that I had on the underlying causes that are different from the typical explanations, in particular the excessive focus on “global city” and the “cost of clout.”

    As it turns out, Rahm Emanuel’s own economic plan and the OECD report beat me to the punch on point #1. As a lot of what I wanted to accomplish with State of Chicago was data oriented, my project is now much less ambitious than I’d originally intended since Chicago’s leaders are now, fortunately, owning up to the problems.

    The Fall of Chicago

    Today I want to start out by giving the prequel to my article: Chicago’s Rust Belt decline and subsequent comeback, particularly in the 90s. I think everybody knows that cities had a rough 70s and early 80s. It was the “Rotten Apple” era in New York, for example, a time of needle parks, mugger money, graffiti trains, a brush with bankruptcy, and much more.

    Chicago had a similar rough patch. When Richard Longworth (now of Caught in the Middle and Global Midwest fame) returned to Chicago in 1976 from many years overseas as a foreign correspondent for the Chicago Tribune, it was to a grim, decaying city that, like so many big cities in America at the time, clearly was a city that did not work.

    This was perhaps best symbolized by the city’s inept response to the Blizzard of ’79, which left the city paralyzed for days. Mayor Michael Bilandic’s blizzard response was widely credited for his subsequent re-election defeat. Old mayor Richard J. Daley’s City Hall alliance with business had preserved the Loop as a powerful, if somewhat drab, business district while so many other Midwest downtowns fell into ruin. But otherwise Chicago was a troubled, declining city covered by a veneer of boosterism.

    In 1981 Longworth wrote a damning four part, front page series for the Chicago Tribune called “A City on the Brink” drawing a powerful portrait of a city in crisis. He noted that, “Chicago has become an economic invalid. The situation may be permanent.” The Economist, in a far cry from its praise in the 2000s, described the city as having little more than a “facade of downtown prosperity.”

    The city was losing people, losing businesses, and losing jobs – even in the Loop. Manufacturing was collapsing and the middle class was fleeing, leading to neighborhood decline and eroding the city’s tax base, which in turn degraded the city services residents had come to expect and demand. The decline in services and neighborhoods drove more people way, which led to further declines, perpetuating a vicious cycle.

    University of Illinois at Chicago Professor Pierre de Vise predicted, “I see very little hope for locating economic activities here again.” And a local business executive added, “Is the city being annihilated? It’s probably inevitable.” While careful to note that Chicago was not at the point of New York City’s brush with bankruptcy nadir, Longworth noted it was headed that direction and glumly asked, “What happens when a major city becomes a backwater?”

    The city was failing on nearly every measure. I was struck by how similar Longworth’s litany of statistics were to my own. There was a big different however: back then things were way worse. Today the problems of Chicago take place against a backdrop of many areas of strength in the urban core and a secular uptrend in the fortunes of cities. Given that Chicago has come back from far more dire circumstances than it faces today, there’s reason for optimism in the present.

    Chicago Reborn

    As I noted in City Journal, during the 90s (probably starting in the late 80s), Chicago had a massive comeback. It gained people, it gained jobs, and the core reasserted itself. I moved to Chicago in 1992 when only a few select lakefront precincts were really gentrified. Though I lived in Lincoln Park, I was told not to move west of Racine, not because it was dangerous, but because it was dead. The area where I used to live near Belmont/Ashland/Lincoln was completely boarded up except for the Army-Navy surplus store. Recruiters for my company tried to sell me on the city by telling me it was now a location of the uber-hip coffee chain Starbucks. I watched vast tracts of the city transformed before my eyes. The 90s boom was real. I saw it. I felt it.

    It also showed up in the data. I don’t want to go too crazy, but I wanted to look at some economic statistics. First, I want to look at metro area job growth in the 1990s for selected cities. I’ll show the percentage gains in a moment, but here’s the raw job growth for the ten largest US metros during the 1990s. (Top ten selected based on today’s 2010 census population).


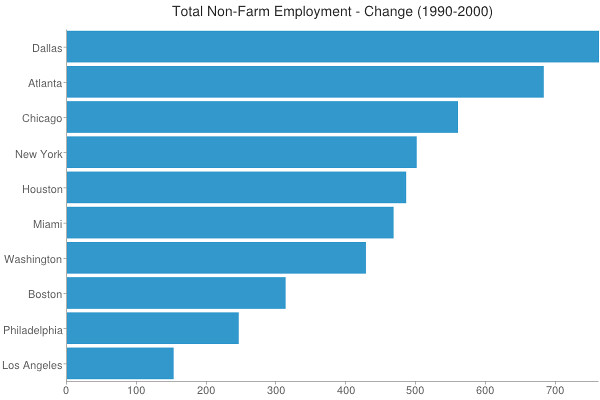
    Note: Data in thousands

    Chicago actually had the third highest total job growth. Not only did metro Chicago outgrow New York and crush LA (which got bruised by the “peace dividend”), it actually added more total jobs than Houston, everybody’s darling today. Wow. And more than currently booming Washington, DC. In short, Chicago beat out its mature tier one peers while holding its own with the emerging boomtowns. Very impressive.

    Here’s the percentage view:


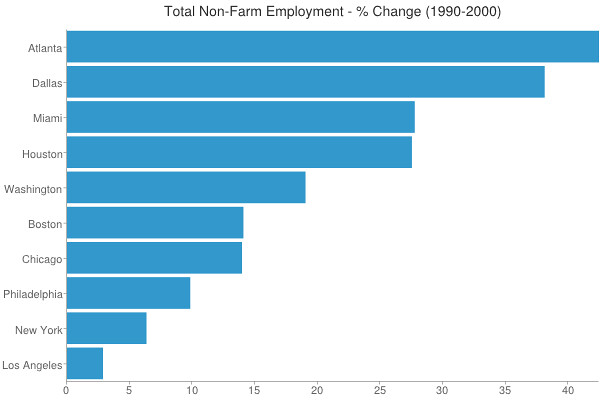
    Not as impressive vs. the emerging cities, but Chicago held its own with Boston (a big beneficiary of the dotcom boom) and more than doubled up traditional peers New York and LA. I think it’s fair to label Chicago an outperformer here.

    Let’s do a quick look at unemployment rates for the big three:


    As you can see, Chicago metro had a much lower unemployment rate than NYC or LA during most of the 90s. Since unemployment rate is available at the municipal level, here’s a quick look at the big three core cities. We’ll see again that even at the municipality level, the city of Chicago had a lower unemployment rate:


    So in terms of quantitative measures, Chicago was winning in the 90s. But it also seemed to do well qualitatively. I don’t have GDP data going back to the 90s, but I do have per capita personal income. Here’s how the top ten cities fared:


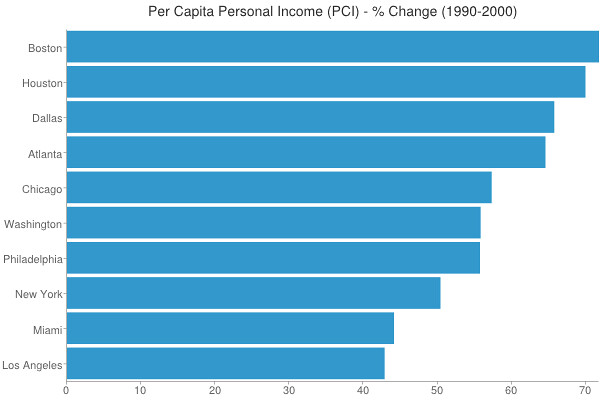
    Boston topped out, perhaps to be expected from the dotcom boom. But Chicago beat NYC and LA again, and also Washington, DC. (Interestingly, the southern boomtowns that did well on this metric in the 90s mostly got killed on it in the 2000s, Houston excepted).

    So I think it’s fair to say that compared to its large mature peers, Chicago economically was the winner (or at least near the top depending on who you put in there) during the 1990s, along with Boston. This is the type of performance Chicago is capable of delivering.

    But beyond the statistical measures, there were many qualitative improvements as well. For example, Chicago was really the early leader in quality of space. After Mayor Daley’s famous trip to Paris, he came back and encased the city in wrought iron. He also put in miles of streetscapes, with median planters, new streetlights and the like. (I happen to think the aesthetic style of these was not appropriate to Chicago, but they clearly upgraded the city in a big way). The CTA saw a brand new L line open to Midway Airport. New cultural facilities blossomed. For example, both the Chicago Symphony and the Lyric Opera undertook $100+ million building projects. And Daley even brought political stability back to the city after the turbulence Bilandic-Bryne years and the racially driven “Council Wars” of the 1980s.

    In a post-Cold War global order, Chicago also emerged as a global city. No longer just a superpower of the American interior, Chicago came to play a critical role in the global economy, through its derivatives exchanges, its professional services complex, and its status as a transport and cultural hub. Globalization became the lens through which the city sees its role in the modern economy, and with some justification. By 2010, Foreign Policy magazine ranked Chicago as the sixth most important global city in the world, for example. Chicago began to regard itself no longer as merely the “Second City,” but as a global player in its own right.

    So in the 1990s, Chicago was riding high. Little did the city know that with the dotcom collapse and the national economic trends of the 2000s, the city was about to enter a tailspin. But there was clearly a lot of real progress and change in the city and a lot for the city to feel good about and be proud of. Chicago was the big city champion of the 90s.

    I don’t want that story to get lost and people to think I’m just picking on Chicago. I’m happy to shout out its accomplishments when merited. But when things aren’t going so well, the city likewise deserves people who are willing to tell the truth.

    In the next installment, we’ll expand a bit on the troubles.

    Aaron M. Renn is an independent writer on urban affairs and the founder of Telestrian, a data analysis and mapping tool. He writes at The Urbanophile, where this piece originally appeared.

    Chicago skyline photo by BigStockPhoto.com.

  • High Speed Rail Advocates Discredit Their Cause – Again

    Is there any high speed rail boondoggle big enough to make rail transport advocates reject it?  Sadly, for all too many of them, the answer is No, as two recent developments make clear.

    The first is in California, where the state continues to press forward on a high speed rail plan for the state that could cost anywhere from $68 billion to $100 billion. Voters had previously approved $10 billion in bonds for the project, but as the state’s economy and finances have continued to sour – including multiple major cities going bankrupt – the polls have turned against it, and with good reason. The state faces the prospect of already enacted education cutbacks if Gov. Jerry Brown’s tax increase proposal in not approved in a vote this fall.  Other painful service cuts loom. Voters are rightly asking themselves if now is the time to be borrowing public money for very expensive, speculative infrastructure. 

    Equally, many of the much cited overseas examples of high-speed rail seem, well, to be off the tracks.    China’s rail system has serious safety problems, for example. And developing the most extensive high speed rail system in Europe hasn’t stopped Spain from seeing 50% youth unemployment, a 3 percentage point increase in the VAT tax, and a humiliating bailout from the rest of the EU.

    Nevertheless, the California assembly recently voted to go full speed head on its high speed rail plans. As part of an overall $8 billion rail spending package, the state is borrowing $2.6 billion to complement $3.2 billion in federal funds left over from the stimulus (shovel ready???) to build a starter segment of the line linking Bakersfield and Madera through the Central Valley. This is the easiest segment on which to build – though legal action is likely to delay construction – but doesn’t do anything to link the state’s huge population centers around LA and the Bay Area. With no more significant federal funds likely to be forthcoming, and the state’s finances a wreck, this segment risks becoming an embarrassing white elephant, or, as critics call it, “a train to nowhere”.

    After this vote it came to light that respected French high speed rail operator SNCF had approached California officials, private funding in hand, with a preliminary offer to build the LA-SF link themselves on a better and cheaper alignment along I-5 that would cost only $38 billion. But this was rejected by the state. The Times account suggests this rejection came about due to a combination of a political preference for the inefficient Central Valley segment and the clout of Parsons Brinckerhoff, the lead contractor.  Some commentators have referred to this revelation as a “bombshell.”

    Despite management misstep after management deception, rail advocates around the country cheered California’s decision to build the Central Valley segment. Jerry Brown, with not much to show for his reprise as Governor, is excited of course. Secretary of Transportation Ray LaHood called it a “big win.”  America 2050 (an offshoot of the Regional Plan Association of New York), “commended” the state for “taking a big step forward.”  Streetsblog called it a “major victory.”  While I respect what these organizations do in other contexts, this high speed rail vote is not a major victory, but a major defeat for common sense.

    But apparently not willing to let California take the prize in the rail boondoggle category without a fight, Amtrak shortly thereafter issued a “vision” for rail in the Northeast Corridor that would provide faster service between Boston and Washington, DC – at a cost of $151 billion. Strange as it sounds, some commentators actually lauded Amtrak for reducing costs since the previous plan was $169 billion.  The Brookings Institution was measured in its reaction to the plan, but managed to describe it as “more rational.”   With Republicans seemingly safely in charge of the House for now, and large federal deficits projected for the mid-term future, $151 billion for Amtrak seems purest fantasy.

    These developments are unfortunate because high speed rail could play an important role in US transportation, particularly in the Northeast. But that’s unlikely to happen because of the indiscriminate way establishment advocates have supported anything with the “high speed rail” label attached, ranging from $2 billion, 110 MPH peak speed Toonerville Trolleys in Illinois that barely beat Megabus in terms of journey time to the California rail boondoggle, regardless of merit. All they know that if it claims to be high speed rail, they are in favor of it.

    There are other people who take a more serious view. Unfortunately, they tend to be outsiders with little influence.  For example, Alon Levy suggested a set of near term, incremental Northeast Corridor improvements that might cost 90% less than Amtrak’s plan.

    $8 billion in stimulus dollars have gone to purchase us nothing of any real significance in terms of rail infrastructure. That money, invested wisely in high priority projects in the Northeast Corridor, could have made a big difference and started building a real demonstrated case for high speed rail investment in America. Unfortunately, the way high speed rail has been botched by its advocates, all the money we’ve spent on it has accomplished just the opposite. If California’s Central Valley segment is built and the complete line is never finished, it will likely discredit high speed rail in America for the long term.

    Aaron M. Renn is an independent writer on urban affairs and the founder of Telestrian, a data analysis and mapping tool.

    CA route map by Wikipedia user CountZ.

  • Core City Growth Mainly Below Poverty Line

    Over the toughest economic decade since Great Depression, the nation’s core cities continued to gain more than their share the below poverty line population in the 51 metropolitan areas with more than 1,000,000 population. Between 2000 and 2010, core cities (Note 1) attracted approximately 10 percent of the increase in population (Note 2) while adding 25 percent of the increase in people under the poverty line (Figure 1).

    Most New Core City Residents in Poverty: The core city poverty trend was overwhelming. In the core cities of the 51 metropolitan areas with more than 1,000,000 population (2010), 81 percent of the aggregate population increase was under the poverty line. This compares to the 32 percent of the suburban population increase that was below the poverty line. This may be a much lower figure than the concentration in the core cities, but even that also is far too high (Figure 2).

    The trend in core city poverty concentration was also pervasive. In 39 of the 51 metropolitan areas, core cities accounted for a greater share of poverty level population growth than overall population growth. One of the exceptions was Louisville, where the core city expanded to nearly six times its 2000 land area and more than doubled its population (Note 3). The result was to convert Louisville into a largely suburban city, which masks the high poverty rate in genuine urban core of the former city.

    Poverty in the Suburbs: At the same time, as core city population growth has stalled, much of the numeric increase in the below poverty line population has been in the suburbs. In 2010, the Brookings Institution reported that a majority of the metropolitan population below poverty was in the suburbs (Note 3). This is to be expected, since suburban areas account for nearly 75 percent of major metropolitan area population.

    Partially in response to the Brookings Institution finding, there has been some misinterpretation as to the relative economic fortunes of the core cities and the suburbs. This is consistent with the continuing "drumbeat" of the "return to the cities," which results of the last definitive ten year census only briefly quieted. The "great inversion" cited by Aaron Ehrenhalt and others, wherein the affluent "flock" (the recurring term) to the cities, as the suburbs are ghettoized, remains far from an actual reality.  

    Overall the average major metropolitan area poverty rate rose from 10.9 percent in 2000 to 14.1 percent in 2010. Rather than gentrify, the core city rate rose from 19.2 percent to 23.3 percent, while the suburban rate rose from 8.2 percent to 11.3 percent (Figure 3).

    Core City Poverty Rates Double the Suburbs: In 2010, core city poverty rates were higher in every major metropolitan area than in the suburbs. Overall, average core city poverty rates were more than double that of the suburbs in most metropolitan areas (27 of 51). Among the 10 largest metropolitan areas, the core cities of New York, Chicago, Houston, Philadelphia, Miami, Washington and Boston (Figure 4) suffered poverty rates more than double  those of their suburbs. The cities of Milwaukee and Hartford had the highest poverty rates relative to their suburbs, at four or more times.

    Shares of Poverty Level Population in the Core Cities: On average, 41 percent of metropolitan area populations living below the poverty rate resided in the core cities. The city of San Antonio had the highest share of its metropolitan below poverty population, at 73 percent, followed closely by the city of Milwaukee, at 72 percent. New York City accounted for 63 percent of its metropolitan below poverty line population and the city of San Jose 61 percent. Even after incorporating suburbs, the city of Louisville contained 57 percent of its metropolitan below poverty level population (Figure 5).

    Highlights of the 2010 Data: The 2010 poverty rates for metropolitan areas, core cities and suburbs are shown in the table below. Highlights of the data are described below:

    Metropolitan Areas: The highest metropolitan area poverty rates were in Memphis (19.1 percent), New Orleans (17.4 percent) and Riverside-San Bernardino (17.1 percent). The lowest metropolitan area poverty rates were in Washington (8.4 percent), Hartford (10.1 percent) and Boston (10.3 percent).

    Core Cities: The city of Detroit had the highest poverty rate, at 37.6 percent, The city of San Bernardino, whose city council voted to file for bankrupcty on July 10, had the second highest poverty rate at 34.6 percent, and Cleveland ranked third highest, at 34.0 percent.  The lowest core city poverty rates were in high-tech centers, the city of San Jose (12.6 percent), the city of Seattle (14.7 percent and in the two core cities of San Francisco-Oakland (15.7 percent). Despite the strong metropolitan area showing (#1) and high suburban ranking (#3), the city of Washington had only the 15th lowest poverty rate among core cities.

    Suburbs: The highest suburban poverty rates were in Riverside-San Bernardino (16.2 percent), Miami (15.9 percent) and Oklahoma City (15.2 percent). The lowest suburban poverty rates were in Baltimore (6.7 percent), Milwaukee (6.9 percent) and Washington (7.1 percent), with Baltimore and Washington profiting from strong federal government employment and contracting.

    The data reflects the continuation of longer term trends as wealth losses continue to afflict many core cities and as domestic migrants continue to move away (As was previously reported core counties, the lowest level at which there is migration data, have predominantly lost domestic migrants, both between 2000 and 2009 and in the latest estimates, between 2010 and 2011.) The problem, however is much larger. Both the core cities and the suburbs are are challenged by heightened poverty rates. The entire urban form, from the exurbs and the suburbs to the core cities   need  a substantial reduction in poverty, although  present economic trends are working against this   result.

    2010 Poverty Rates: Major Metropolitan Areas, Core Cities & Suburbs
    Poverty Rates
    Metropolitan Area (MSA) Historical Core City (HCM) MSA City Suburbs City/  Suburbs
    Atlanta, GA Atlanta 14.8% 26.1% 13.9% 1.88
    Austin, TX Austin 15.9% 20.8% 11.7% 1.78
    Baltimore, MD Baltimore 11.0% 25.6% 6.7% 3.80
    Birmingham, AL Birmingham 17.0% 29.5% 14.2% 2.08
    Boston, MA-NH Boston 10.3% 23.3% 8.3% 2.80
    Buffalo, NY Buffalo 14.4% 30.2% 9.7% 3.13
    Charlotte, NC-SC Charlotte 14.5% 17.2% 12.6% 1.36
    Chicago, IL-IN-WI Chicago 13.6% 22.5% 10.0% 2.24
    Cincinnati, OH-KY-IN Cincinnati 14.0% 30.6% 11.4% 2.69
    Cleveland, OH Cleveland 15.1% 34.0% 10.7% 3.19
    Columbus, OH Columbus 15.7% 22.6% 10.5% 2.16
    Dallas-Fort Worth, TX Dallas 14.6% 23.6% 12.5% 1.88
    Denver, CO Denver 12.5% 21.6% 9.7% 2.21
    Detroit,  MI Detroit 16.6% 37.6% 12.4% 3.02
    Hartford, CT Hartford 10.1% 31.2% 7.8% 3.99
    Houston, TX Houston 16.5% 22.8% 13.1% 1.74
    Indianapolis. IN Indianapolis 14.8% 21.1% 9.1% 2.31
    Jacksonville, FL Jacksonville 15.3% 16.7% 13.1% 1.28
    Kansas City, MO-KS Kansas City 12.4% 20.4% 10.0% 2.05
    Las Vegas, NV Las Vegas 15.1% 16.0% 14.7% 1.09
    Los Angeles, CA Los Angeles 16.3% 21.6% 14.0% 1.54
    Louisville, KY-IN Louisville 15.3% 18.9% 12.2% 1.55
    Memphis, TN-MS-AR Memphis 19.1% 26.5% 12.0% 2.20
    Miami, FL Miami 17.1% 32.4% 15.9% 2.04
    Milwaukee,WI Milwaukee 15.5% 29.5% 6.9% 4.30
    Minneapolis-St. Paul, MN-WI Minneapolis & St. Paul 10.9% 23.7% 7.6% 3.10
    Nashville, TN Nashville 15.4% 20.8% 12.2% 1.71
    New Orleans. LA New Orleans 17.4% 27.2% 13.4% 2.02
    New York, NY-NJ-PA New York 13.8% 20.1% 9.0% 2.24
    Oklahoma City, OK Oklahoma City 15.9% 16.8% 15.2% 1.11
    Orlando, FL Orlando 14.7% 18.5% 14.2% 1.30
    Philadelphia, PA-NJ-DE-MD Philadelphia 12.7% 26.7% 7.9% 3.36
    Phoenix, AZ Phoenix 16.3% 22.5% 13.0% 1.73
    Pittsburgh, PA Pittsburgh 12.2% 22.3% 10.7% 2.08
    Portland, OR-WA Portland 13.4% 18.5% 11.7% 1.59
    Providence, RI-MA Providence 13.7% 30.5% 11.7% 2.60
    Raleigh, NC Raleigh 12.9% 18.4% 10.0% 1.84
    Richmond, VA Richmond 11.6% 25.8% 8.9% 2.91
    Riverside-San Bernardino, CA San Bernardino 17.1% 34.6% 16.2% 2.13
    Rochester, NY Rochester 14.2% 33.8% 9.3% 3.62
    Sacramento, CA Sacramento 15.1% 21.5% 13.3% 1.62
    St. Louis,, MO-IL St. Louis 13.3% 27.8% 11.5% 2.42
    Salt Lake City, UT Salt Lake City 13.1% 22.3% 11.3% 1.98
    San Antonio, TX San Antonio 16.3% 19.1% 11.7% 1.64
    San Diego, CA San Diego 14.8% 17.4% 13.0% 1.34
    San Francisco-Oakland, CA San Francisco & Oakland 10.9% 15.7% 9.0% 1.74
    San Jose, CA San Jose 10.6% 12.6% 8.4% 1.49
    Seattle, WA Seattle 11.7% 14.7% 11.1% 1.33
    Tampa-St. Petersburg, FL Tampa 15.4% 21.3% 14.6% 1.46
    Virginia Beach-Norfolk, VA-NC Norfolk 10.6% 16.4% 9.7% 1.69
    Washington, DC-VA-MD-WV Washington 8.4% 19.2% 7.1% 2.69
    Average (Unweighted) 14.1% 23.3% 11.3% 2.18
    Data from American Community Survey, 2010


    Wendell Cox is a Visiting Professor, Conservatoire National des Arts et Metiers, Paris and the author of “War on the Dream: How Anti-Sprawl Policy Threatens the Quality of Life.”

    Photograph: Downtown Detroit (by author)

    ———————-

    Note 1: "Historical core municipalities," which are defined here. One such city is designated in each metropolitan area, except in Minneapolis-St. Paul and San Francisco-Oakland. In each of the metropolitan areas, these are the core cities of the metropolitan area at the beginning of the great automobile-oriented suburban expansion. These cities represent at least the urban core. However, in most cases, these cities  include considerable post-war suburban development is not genuinely urban core, largely due to post-1950 annexations.

    Note 2: The data in this analysis is extracted from the American Community Survey for 2010 and the United States Census of 2000. The metropolitan areas for both years are as geographically defined in 2010. The total population figures are the population for which poverty status has was determined by the Bureau of the Census (in each year this was approximately 98 percent of the total population).

    Note 3: The city of Louisville reached its population peak of 390,000 in 1960. Its highest density was nearly 9,300 per square mile (3,600 per square kilometer) in 1950, when it had a population of 370,000 in 40 square miles (100 square kilometers). The suburban incorporating consolidation of 2000 left the city with under 600,000 population in 340 square miles and a population density of 1,700 per square mile (700 per square kilometer), one of the lowest core city population densities in the nation.

    Note 4: The Brookings Institution report compared its "primary cities" to suburbs for 95 metropolitan areas. The primary cities included some that were little more than small towns at the beginning of the great automobile oriented suburban expansion, such as Aurora (Denver), Mesa (Phoenix), Santa Ana (Los Angeles), Fremont (San Francisco-Oakland) and Arlington (Dallas-Fort Worth), which is not served by mass transit. Each of these municipalities is classified as suburban in this analysis.

  • China and the Future of Hong Kong

    Last week Hong Kong’s new leader Leung Chun-ying was sworn into office by Chinese President Hu Jintao. The ceremony coincided with the 15th anniversary of the British handover of Hong Kong to China so there was plenty of rhetoric about ‘strengthening ties with the motherland’. Yet not far from the ceremony, tens of thousands of Hong Kong citizens marched in protest showing discontent with growing inequality and what they perceive as Beijing’s increasing assault on the territory.

    The relationship between Hong Kong and mainland China is complex. Beijing for the most part has kept its promise to uphold the ‘one country, two systems’ mandate. Officially, Hong Kong is considered a ‘Special Administrative Region’ (SAR), which means that it is treated as a separate country from an immigration standpoint and continues to circulate its own currency, the Hong Kong dollar. Hong Kong also retains an independent legal and judicial system inherited from the previous British rulers.

    Most importantly, Hong Kong has avoided the draconian media censorship common on the mainland. A free press is consistent with its reputation as a global center of banking and commerce. Hong Kong’s ease of trade and doing business frequently leads it to being named one of the world’s freest economies.

    So if Beijing continues to hold up its end of the deal, why do so many Hong Kong residents march in protest? The relationship is more nuanced than it appears on the surface. Politically, Hong Kong residents do not have the freedom to elect their leader (CY Leung was appointed by a 1,200-person electoral college made up primarily of pro-China business leaders), although democratic elections are set to commence in the next five years. Underlying this frustration is what Hong Kong residents see as an infiltration of growing mainland influence on the city.

    On the ground, Hong Kong experienced a huge increase in mainland tourists to the city since the handover. Hong Kong doesn’t have the same high tax rate on imported goods that mainland China does, so mainlanders flock to the city primarily for shopping, hunting for bargains on electronics and luxury fashion brands. It is not uncommon to see long queues of mainland tourists in front of shops of famous fashion brands like Gucci, D&G or Prada. The droves of mainland shoppers spending money in Hong Kong are great for the local economy, but many locals decry the constant flow of tourists as invading ‘locusts’.

    Yet more significant than what is happening on the ground is what is taking place high above in the sky. The phenomenon of wealthy mainlanders purchasing real estate in the city has driven   housing prices to astronomical levels, approaching the market just before the Asian Financial Crisis of 1997. For well-off Chinese mainlanders, Hong Kong real estate is seen as a safer long-term investment than China’s still somewhat risky real estate market and unpredictable stock market. A severely limited land supply coupled with the fact that a handful of powerful real estate oligarchs control the market for new development means that prices will probably stay high barring another economic crisis.

    Land-use policy is perhaps the most critical factor in determining both the future of Hong Kong and the mainland. As anyone who has been to the city can attest to, Hong Kong has some of the best infrastructure in the world, including a first-class international airport, extensive rail system and a booming seaport. Much of that infrastructure comes from the city’s land-auctioning system, which is the government’s primary source of revenue. This is also what helps keeps taxes low.

    Furthermore, unlike in the U.S., where infrastructure is traditionally financed publicly, Hong Kong’s infrastructure is increasingly built with private funds. For instance, the city’s Mass Transit Railway (MTR) Corporation, founded as a public entity, went fully private in 2000 and is traded on the Hong Kong’s stock exchange. In addition to operating and maintaining the city’s existing rail system, MTR Corporation is responsible for building new lines. What makes MTR Corporation different from most other transit authorities is that its primary earnings do not come from passenger ticket sales but from developing the land on top of and around its metro stations.

    Cheung Kong Holdings, led by Hong Kong’s richest man Li Ka-shing, is not only one of the city’s largest property developers, its business interests also include Hutchinson Port Holdings (a port operator that handles 13% of the world’s container traffic) and Hutchinson Telecommunications Limited (which builds and operates mobile phone networks). Sun Hung Kai, another powerful Hong Kong property developer also owns stakes in logistics and telecommunications businesses (although its founders, the Kwok brothers, were recently arrested on corruption charges).

    The mode of urban development in mainland Chinese cities is heavily influenced by Hong Kong. Yet instead of powerful corporations, State-Owned Enterprises (SOE), large entities owned by the government, dominate urban development related businesses. China’s land auctioning system is far from perfect, with well-documented instances of corrupt land seizures and the unfair advantages government backed SOEs have in the bidding process over private developers. But with virtually no property taxes in mainland cities, land sales remain the primary source of revenues for local governments to support infrastructure development.

    There is growing evidence that suggests China plans to alter the direction of its development model in the coming years by consolidating and privatizing its SOEs. Already, Hong Kong property developers are active in the mainland real estate market with Chinese companies eager to learn from their expertise. The cozy relationship between Hong Kong developers and mainland SOEs is a cause for concern by Hong Kong citizens, as they see their local developers as more interested in appeasing Beijing authorities than providing affordable housing for its own citizens.

    Yet this is inevitable. The city of 7 million cannot expect to forever be completely independent of a country of 1.3 billion to which it is now irrevocably attached. This is true even in spite of Hong Kong’s role as an international center of trade.

    Throughout history, Chinese culture survived through its sheer mass and cultural osmosis. When CY Leung gave his inaugural speech last week, it was in Standard Mandarin, the official language of China. Although the citizens of Hong Kong are also Chinese, their official language is Cantonese, a completely different and not mutually intelligible dialect. Leung’s move was seen as a slight to the people he was chosen to serve, yet given who he has to report to in Beijing, it made perfect sense.

    Adam Nathaniel Mayer is an architectural design professional from California. In addition to his job designing buildings he writes the China Urban Development Blog.

    Follow him on Twitter: AdamNMayer

    Hong Kong photo by BighStockphoto.com

  • The Cities Where A Paycheck Stretches The Furthest

    When we think of places with high salaries, big metro areas like New York, Los Angeles or San Francisco are usually the first to spring to mind. Or cities with the biggest concentrations of educated workers, such as Boston.

    But wages are just one part of the equation — high prices in those East and West Coast cities mean the fat paychecks aren’t necessarily getting the locals ahead. When cost of living is factored in, most of the places that boast the highest effective pay turn out to be in the less celebrated and less expensive middle part of the country. My colleague Mark Schill of Praxis Strategy Group and I looked at the average annual wages in the nation’s 51 largest metropolitan statistical areas and adjusted incomes by the cost of living. The results were surprising and revealing.

    In first place is Houston, where the average annual wage in 2011 was $59,838, eighth highest in the nation. What puts Houston at the top of the list is the region’s relatively low cost of living, which includes such things as consumer prices and services, utilities and transportation costs and, most importantly, housing prices: The ratio of the median home price to median annual household income in Houston is only 2.9, remarkably low for such a dynamic urban region; in San Francisco a house goes for 6.7 times the median local household income. Adjusted for cost of living, the average Houston wage of $59,838 is worth $66,933, tops in the nation.

    Most of the rest of the top 10 are relatively buoyant economies with relatively low costs of living. These include Dallas-Fort Worth (fifth), Charlotte, N.C. (sixth), Cincinnati (seventh), Austin, Texas (eighth), and Columbus, Ohio (10th). These areas all also have housing affordability rates below 3.0 except for Austin, which clocks in at 3.5. Similar  situations down the list include such mid-sized cities as  Nashville, (11th), St.Louis (12th), Pittsburgh, (13th), Denver (15th) and New Orleans (16th).

    One major surprise is the metro area in third place: Detroit-Warren-Livonia, Mich. This can be explained by the relatively high wages paid in the resurgent auto industry and, as we have reported earlier, a huge surge in well-paying STEM (science, technology, engineering and math-related) jobs. Combine this with some of the most affordable housing in the nation and sizable reductions in unemployment — down 5% in Michigan over the past two years, the largest such drop in the nation. This longtime sad sack region has reason to feel hopeful.

    Only two expensive metro areas made our top 10 list. One is Silicon Valley (San Jose-Sunnyvale-Santa Clara), where the average annual wage last year of $92,556, the highest in the nation, makes up for its high costs, which includes the worst housing affordability among the 51 metro areas we considered: housing prices are nearly 7 times the local median income. Adjusted for cost of living, that $92,556 paycheck is worth $61,581, placing the Valley second on our list.

    In ninth place is Seattle, which placed first on our lists of the cities leading the way in manufacturing and STEM employment growth. Housing costs, while high, are far less than in most coastal California or northeast metropolitan areas.

    What about the places we usually associate with high wages and success? The high pay is offset by exceedingly high costs. Brain-rich Boston has the fifth-highest income of America’s largest metro areas but its high housing and other costs drive it down to 32nd on our list. San Francisco ranks third in average pay at just under $70,000, some $20,000 below San Jose, but has equally high costs. As a result, the metro area ranks a meager 39th on our list.

    Much the same can be said about New York which, like San Francisco, is home to many of the richest Americans and best-paying jobs. The average paycheck clocks in at $69,029, fourth-highest in the country, but high costs, particularly for housing, eat up much of the locals’ pay: adjusted for cost of living, the average salary is worth $44,605. As a result, the Big Apple and its environs rank only 41st on our list.

    Long associated with glitz and glitter, Los Angeles does particularly poorly, coming in 46th on our list. The L.A. metro area may include Beverly Hills, Hollywood and Malibu, but it also is home to South-Central Los Angeles, East L.A. and small, struggling industrial cities surrounding downtown. The relatively modest average paycheck of $55,000 annually, 12th on our list, is eaten up by a cost of living that is well above the national average. This creates an unpleasant reality for many non-celebrity Angelenos.

    Many of the metro areas that rank highly on our list have enjoyed rapid population growth and strong domestic in-migration. Houston, Dallas-Fort Worth, and Austin all have been among the leaders the nation in both domestic migration and overall growth both in the last decade and so far in this one. In the past year, for example, Dallas led the nation with 40,000 net migrants while Austin’s population growth, 4 percent, was the highest rate among the large metropolitan areas.

    In contrast, many of the cities toward the bottom of our list — notably the Los Angeles and New York areas — have led the country in domestic outmigration. Between 2000 and 2009, the nation’s cultural capitals lost a total of over 3 million people to other parts of the country. Although migration has slowed in the recession, the pattern has continued since 2010.

    And how about the future? Income and salary growth has been so tepid recently that few large cities can claim to have made big gains over the past five years; there has been continued volatility as some regions that did worst in the past decade — for example San Francisco — pick up steam. Unfortunately any growth in such highly regulated areas also tends to increase costs rapidly, particularly for housing. In California, this is made much worse by both soaring taxes and a regulatory regime that drives up costs faster than income games.

    Similarly these high prices seem to have the effect of driving out middle-class workers; places like New York, Los Angeles and San Francisco have extraordinary concentrations of both rich and poor workers but fewer in the middle. As we pointed out in our annual job and STEM rankings, many technology, manufacturing and business service jobs are heading not to the hotspots but more to the central part of the country.

    Over time, it seems clear that, for the most part, the best prospects for the future lie in places that both experience income and employment gains but remain relatively affordable. These include some cities that didn’t crack the top 10 of our list but appear to be gaining ground, such as Nashville, Pittsburgh, St. Louis, San Antonio and New Orleans, a once beleaguered city that has experienced the nation’s fastest per capita personal income growth since 2005.

    Maintaining affordability and a wide range of high-paying jobs many not be as glamorous a metric for success as the number of hip web startups or the concentration of educated people. But over time it is likely to be about as good a guide to future prospects as we have.

    Joel Kotkin is executive editor of NewGeography.com and is a distinguished presidential fellow in urban futures at Chapman University, and contributing editor to the City Journal in New York. He is author of The City: A Global History. His newest book is The Next Hundred Million: America in 2050, released in February, 2010.

    This piece originally appeared in Forbes.

    Houston photo by BigStockPhoto.com.


    Note: The table below was updated with 2012 data, so it may not match the narrative above discussing 2011 data. Contact Mark Schill at mark@praxissg.com.

    Metropolitan Pay per Job 2012 – Adjusted for Cost of Living
    MSA Name 2012 Avg. Annual Wage Unadj. Rank 2012 Adj Annual Wage Adj. Rank Rank Change
    Houston-Sugar Land-Baytown, TX $67,279 7 $75,256 1 6
    San Jose-Sunnyvale-Santa Clara, CA $107,515 1 $71,534 2 (1)
    Detroit-Warren-Livonia, MI $60,503 16 $64,571 3 13
    Dallas-Fort Worth-Arlington, TX $60,478 17 $62,867 4 13
    Austin-Round Rock-San Marcos, TX $58,103 19 $62,679 5 14
    Memphis, TN-MS-AR $53,069 36 $61,780 6 30
    Charlotte-Gastonia-Rock Hill, NC-SC $57,506 20 $61,636 7 13
    Atlanta-Sandy Springs-Marietta, GA $58,836 18 $60,844 8 10
    Seattle-Tacoma-Bellevue, WA $67,225 8 $60,237 9 (1)
    Cincinnati-Middletown, OH-KY-IN $54,683 26 $59,828 10 16
    Nashville-Davidson–Murfreesboro–Franklin, TN $53,928 30 $59,787 11 19
    Birmingham-Hoover, AL $52,773 37 $59,563 12 25
    St. Louis, MO-IL $54,112 29 $59,398 13 16
    Columbus, OH $53,634 33 $59,395 14 19
    Denver-Aurora-Broomfield, CO $62,021 11 $59,068 15 (4)
    Washington-Arlington-Alexandria, DC-VA-MD-WV $79,852 2 $58,672 16 (14)
    Chicago-Joliet-Naperville, IL-IN-WI $62,746 10 $58,477 17 (7)
    Pittsburgh, PA $55,004 24 $58,021 18 6
    New Orleans-Metairie-Kenner, LA $54,636 27 $57,151 19 8
    Salt Lake City, UT $53,901 31 $56,978 20 11
    Raleigh-Cary, NC $53,243 34 $56,762 21 13
    Milwaukee-Waukesha-West Allis, WI $55,434 22 $55,825 22 0
    Phoenix-Mesa-Glendale, AZ $53,835 32 $55,788 23 9
    Minneapolis-St. Paul-Bloomington, MN-WI $61,515 14 $55,645 24 (10)
    Oklahoma City, OK $50,641 42 $55,345 25 17
    Jacksonville, FL $51,763 40 $55,126 26 14
    Richmond, VA $55,065 23 $55,010 27 (4)
    Tampa-St. Petersburg-Clearwater, FL $50,462 43 $54,969 28 15
    Louisville/Jefferson County, KY-IN $50,385 44 $54,945 29 15
    Hartford-West Hartford-East Hartford, CT $67,826 6 $54,787 30 (24)
    Kansas City, MO-KS $54,378 28 $54,706 31 (3)
    Philadelphia-Camden-Wilmington, PA-NJ-DE-MD $63,615 9 $54,372 32 (23)
    Cleveland-Elyria-Mentor, OH $54,701 25 $53,946 33 (8)
    Boston-Cambridge-Quincy, MA-NH $73,267 5 $53,363 34 (29)
    San Francisco-Oakland-Fremont, CA $79,137 3 $52,988 35 (32)
    San Antonio-New Braunfels, TX $49,219 47 $52,867 36 11
    Rochester, NY $51,798 39 $52,533 37 2
    Baltimore-Towson, MD $61,542 13 $51,759 38 (25)
    Buffalo-Niagara Falls, NY $50,013 46 $50,723 39 7
    Las Vegas-Paradise, NV $50,378 45 $50,328 40 5
    New York-Northern New Jersey-Long Island, NY-NJ-PA $77,640 4 $50,169 41 (37)
    Portland-Vancouver-Hillsboro, OR-WA $56,134 21 $49,414 42 (21)
    Virginia Beach-Norfolk-Newport News, VA-NC $51,693 41 $49,091 43 (2)
    Miami-Fort Lauderdale-Pompano Beach, FL $52,357 38 $48,012 44 (6)
    Orlando-Kissimmee-Sanford, FL $46,481 48 $47,771 45 3
    San Diego-Carlsbad-San Marcos, CA $61,149 15 $46,822 46 (31)
    Los Angeles-Long Beach-Santa Ana, CA $61,634 12 $46,411 47 (35)
    Providence-New Bedford-Fall River, RI-MA $53,071 35 $42,254 48 (13)
    Riverside-San Bernardino-Ontario, CA $46,084 49 $41,000 49 0
    Indianapolis-Carmel, IN $53,839 No data
    Sacramento–Arden-Arcade–Roseville, CA $59,200 No data
    2012 wage data: EMSI Class of Worker, 2012.3
    Cost of living data: C2ER
  • Modern Families: Fact from Fiction

    I sometimes struggle with our willingness to look straight through evidence to see only what we want to see, or what we believe we should be seeing. Some recent interpretations of the Australian census and conclusions about housing form and consumer choice regrettably fall into this category.

    Early results from the Australian census may have disappointed some boosters who have actively promoted the view that the typical family household is a thing of the past. The argument has had many forms but usually includes one or more of the following:

    • that single person households are the fastest growing household type; that lifestyle choices mean that more people want to live closer to city centres;
    • that the suburban housing block is an environmental calamity and is no longer even suited to what households want;
    • that high density, multi-level housing with high reliance on public transport is a preferred housing model for the ‘new’ generation of family types.

    And so it goes.

    Sadly for the promoters of rapid social change, the census reveals that the facts aren’t on their side. Indeed, in terms of housing form and family type, nothing much has really changed. There have been movements at the margin and movements in both directions, but nothing I would interpret as conclusive evidence of fundamental social change.

    Housing form

    Across Australia, 73.8% of us live in a detached house. In the last census, it was 74.3%. That’s hardly a seismic shift. In 2011, 14.6% of us lived in apartments compared to 14.7% five years earlier. Townhouses account for 9.9% of households versus 9.3%.  Don’t hold the front page, nothing much has changed.

    There are regional differences. In Sydney, detached housing is at 58.9% from 60.9% while apartments represent 27.6% of households against 26.4% five years earlier. This higher proportion in apartments comes as little surprise given the highly restrictive planning policies of NSW in that period and prior (which included a virtual prohibition on suburban expansion), combined with the long established tendency of Sydney to accommodate more people in apartments than other capitals. But for all the hype about Bob Carr’s ‘brawl against sprawl’ and subsequent planning regimes, the actual change in housing has been minimal. (Instead, what happened is that the industry stopped supplying much of either).

    In Melbourne by contrast, detached housing represents 71.1% of housing from 71.6% five years earlier. Apartments are 16.6% versus 16.4%. Melbourne, and Victoria generally, has had a less deterministic approach to planning whereby detached suburban expansion hasn’t been as vigorously opposed, so the higher dominance of the detached house is no surprise. But it also shows little change over recent times, which doesn’t support the view that a majority of consumers would prefer higher density over lower.

    In Brisbane, detached housing is at 77.6% versus 78.7% five years earlier, which is a very small change and also one of the highest proportions of households in detached housing in the country. Once again, the evidence isn’t pointing to massive social change. It isn’t even pointing to modest change.

    Family type

    Also regrettable for the promoters of widespread social change has been the fact that family types have remained largely unchanged. There are 43% of people living as a couple with children (it was 43.3% five years earlier) and there are 39.5% living as couples without children.  Remember also that ‘couples without children’ includes couples in the pre-family formation stage (young, and starting out in life in the main) and also ‘empty nesters’ (parents whose children have left the family home). A further 16% are single parent families. 

    The Census this time also went into some detail about same sex couples. But set aside the media and political hype and the facts show that the proportion of same sex couples across the country is 0.7%. There’s been a lot of media comment and public policy attention recently about that 0.7%.

    The inevitable conclusion from this evidence is simply that the overwhelming majority of people in Australia remain families who either have children, who plan to have children, or who have had children who have left home, and that this proportion hasn’t changed to anywhere near the extent promoters of social change might have wished.

    This also has implications for housing choice and style. There will be a market for higher density, inner city housing but our policy makers need to keep in mind that the detached home remains the overwhelming preference for families as a place to raise children. That also includes couples planning to raise children (not all of whom live in apartments until the first child comes along – many prefer to plan ahead) and it also includes couples with children who have left home but for whom a third or fourth bedroom is needed for grandparent child minding or children returning to the family home.

    However, the evidence hasn’t stopped some sections of the media or social commentators from reaching entirely different conclusions. “Up not out for housing” declared one writer who wrote: “Australia is increasingly favouring higher density living, according to the 2011 census.” Really? Based on the same evidence above? You’d be seriously pushed to draw that conclusion. Add to this that supply side policies have restricted the choice of detached housing in preference to the promotion of higher density, which means that increasingly housing choice has been restricted, and what there is of it, much more expensive. To conclude anything about ‘favouring’ one type of housing or another, without assessing the supply side policy constraints which limit choice, is a bit like saying more people prefer mangoes in summer than in winter. Duh.

    The Grattan Institute is another that seems committed to turning the evidence on its side to support pre-determined points of view. In this opinion piece, Grattan Institute cities program fellow Peter Mares concluded that: “that despite paying significantly more to put a roof over their head than they were five years ago, many are not ending up in the kind of housing that best matches their preferences.”  Describing the “popular view that we are wedded to the suburban block” as a mismatch, the conclusion is that ‘we’ (being, I presume, the unelected policy makers)  need to have “a serious, if difficult, conversation about what type of housing we should build and where it should be built.”

    Well, that would be difficult if it means imposing a form of housing on a population that might prefer to make its own choices about what type of housing it ‘should’ have and where they ‘should’ be living. 

    These aren’t the only examples and as more Census data becomes available, plenty more commentators will seek to extrapolate minor changes at the margin into claims this represents evidence of fundamental social change. It doesn’t and we can only hope our policy makers know the difference between evidence and a sitcom.

    Ross Elliott has more than 20 years experience in property and public policy. His past roles have included stints in urban economics, national and state roles with the Property Council, and in destination marketing. He has written extensively on a range of public policy issues centering around urban issues, and continues to maintain his recreational interest in public policy through ongoing contributions such as this or via his monthly blog The Pulse.

    Family illustration by BigStockPhoto.com.

  • Coney Island’s Invisible Towers

    When crowds thronged Coney Island for the annual Nathan’s hot dog eating contest on July 4th, they found a boardwalk amusement strip that was, for the umpteenth year in a row, undergoing a summer of change and transition.

    There is the new: go-carts and a new roller coaster for the "Scream Zone" that the Luna Park amusement park added last summer; and the start of a new pavilion alongside the Parachute Jump, where the old B&B Carousell (second "l" now enshrined as a historic typo), relegated to storage since 2005 and painstakingly restored at city expense, will once again whirl next spring.

    There is the disappeared and the disappearing: Henderson’s Music Hall, where Harpo Marx made his stage debut, was demolished two winters ago by landowner Thor Equities; this spring, it was replaced by a nondescript one-story structure that, lacking tenants, was instantly boarded up with plywood. And barring an unforeseen reprieve, this will be the final summer for both Denny’s ice cream and the Eldorado bumper cars, each of which is expected to see its Surf Avenue storefront razed for new construction — or at least occupied by new businesses — in the near future.

    It’s another step in the remaking of the Brooklyn beachfront that began in 2003, when the city launched a rezoning process to transform the diminished yet still-popular summer destination into what it hoped would be a year-round hot spot for both residents and entertainment-seekers. In the years since, what seemed like the beach’s inexorable slow slide into decay — a bathhouse burned down one decade, a derelict rollercoaster razed the next —turned into a whirlwind of change, as developers and longtime neighborhood property owners alike began smelling greenbacks in the air, and the 46-year-old Astroland amusement park and many longtime boardwalk businesses were pushed out in the rush to make way for promised glitzier attractions.

    Yet amidst all the noisy mermaid-filled debates that accompanied the rezoning battle, it’s been easy to forget that the amusement district proper — a beachfront strip of rides, carny games and skeeball parlors that over the decades has shrunk to a relict dozen or so acres — was never the main target of the city’s rezoning efforts. Though the storefronts along Surf (including the homes of Denny’s and Eldorado) were slated for high-rise hotels on the city’s rezoning renderings, much of the focus of the Coney Island Development Corporation (spun off by the city Economic Development Corporation in 2003 to oversee redevelopment plans) was to the west, where the city’s stated intent was to bring mixed-use housing and retail towers to the vacant lots that have littered Surf Avenue since they were cleared for urban renewal in the 1960s. Click here to see a map of the rezoned area.

    "It’s a neighborhood with a significant amount of poverty, very few jobs and lots of abandoned lots," said city Economic Development Corporation (EDC) president Seth Pinsky after the rezoning was approved by the City Council in 2009. The hope at the time was that by dropping some high-end residents into Coney Island, as well as new storefronts along Surf Avenue that could host restaurants, movie theaters and other year-round attractions, local residents could finally have access to more than the seasonal jobs that have traditionally accompanied the summer beach season.

    Three years later, though, there is little sign of the condo messiah arriving anytime soon. A single apartment building on the boardwalk at West 32nd Street was begun two winters ago, but today remains unfinished. Nearby, Coney Island Commons, a mixed-income coop complex that will include a new YMCA-run community center, has blown past its original summer 2009 target completion date — thanks to delays in finalizing financing and community agreements, according to developer Jerome Kretchmer — and is now slated for an opening in 2013.

    Among the actual lots rezoned three years ago, meanwhile, Thor’s plywood-bedecked single-story building is the only sign of new construction. In particular, the "Coney West" lots just west of the Brooklyn Cyclones stadium, which in city renderings appeared as modern glass-and-brick towers fronting tree-lined boulevards, remain much as they have for decades: empty expanses of dirt and gravel, used as ad-hoc parking lots if anything at all.

    Some of this, no doubt, can be blamed on the collapse of the housing bubble, which struck just as the city put the finishing touches on its rezoning plan. Yet even if demand for beachfront condos rebounded tomorrow, many longtime residents warn that it would still take years, if not decades, of sewer and electrical upgrades before Bloomberg’s residential dreams could become reality.

    "Before they put up one major building, they basically have to rip up the entire peninsula, and put in stormwater lines and sewage lines," says Ida Sanoff, a former Community Board 13 member who has become the beachfront’s most dedicated environmental watchdog.

    It’s an investment that the city says it’s willing to make — eventually: The EDC is now openly talking about a "30-year plan" for redevelopment. The price tag, according to city figures, could run close to half a billion dollars, making it one of the most expensive city redevelopment projects of the Bloomberg era. And even then, it’s an expensive gamble by the city that the promised construction will ever arrive.

    * * * *

    If Thor Equities’ Joe Sitt was the developer that Coney fans loved to hate — the man who evicted Astroland, who threatened to build high-rise apartment buildings and hotels right on the boardwalk — then Taconic Investment Partners were the designated good guys. With none of Sitt’s bluster, the real estate investment firm quietly bought up several blocks of vacant lots along Surf Avenue — one, bought by Sitt for $13 million, cost Taconic $90 million less than a year later — and announced plans to work with the city to bring in mixed-use condo towers at a respectful distance from the amusement zone.

    Taconic officials were amiable and readily accessible at the time, but have since all but disappeared from public view; company officials did not return numerous calls and emails for this article, and its websitenotes only that "Taconic is in the process of evaluating the economics of a planned development for some or all of our holdings."

    The city, meanwhile, is moving slowly on the infrastructure upgrades that it will take to support the new buildings, when and if they arrive. The first phase — a set of new storm sewers and ungraded sanitary pipes along W. 15th St. and a short stretch of Surf Avenue — is currently in the design phase, with work set to start in the fall and a target completion date of 2015. Two more phases will expand into surrounding blocks, but not until 2022. A total of $140 million has been budgeted for new sewer and water lines between West 12th Street and West 21st Street, according to EDC.

    But the peninsula’s infrastructure needs, according to longtime locals, go far beyond the few square blocks around the Taconic properties. "Everything south of Surf Ave., there’s no storm water lines in," says Sanoff. "You’re going to have a lot of paved surfaces, and where is all that stormwater going to go?" Already, she says, "If you walk the beach here after a heavy rain, it’s just littered with poop bags" that dog owners have thrown into the sewers — and which have popped back up when stormwater backs up.

    "The whole peninsula is in need of [infrastructure work]," says CB13 district manager Chuck Reichenthal. "You can’t put up highrise hotels, buildings, or anything else, when what exists now has flooding problems."

    Brian Gotlieb, who served as chair of Community Board 13 from 2002 to 2006, says he expects that the city would have moved more quickly on sewer upgrades if developers were champing at the bit to put shovels in the ground. Even so, he worries that sewers are only the tip of the iceberg when it comes to needed infrastructure upgrades. "Coney Island has always had problems with brownouts and blackouts," he says, predicting a need for major electrical upgrades. (EDC says these will be handled by ConEd on an as-needed basis.) And then there’s the eventual demand for schools to educate the children of all those condo dwellers if and when they arrive.

    What the total cost would be, no one can say. The city Independent Budget Office projects a total city expense of $277 million on land acquisition, park and boardwalk reconstruction, and other neighborhood capital projects through 2013; add in the $140 million budgeted by the Department of Environmental Protection for sewer work, and the total price tag is at $417 million. (If you include the $39 million Keyspan Park and $250 million Stillwell Avenue subway terminal — first put in motion when Rudy Giuliani was touting Coney Island and as the next Times Square — total public expense on the rebuilding of Coney rises to more than $700 million.) And that’s not even factoring in any increased costs of protecting a newly developed beachfront from the ravages of climate change: In 2007, Rohit Aggarwala, who was then running Mayor Bloomberg’s PlaNYC project to plan for the city’s future growth, called a five-inch rise in water level by 2030 "a moderate scenario"; a University of Arizona sea-level mapping toolprojects that in a worst-case scenario, Coney Island could be reduced to three disconnected islands by the end of this century. (The rezoning does require that local streets be raised to guard against sea-level rise, according to EDC, but specific plans—and budgets—will be worked out only "as sites are developed.")

    This is par for the course in city redevelopment efforts, says Hunter College planning professor Tom Angotti. "I don’t know of anyone who systematically calculates costs in New York City," he says. "The infrastructure that does get built is a very pragmatic response to either developer needs or community opposition." In other cities, he notes, "when you have a significant negative impact, then there’s a whole discussion of whether new infrastructure is needed — here, it doesn’t get discussed."

    * * * *

    If there’s an upside to the city’s deliberate pace, it’s that if the market for Coney condos never recovers to pre-crash expectations, then taxpayers save the hundreds of millions of dollars it would take to build the infrastructure to support the influx of new inhabitants. (The $95 million the city spent to relieve Sitt of his stretch of the amusement district, though, is a sunk cost.) The downside is that then the last ten years of upheaval on Coney Island has failed to achieve its primary goal.

    It would also mean the death of hopes that the rezoning drama will ultimately produce jobs for the impoverished blocks to the west, a cul-de-sac known as the West End that sports some of the highest unemployment rates in the city. During the rezoning battle, a coalition calling itself Coney Island CLEAR, made up of representatives of several city unions and a handful of locals (most prominently Rev. Connis Mobley of the West End’s United Community Baptist Church), lobbied for job guarantees for local residents as part of the rezoning.

    Gotlieb, who served on CLEAR’s board, says that the hope was that new development would bring not just jobs — which in Brooklyn as often as not employ people outside the immediate neighborhood— but training opportunities to help residents plan for careers. And while the CIDC has helped some people get building certifications, he says, so far there’s been little to build. "Once the economy took a turn that it did, nobody was doing a heck of a lot."

    For now, the city is publicly professing patience, with an EDC spokesperson saying that an timetable for the Taconic properties "is determined by the private developer," adding, "We’re less than three years into a 30-year redevelopment plan and significant progress has already been made. We’re confident the 2009 rezoning lays out a practical pathway going forward."

    Looked at another way, though, this round of predictions of a reborn Coney Island has been going on for almost a decade, and its biggest booster is only a year and a half from departing City Hall. If the long history of failed plans for the neighborhood — from the post-war urban renewal plans that first created today’s vacant lots to Ed Koch’s late-’70s promises of beachfront casinos — tells us anything, it’s that in Coney Island, nothing is a sure bet.

    This piece originally appeared at The Brooklyn Bureau.

    Photo By Pearl Gabel.

  • Pakistan: Where the Population Bomb is Exploding

    In much the developed, as well as developing world, population growth is slowing. Not so in Pakistan according to reported preliminary results of the 2011 Pakistan census. Here population is growing much faster than had been projected. Pakistan’s population stood at 197.4 million in 2011, an increase of 62.7 million from the last census in 1998 (Note 1). The new population is 20 million more than had been forecast in United Nations documents. Some of the additional growth is due to refugees fleeing Afghanistan, but this would not be enough to account for the majority of the under-projection error.  

    Pakistan: Moving Up the League Tables

    As a result, Pakistan has passed Brazil and become the world’s 5th most populous nation, following China, India, the United States and Indonesia. Pakistan’s 11 year growth rate is estimated at 34.2 percent, nearly double that of second ranking Mexico, at 18.2 percent, where the birth rate (as indicated by the total fertility rate) is projected to drop to under replacement rate by the end of the decade. Perhaps most significantly, Pakistan’s growth rate is more than double the rates of India (15.9 percent) and Bangladesh (14.1 percent),which have long had reputations for strong growth (Table and Figure 1). At this growth rate, Pakistan could become the world’s fourth most populous nation by 2030, passing Indonesia.

    Table
    10 Most Populous Nations: 2000-2011: Population Trends
    Rank Nation 2000 2011 Change % Change
    1 China    1,278.0    1,348.0        70.0 5.5%
    2 India    1,071.0    1,241.0       170.0 15.9%
    3 United States       285.5       313.1        27.6 9.7%
    4 Indonesia       216.2       242.3        26.1 12.1%
    5 Pakistan       147.1       197.4        50.2 34.2%
    6 Brazil       176.9       196.7        19.8 11.2%
    7 Bangladesh       131.9       150.5        18.6 14.1%
    8 Russia       146.1       142.8         (3.3) -2.3%
    9 Japan       125.9       126.5          0.6 0.5%
    10 Mexico         97.0       114.8        17.8 18.4%
    Population in Millions
    Population data from UN, except for Pakistan (from Pakistan census)
    2000 Pakistan population estimated from 1998-2011 growth rate.

    Remarkably, while much of the world has seen a reduction in fertility rates and population growth, Pakistan’s growth rate has increased. Between 1991 and 2001, Pakistan grew 25 percent, a rate that increased by more than one third (to 34 percent) between 2001 and 2011 (Figure 2). Pakistan’s total fertility rate (TFR — the number of live births the average woman has in her lifetime) is reported by the UN to be 3.2. This is well above India’s rate of 2.6 and far above the Bangladesh rate of 2.2 (which is only barely above the generally accepted replacement rate of 2.1). Pakistan’s fertility rate is the highest of any of the largest countries and one of the highest in the world outside sub-Saharan Africa.

    Not surprisingly, the average household size is very high, at 6.8. This is a slight decline from the rate of 6.9 in 1998. By comparison, more developed countries, such as in Europe and North America, tend to have average household sizes of from 2.2 to 2.6.

    Karachi: World’s Leading Urban Area by 2030?

    Pakistan’s largest metropolitan region and capital of Sindh province, Karachi, grew even faster. Between 1998 to 2011, Karachi grew from 9.8 million to 21.2 million, adding more than 11 million people (115 percent). No metropolitan region in the world has ever grown so much in so little a period. This 13 year growth rate, adjusted to 10 years, is 8.7 million. Until the last decade, only Tokyo, among the larger world metropolitan regions, had ever grown more than 6 million in 10 years (6.2 million from 1960 to 1970). Between 2000 and 2010, Jakarta grew 7.4 million, Shanghai grew 7.0 million and Beijing added 6.0 million people.  (See Figure 3.)

    Mexico City and Sao Paulo, with their reputations for explosive growth rates, are now expanding at only 3 million (or less) per decade, and their growth is slowing. The fastest growing metropolitan regions in regions in Europe and North America peaked at similar numbers. New York’s greatest growth was 3.4 million between 1920 and 1930, while Los Angeles grew 3.1 million from 1980 to 1990.

    The early census results indicate an urban area (area of continuous urban development, a part of a metropolitan area) population of approximately 19.5 million, which would rank Karachi as the 7th largest in the world. With an urban land area of approximately 310 square miles (800 square kilometers),  Karachi has an average population density of approximately 63,000 per square mile (24,000 per square kilometer), making it more dense than any "megacity" (urban area over 10 million population) except for Dhaka (Bangladesh) at 115,000 per square mile (44,000 per square kilometer) and  Mumbai (80,000 per square kilometer and 31,000 per square mile)

    Karachi’s strong growth now places it among a group of large and rapidly growing urban areas that could challenge Tokyo to become the world’s largest urban area in 20 years. Indeed, should Karachi’s now 6.0 percent growth rate fall to 4.0 percent, Karachi would still be the world’s largest urban area in 2030, followed by Jakarta, given its present growth rate. With Tokyo likely to begin losing population by that time, Delhi may pass Tokyo by 2030 as well.

    At the same time, Karachi is densifying in an unusual way: it is increasing its average household size. While the average household size is dropping modestly in the nation as a whole, Karachi’s average household size rose from 6.7 to 7.3 between 1998 and 2011, meaning that nearly 10 percent of any recent density increase is within housing units (it is not known whether this is due to higher local fertility rates or "doubling up" of family units in housing units).

    As the largest metropolitan area of one of the world’s largest nations, Karachi draws residents from the rest of the nation (and outside) to take advantage of its economic opportunities. Pakistan is not a rich country, with a gross domestic product (purchasing power parity) of less than $3,000 per capita in 2011. This compares generally to rates of $30,000 to $40,000 in the larger European Union economies, $40,000 to $50,000 in Australia, Canada, United States and Hong Kong and $60,000 in Singapore. However, incomes are higher in Karachi than in the rest of the country.

    As huge numbers of people have migrated to Karachi, many have been forced to live in informal settlements (slums), as squatters. In 2000, it was estimated that approximately 5 million of Karachi’s residents (nearly 50 percent) at the time lived in slums.

    Hyderabad

    Hyderabad (Pakistan, not India) is the second largest metropolitan region in the province of Sindh. Hyderabad’s claim to fame is that it is growing even faster than Karachi. Between 1998 and 2011, Hyderabad grew from 1.4 million to 3.4 million, or 129 percent.

    Other Areas

    So far, the reported census results are limited to the provincial data and local data in the province of Sindh. However, in view of the strong growth rates around the nation, it seems likely that the count in the nation’s second largest urban area, Lahore, will surpass 10 million.

    Urban Growth in Pakistan

    Finally, any review of suburban and exurban land use on Google Earth suggests that Pakistan is taking the advice of the United Nations in its State of the World Population Report 2007: Unleashing the Potential of Urban Growth, which said (Note 2):

    (a) expanding their city limits; (b) planning for road grids in the areas of expansion; (c) locating
    the required 25- to 30-metre-wide right-of-way for the infrastructure grid on the ground

    Radiating both from Karachi and Hyderabad, there are new grids of streets for housing and other development of a type that will allow the burgeoning cities of Pakistan to grow and perhaps even breathe at the same time.

    Wendell Cox is a Visiting Professor, Conservatoire National des Arts et Metiers, Paris and the author of “War on the Dream: How Anti-Sprawl Policy Threatens the Quality of Life.”

    ——————

    Photo: Map of Karachi by Wikipedia user Nomi887

    Note 1: This population includes the areas of Kashmir administered by Pakistan (and claimed by India) and excludes the areas of Kashmir administered by India (and claimed by Pakistan).

    Note 2: This concept was pioneered by Professor Schlomo (Solly) Angel of New York University and Princeton University, who proposed that developing world urban areas provide grids of dirt roads to accommodate their rapidly growing populations. This would ensure a better planned urban area and lead to more healthful living conditions (and avoid the necessity of high-density slums or shantytowns).

  • Religion and the City

    Seek the welfare of the city where I have sent you into exile, and pray to the LORD on its behalf; for in its welfare you will have welfare. – Jeremiah 29:7

    Religion is another one of those topics seldom discussed in urbanist circles. Though Christianity was originally an urban religion, modern Christianity has always had a bit of a problem with cities, with their licentious ways, anonymity, and the little bit of Babylon and Sodom they all contain.

    The religious in the US are often associated with the political right and conservative stances on social issues – just the type of people who don’t like cities or city dwellers much, and vice versa. In particular, the strident opposition of many to abortion and homosexuality puts religion on the wrong side of what are also litmus test issues for many urbanists.

    Yet urbanists should take religion much more seriously than they often do. That’s because it plays a much bigger role in the city and civic health than currently believed, and because many urban congregations have mastered the art of outreach and conversion in a way that transit and density advocates can only dream out.

    The Importance of Religion

    Churches have always been important institutions in cities. Even today, the only reason many families with children are confident enough to stay in the city is because they can enroll their kids in Catholic or other religious schools. I can only imagine what a place like Chicago would look like if its religious school network wasn’t there. Religious institutions are also heavily involved in poor relief and other social service activities that help reduce the tax burden. And regardless of what you personally think about any particular religion, if someone is able to use faith to help them get over serious personal dysfunction like criminal behavior or alcoholism, more power to them.

    For ethnic and minority communities, churches have long been key community institutions and support organizations. In a video I’ll get to shortly, Tim Keller notes as one example how the Jewish community of New York City has built extensive institutions there that made it much easier for Jewish families, not just young Jewish singles, to stay in the city. Churches have long been important in black communities that are often neglected and underserved by government, and many black pastors are seen not only as religious, but very important community or political leaders as well. I suspect religious institutions play a particularly key role in fostering community networks for what are niche minorities in many cities – Muslims, Sikhs, etc.

    This is an urban world that doesn’t feature much in the landscape of the traditional affluent white bobo demographic that dominates urbanist discussion. But even in that group, I see many examples of how religious minded urbanists types have helped boost and build a better future for their city.

    For example, in Indianapolis, the Earth House Collective, a “group of peace activists, conservationists, artists, musicians, Methodists, teachers and many more dedicated to peace, wellness, community and culture” is based in the heart of downtown Indianapolis at Lockerbie United Methodist Church. Similarly, the Harrison Center for the Arts, one of the city’s most important arts venues, is housed at Redeemer Presbyterian Church. Both of these are taken seriously by even the most hardened atheists in the city.

    The Harrison Center’s executive director, Joanna Taft, was one of the people who helped found the church as well (and the charter Herron High School and lots of other things). She explained how her Christian motivation propels her work in city revitalization:

    I have been Presbyterian my whole life and my worldview has been influenced by the protestant reformed concept of the cultural mandate. This is the idea that humankind has been called to continue God’s work of creation–building cities, restoring broken neighborhoods, creating beauty, raising children, planting gardens, etc…..While some of our Christian friends would feel guilty doing this work because it was not “full-time Christian service”, understanding the cultural mandate gave us the freedom to pursue what some would see as secular work.

    There’s a lot more to religion in the city than just abortion protests. It’s time urbanists took religion and religious institutions a lot more seriously, even if they don’t agree with the religious in many cases.

    Learning from Evangelism

    Not all religions seek out converts, but Christianity and Islam, two of the big kahunas, do. Since in most countries you can’t force someone to belong to a religion or have a particular set of beliefs, this requires the ability to persuade, and really speak to the people you are trying to convert.

    If you really are trying to save souls, then it isn’t enough just to be right, you have to also be effective. That’s the part of the message that’s too often lost on urbanists of various stripes. They are pushing transit, density, sustainability, etc. largely based on a belief that these are self-evidently correct policies. I find that often their ability to sell them to people who are skeptical or come from a different worldview is poor. When people don’t sign on to the latest carbon reduction scheme, rather than blaming a bad sales job, the blame is almost always put on the people rejecting it, such as by calling them idiots, intellectually dishonest, shills for corporations, or “deniers.” I’m sure there are some of these types out there, but I believe the vast bulk of people don’t fall into these categories.

    Not all, but a good chunk of religious evangelists actually care about what works. Their mandate doesn’t allow them to simply write off unbelievers as a hopeless sinners. As a result, you often see a lot more analysis of what they think they need to do to be successful in their mission.

    As an example, I highly recommend watching the following 18 minute video of a speech by Rev. Tim Keller of Redeemer Presbyterian Church in New York City. (If the video doesn’t display, click here). If you aren’t familiar with the Redeemer story, this New York Times article from 2006 is good background. Keller’s speech is called “God’s Global Urban Mission,” and this segment discusses Contextualization. He gives 10 ways that urban churches are different from suburban or rural churches, and what they need to do differently to be successful in urban environments. Almost all of these are very relevant to urbanism.

    He talks about items ranging from multicultural sensitivities to taking the arts serious to “being famous for helping the poor.” The latter was an item that jumped out at me because, as I’ve noted before, too many urbanist arguments are basically arguments for what I call “Starbucks urbanism.” If called on this, people will say, “But of course transit will benefit the poor too.” But that’s not how it’s sold. Urbanists ought to be famous for the way they design, implement, and talk about their policies as instruments for helping the poor and facilitating upward economic and social mobility. There’s a lot of other good stuff in the video that’s relevant to urbanism.

    For those who prefer reading, Keller also wrote a paper called “Our New Global Culture: Ministry in Cities, which says of itself: “This paper surveys the rise of global cities, the culture and dominant worldviews within these cities, and a framework for ministering in them.”

    You may think Keller’s analysis and framework is bunk, but at least he’s trying to look at the city as it is, and figure out what he’s got to do to adapt his ministry to it, not trying to make the city adapt itself to his ministry.

    By the way, Keller is excited about immigration from places like Africa or China where Christianity is a lot more alive and expanding than it is in the US and especially Europe. I was clicking around Wikipedia and found this picture of a Chinese evangelical Christian church in Madrid is that is a perfect example of this trend and how it is changing the face of cities.


    If you prefer a more purely secular example, Saul Alinsky also believed in understanding the worldview of people he was trying to organize. Even people he thoroughly disagreed with, he refused to hold in contempt, instead trying to see things from their perspective on their own terms. In “Rules for Radicals” (1971), he had this to say:

    To bring out this reformation requires that the organizer work inside the system, among not only the middle class but the 40 percent of American families – more than seventy million people – whose incomes range from $5,000-$10,000 per year. They cannot be dismissed by labeling them blue collar or hard hat.
    ….
    Many of the lower middle classes are members of labor unions, churches, fraternal, service and nationality organizations. They are organizations and people that must be worked with as one with work with any other part of our population – with respect, understanding, and sympathy. To reject them is to lose them by default. They will not shrivel and disappear. You can’t switch channels and get rid of them. This is what you have been doing in your radicalized dream but they are here and will be.

    Wise words indeed.

    Thanks to Pastor Kevin Bruursema at New Life Community Church in Lakeview, Chicago for the Tim Keller video reference.

    Aaron M. Renn is an independent writer on urban affairs and the founder of Telestrian, a data analysis and mapping tool. He writes at The Urbanophile, where this piece originally appeared.

    City Church photo by BigStockPhoto.com.

  • Questioning the Messianic Conception of Smart Growth

    A new analysis from the United Kingdom concludes that smart growth (compact city) policies are not inherently preferable to other urban land use policy regimes, despite the claims of proponents."The current planning policy strategies for land use and transport have virtually no impact on the major long-term increases in resource and energy consumption. They generally tend to increase costs and reduce economic competitiveness." The article goes on: "Claims that compaction will make cities more sustainable have been debated for some time, but they lack conclusive supporting evidence as to the environmental and, particularly, economic and social effects."

    These would not be surprising findings to Newgeography.com readers, who are accustomed to similar analyses rooted in economic, demographic, and environmental data. However, this article appeared in the Spring 2012 issue of the Journal of the American Planning Association, under the title, "Growing Cities Sustainably: Does Urban Form Really Matter?"

    Moreover, the authors are urban planning insiders, including Marcial H. Echenique, a land use and transport professor at Cambridge University, Anthony J. Hargreaves from the Martin Centre for Architectural Studies at Cambridge, Gordon Mitchell from the Faculty of the Environment at the University of Leeds and Anil Namdea of the School of Engineering at the University of Newcastle.

    Smart Growth Criticisms

    Many of the British critiques parallel those made by critics of smart growth for years. They focus particularly on the concern that smart growth generally has neglected economic and social costs. For example, smart growth policies lead to higher house prices by rationing land (such as with urban growth boundaries). Higher house prices lead to less discretionary income for households, so that there is less money for other goods and services, lowering employment levels. The resulting densification leads to more intense traffic congestion, with resulting economic losses and more intense air pollution, which is less healthful.

    The Research

    The authors modeled land use and travel behavior in three areas of England, subjecting them to three land use alternatives: compact development (smart growth), planned development (which I would label "smart growth light") and dispersal, the generally liberal approach common in United States, Canada, Australia and New Zealand for decades after World War II (and still in many US and some Canadian markets).

    Echenique et al analyzed the London metropolitan region (Greater London Authority, Southeast England and East England), which has a population of 20 million and the Newcastle (Tyne and Wear) metropolitan region, which has a population of 1,000,000. They also analyzed a sub-region within London metropolitan region, Cambridge, with a population of 500,000.

    Their model projected little difference in outcomes between the three land use regulatory regimes to 2031. Predictably, land consumption was less under the compact development, but the variation in land consumed varied no more than plus or minus one percent from the trend (base case) in the London area, where only 11 percent of the land is in urban or transport use. Other factors, such as the change in transport energy use, greenhouse gas (GHG) emissions from transport and residences and air pollution varied little between the three regulatory regimes.

    Economic costs in 2031 were projected to be the lowest (best) for the dispersed option and the highest for the compact development option, both in the London and Newcastle metropolitan regions. Planned development ranked second.

    The compact development option scored best in the Cambridge sub-region, while the planned development option was the highest cost. The dispersed option ranked second. The researchers attributed the better result for compact development in the Cambridge area to its uniqueness as a low-density, centrally oriented, high-tech, university community and further noted that densification could "reduce its attractiveness over the longer term."

    Smart Growth Claims: Setting the Record Straight

    Based upon their research and review of the literature, the authors proceed to undermine some of smart growth’s most sacred foundations.

    Smart Growth Claim: Smart growth has little or no impact on house prices:

    Echenique et al: "…restrictions on the supply of development land have led to property price increases, penalizing city dwellers by leading to less dwelling space…”

    Smart Growth Claim: Smart growth increases housing choice:

    Echenique et al: "One downside of this policy is a substantial reduction in choice of dwelling types, with new dwellings being mainly apartments."

    Smart Growth Claim: Smart growth does not increase traffic congestion:

    Echenique et al: The authors cite research indicating that high average density is the main cause of highway congestion in Los Angeles. They also cite Reid Ewing (University of Utah) and Robert Cervero (University of California) who reviewed studies of household travel behavior finding that a doubling of density would lead to only a 5 percent reduction per person, or an increase of 90 percent in travel (Note 1). The authors add: "The obvious conclusion is that an increase in density will increase traffic congestion."

    Smart Growth Claim: Smart growth reduces air pollution:

    Echenique et al: "It can also increase the overall respiratory disease burden as exposure to traffic emissions is increased.

    Smart Growth Claim: "Empty nesters" (aging households with no offspring at home) will seek smaller houses in the urban core: 

    Echenique et al: "There is, however, no substantial evidence that older couples leave their spacious houses and gardens…"

    Smart Growth Claim: Smart growth improves the jobs-housing balance.

    Echenique et al: "One of the main arguments for the dispersed city is that there is no longer a single center where most jobs and services occur. Urban areas, rather, exhibit a dispersed and often polycentric structure, bringing jobs and services closer to residents with a more complex movement pattern not readily served by public transport.

    The authors suggest the following "takeaway:"

    "Urban form policies can have important impacts on local environmental quality, economy, crowding, and social equity, but their influence on energy consumption and land use is very modest; compact development should not automatically be associated with the preferred spatial growth strategy."

    Thus, the Echenique et research contradicts the thesis that compact development or smart growth should replace (make illegal) other regulatory regimes, including the more liberal dispersed pattern.

    "Smart growth principles should not unquestioningly promote increasing levels of compaction on the basis of reducing energy consumption without also considering its potential negative consequences. In many cases, the potential socioeconomic consequences of less housing choice, crowding, and congestion may outweigh its very modest CO2 reduction benefits."

    The British research is an important step toward focusing urban policies on objectives, rather than means. Cities are economic organisms. They have increased their share of the population 10 fold in just two centuries and been pivotal to unprecedented economic growth and affluence. People moved to the cities for economic opportunity, not to sample particular urban forms. Cities best serve their principal purpose and their residents best when they encourage economic growth. The fundamental objective is to maximize the discretionary income of residents, and this can be done while reasonable environmental standards are maintained. Yet, as Echenique et al and others have shown, smart growth tends to retard economic growth. In an age of teetering national economies, failing pension funds and the most uncertain fiscal environment in at least 80 years, the world needs cities to be unleashed for the economic growth. Urban policies that ignore economics need to be replaced with wholistic approaches strongly focused on the key reason that cities exist: to enrich their citizens.

    Wendell Cox is a Visiting Professor, Conservatoire National des Arts et Metiers, Paris and the author of “War on the Dream: How Anti-Sprawl Policy Threatens the Quality of Life.”

    ——

    Photo: Letchworth Garden City, London metropolitan region (by author).

    Note 1: Calculation: According to the research, doubling the density of an area reduces vehicle travel per capita by 5 percent. With 200 percent of the previous population (double the density), vehicle travel would be increased 90 percent (200% [x] 95% [=] 190%).