With Facebook poised to go public, the attention of the tech world, and Wall Street, is firmly focused on Silicon Valley. Without question, the west side of San Francisco Bay is by far the most prodigious creator of hot companies and has the highest proportion of tech jobs of any region in the country — more than four times the national average.
Yet Silicon Valley is far from leading the way in expanding science and technology-related employment in the United States.
To determine which metropolitan areas are adding the most tech-related jobs, my colleague Mark Schill at Praxis Strategy Group developed a ranking system for Forbes that measures employment growth in the sectors most identified with the high-tech economy (including software, data processing and Internet publishing), as well as growth in science, technology, engineering and mathematics-related (STEM) jobs across all sectors. The latter category captures tech employment growth that is increasingly taking place not just in software or electronics firms, but in any industry that needs science and technology workers, from manufacturing to business services to finance. We tallied tech sector and STEM job growth over the past two years and over the past decade for the 51 largest metropolitan statistical areas in the United States. We also factored in the concentration of STEM and tech jobs in those MSAs. (See the end of this piece for a full rundown of our methodology.)
Anyone who has followed tech over the past 30 years or more understands the cyclical nature of this industry — overheated claims of a “tech-driven jobs boom” often are followed by a painful bust. This is particularly true for Silicon Valley. The remarkable confluence of engineering prowess, marketing savvy and, perhaps most critically, access to startup capital may have created the greatest gold rush of our epoch, but the Valley at the end of 2011 employed 170,000 fewer people than in 2000.
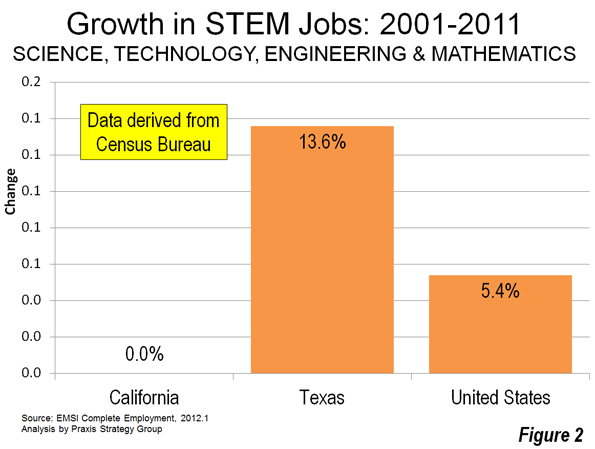
Most of the job losses came in manufacturing, and business and financial services, sectors with a significant number of STEM workers. Even though the current boom has sparked an impressive 8% expansion in the number of tech jobs in the San Jose-Sunnyvale-Santa Clara metropolitan statistical area over the past two years, and 10% over the past decade, the area still has 12.6% fewer STEM jobs than in 2001. Overall, the recent growth and concentration of tech and STEM jobs remains good enough for the San Jose metro area to take seventh place in our ranking of the Best Cities For Tech Jobs. Next-door neighbor San Francisco, ranked 13th, has enjoyed similar tech and STEM growth over the past two years, but over 2001-2011, its total STEM employment inched up only a modest 0.8%.
The Established Winners
So which areas offer better long-term, broad-based prospects for tech growth? The most consistent performer over the period we assessed is the Seattle-Tacoma-Bellevue, Wash., metro area, which takes first place on our list. Its 12% tech job growth over the past two years and 7.6% STEM growth beat the Valley’s numbers. More important for potential job-seekers, the Puget Sound regions has grown consistently in good times and bad, boasting a remarkable 43% increase in tech employment over the decade and an 18% expansion in STEM jobs. Seattle withstood both recessions of the past decade better than most regions, particularly the Valley. The presence of such solid tech-oriented companies as Microsoft, Amazon and Boeing — and lower housing costs than the Bay Area — may have much to do with this.
Our top five includes two government-dominated regions: the Washington-Arlington-Alexandria MSA places second with 20.6% growth in tech employment since 2001 and 20.8% growth in STEM jobs; and Baltimore-Towson, Md., places fifth with 38.8% growth in tech jobs in the same period and 17.2% growth in STEM. Over the past two years, their tech growth has been a steady, if not spectacular 4%. One key to the stability may be the broadness of the tech economy in the greater D.C. area; as the Valley has become dominated by trends in web fashion, the Washington tech complex boasts substantial employment in such fields as computer systems design, custom programming and private-sector research and development.
Diversity in tech may also explain the success of other tech hotspots around the country. No. 3 San Diego-Carlsbad-San Marcos, Calif., has ridden growth in such fields as biotechnology and other life and physical sciences research. Over the past decade, tech employment has grown by almost 30% and STEM jobs by 13% in this idyllic Southern California region, and over the past two years, by 15.7% and 6.5%, respectively. Like San Diego, No. 11 Boston is also a well-established tech star, enjoying 11.3% tech growth over the last decade and nearly 10% over the past two years, with a diversified portfolio that includes strong concentrations in biotechnology, software publishing and Internet publishing. STEM employment, however, has remained flat over the past 10 years though.
New Tech Hotspots
Which areas are the likely “up and comers” in the next decade? These are generally places that have been building up their tech capacity over the past several decades, and seem to be reaching critical mass. One place following a strong trajectory is Salt Lake City, No. 4 on our list, which has enjoyed a 31% spurt in tech employment over the past 10 years. Some of this can be traced to large-scale expansion in the area by top Silicon Valley companies such as Adobe, Electronic Arts and Twitter.
These companies have flocked to Utah for reasons such as lower taxes, a more flexible regulatory environment, a well-educated, multilingual workforce and spectacular nearby natural amenities. Perhaps most critical of all may be housing prices: Three-quarters of Salt Lake area households can afford a median-priced house, compared to 45% in Silicon Valley and about half that in San Francisco.
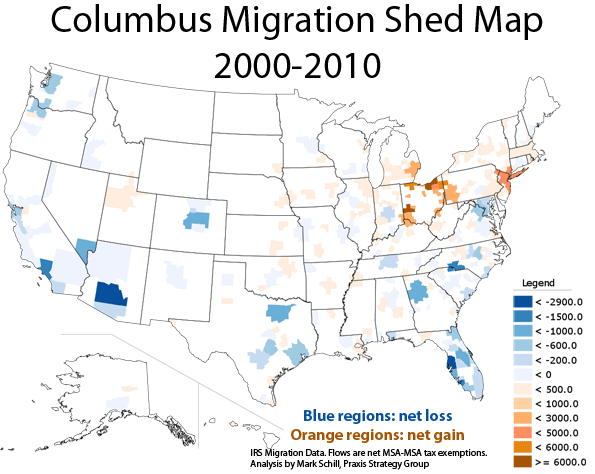
Several other top players with above average shares of tech jobs are emerging as powerful alternatives to Silicon Valley. Like Salt Lake City, eighth-place Columbus, Ohio, boasts above-average proportions of tech and STEM jobs in the local economy, and benefits from being both affordable and business friendly. The Ohio state capital has enjoyed 31% growth in tech jobs over the past decade and 9.5% in the past two years. Raleigh-Cary, N.C., ranked ninth, is another relatively low-cost, low-hassle winner, expanding its tech employment a remarkable 32.3% in the past decade and STEM jobs 15%.
Possible Upstarts
Several places with historically negligible tech presences have broken into our top 10. One is No. 6 Jacksonville, Fla., which has enjoyed a 72.4% surge in tech employment and 17.4% STEM job growth since 2001, mostly as a result of a boom early in the decade in data centers, computer facilities management, custom programming and systems design. Another surprising hotspot: No. 10 Nashville, Tenn., where growth in data processing and systems design fueled tech industry growth of 43% along with 18.5% STEM employment growth over the past decade.
Who’s Losing Ground
Some mega-regions with established tech centers have been falling behind, notably No. 47 St. Louis, No. 45 Chicago, No. 41 Philadelphia and No. 39 Los Angeles. These areas still boast strong concentrations of STEM-based employment and prominent high-tech companies, but have suffered losses in fields such as aerospace and telecommunications. Remarkably despite the social media boom, the country’s two dominant media centers — L.A. and No. 33 New York — have also performed poorly enough that their STEM and tech concentrations have fallen to roughly the national average.
Valley Uber Alles?
Silicon Valley may be churning out millionaires like burritos at a Mexican restaurant, but looking into the future, one has to wonder if its dominance will diminish. Limited developable land, an extremely difficult planning environment, high income taxes and impossibly stratospheric housing costs may lead more companies and people to relocate elsewhere, particularly if the big paydays needed to make ends meet wind down. Mark Zuckerberg and company can bask in their big IPO this week, but the Valley may soon need to consider what it must do to compete with the many other regions that are inexorably catching up with it.
Best Metropolitan Areas for Technology Jobs Rankings
| Region | Rank | Index Score |
| Seattle-Tacoma-Bellevue, WA | 1 | 76.0 |
| Washington-Arlington-Alexandria, DC-VA-MD-WV | 2 | 66.4 |
| San Diego-Carlsbad-San Marcos, CA | 3 | 66.0 |
| Salt Lake City, UT | 4 | 58.5 |
| Baltimore-Towson, MD | 5 | 57.7 |
| Jacksonville, FL | 6 | 57.6 |
| San Jose-Sunnyvale-Santa Clara, CA | 7 | 57.2 |
| Columbus, OH | 8 | 52.9 |
| Raleigh-Cary, NC | 9 | 51.9 |
| Nashville-Davidson–Murfreesboro–Franklin, TN | 10 | 51.7 |
| Boston-Cambridge-Quincy, MA-NH | 11 | 51.4 |
| San Antonio-New Braunfels, TX | 12 | 50.7 |
| San Francisco-Oakland-Fremont, CA | 13 | 48.5 |
| Houston-Sugar Land-Baytown, TX | 14 | 47.6 |
| Cincinnati-Middletown, OH-KY-IN | 15 | 47.4 |
| Austin-Round Rock-San Marcos, TX | 16 | 46.8 |
| Atlanta-Sandy Springs-Marietta, GA | 17 | 46.5 |
| Portland-Vancouver-Hillsboro, OR-WA | 18 | 46.3 |
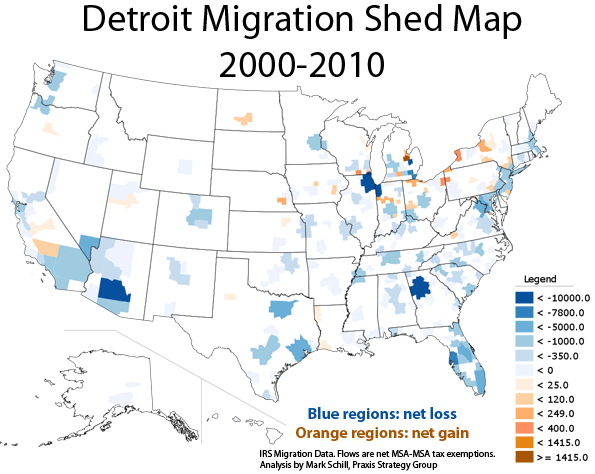
| Detroit-Warren-Livonia, MI | 19 | 46.0 |
| Dallas-Fort Worth-Arlington, TX | 20 | 44.2 |
| Denver-Aurora-Broomfield, CO | 21 | 42.9 |
| Pittsburgh, PA | 22 | 42.9 |
| Buffalo-Niagara Falls, NY | 23 | 42.3 |
| Charlotte-Gastonia-Rock Hill, NC-SC | 24 | 42.1 |
| Indianapolis-Carmel, IN | 25 | 41.5 |
| Minneapolis-St. Paul-Bloomington, MN-WI | 26 | 41.0 |
| Providence-New Bedford-Fall River, RI-MA | 27 | 40.5 |
| Miami-Fort Lauderdale-Pompano Beach, FL | 28 | 40.1 |
| Richmond, VA | 29 | 39.1 |
| Phoenix-Mesa-Glendale, AZ | 30 | 38.7 |
| Louisville/Jefferson County, KY-IN | 31 | 38.6 |
| New Orleans-Metairie-Kenner, LA | 32 | 38.0 |
| New York-Northern New Jersey-Long Island, NY-NJ-PA | 33 | 37.8 |
| Hartford-West Hartford-East Hartford, CT | 34 | 37.6 |
| Tampa-St. Petersburg-Clearwater, FL | 35 | 36.0 |
| Oklahoma City, OK | 36 | 35.7 |
| Orlando-Kissimmee-Sanford, FL | 37 | 35.0 |
| Riverside-San Bernardino-Ontario, CA | 38 | 33.8 |
| Los Angeles-Long Beach-Santa Ana, CA | 39 | 33.7 |
| Las Vegas-Paradise, NV | 40 | 33.4 |
| Philadelphia-Camden-Wilmington, PA-NJ-DE-MD | 41 | 33.3 |
| Sacramento–Arden-Arcade–Roseville, CA | 42 | 33.2 |
| Cleveland-Elyria-Mentor, OH | 43 | 29.9 |
| Rochester, NY | 44 | 29.5 |
| Chicago-Joliet-Naperville, IL-IN-WI | 45 | 26.0 |
| Memphis, TN-MS-AR | 46 | 25.8 |
| St. Louis, MO-IL | 47 | 24.9 |
| Kansas City, MO-KS | 48 | 24.4 |
| Virginia Beach-Norfolk-Newport News, VA-NC | 49 | 24.3 |
| Milwaukee-Waukesha-West Allis, WI | 50 | 24.1 |
| Birmingham-Hoover, AL | 51 | 11.3 |
Joel Kotkin is executive editor of NewGeography.com and is a distinguished presidential fellow in urban futures at Chapman University, and contributing editor to the City Journal in New York. He is author of The City: A Global History. His newest book is The Next Hundred Million: America in 2050, released in February, 2010.
Mark Schill is Vice President of Research at Praxis Strategy Group, an economic development and research firm working with communities and states to improve their economies.
Rankings Methodology
Our Best Cities for Technology Jobs ranking is a weighted index measuring growth and concentration of technology-related employment in the nation’s 51 largest metropolitan regions. The 51 regions are scored against each other on a 1-to-100 scale. The index includes both tech industry employment data and occupation-based employment data. Our technology industry component covers 11 six-digit NAICS sectors covering information industries such as software publishing, Internet publishing, data processing, and tech-related business services such as computer systems design, custom programming, engineering services, and research and development. The technology industry data covers 4.5 million jobs nationally. The occupation-based component includes 95 science, technology, engineering, and mathematics (STEM) occupations as classified by the federal Standard Occupation Classification system. This covers 8 million STEM workers that could be employed in any industry. Employment data in our analysis is courtesy of EMSI, Inc. and is based upon over 90 federal and state data sources.
The index comprises four weighted measures: 50% STEM occupation growth, 25% technology industry growth, 12.5% STEM occupation concentration, and 12.5% technology industry concentration. Growth measures are evenly balanced between the 2001-2011 growth rate and the 2009-2011 growth rate, while the concentration measure are job location quotients from 2011.
Note that there is likely to be some double-counting of STEM workers working in tech industries. The tech industries are also obviously employing others, such as salespeople, managers, janitors, etc.
Though these types of rankings typically include only industry data, we felt the STEM jobs data captured “tech” more cleanly so we weighted it higher. However we felt it still important to include the data covering the industries that most identify with the high-tech economy. The heavier weight on STEM helps minimize the effect of a double-counted STEM worker in a tech company.
Seattle photo courtesy of BigStockPhoto.com.