The latest edition of Demographia World Urban Areas has just been released. The publication includes population estimates, urban land area estimates and urban densities for all nearly 850 identified urban areas in the world with a population of 500,000 or more. These urban areas account for approximately 48% of the world’s urban population. Overall, data is provided for approximately 1500 urban areas, comprising approximately 1.9 billion people, or 52% of the world’s urban population.
Urban areas (or urban agglomerations) are areas of continuous urban development within a metropolitan area (labor market area), and are the physical form of that constitutes the essence a city. Generally, urban areas can be identified by the lights one would see from an airplane at night or in a satellite photograph. Urban areas are not metropolitan areas, which represent the economic or functional form of a city. Urban areas are a component of metropolitan areas, the other component of which is non-urban or rural territory. A metropolitan area is the combination of the urban area(s) and rural areas, which together comprise the economic region or labor market (commute shed).
Over the last year, new census reports have become available in such nations as India, Indonesia, China, Canada, Bangladesh, the United States and South Korea. The new data has resulted in a number of ranking changes from before.
The Megacities: In 2012, 26 urban areas qualify as megacities (Rental Car Tours for 24 of the megacities are available), with populations of greater than 10 million people (Table). As has been the case for nearly six decades, Tokyo remains the largest urban area in the world, with approximately 37 million. New York, which Tokyo displaced in 1955, has fallen to seventh largest and has the lowest population density of any megacity, at 4600 per square mile or 1800 per square kilometer (Note 2). London, which New York displaced in the 1920s never became a megacity due to the imposition of its greenbelt. Instead urbanization leapfrogged into the exurbs of southeast England, where all of the London area’s net population growth has occurred since World War II (London ranked third as late as 1960).
| Table 1 | |||||||
| LARGEST URBAN AREAS IN THE WORLD (MEGACITIES): Estimated 2012 | |||||||
| (Over 10,000,000 Population) | |||||||
| Rank | Geography | Urban Area | Population Estimate | Land Area: Square Miles | Density | Land Area: Km2 | Density |
| 1 | Japan | Tokyo-Yokohama | 37,126,000 | 3,300 | 11,300 | 8,547 | 4,300 |
| 2 | Indonesia | Jakarta | 26,063,000 | 1,075 | 24,200 | 2,784 | 9,400 |
| 3 | South Korea | Seoul-Incheon | 22,547,000 | 835 | 27,000 | 2,163 | 10,400 |
| 4 | India | Delhi, DL-HR-UP | 22,242,000 | 750 | 29,700 | 1,943 | 11,500 |
| 5 | Philippines | Manila | 21,951,000 | 550 | 39,900 | 1,425 | 15,400 |
| 6 | China | Shanghai, SHG | 20,860,000 | 1,350 | 15,500 | 3,497 | 6,000 |
| 7 | United States | New York, NY-NJ-CT | 20,464,000 | 4,495 | 4,600 | 11,642 | 1,800 |
| 8 | Brazil | Sao Paulo | 20,186,000 | 1,225 | 16,500 | 3,173 | 6,400 |
| 9 | Mexico | Mexico City | 19,463,000 | 790 | 24,600 | 2,046 | 9,500 |
| 10 | Egypt | Cairo | 17,816,000 | 660 | 27,000 | 1,709 | 10,400 |
| 11 | China | Beijing, BJ | 17,311,000 | 1,350 | 12,800 | 3,497 | 5,000 |
| 12 | Japan | Osaka-Kobe-Kyoto | 17,011,000 | 1,240 | 13,700 | 3,212 | 5,300 |
| 13 | India | Mumbai, MAH | 16,910,000 | 211 | 80,100 | 546 | 30,900 |
| 14 | China | Guangzhou-Foshan, GD | 16,827,000 | 1,225 | 13,700 | 3,173 | 5,300 |
| 15 | Russia | Moscow | 15,512,000 | 1,700 | 9,100 | 4,403 | 3,500 |
| 16 | Bangladesh | Dhaka | 15,414,000 | 134 | 115,000 | 347 | 44,400 |
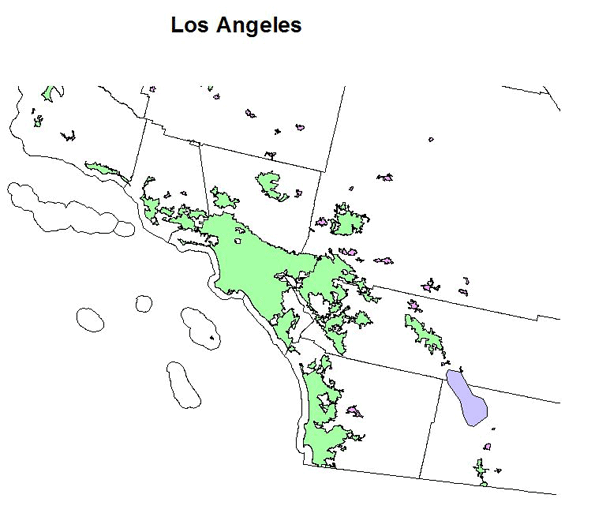
| 17 | United States | Los Angeles, CA | 14,900,000 | 2,432 | 6,100 | 6,299 | 2,400 |
| 18 | India | Kolkota, WB | 14,374,000 | 465 | 30,900 | 1,204 | 11,900 |
| 19 | Pakistan | Karachi | 14,198,000 | 300 | 47,300 | 777 | 18,300 |
| 20 | Argentina | Buenos Aires | 13,639,000 | 1,020 | 13,400 | 2,642 | 5,200 |
| 21 | Turkey | Istanbul | 13,576,000 | 540 | 25,100 | 1,399 | 9,700 |
| 22 | Brazil | Rio de Janeiro | 12,043,000 | 780 | 15,400 | 2,020 | 6,000 |
| 23 | China | Shenzhen, GD | 11,885,000 | 675 | 17,600 | 1,748 | 6,800 |
| 24 | Nigeria | Lagos | 11,547,000 | 350 | 33,000 | 907 | 12,700 |
| 25 | France | Paris | 10,755,000 | 1,098 | 9,800 | 2,844 | 3,800 |
| 26 | Japan | Nagoya | 10,027,000 | 1,475 | 6,800 | 3,820 | 2,600 |
Jakarta (Jabotabek) has emerged as the world’s second largest urban area, with a population of 26 million. This is a larger population than reported by the United Nations, since its estimates include little more than DKI Jakarta, the national capital district and beyond which urbanization stretches for a considerable distance. Continuing suburban growth in Seoul-Incheon secured that urban area a ranking of third, with approximately 22.5 million people. As was reported last year, new estimates indicate that Delhi has emerged as India’s largest urban area, with a population of 22.2 million and a growth rate that should result in its passing Seoul-Inchon in a matter of a few years. Mumbai, which like Mexico City in the 1980s has often been promoted as being destined to become the largest urban area in the world, was passed by Delhi over the past decade and has become the second largest urban area in India.
Manila is ranked as the fifth largest urban area in the world, with 22.0 million people. In Manila, as in Jakarta, the population reported to the United Nations is far below that of the genuine urban area. The reported population is for the National Capital Region (popularly and misleadingly called "Metro Manila), which represents approximately one-half of the population of the urban area, which stretches into four additional provinces (Cavite, Laguna, Rizal and Batangas). If the population of the Washington urban area were reported in the same manner, it would be 600,000 – the population of the District of Columbia – rather than the 4.6 million indicated in the 2010 census for the entire urban area.
Los Angeles, until recent years one of the fastest growing urban areas in the world, has dropped to 17th largest in the world and seems destined to drop out of the top 20 in the next decade or two. Fast growing Karachi, Istanbul, Lagos and others could become larger than Los Angeles. Los Angeles reached its peak ranking of 6th largest in the world from 1965 through 1980 and entered the top ten by 1950.
Over the past decade, Paris became a megacity, reaching a population of 10.7 million. Paris has been Western Europe’s fastest growing large urban area since World War II. All of its growth since 1921 has been in the suburbs, which stretch over more than 1,000 miles (2,600 square kilometers). This is more land area than Houston’s suburbs, but more densely populated. Since 1921, the historical core municipality (the ville de Paris) has dropped in population from 2.9 million to 2.2 million.
By world standards, the Paris urban area has grown slowly, having fallen from being the world’s third largest in 1965 to its current ranking of 23rd. However, over the past census period, Paris added 600,000 residents, compared to less than 200,000 in the previous period, indicating a decline in out-migration and a higher natural population rate increase.
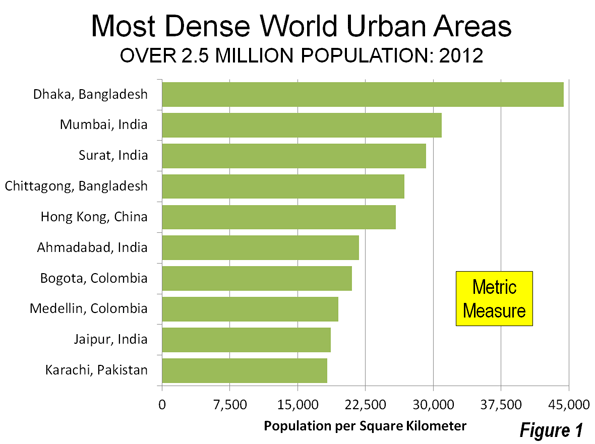
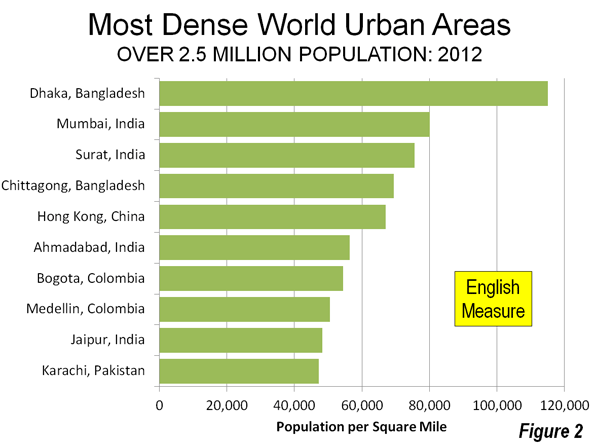
Urban Area Densities: Dhaka, the capital of Bangladesh grew strongly between 2001 and 2011 and is by far the most densely populated urban area in the world. Dhaka’s density is estimated at 115,000 per square mile or 44,000 per square kilometer, with slum (informal dwelling) densities reported report up 4,210 per acre, or 2.7 million per square mile (1 million per square kilometer). At this density, all of the world’s 3.7 billion urban residents could be accommodated in an area approximately equal to that of the Washington (DC-MD-VA) urban area. All of Dhaka’s urban population of 15.4 million fits into a land area equal to that of the city (municipality) of Portland (population less than 600,000). Nonetheless, analysts have referred to this example of the ultimate of urban density to be "sprawling."
Among the urban areas with more than 2.5 million population, the second-most dense is Mumbai, at 80,100 per square mile or 30,900 per square kilometer. The most dense high income world urban area is Hong Kong, at 67,000 persons per square mile or 25,900 per square kilometer. Of course, Hong Kong’s density is the result of an accident of history, which resulted in huge migration to the former British colony following World War II. Hong Kong is more than twice as dense as the second most dense high income world urban area, Busan, Korea. The smaller nearby, yet historically similar enclave of Macau (560,000) has an even higher density than Hong Kong, at 70,000 per square mile (27,000 per square kilometer).
Seven of the densest urban areas with more than 2.5 million population are on the Asian subcontinent. These include Dhaka and Chittagong in Bangladesh, Mumbai, Ahmedabad, Surat and Jaipur in India and Karachi, in Pakistan. Colombia has two of the densest, Bogota and Medellin. Hong Kong is the only high income nation urban area among the 10 densest (Figures 1 & 2).
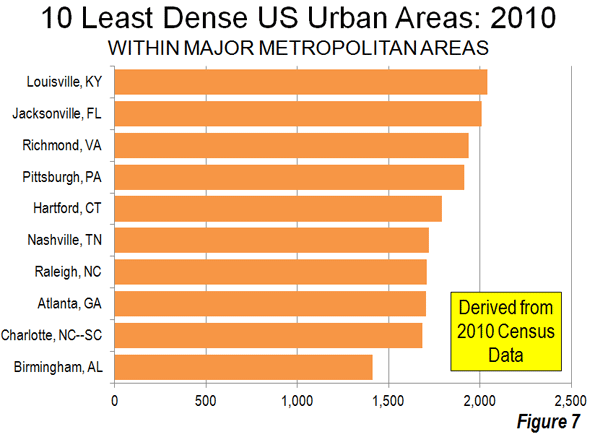
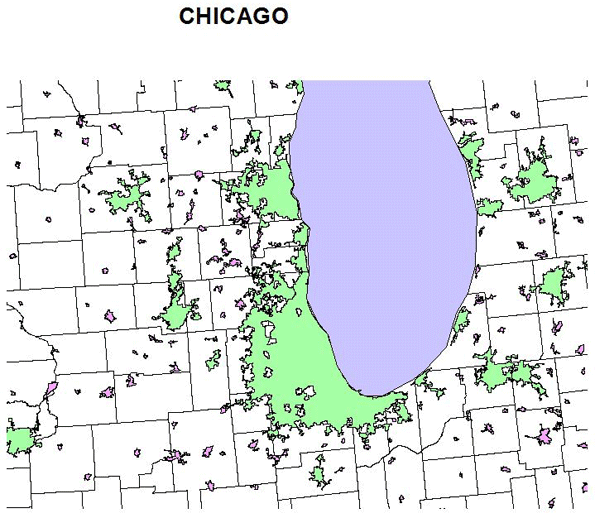
The least dense urban areas with more than 2.5 million population are all in the United States. The least dense is Atlanta, with 1800 people per square mile or 700 per square kilometer. The second least dense is, perhaps surprisingly, Boston, despite its reputation for high density. Boston’s population density is 2200 per square mile or 800 per square kilometer. Also, perhaps surprisingly, Philadelphia is the least dense urban area in the world with more than 5 million population, while Chicago is the least dense urban area of more than 7.5 million. The lower density of US urban areas is illustrated by the fact that Portland, with its reputation for higher density and densification planning, would have ranked 11th least dense, if it had reached the 2.5 million threshold used in this ranking.
Most Extensive Urban Areas: New York covers the most land area of any urban area at nearly 4500 square miles or 11,000 square kilometers. Tokyo covers 3300 square miles or 8500 kilometers. Chicago is the third most expansive urban area, at 2,600 square miles (6,900 square kilometers). Los Angeles, which has long been perceived as the most sprawling of world urban areas, ranks fifth, covering 2400 square miles or 6,300 square kilometers. Atlanta and Boston, the world’s least dense major urban areas, rank 4th and 6th, covering 2,600 and 2,100 square miles respectively (6,900 square kilometers and 5,400 square kilometers).
The Continuing Exodus from Rural Areas: Around the world, people continue to seek the promise of better economic outcomes in urban areas. United Nations forecasts indicate that another 2.5 billion people will be added to urban areas by 2050, while rural areas (which contain all population not urban) will be reduced in population by 300 million. The world’s urban population is expected to rise from today’s nearly 53 percent to 67 percent. More than 90 percent of the urban growth is expected to be in less developed nations.
Wendell Cox is a Visiting Professor, Conservatoire National des Arts et Metiers, Paris and the author of “War on the Dream: How Anti-Sprawl Policy Threatens the Quality of Life”.
——
Note 1: Demographia World Urban Areas uses national census authority urban area population and land area data in the few nations designating urban areas on a basis generally consistent with that of the United States Census Bureau. Elsewhere, land area estimates are determined using satellite photography (Google Earth). Population estimates are also obtained from a variety of sources, such as United Nations data, where it is reflective of the urban area population (some data reported to the United Nations is for jurisdictions that are only a part of the urban area and in other cases, metropolitan area data is reported), estimates relying on a "build-up" of local authority data from national census authorities and other sources. Demographia combines some adjacent urban areas when they are contained within the same metropolitan area or consolidated area, such as in New York and Los Angeles (for a complete list see Demographia World Urban Areas). Also see: Urban Terms Defined.
Note 2: Exceptions: In some cases, continuous urbanization does not constitute a single urban area because they are not within a single labor market (metropolitan area). This can be the case within a nation, such as in the Pearl River Delta of China, where Shenzhen, Dongguan, Zhongshan, Jiangmen, Huizhou, Zhuhai, Guangzhou-Foshan and Hong Kong, which are separate labor markets. International borders (and the Hong Kong-Shenzhen border) also define separate urban areas if free movement of labor is not permitted. Thus Detroit and Windsor or San Diego and Tijuana are separate urban areas because free movement of labor is not permitted. On the other hand, treaties permit virtual free movement of labor between the French and Belgian sides of the Lille urban area and between the Swiss and French components of the Geneva urban area.
—-
Photo: Recent migrants to Dhaka slum in NGO school (photo by author)