Blog

  • Population Growth as the Cure for the Incredible Shrinking City?

    The 1957 sci-fi classic The Incredible Shrinking Man reads like a Rust Belt city script. In it, the lead actor is afflicted with the anti-natural: shrinkage in a world of growth. The rest becomes existential. From the movie review blog “Twenty Four Frames”:

    He hates being a scientific experiment and a spectacle for the media. He is no longer the everyday 1950′s image of the middle class, white picket fenced American man. Instead, he now fights for survival in his own house where everyday objects are now the enemy to his existence. Finally, he must face the biggest question of all. If he continues to shrink, will he eventually even exist?

    Such is the mood behind revitalization efforts in shrinking city America, particularly the Rust Belt. There, population decline has been occurring for decades. It still occurs. The Cleveland metro lost nearly 83,000 people from 2000 to 2012. The Pittsburgh metro lost over 67,000. This is in contrast to the region’s “greenfield economies”—defined as “the set of conditions that flow from building on new territory or exploiting new markets vs. the redevelopment of old places”. For example, the geographically-expanding Columbus metro added 260,000 people from 2000 to 2012. The top feeder region into Columbus was Greater Cleveland.

    The dynamics behind these demographic patterns are fairly intuitive. Population gains and losses are a factor of a region’s employment picture. Cleveland Fed economist Joel Elvery explains:

    Urban economists like to divide a regional economy into two sectors: tradable and nontradable. The tradable sector produces goods and services that are sold outside of the region; the nontradable sector produces goods and services for use in the region…If the industries that make up the tradable sector are growing nationally, then the region will most likely grow. If the tradable sector is struggling, eventually the region will also struggle.

    In the case of Cleveland, one of the region’s main tradable sectors is manufacturing. That said, technological advances in manufacturing means it takes less people to make a product. In the 1950s an auto worker made on average seven cars per year. A worker can make 28 today. The effect of the increased productivity is a loss of jobs. The effect of job loss is a declining population.

    Put a fork in the Rust Belt, right?

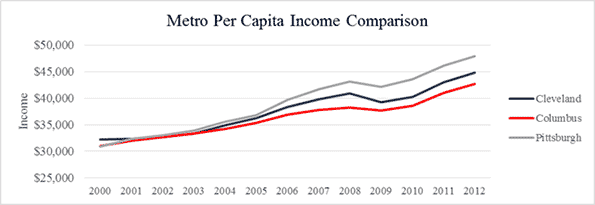
    Not exactly. Figure 1 shows the metro per capita income for Cleveland, Pittsburgh, and Columbus. The metros’ incomes were even around 2003, but then Pittsburgh and Cleveland began diverging from Columbus around 2005. Of importance here is that Pittsburgh and Cleveland have had higher per capita income growth than Columbus despite their declining population. This goes against the grain of traditional urban development thinking in which growth is god.

    Figure 1: Source, US Bureau of Economic Analysis via Telestrian

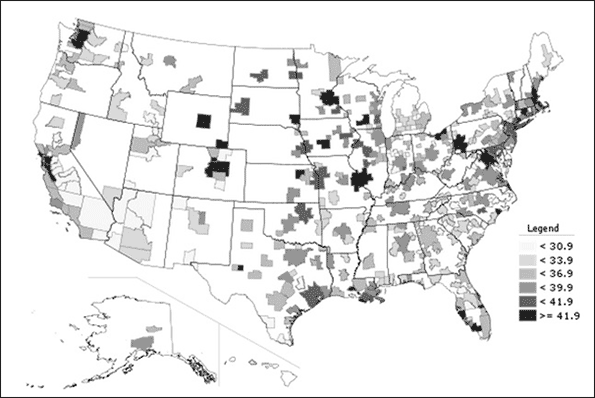
    Looking at real per capita income at purchasing power parity (PPP), or income adjusted for inflation and how far a dollar goes in a given metro, the trends hold. The map below shows the real per capita income (PPP) for all metros for the United States. Notice Greater Cleveland and Greater Pittsburgh stand out, with values at or above $42,000 a year. In fact, in ranking the nation’s largest metros (over 1 million people), the highest real per capita metros were Hartford, Boston, and San Francisco, followed by Pittsburgh 6th and Cleveland 11th. Not bad for “dying” metros. Columbus clocked in at 28th, while peer Rust Belt metro Detroit was 44th out of 51.

    Map: Map of real per capita personal income adjusted for inflation (in 2005 chained dollars) and regional purchasing power. In thousands of dollars (2011). Source, U.S. Bureau of Economic Analysis via Telestrian.

    Why is greater per capita income growth happening in the Rust Belt compared to Columbus? We have to keep in mind that a rising per capita income is not necessarily associated with a robust economy, particularly for regions that have flat or declining populations. Specifically, a metro, such as Cleveland, can gain in per capita income simply due to a significant out-migration of low- and middle-income workers. Such a scenario could prove problematic if the area’s total personal income is decreasing across time, because then the overall economy is contracting.

    But this is not the case. Figure 2 shows the total personal income for the three metros from 2000 to 2012. Both Cleveland’s and Pittsburgh’s total personal income levels increase despite declining populations. This effect has been called “growth without growth” by the Brookings Institution, and it occurs when a workforce is becoming more educated and productive at the same time overall population declines.

    Figure 2: Source, US Bureau of Economic Analysis

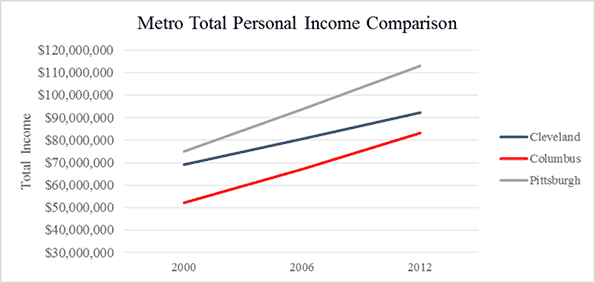
    This is what is happening in the Cleveland metro. Data from a new study I co-authored with Jim Russell out of the Center for Population Dynamics at Cleveland State University showed that from 2000 to 2012, Greater Cleveland gained over 63,000 educated residents, while simultaneously losing nearly 74,000 residents without a college degree. Over two-thirds of this brain gain occurred between 2006 and 2012. The fastest growing cohort was for college-educated Greater Clevelanders 65 and plus—a 30% increase. The number of Greater Clevelanders with a college degree aged 25 to 34 increased by 23%. Conversely, the vast majority of the out-migration was made by people aged 35 to 44 without a 4-year degree.

    This population dynamic is partly the result of Cleveland’s restructuring from a labor- into a knowledge-based economy. Specifically, growing tradable industries, like STEM and health care employment—which have driven job growth in Cleveland—are able to attract and retain skilled residents, whereas slower-growth industries are “pushing” less skilled workers elsewhere. Many of these non-degreed workers find a better return on investment in areas that are gaining in population, particularly if they are employed in the local consumer economy. Think laborers and much of the service class. This notion is supported by the fact that from 2000 to 2011, the average income of a person that moved from Greater Cleveland to Greater Columbus was $38,000 a year. Such a re-positioning of less-educated workers partly explains that while the Columbus metro is gaining on Greater Cleveland in total income, it is not the case with per capita income. Notes the Cleveland Fed: “Per capita income growth [in Columbus] is under increasing pressure to continue rising as population growth exceeds income growth”.

    So yes, Cleveland shrinks. But it is not about brain drain, but about rational choice theory. And while population loss is troubling for any city, it is in many respects a necessary demographic result as a region like Greater Cleveland transitions from brawn- to brain-intensive work.

    Think of this as a “one step at a time” approach to the existential plight that is the incredible shrinking city—meaning Cleveland’s migration needs are currently about quality, not quantity. This is because economic growth is not likely to be achieved through an increase in local consumption. Local jobs are created from emerging tradable industries, not vice versa—five service jobs are made for every new high-skill job in fact. And emerging industries are created via human capital, not consumer demand.

    “Consumer demand does not necessarily translate into increased employment,” writes John Papola in Forbes. “That’s because ‘consumers’ don’t employ people. Businesses do.”

    So where does Cleveland go from here?

    It needs to look to Pittsburgh. The sister Rust Belt city has had a human capital formation that has been nothing short of astonishing. University of Pittsburgh economist Chris Briem calculated that the metro ranked fifth in the nation when it came to the percentage of young adult workers with a bachelor’s degree, behind only Boston, San Francisco, D.C., and Austin. What’s more, Greater Pittsburgh ranked first for the highest concentration of young adult workers with a graduate or professional degree.

    “Change in the Pittsburgh economy is reflected in many ways,” writes Briem, “but probably no more profoundly than in the educational attainment of its workforce”.

    Greater Cleveland doesn’t perform too shabbily either, ranking 17th in the nation in the number of young adult workers with a bachelor’s degree, and 7th in the nation for young workers with a graduate or professional degree, ahead of knowledge hub darlings Seattle and Austin.

    In other words, Cleveland’s got something to build on: the quality of its young adult workforce. So instead of dumping money on brain drain boondoggles, or expending significant public expenditure on things like hotels and casinos that intend to drive economic growth from consumption on up, the region needs to pull out all the stops on growing a critical mass of talent. Because, as my colleague Jim Russell puts it, “talent is the new oil”.

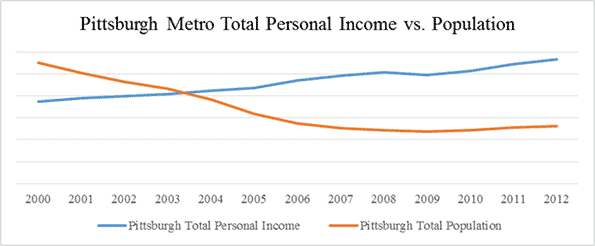
    Eventually, once the region’s new economy sectors are revved up, then job growth for both skilled and less skilled work will increase, making the region amenable to population gain. This is the case in Pittsburgh, where population loss has recently turned into a slight gain after decades of decline (See Figure 3).

    Figure 3: Source, American Community Survey, Bureau of Economic Analysis

    But until that growth happens the Rust Belt will be stubbornly mired in its existential crisis. Shrinking, struggling, and wishing on silver bullets and outdoor chandeliers. But maybe there is room for measured hope. More exactly, we shrink therefore we are?

    "I was continuing to shrink, to become… what? The infinitesimal? What was I? Still a human being?,” wonders the incredible shrinking man in the film’s closing monologue. “Or was I the man of the future?”

    Well, considering what the cost of living is doing to the coasts, maybe the notion of Pittsburgh as the city of the future isn’t so farfetched. The Clevelands of the world would be wise to wager so, and then model accordingly.

    Richey Piiparinen is a Senior Research Associate who leads the Center for Population Dynamics at the Levin College of Urban Affairs at Cleveland State University. His work focuses on regional economic development and urban revitalization.

    Top image: Courtesy of Universal Pictures

  • May the (Insidious) Force Be With You

    Google Earth pic to the left of the boundary between Detroit and suburban Grosse Pointe Park, MI. Alter Road (cutting from upper left to lower right) is the boundary between the two. Take note of the differences in vacant land between Detroit (on the left) and Grosse Pointe Park (on the right).

    Too many people think today’s “de facto” segregation in metro areas is the result of personal preferences expressed by individuals, when the fact is that public policy has created the conditions we live with today.  In fact, I see the demise of Jim Crow through the Civil Rights Act and the Voting Rights Act corresponding with the immediate rise of an insidious, “non-racist” racism that shapes our metros today.  Our metro areas have never dealt with this.

    In the aftermath of the Donald Sterling controversy (which, if you aren’t aware of, you truly are under a rock), the Atlantic’s Ta-Nehisi Coates posted an on-spot critique of how racism is viewed and how racism is really working in today’s society.  It is a truly beautiful piece on the perception of racism versus its realities — the perception being that racism is the purview of dunces like Sterling (and Cliven Bundy before him) who get caught making inelegant statements that shed light on their true feelings, and a reality that is far more insidious and receives far less attention.  Coates describes how “elegant racism”, that insidious force, shapes where we live, what jobs are available to us, how we’re educated, and who is incarcerated and who isn’t:

    “Elegant racism is invisible, supple, and enduring. It disguises itself in the national vocabulary, avoids epithets and didacticism. Grace is the singular marker of elegant racism. One should never underestimate the touch needed to, say, injure the voting rights of black people without ever saying their names. Elegant racism lives at the border of white shame. Elegant racism was the poll tax. Elegant racism is voter-ID laws.”

    And to better describe how “elegant racism” works, he cites Chicago as its key implementer:

    “Throughout the 20th century—and perhaps even in the 21st—there was no more practiced advocate of housing segregation than the city of Chicago. Its mayors and aldermen razed neighborhoods and segregated public housing. Its businessmen lobbied for racial zoning. Its realtors block-busted whole neighborhoods, flipping them from black to white and then pocketing the profit. Its white citizens embraced racial covenants—in the ’50s, no city had more covenants in place than Chicago.

    If you sought to advantage one group of Americans and disadvantage another, you could scarcely choose a more graceful method than housing discrimination. Housing determines access to transportation, green spaces, decent schools, decent food, decent jobs, and decent services. Housing affects your chances of being robbed and shot as well as your chances of being stopped and frisked. And housing discrimination is as quiet as it is deadly. It can be pursued through violence and terrorism, but it doesn’t need it. Housing discrimination is hard to detect, hard to prove, and hard to prosecute. Even today most people believe that Chicago is the work of organic sorting, as opposed segregationist social engineering. Housing segregation is the weapon that mortally injures, but does not bruise.”

    (Let’s parenthetically stop here for a second; the symbolism in that last sentence is incredible.  The implication is that victims of elegant racism “die” from internal injuries, which are often believed to be sustained from a lifetime of poor personal choices.  But elegant racism made those choices for them.  Absolutely incredible).

    I don’t know if Chicago was the innovator of this type of racism, but I do believe it was something created in Northern industrial cities — i.e., the Rust Belt.  I suspect it has its seeds in the antebellum North, whose cities had small African-American populations prior to the Civil War and immediately afterwards.  I imagine at that time, when blacks comprised maybe less than five percent of, say, Buffalo’s population, it was relatively easy to isolate blacks without necessarily singling them out, as in the Jim Crow South.

    But the Great Migration changed everything.  The need for industrial labor in the North, and rapidly declining conditions in the Jim Crow South, pushed African-Americans into Northern cities.  Once there they encountered competition for jobs and housing from both longtime “nativists” and more recent European immigrants.  The ten years from 1910-1920 were fraught with racial conflicts in Northern cities, culminating with the Red Summer of 1919.

    But Northern cities did something that Southern ones did not.  They sought to limit and stigmatize the places where blacks lived, instead of limiting or stigmatizing the people themselves.  Out of this a whole set of policies emerged.  Racial covenants.  Redlining emerges during the New Deal.  Blockbusting came about as a tool to clear room for a growing black population, accelerate suburban expansion, and enrich real estate speculators.  Public housing was concentrated where blacks lived, and infrastructure investments ground to a halt.  Investments in education fell behind that of suburban schools, or couldn’t keep up with growing social challenges.  “Tough-on-crime” measures like mandatory sentencing and the “War on Drugs” were effective in removing potential workers from the workforce, reducing competition.  Taken together, these “non-racist” racist policies, often grounded in sound, rational economic thinking, created deeply ingrained patterns within metros that shape them today.

    This position is further buffeted by research done by Nancy DiTomaso, a business professor at Rutgers University in New Jersey.  In her book, The American Non-Dilemma: Racial Inequality Without Racism, she says this:

    “Because whites disproportionately hold jobs with more authority, higher pay, more opportunities for skill development and training, and more links to other jobs, they can benefit from racial inequality without being racists and without discriminating against blacks and other nonwhites. In fact, I argue that the ultimate white privilege is the privilege not to be racist and still benefit from racial inequality.”

    There are other strong claims made by DiTomaso in that interview; it (and the book, which I loved) is worth your attention.

    In my opinion the practice was perfected in the Rust Belt but has spread everywhere.  Milwaukee Journal-Sentinel is doing a series on political segregation in southeastern Wisconsin, and found that its roots are in the state’s residential segregation legacy.  Lee Atwater’s famous quote about the abstraction of racial policies, uttered in 1981, possibly signaled to Southern metros that there was a way to accomplish the separation that Jim Crow had earlier provided.  I see a correlation between the number of blacks within a metro area, and the impact of insidious policies on residential and job patterns.  In some metros, the impact, while there, is not as strong (New York, Boston), because of lower relative numbers of blacks.  In some Sun Belt metros, Jim Crow likely enforced similar patterns but subsequent post-War growth and the new policies altered things a little (Atlanta, Charlotte, Nashville).  In other Sun Belt metros with more recent growth the numbers of blacks has hardly been enough for full-on “elegant racism” implementation (Phoenix, Las Vegas).  But insidious racism is a critical feature of today’s Rust Belt cities.

    This is in part why I’m skeptical of new calls from urbanists to increase affordable housing in cities, when I see vast neighborhoods that have suffered from policies that simply removed them from the consciousness of the majority of the housing market.  I’d prefer to address yesterday’s mistakes before creating new ones.

    Plus, I keep thinking about that saying that the only thing necessary for evil to prosper is for good people to do nothing…

    This post originally appeared in Corner Side Yard on May 9, 2014.

    Pete Saunders is a Detroit native who has worked as a public and private sector urban planner in the Chicago area for more than twenty years.  He is also the author of “The Corner Side Yard,” an urban planning blog that focuses on the redevelopment and revitalization of Rust Belt cities.

  • Connecting Citizens to Economic Opportunity

    I recently received an email from the folks behind the Meetings of the Minds conference asking if I’d participate in a group blogging event they were doing by writing a post on the topic of “How can cities better connect all their residents to economic opportunity?” As this is a topic I personally care quite a bit about, I was happy to do so. They will be linking to responses to other people’s answers should you be interested.

    Firstly, what is economic opportunity? Simply put, I’ll define it as a) a job, b) a better job, or c) an opportunity to start a business. There are a number of possible avenues one could suggest for making one of these outcomes more likely: better education, better transportation, migration assistance (which I’ve written about before), and more.

    But many of those are difficult to implement, uncertain in their result, long term to realize benefits, and require money that we don’t have. That doesn’t mean we shouldn’t tackle them, but I can’t help but ask: what can we do that would be relatively fast to implement, provide jobs and entrepreneurship opportunities where people already are (particularly those who are lacking a decent job today), and which has a relatively high likelihood of payoff?

    In my view overwhelmingly the number one thing we can do that fits this is to pare back the local regulatory burden on small business. I say local because affecting federal or state regulations involves making change at levels of government that are hard to move. Local regulations are mostly within the control of local political leaders. Changing them doesn’t require spending a lot of money. In fact, eliminating regulations might actually save the government money. Change a regulation and it’s changed immediately, and without a lag. It seems intuitive that lighter touch regulation would help small businesses launch and thus have some benefit.

    There always are possibilities of unforeseen problems, of course, which should be watched for. And actually, significant improvement can be made without implementing some “anything goes” environment. The goal isn’t necessarily to have low standards. Rather, we can have high standards. But they have to operate objectively, transparently, and predictably, and in a timely fashion. And they have to be things businesses can realistically be expected to do without seeking special exemptions.

    Why focus on small businesses? Because starting a small business is fastest path to the middle class in many of our cities today, cities that are often places where the middle class is getting killed. As the NYT recently put it, the King can’t even afford Queens anymore. What we’re seeing in cities is a bifurcated economy with lots of high end jobs and lots of low end service class jobs, but shrinking middle class employment prospects. Major large scale manufacturers aren’t coming back, so the idea of traditional work at the plant is largely gone.

    So what’s left in the middle? There are basically three things: 1) government employment (which is shrinking because we’re in a fiscal squeeze 2) skilled trades (a viable path more people probably should follow, but sometimes with its own limits such as having a connection to get you into the union) 3) start a business to create your own opportunity.

    Regulatory change is targeted right at #3. Let’s make it easy for people to start businesses and support the best path to the middle class we have. And also the best path to creating traditional employment in city neighborhoods where high end banks and internet companies and such aren’t setting up shop. Many of these neighborhoods have seen their job base obliterated. By reducing the barriers to entry and success in business, we are helping people create their own jobs – and maybe to create jobs for others down the road.

    There’s only one major challenge to local small business regulatory relief – political will. Change isn’t necessarily financially difficult, it’s politically difficult. But how many mayors are championing small business? Next to none. Compare how much effort big city mayors put into improving their business climate for traditional small businesses vs. say select segments like tech, and you see right away where the priorities are.

    The stories of the insane difficulties small businesses have to go through in places like New York, Chicago, and San Francisco are incredible and widely known but rarely feature in the urbanist discourse unless it’s a hip establishment like a frozen custard stand, a high end shared kitchen, etc. When even a guy like Matthew Yglesias experiences pain trying to set up his one man shop, imagine how hard it must be for everybody else? We have no clue what lower income, minority, and immigrant entrepreneurs must be going through to pursue their dream of starting a business.

    What we need is for America’s mayors to stand up and make it a priority to start whacking away at this stuff. Waive fees for the first year for most permits (easy to do by charging in arrears). So many small businesses don’t even make it a year. Let’s give them at least that long to survive before we start socking them. Create a single point of contact for permit checklists and safe harbor protections for businesses that do what this office tells them. A true one stop shop would be best, but that’s likely harder than we think given the different agencies involved, but why not start by at least having someone who authoritatively tells you want agencies you do need to talk to and which permits you do need? Price permits at the cost of administering the permitting and compliance system. Hold management accountable for timely actioning. Use electronic forms wherever possible. The list goes on.

    Part of this is simply resisting the urge to pile on one regulation after the next. For example, a recent urbanist darling is banning plastic bags. The impact on the environment will be almost precisely zero, but it’s just one more thing businesses have to deal with. As Rhode Island Builder’s Association Executive Director John Marcantonio put it, “It’s not one specific regulation, it’s death by a thousand paper cuts.” Before adding on a new regulation, we should be sure there’s an absolute, bona fide need to. Because if we don’t, then over time we’ll accrete an absolute mess that makes it way too difficult to do things we actually want people to do.

    I’d go so far as to that that if you’re a mayor who isn’t putting a serious focus on improving the regulatory climate for small business, you’re not serious about retaining or building a middle class and stopping the development of a two tier economy. Especially in big cities this is a huge, well known need. There’s no excuse for mayors of either conservative or progressive bents not putting a major push behind making it happen.

    Aaron M. Renn is an independent writer on urban affairs and the founder of Telestrian, a data analysis and mapping tool. He writes at The Urbanophile, where this piece originally appeared.

    Self employment photo by BigStockPhoto.com.

  • Thinking About Housing in the Northwest

    With one of the most successful economies in the nation, the real estate news in the Pacific Northwest is positive and gives hope for a housing sector recovery, albeit at different rates in different markets. CNNMoney reports that from the third quarter in 2012 to the third quarter in 2013, the median home price in the Seattle-Bellevue and Everett area increased by 13.7%. The forecast for changes from the third quarter in 2013 to the third quarter in 2014 is another 5.2%. Tacoma’s (Pierce County) housing prices did not grow as quickly, with an increase of 9.3% from 2012 to 2013, but it is expected to witness a sharper increase in 2014, with a healthy 8.6% change from the third quarter of 2013 to 2014. 

    As rosy as the real estate picture is, we should also remember that in the second quarter of 2013, as housing values began to climb in both markets, median family incomes were already too low compared to median home prices. In Seattle, the ratio of median home prices to median family income was 4.7, and in Tacoma it was 3.6. That made Tacoma a relatively affordable city. However, an expected increase of 8.6% in home values, without a corresponding increase in median family incomes will not do much for its affordability.

    Without a major change in its employment structure that might lead to higher incomes for current and future residents of Tacoma, the differential in home prices could make Tacoma a residential destination for Seattle employees finding this city comparatively more affordable. Living half an hour from work, but paying significantly less for housing, is a great incentive, especially for young, single or double income, and childless families. For them, a two-bedroom condo with a view of Commencement Bay may do the job. For Tacoma residents whose median family income is about $20,000 less than their Seattle counterparts, rising home values may prove to be a challenge that cannot be easily overcome without a higher number of well-paying jobs that keep pace with rising home values.

    Regional patterns of housing affordability

    It is no longer news to anyone that most unaffordable cities rely on their less costly neighbors to house their working populations. The city of Los Angeles relies on the vast sprawl of its own suburbs and the Inland Empire. San Francisco does the same by having people commute from the larger urban region, all the way from the San Joaquin Valley.

    The relationship between Seattle and other cities in King and Pierce Counties already follows the same script. Morning commutes into Seattle and afternoon rush hour traffic heading out of Seattle do not require statistics. The numbers are felt by anyone driving during those hours. However, two maps will help paint a vivid picture of the regional urban dynamics created by the unholy triangle of housing market price differentials, economic development patterns, and the resulting spatial mismatch between home and work places. 

    Maps for median housing values and commuting patterns in King and Pierce Counties clearly show that a good number of people who work in unaffordable regions of King County (including Seattle) rely on more affordable housing elsewhere. As the map of commuting patterns illustrates, for Pierce County, this starts right at the county border, where housing prices are lower (compared to median household incomes). This has already turned certain portions of Pierce County into bedroom communities, feeding economic growth elsewhere. In other words, job-rich areas are resolving their housing problems by pushing their employed populations to other areas, where home prices are more affordable. However, will the growth of housing demand in areas outside employment centers translate to increased housing values in previously affordable regions and push long-time residents out of the housing market?

    To answer this question, we need to engage in a more detailed level of analysis.


    Micro-geographies of affordability

    In order to get a better sense of housing affordability patterns, we can rely on a simple indicator called median multiples (the ratio of median housing value to median household income). While this measure has its critics, it is easily understandable. The basic premise is that when median housing value exceeds median household income more than three fold, an area becomes unaffordable.

    A few years ago, Wendell Cox used this method to identify the least affordable cities in the nation. He used the following table to classify various cities in the U.S.:

    Demographia
    Housing Affordability Ratings

    Rating

    Median Multiple

    Severely Unaffordable

    5.1 & Over

    Seriously Unaffordable

    4.1 to 5.0

    Moderately Unaffordable

    3.1 to 4.0

    Affordable

    3.0 or Less

    Median Multiple: Median House Price divided by Median Household Income


    The map of median multiples for King and Pierce Counties reveals a pattern of housing affordability that indicates a looming problem as the housing market recovers. As of Census 2012, almost all Seattle and Bellevue areas were unaffordable, with median multiples exceeding 5. Comparatively speaking, Tacoma has had more affordable housing areas (with more census tracts with median multiples ranging from 3 to 4).  Between Tacoma and Seattle, areas such as Federal Way have more affordable housing for the income levels found there. Tacoma’s North East community, adjacent to Federal Way, has higher housing values matching residents’ income levels. Given the commuting patterns, this region is clearly home to many who work elsewhere, earn better incomes, and spend a smaller portion of it on their homes.


    In some areas, where median multiples exceed 5, current residents may have purchased their houses when prices were lower. In other words, at one point in time, the median multiple had a lower value. Under such conditions, residents have accumulated substantial equities, allowing them to sell in a more expensive market. However, the next group of occupants will need substantially higher incomes to afford these houses. With the potential arrival of a sellers’ market, any transition in the composition of homeowners will also coincide with a shift to higher socioeconomic status.  

    Given the overall housing affordability patterns, it is clear that with the looming hike in home prices, the last of the semi-affordable housing pockets in the region extending from Seattle to Tacoma could vanish quickly. Clearly, the well-paid employees in King County could choose to live in Pierce County, enjoy the views, but struggle with traffic up and down I-5. They could even benefit from a publicly funded transportation system. But this won’t resolve the growing traffic and the emerging spatial mismatch between housing and employment. At this point the entire urban region from Seattle to Tacoma should focus on job-housing balance, where the quantity and cost of housing are comparable to employment volume and average salaries paid. To be truly ‘green,’ decision makers need to think regionally. Passing housing or employment problems to neighboring cities is not the best approach to sustainability.

    As for Tacoma, like any other urban region on the fringes of a major metropolitan area, the city has a few options moving forward. First, it could act as a satellite city and build more houses for people who work in the larger urban region. Second, it could imagine itself as a major urban center with little interest in being a “second city.” In that case, it needs to focus on economic development, bringing more well-paying jobs that are suitable for its current and future residents, and build houses that are affordable for the types of incomes generated in the area. This strategy requires coordination between housing and economic development that reduces the spatial mismatch between housing and employment and improves the job-housing balance. This will help both housing and transportation conditions. That will also keep Tacoma affordable and make it unpretentiously ‘green.’

    The National Association of Home Builders ranks Tacoma 103rd for housing affordability on a list of 224 cities. Spokane ranks 62 and Seattle 202 on the same list. Tacoma should aspire to appear on the list of the top 50 most affordable cities by 2020, and be recognized for the quality of life and employment opportunities it offers to current and future residents.

    Ali Modarres is the Director of Urban Studies at University of Washington Tacoma.  He is a geographer and landscape architect, specializing in urban planning and policy. He has written extensively about social geography, transportation planning, and urban development issues in American cities.

  • The Best Small And Midsize Cities For Jobs 2014

    In the classic television show “The Honeymooners,” many jokes were wrung out of bus driver Ralph Cramden’s membership in the International Brotherhood of Loyal Raccoons, headquartered in Bismarck, North Dakota. When Ralph mentioned in one episode to his wife, Alice, that among the privileges is that they could be buried at the “Raccoon National Cemetery” in Bismarck, Alice’s reply was that it made her not know “if I want to live or die.”

    That’s worth a chuckle, but perhaps it’s time to reconsider Bismarck, which ranked first out of the 398 metro areas we considered for our annual roundup of The Best Cities For Jobs. A metro area of 120,000 located in the country’s fastest-growing state and near the vast Bakken oil fields, the number of jobs in Bismarck is up 3% over the last year and a sizzling 32.4% since 2002. You might not want to be buried there, but at least you can get a job before that.

    Bismarck’s growth, although remarkable, is mirrored in many smaller places. When we look at economic growth in America, we tend to focus on large metropolitan areas (we draw the bar at 5 million people and up). However over 40% of Americans live outside these big cities and their much more populous suburbs, notes demographer Wendell Cox. They reside in smaller cities and towns, the destination of choice for many of the domestic migrants fleeing the largest metropolitan areas for the better part of the last decade.

    View the Best Cities for Jobs 2014 List

    These places are often seen by pundits as economic backwaters, but in fact small and mid-sized metro areas take up 16 of the top 20 spots of our overall list of The Best Cities For Jobs. For the most part, it is the smaller markets with under 150,000 jobs that are growing the fastest, but several mid-sized cities (between 150,000 and 450,000 nonfarm jobs) also are outperforming, including Boulder, Colo., which ranks first on our medium-sized cities list, and Provo-Orem, Utah, which ranks second. These areas are as varied as America. Some fit the resource-dominated archetype often associated with smaller cities and towns but others are driven by industry and even tech growth.

    The Energy Hubs

    As we saw with our large cities list, metro areas that are connected to the energy economy have been peak performers. Beyond Bismarck, our list of the Best Small Cities For Jobs includes Greeley (fifth) and Ft. Collins (17th), both located near the oilfields of northern Colorado; and near the west Texas oilfields, the cities of Midland (sixth), San Angelo (11th), Odessa (15th) and Lubbock (16th).

    Energy jobs pay an average of about $80,000 a year according to BLS data. But this wealth is not only for geologists or those with oil stains on the hands. The money brought into these communities has also sparked strong growth in such fields as manufacturing, construction and business services in virtually all these towns. In Midland, for example, natural resources and construction employment has surged 50% since 2008, but wholesale trade, manufacturing, business and financial services have also expanded strongly.

    Manufacturing Comeback Cities

    Plenty of old industrial cities are at the bottom of the 240 MSAs we ranked for our small cities list, including 238th place Danville, Ill., which has lost 6% of its jobs since 2008, and second from last, Michigan City-La Porte, Ind., where employment has dropped 6.8% over the same span. But some of the highest fliers are also industrial towns. This includes second-ranked Elkhart-Goshen, Ind., which rose a remarkable 63 places from last year on our list, and from 233rd back in 2010. The recreational vehicle manufacturing hub suffered steep job losses during the Recession, but industrial employment has risen 24% since 2010.

    Like energy, industrial jobs tend to pay more than most, and have a strong effect on other sectors. Since 2010 in the Elkhart-Goshen area, employment in wholesale trade and business services has expanded at double-digit percentage paces, while retail employment has shot up a healthy 7.4%. In Grand Rapids-Wyoming, Mich., which ranks third on our list of the Best Midsize Cities For Jobs, manufacturing employment is up almost 14.7% since 2010 while job growth has also been strong in medical services, education, and business services. Grand Rapids has 4.9% more jobs now than in 2002, a far sight better than larger industrial metro areas like Detroit, where employment has declined 16.2% over the same period.

    But most of the comeback industrial towns are not in the Midwest but the Southeast, which has gotten the bulk of new investment from foreign automakers and steelmakers. This includes Auburn-Opelika, Ala., No. 7 on our small cities list, where there has been a surge in employment by auto parts suppliers. The home of 25,000-studentAuburn University, it has also seen strong growth in business services and hospitality. Two South Carolina metro areas, Anderson (12th) and Spartanburg (13th), have also benefited from the industrial resurgence in the region.

    College Towns

    We may be approaching the end of a “higher education bubble,” as Glenn Reynolds and others have suggested, but at least for now many college towns in the Midwest, the southeast and the Intermountain West continue to show strong job growth.

    In Columbia, Mo., home to the 35,000-student University of Missouri, employment has expanded 9.7% since 2008 and 4% in 2013, placing it third on our small cities list. In ninth-place College Station, Texas, the presence of Texas A&M (56,000 students) has sparked growth in the information and business services sectors, in which employment has expanded 18.2% and 14.2%, respectively, since 2008, while leisure and hospitality employment is up 29.5% over the same period. Higher education has continued to be a strong and growing industry for these small towns, although its long-term sustainability may be hampered by a lethargic economy and burgeoning student debt.

    Places For The Rich And Famous

    In this most unequal of recoveries, some of the biggest winners are cities that cater to the rich and aging baby boomers. People over 55 control upward of three-quarters of the country’s wealth and more than half all discretionary dollars. And unlike the millennials and Xers who follow them, this generation has generally profited more from the recent jump in equity and property prices.

    Fourth on our small cities list is St. George in scenic southwestern Utah, a fast-growing community for retirees, where employment shot up 5.38% in 2013. Naples-Marco Island, Fla. (eighth), long a major lure to northern snowbirds, is home to a fast-growing economy built around hospitality and construction. Napa, Calif. (18th), has emerged as a major beneficiary of spending by wealthy retirees from the booming San Francisco Bay Area.

    The Future For Smaller Cities

    Big city mayors are wont to proclaim that they’re on the cutting edge of economic life. Big cities are where “the action is,” Atlanta’s Karim Reed said at a recent confab in Chicago. But as our roundup of the cities with the strongest employment growth shows, many of the hottest economies in the country are in places that most urbanistas would write off as the boondocks. Some of them, may only do well as long the energy and agriculture booms continue, but many other will benefit as boomers continue to seek out comfortable, less congested, and often less expensive, places to retire. These smaller places may also benefit as millennials start seeking to buy homes and raise families. And with the expansion of communication technology, they may find it increasingly easy to perform sophisticated work from smaller places. America’s economy may still remain dominated by its giant metro areas, but it would be inaccurate to discount the role of smaller places in the evolving American economy.

    View the Best Cities for Jobs 2014 List

    This story originally appeared at Forbes.

    Joel Kotkin is executive editor of NewGeography.com and Distinguished Presidential Fellow in Urban Futures at Chapman University, and a member of the editorial board of the Orange County Register. He is author of The City: A Global History and The Next Hundred Million: America in 2050. His most recent study, The Rise of Postfamilialism, has been widely discussed and distributed internationally. He lives in Los Angeles, CA.

    Michael Shires, Ph.D. is a professor at Pepperdine University School of Public Policy.

    Boulder, CO photo by Phil Armitage.