Best cities main page 2014
Blog
-
All Cities Rankings – 2014 Best Cities for Job Growth
Read about how we selected the 2014 Best Cities for Job Growth
This year’s rankings use five measures of growth to rank all 398 metro areas for which full data sets were available from the past 10 years. "Large" areas include those with a current nonfarm employment base of at least 450,000 jobs. "Midsize" areas range from 150,000 to 450,000 jobs. "Small" areas have as many as 150,000 jobs. This year’s rankings reflect the current size of each MSAs employment. Only one MSA—Modesto, CA—changed size categories moving from “Small” to “Midsized.” In the instances where the analysis refers to changes in ranking order within the size categories, this MSAs changes are reported as if they had been included in their current category in the prior year.
2014 Overall Ranking Area 2014 Weighted INDEX 2013 Nonfarm Emplmt (1000s) Overall Mvmnt 2013 Overall Rank 1 Bismarck, ND 96.1 69.8 53 54 2 San Jose-Sunnyvale-Santa Clara, CA 94.2 982.2 26 28 3 San Francisco-San Mateo-Redwood City, CA Metropolitan Division 94.1 1,087.8 6 9 4 Elkhart-Goshen, IN 94.1 119.2 111 115 5 Columbia, MO 92.3 101.8 64 69 6 Boulder, CO 88.7 175.6 1 7 7 Provo-Orem, UT 87.9 209.3 4 11 8 St. George, UT 87.9 52.2 137 145 9 Greeley, CO 87.7 92.0 29 38 10 Midland, TX 87.3 87.5 -9 1 11 Auburn-Opelika, AL 87.1 58.8 3 14 12 Austin-Round Rock-San Marcos, TX 87.0 881.1 30 42 13 Raleigh-Cary, NC 86.2 552.5 32 45 14 Grand Rapids-Wyoming, MI 85.9 410.2 33 47 15 Naples-Marco Island, FL 84.9 129.2 152 167 16 College Station-Bryan, TX 84.8 104.3 183 199 17 Houston-Sugar Land-Baytown, TX 84.7 2,825.8 6 23 18 El Centro, CA 84.7 52.9 64 82 19 San Angelo, TX 84.4 48.0 -14 5 20 Anderson, SC 84.1 66.3 314 334 21 Spartanburg, SC 83.8 131.0 60 81 22 Jonesboro, AR 82.7 53.0 -14 8 23 Odessa, TX 82.4 74.0 -21 2 24 Nashville-Davidson–Murfreesboro–Franklin, TN 82.3 822.8 -9 15 25 Cape Coral-Fort Myers, FL 82.0 222.9 155 180 26 Lubbock, TX 81.9 135.1 32 58 27 Lafayette, LA 81.9 161.8 8 35 28 Fort Collins-Loveland, CO 81.6 145.4 22 50 29 Napa, CA 81.3 67.2 -11 18 30 New York City, NY 81.2 4,018.3 58 88 31 Orlando-Kissimmee-Sanford, FL 81.0 1,085.2 109 140 32 Fargo, ND-MN 80.8 133.9 8 40 33 Houma-Bayou Cane-Thibodaux, LA 80.3 101.0 22 55 34 Victoria, TX 79.8 54.7 -1 33 35 Dallas-Plano-Irving, TX Metropolitan Division 79.7 2,199.4 -11 24 36 Denver-Aurora-Broomfield, CO 79.7 1,305.4 5 41 37 Fort Worth-Arlington, TX Metropolitan Division 79.6 931.3 -17 20 38 Columbus, IN 79.5 49.8 -35 3 39 Iowa City, IA 79.1 98.1 70 109 40 San Antonio-New Braunfels, TX 79.0 913.1 16 56 41 Bakersfield-Delano, CA 79.0 253.7 -19 22 42 Des Moines-West Des Moines, IA 78.7 340.1 44 86 43 Salt Lake City, UT 78.7 670.4 -27 16 44 Laredo, TX 78.4 97.0 -12 32 45 Boise City-Nampa, ID 78.2 276.5 39 84 46 Haverhill-North Andover-Amesbury, MA-NH NECTA Division 77.3 81.6 -10 36 47 Cleveland, TN 77.3 44.7 -43 4 48 Charlotte-Gastonia-Rock Hill, NC-SC 77.3 888.0 -14 34 49 McAllen-Edinburg-Mission, TX 76.3 237.9 11 60 50 Seattle-Bellevue-Everett, WA Metropolitan Division 76.3 1,522.7 15 65 51 Ames, IA 76.2 50.8 122 173 52 Bowling Green, KY 76.1 64.5 48 100 53 Fayetteville-Springdale-Rogers, AR-MO 75.8 216.9 -41 12 54 Brownsville-Harlingen, TX 75.4 135.3 23 77 55 Oklahoma City, OK 75.2 616.8 12 67 56 Riverside-San Bernardino-Ontario, CA 75.0 1,254.7 159 215 57 Palm Coast, FL 75.0 20.4 61 118 58 Holland-Grand Haven, MI 74.8 115.4 -19 39 59 Miami-Miami Beach-Kendall, FL Metropolitan Division 74.6 1,081.8 112 171 60 Coeur d’Alene, ID 74.5 55.5 242 302 61 Myrtle Beach-North Myrtle Beach-Conway, SC 74.3 114.2 90 151 62 Sioux Falls, SD 73.5 143.7 -18 44 63 Savannah, GA 73.4 161.7 48 111 64 Baton Rouge, LA 72.9 389.9 -16 48 65 Logan, UT-ID 72.5 56.6 91 156 66 Winchester, VA-WV 72.4 59.2 -45 21 67 Wilmington, NC 71.9 142.6 81 148 68 Cheyenne, WY 71.8 46.2 -43 25 69 Portsmouth, NH-ME NECTA 71.6 56.5 -39 30 70 Portland-Vancouver-Hillsboro, OR-WA 71.4 1,049.3 113 183 71 Killeen-Temple-Fort Hood, TX 71.4 132.7 49 120 72 Bend, OR 71.3 64.6 232 304 73 Greenville-Mauldin-Easley, SC 71.2 316.4 90 163 74 Columbus, OH 71.0 984.0 -12 62 75 Jacksonville, FL 70.9 620.0 68 143 76 Brockton-Bridgewater-Easton, MA NECTA Division 70.9 93.2 29 105 77 Fresno, CA 70.7 310.7 174 251 78 Springfield, MO 70.7 202.5 -7 71 79 Corpus Christi, TX 70.3 188.7 -60 19 80 Gainesville, GA 70.1 77.3 81 161 81 Merced, CA 70.0 61.2 -15 66 82 Ocean City, NJ 69.8 36.7 75 157 83 Chico, CA 69.7 75.5 182 265 84 Phoenix-Mesa-Glendale, AZ 69.7 1,849.2 95 179 85 Punta Gorda, FL 69.6 44.1 208 293 86 Charleston-North Charleston-Summerville, SC 69.5 310.0 -35 51 87 San Luis Obispo-Paso Robles, CA 69.4 106.4 -74 13 88 Morgantown, WV 69.3 68.4 9 97 89 Greenville, NC 69.1 82.2 -62 27 90 Kokomo, IN 68.9 44.2 11 101 91 New Bedford, MA NECTA 68.7 70.1 -45 46 92 Durham-Chapel Hill, NC 68.6 288.7 -12 80 93 Pascagoula, MS 68.6 57.9 237 330 94 Asheville, NC 68.5 176.7 -9 85 95 Olympia, WA 68.3 104.3 153 248 96 North Port-Bradenton-Sarasota, FL 68.2 260.4 88 184 97 Visalia-Porterville, CA 68.0 114.6 7 104 98 Mankato-North Mankato, MN 67.9 55.3 32 130 99 Boston-Cambridge-Quincy, MA NECTA Division 67.6 1,782.5 -25 74 100 St. Cloud, MN 67.4 104.2 -2 98 101 Atlanta-Sandy Springs-Marietta, GA 67.3 2,435.7 6 107 102 Bellingham, WA 67.2 85.3 182 284 103 West Palm Beach-Boca Raton-Boynton Beach, FL Metropolitan Division 67.2 551.7 79 182 104 Lincoln, NE 66.5 183.5 -8 96 105 New Orleans-Metairie-Kenner, LA 66.1 550.8 7 112 106 Tyler, TX 65.8 97.3 75 181 107 Ogden-Clearfield, UT 65.7 205.9 -28 79 108 Fort Lauderdale-Pompano Beach-Deerfield Beach, FL Metropolitan Division 65.6 762.9 79 187 109 Port St. Lucie, FL 65.4 129.3 117 226 110 Missoula, MT 64.6 57.9 25 135 111 Wenatchee-East Wenatchee, WA 64.5 40.1 -17 94 112 Mount Vernon-Anacortes, WA 64.4 46.4 173 285 113 Idaho Falls, ID 64.3 50.9 76 189 114 Trenton-Ewing, NJ 64.3 249.8 -25 89 115 Kennewick-Pasco-Richland, WA 64.0 102.3 180 295 116 Blacksburg-Christiansburg-Radford, VA 64.0 73.7 -87 29 117 Barnstable Town, MA NECTA 63.8 96.1 -100 17 118 Tampa-St. Petersburg-Clearwater, FL 63.7 1,192.3 7 125 119 Indianapolis-Carmel, IN 63.6 938.9 -51 68 120 Santa Cruz-Watsonville, CA 63.6 93.5 30 150 121 Santa Rosa-Petaluma, CA 63.4 185.5 192 313 122 Modesto, CA 63.3 157.6 111 233 123 Monroe, MI 62.8 41.1 253 376 124 Casper, WY 62.7 42.1 -71 53 125 Honolulu, HI 62.7 462.1 -12 113 126 Oakland-Fremont-Hayward, CA Metropolitan Division 62.2 1,045.3 144 270 127 San Diego-Carlsbad-San Marcos, CA 62.0 1,325.0 -4 123 128 Las Vegas-Paradise, NV 61.6 862.0 122 250 129 Ithaca, NY 61.5 69.4 -8 121 130 Pueblo, CO 61.4 59.8 65 195 131 La Crosse, WI-MN 61.4 77.4 3 134 132 Longview, TX 61.1 101.2 -83 49 133 Sherman-Denison, TX 61.1 44.6 9 142 134 Battle Creek, MI 61.0 58.4 -2 132 135 Flagstaff, AZ 60.8 63.0 6 141 136 Springfield, OH 60.8 52.8 204 340 137 Dover, DE 60.6 66.9 215 352 138 Vallejo-Fairfield, CA 60.6 126.9 37 175 139 Clarksville, TN-KY 59.9 88.5 -76 63 140 Grand Forks, ND-MN 59.8 57.2 -79 61 141 Jacksonville, NC 59.8 48.9 -35 106 142 Billings, MT 59.7 81.8 -111 31 143 Madison, WI 59.5 360.2 88 231 144 Lake Charles, LA 59.3 94.1 -69 75 145 Lafayette, IN 59.1 99.8 -119 26 146 El Paso, TX 58.9 289.2 -43 103 147 Lebanon, PA 58.8 51.4 -23 124 148 Santa Ana-Anaheim-Irvine, CA Metropolitan Division 58.7 1,473.5 28 176 149 Northern Virginia, VA 58.7 1,372.9 -58 91 150 Great Falls, MT 58.5 36.3 97 247 151 Dubuque, IA 58.3 59.2 -78 73 152 Framingham, MA NECTA Division 58.0 162.3 -6 146 153 Ann Arbor, MI 57.8 209.6 -81 72 154 Madera-Chowchilla, CA 57.7 35.2 88 242 155 Louisville-Jefferson County, KY-IN 57.2 629.4 -63 92 156 Sioux City, IA-NE-SD 57.0 76.4 3 159 157 Los Angeles-Long Beach-Glendale, CA Metropolitan Division 56.9 4,171.3 84 241 158 Stockton, CA 56.7 203.2 86 244 159 Washington-Arlington-Alexandria, DC-VA-MD-WV Metropolitan Division 56.6 2,516.1 -42 117 160 Lake County-Kenosha County, IL-WI Metropolitan Division 55.9 397.7 115 275 161 Athens-Clarke County, GA 55.6 90.7 37 198 162 Charlottesville, VA 55.2 104.0 134 296 163 Janesville, WI 55.2 64.8 153 316 164 Tulsa, OK 55.0 436.2 -12 152 165 Owensboro, KY 54.8 52.8 -159 6 166 Reno-Sparks, NV 54.7 201.1 128 294 167 St. Joseph, MO-KS 54.7 63.0 -80 87 168 Minneapolis-St. Paul-Bloomington, MN-WI 54.7 1,808.0 -73 95 169 Kansas City, KS 54.6 449.6 -112 57 170 Eau Claire, WI 54.6 83.3 -44 126 171 Tuscaloosa, AL 54.5 97.7 -33 138 172 Sumter, SC 54.3 38.3 37 209 173 Omaha-Council Bluffs, NE-IA 54.3 478.8 -18 155 174 Fond du Lac, WI 54.1 47.0 179 353 175 Warren-Troy-Farmington Hills, MI Metropolitan Division 54.0 1,145.8 60 235 176 Redding, CA 54.0 61.0 201 377 177 Richmond, VA 53.9 637.6 -63 114 178 Salem, OR 53.6 146.3 149 327 179 Joplin, MO 53.6 82.3 14 193 180 Santa Barbara-Santa Maria-Goleta, CA 53.3 172.7 -104 76 181 Columbia, SC 52.9 364.5 -7 174 182 Crestview-Fort Walton Beach-Destin, FL 52.7 79.5 -74 108 183 Prescott, AZ 52.5 57.5 103 286 184 Colorado Springs, CO 52.1 257.3 -16 168 185 Elizabethtown, KY 52.1 49.7 -15 170 186 Anchorage, AK 51.8 176.1 -58 128 187 Abilene, TX 51.5 67.5 -88 99 188 Williamsport, PA 50.9 56.3 -178 10 189 Panama City-Lynn Haven-Panama City Beach, FL 50.9 72.1 140 329 190 Rochester, MN 50.6 107.6 -107 83 191 Hagerstown-Martinsburg, MD-WV 50.5 104.2 -139 52 192 Sacramento–Arden-Arcade–Roseville, CA 50.5 872.5 79 271 193 Las Cruces, NM 50.0 70.6 71 264 194 Nassau-Suffolk, NY Metropolitan Division 49.9 1,281.6 -63 131 195 Yuba City, CA 49.4 39.1 92 287 196 Florence, SC 49.3 85.5 121 317 197 Burlington-South Burlington, VT NECTA 49.3 118.2 -138 59 198 Fort Wayne, IN 49.1 212.9 -44 154 199 Jackson, TN 49.0 61.7 -129 70 200 Duluth, MN-WI 48.6 132.8 38 238 201 Lansing-East Lansing, MI 48.5 224.4 154 355 202 Yakima, WA 48.4 80.1 0 202 203 Huntsville, AL 48.1 213.3 75 278 204 Wheeling, WV-OH 47.5 68.4 99 303 205 Oshkosh-Neenah, WI 47.3 94.4 -28 177 206 Harrisonburg, VA 47.2 65.0 -116 90 207 New Haven, CT NECTA 46.7 277.6 50 257 208 Danbury, CT NECTA 46.4 69.9 -11 197 209 Grand Junction, CO 46.3 60.8 4 213 210 Wilmington, DE-MD-NJ Metropolitan Division 46.2 345.1 79 289 211 Lexington-Fayette, KY 46.2 258.2 -168 43 212 Lawrence, KS 46.1 52.1 -50 162 213 Tacoma, WA Metropolitan Division 46.1 278.7 17 230 214 Amarillo, TX 46.0 114.1 -54 160 215 Medford, OR 45.7 78.3 105 320 216 State College, PA 45.5 76.2 -12 204 217 Deltona-Daytona Beach-Ormond Beach, FL 45.3 159.2 17 234 218 Edison-New Brunswick, NJ Metropolitan Division 45.3 1,016.4 -74 144 219 Cincinnati-Middletown, OH-KY-IN 44.8 1,027.0 55 274 220 Knoxville, TN 44.7 335.8 -73 147 221 Peabody, MA NECTA Division 44.6 103.7 -119 102 222 Eugene-Springfield, OR 44.6 146.2 111 333 223 Harrisburg-Carlisle, PA 44.2 329.6 -38 185 224 Longview, WA 44.1 37.4 39 263 225 Chicago-Joliet-Naperville, IL Metropolitan Division 43.9 3,787.2 33 258 226 Hattiesburg, MS 43.8 60.4 -26 200 227 Rapid City, SD 43.8 61.4 -17 210 228 Corvallis, OR 43.6 39.3 -75 153 229 Manchester, NH NECTA 43.1 101.3 -23 206 230 Pensacola-Ferry Pass-Brent, FL 43.1 160.9 -8 222 231 Green Bay, WI 42.9 170.0 -94 137 232 Fairbanks, AK 42.8 38.0 -74 158 233 Oxnard-Thousand Oaks-Ventura, CA 42.8 289.3 -5 228 234 Canton-Massillon, OH 42.6 170.3 -124 110 235 Lakeland-Winter Haven, FL 42.2 198.9 66 301 236 Spokane, WA 42.0 215.0 -35 201 237 Waterloo-Cedar Falls, IA 41.7 92.1 -144 93 238 Waco, TX 41.6 107.0 -160 78 239 Salinas, CA 41.6 126.7 71 310 240 Florence-Muscle Shoals, AL 41.5 55.8 21 261 241 Winston-Salem, NC 41.3 209.3 -29 212 242 Kankakee-Bradley, IL 41.0 44.2 -64 178 243 Hinesville-Fort Stewart, GA 41.0 19.9 36 279 244 Akron, OH 41.0 330.3 -48 196 245 Monroe, LA 40.9 78.6 -8 237 246 Lowell-Billerica-Chelmsford, MA-NH NECTA Division 40.8 120.4 -74 172 247 Gulfport-Biloxi, MS 40.6 107.2 138 385 248 Lawton, OK 40.6 44.3 8 256 249 Poughkeepsie-Newburgh-Middletown, NY 40.5 254.8 -55 194 250 Gainesville, FL 40.5 131.5 -86 164 251 Bridgeport-Stamford-Norwalk, CT NECTA 40.5 413.2 97 348 252 Columbus, GA-AL 40.5 121.8 -9 243 253 Muskegon-Norton Shores, MI 40.2 61.8 -137 116 254 Gadsden, AL 40.2 36.9 83 337 255 Allentown-Bethlehem-Easton, PA-NJ 40.0 345.7 -116 139 256 Hartford-West Hartford-East Hartford, CT NECTA 40.0 553.1 -27 229 257 Lewiston, ID-WA 40.0 26.5 81 338 258 Appleton, WI 39.7 118.4 -33 225 259 Bloomington, IN 39.1 83.1 39 298 260 Little Rock-North Little Rock-Conway, AR 39.0 345.1 -49 211 261 Bethesda-Rockville-Frederick, MD Metropolitan Division 38.8 572.5 -95 166 262 Waterbury, CT NECTA 38.8 65.1 118 380 263 Calvert-Charles-Prince George’s, MD 38.6 386.4 45 308 264 Birmingham-Hoover, AL 38.0 511.9 36 300 265 Lewiston-Auburn, ME NECTA 38.0 49.1 47 312 266 Philadelphia City, PA 38.0 671.2 -42 224 267 Saginaw-Saginaw Township North, MI 37.5 87.7 56 323 268 Bangor, ME NECTA 37.4 66.5 -50 218 269 Sandusky, OH 37.3 34.9 120 389 270 Hanford-Corcoran, CA 37.1 36.5 -2 268 271 Morristown, TN 37.1 46.6 98 369 272 Warner Robins, GA 37.1 58.7 -52 220 273 Sebastian-Vero Beach, FL 36.8 46.5 62 335 274 Portland-South Portland-Biddeford, ME NECTA 36.8 193.5 8 282 275 Worcester, MA-CT NECTA 36.7 248.9 -39 236 276 Pocatello, ID 36.6 36.8 48 324 277 Fayetteville, NC 36.1 132.5 -86 191 278 Sheboygan, WI 35.6 58.7 89 367 279 Toledo, OH 35.6 308.9 28 307 280 Cedar Rapids, IA 35.5 140.4 -94 186 281 Lancaster, PA 35.4 231.8 -58 223 282 Pittsburgh, PA 35.4 1,154.7 -149 133 283 Manhattan, KS 35.2 56.5 -219 64 284 Valdosta, GA 35.0 54.1 -45 239 285 Goldsboro, NC 34.7 43.6 60 345 286 Bergen-Hudson-Passaic, NJ 34.7 891.3 -19 267 287 Reading, PA 34.6 170.7 -165 122 288 Chattanooga, TN-GA 34.6 238.9 -67 221 289 Milwaukee-Waukesha-West Allis, WI 34.3 828.8 8 297 290 Nashua, NH-MA NECTA Division 34.3 129.3 0 290 291 Topeka, KS 34.1 110.7 -99 192 292 Montgomery, AL 34.0 169.0 14 306 293 Cape Girardeau-Jackson, MO-IL 34.0 44.7 -38 255 294 Hot Springs, AR 33.9 37.3 -75 219 295 Ocala, FL 33.5 93.1 -26 269 296 Evansville, IN-KY 33.1 177.2 -36 260 297 Providence-Fall River-Warwick, RI-MA NECTA 33.0 557.1 18 315 298 Tallahassee, FL 33.0 170.4 34 332 299 Buffalo-Niagara Falls, NY 32.9 550.6 -85 214 300 Tucson, AZ 32.7 366.4 -55 245 301 Augusta-Richmond County, GA-SC 32.6 217.4 -69 232 302 Wichita, KS 32.6 290.7 59 361 303 Albany-Schenectady-Troy, NY 32.6 446.4 -138 165 304 Niles-Benton Harbor, MI 32.5 60.0 67 371 305 Greensboro-High Point, NC 32.4 348.7 37 342 306 Gary, IN Metropolitan Division 32.4 273.8 -34 272 307 Rochester, NY 32.0 515.7 -104 203 308 Roanoke, VA 31.9 159.1 -91 217 309 Jackson, MS 31.8 259.4 -101 208 310 Cumberland, MD-WV 31.6 39.6 -103 207 311 Springfield, MA-CT NECTA 31.6 293.3 57 368 312 Virginia Beach-Norfolk-Newport News, VA-NC 30.7 748.2 -143 169 313 Bay City, MI 30.6 37.2 -194 119 314 Bremerton-Silverdale, WA 30.6 84.3 40 354 315 Yuma, AZ 30.4 52.5 -35 280 316 Macon, GA 29.7 99.1 -180 136 317 Baltimore City, MD 29.6 359.3 -168 149 318 Santa Fe, NM 29.5 61.5 21 339 319 Kingston, NY 29.4 60.1 63 382 320 Leominster-Fitchburg-Gardner, MA NECTA 28.8 49.0 27 347 321 St. Louis, MO-IL 28.5 1,315.5 7 328 322 Farmington, NM 27.8 49.6 14 336 323 Muncie, IN 27.8 51.9 -286 37 324 Lima, OH 27.3 52.7 64 388 325 Erie, PA 27.3 129.7 -52 273 326 Rochester-Dover, NH-ME NECTA 27.3 56.4 -74 252 327 Newark-Union, NJ-PA Metropolitan Division 27.2 989.0 36 363 328 Kansas City, MO 27.1 555.2 -14 314 329 Rome, GA 26.9 39.3 -3 326 330 Kingsport-Bristol-Bristol, TN-VA 26.8 119.9 -49 281 331 Springfield, IL 26.8 110.8 -91 240 332 York-Hanover, PA 26.6 177.0 -116 216 333 Anderson, IN 26.3 40.4 -204 129 334 Cleveland-Elyria-Mentor, OH 26.3 1,023.8 -13 321 335 Putnam-Rockland-Westchester, NY 25.8 563.2 -47 288 336 Wausau, WI 25.7 68.2 38 374 337 Altoona, PA 25.5 60.7 -91 246 338 Salisbury, MD 25.4 52.7 -61 277 339 Burlington, NC 25.3 59.1 11 350 340 Memphis, TN-MS-AR 25.1 608.8 -78 262 341 Jackson, MI 24.3 54.5 31 372 342 Pittsfield, MA NECTA 23.8 35.8 -31 311 343 Syracuse, NY 23.7 315.7 -38 305 344 Champaign-Urbana, IL 23.7 107.9 14 358 345 Youngstown-Warren-Boardman, OH-PA 23.5 225.1 12 357 346 Hickory-Lenoir-Morganton, NC 23.3 146.1 41 387 347 Alexandria, LA 22.8 62.8 -1 346 348 Flint, MI 22.5 136.7 35 383 349 Lake Havasu City-Kingman, AZ 22.5 45.3 26 375 350 South Bend-Mishawaka, IN-MI 22.5 135.2 28 378 351 Davenport-Moline-Rock Island, IA-IL 22.4 181.3 -124 227 352 Decatur, AL 22.3 54.3 27 379 353 Shreveport-Bossier City, LA 22.1 171.5 -31 322 354 Fort Smith, AR-OK 21.9 116.6 -11 343 355 Peoria, IL 21.8 177.6 -167 188 356 Racine, WI 21.8 75.2 9 365 357 Huntington-Ashland, WV-KY-OH 21.6 114.8 -32 325 358 Terre Haute, IN 21.3 70.9 -39 319 359 Albany, GA 21.0 61.6 -28 331 360 Rockford, IL 20.9 146.9 -61 299 361 Jefferson City, MO 20.8 76.5 -17 344 362 Glens Falls, NY 20.0 52.2 -172 190 363 Johnson City, TN 19.9 78.3 -80 283 364 Mobile, AL 19.8 172.7 -23 341 365 Scranton–Wilkes-Barre, PA 19.4 253.2 -116 249 366 Albuquerque, NM 18.6 368.1 -17 349 367 Detroit-Livonia-Dearborn, MI Metropolitan Division 18.5 717.1 -113 254 368 Lynchburg, VA 18.4 102.3 -77 291 369 Palm Bay-Melbourne-Titusville, FL 17.9 194.7 -51 318 370 Utica-Rome, NY 17.7 127.9 11 381 371 Beaumont-Port Arthur, TX 17.7 156.9 -112 259 372 Texarkana, TX-Texarkana, AR 17.7 55.2 -119 253 373 Dothan, AL 17.4 56.9 -13 360 374 Parkersburg-Marietta-Vienna, WV-OH 17.2 69.8 -1 373 375 Danville, VA 17.1 39.9 -248 127 376 Kalamazoo-Portage, MI 16.6 137.2 10 386 377 Brunswick, GA 16.5 40.1 -85 292 378 Dayton, OH 16.4 374.2 -22 356 379 Camden, NJ Metropolitan Division 16.3 504.8 -113 266 380 Steubenville-Weirton, OH-WV 15.4 44.1 15 395 381 Johnstown, PA 15.1 58.5 -105 276 382 Vineland-Millville-Bridgeton, NJ 14.3 57.7 -20 362 383 Mansfield, OH 13.4 52.2 10 393 384 Bloomington-Normal, IL 12.3 88.9 -179 205 385 Elmira, NY 12.0 38.9 -19 366 386 Wichita Falls, TX 10.3 57.7 -2 384 387 Charleston, WV 9.3 144.3 -78 309 388 Anniston-Oxford, AL 7.0 45.5 -29 359 389 Norwich-New London, CT-RI NECTA 6.4 126.0 1 390 390 Decatur, IL 5.6 51.3 4 394 391 Dalton, GA 5.4 63.5 7 398 392 Rocky Mount, NC 5.3 55.3 5 397 393 Carson City, NV 4.8 27.3 -1 392 394 Binghamton, NY 4.3 106.1 -3 391 395 Atlantic City-Hammonton, NJ 3.9 132.5 1 396 396 Danville, IL 3.9 28.7 -45 351 397 Michigan City-La Porte, IN 3.8 41.8 -27 370 398 Pine Bluff, AR 3.1 35.4 -34 364 -
Large Cities Rankings – 2014 Best Cities for Job Growth
Read about how we selected the 2014 Best Cities for Job Growth
This year’s rankings use five measures of growth to rank all 398 metro areas for which full data sets were available from the past 10 years. "Large" areas include those with a current nonfarm employment base of at least 450,000 jobs. "Midsize" areas range from 150,000 to 450,000 jobs. "Small" areas have as many as 150,000 jobs. This year’s rankings reflect the current size of each MSAs employment. Only one MSA—Modesto, CA—changed size categories moving from “Small” to “Midsized.” In the instances where the analysis refers to changes in ranking order within the size categories, this MSAs changes are reported as if they had been included in their current category in the prior year.
2014 Rank Among Large Cities Area 2014 Weighted INDEX 2013 Nonfarm Emplmt (1000s) Size Mvmnt 2013 Size Ranking 1 San Jose-Sunnyvale-Santa Clara, CA 94.2 982.2 6 7 2 San Francisco-San Mateo-Redwood City, CA Metropolitan Division 94.1 1,087.8 -1 1 3 Austin-Round Rock-San Marcos, TX 87.0 881.1 7 10 4 Raleigh-Cary, NC 86.2 552.5 7 11 5 Houston-Sugar Land-Baytown, TX 84.7 2,825.8 0 5 6 Nashville-Davidson–Murfreesboro–Franklin, TN 82.3 822.8 -4 2 7 New York City, NY 81.2 4,018.3 11 18 8 Orlando-Kissimmee-Sanford, FL 81.0 1,085.2 23 31 9 Dallas-Plano-Irving, TX Metropolitan Division 79.7 2,199.4 -3 6 10 Denver-Aurora-Broomfield, CO 79.7 1,305.4 -1 9 11 Fort Worth-Arlington, TX Metropolitan Division 79.6 931.3 -7 4 12 San Antonio-New Braunfels, TX 79.0 913.1 0 12 13 Salt Lake City, UT 78.7 670.4 -10 3 14 Charlotte-Gastonia-Rock Hill, NC-SC 77.3 888.0 -6 8 15 Seattle-Bellevue-Everett, WA Metropolitan Division 76.3 1,522.7 -1 14 16 Oklahoma City, OK 75.2 616.8 -1 15 17 Riverside-San Bernardino-Ontario, CA 75.0 1,254.7 28 45 18 Miami-Miami Beach-Kendall, FL Metropolitan Division 74.6 1,081.8 19 37 19 Portland-Vancouver-Hillsboro, OR-WA 71.4 1,049.3 22 41 20 Columbus, OH 71.0 984.0 -7 13 21 Jacksonville, FL 70.9 620.0 11 32 22 Phoenix-Mesa-Glendale, AZ 69.7 1,849.2 17 39 23 Boston-Cambridge-Quincy, MA NECTA Division 67.6 1,782.5 -6 17 24 Atlanta-Sandy Springs-Marietta, GA 67.3 2,435.7 -2 22 25 West Palm Beach-Boca Raton-Boynton Beach, FL Metropolitan Division 67.2 551.7 15 40 26 New Orleans-Metairie-Kenner, LA 66.1 550.8 -3 23 27 Fort Lauderdale-Pompano Beach-Deerfield Beach, FL Metropolitan Division 65.6 762.9 15 42 28 Tampa-St. Petersburg-Clearwater, FL 63.7 1,192.3 0 28 29 Indianapolis-Carmel, IN 63.6 938.9 -13 16 30 Honolulu, HI 62.7 462.1 -6 24 31 Oakland-Fremont-Hayward, CA Metropolitan Division 62.2 1,045.3 25 56 32 San Diego-Carlsbad-San Marcos, CA 62.0 1,325.0 -5 27 33 Las Vegas-Paradise, NV 61.6 862.0 17 50 34 Santa Ana-Anaheim-Irvine, CA Metropolitan Division 58.7 1,473.5 4 38 35 Northern Virginia, VA 58.7 1,372.9 -16 19 36 Louisville-Jefferson County, KY-IN 57.2 629.4 -16 20 37 Los Angeles-Long Beach-Glendale, CA Metropolitan Division 56.9 4,171.3 12 49 38 Washington-Arlington-Alexandria, DC-VA-MD-WV Metropolitan Division 56.6 2,516.1 -12 26 39 Minneapolis-St. Paul-Bloomington, MN-WI 54.7 1,808.0 -18 21 40 Omaha-Council Bluffs, NE-IA 54.3 478.8 -6 34 41 Warren-Troy-Farmington Hills, MI Metropolitan Division 54.0 1,145.8 7 48 42 Richmond, VA 53.9 637.6 -17 25 43 Sacramento–Arden-Arcade–Roseville, CA 50.5 872.5 14 57 44 Nassau-Suffolk, NY Metropolitan Division 49.9 1,281.6 -15 29 45 Edison-New Brunswick, NJ Metropolitan Division 45.3 1,016.4 -12 33 46 Cincinnati-Middletown, OH-KY-IN 44.8 1,027.0 12 58 47 Chicago-Joliet-Naperville, IL Metropolitan Division 43.9 3,787.2 5 52 48 Hartford-West Hartford-East Hartford, CT NECTA 40.0 553.1 -1 47 49 Bethesda-Rockville-Frederick, MD Metropolitan Division 38.8 572.5 -14 35 50 Birmingham-Hoover, AL 38.0 511.9 11 61 51 Philadelphia City, PA 38.0 671.2 -5 46 52 Pittsburgh, PA 35.4 1,154.7 -22 30 53 Bergen-Hudson-Passaic, NJ 34.7 891.3 2 55 54 Milwaukee-Waukesha-West Allis, WI 34.3 828.8 6 60 55 Providence-Fall River-Warwick, RI-MA NECTA 33.0 557.1 8 63 56 Buffalo-Niagara Falls, NY 32.9 550.6 -12 44 57 Rochester, NY 32.0 515.7 -14 43 58 Virginia Beach-Norfolk-Newport News, VA-NC 30.7 748.2 -22 36 59 St. Louis, MO-IL 28.5 1,315.5 6 65 60 Newark-Union, NJ-PA Metropolitan Division 27.2 989.0 6 66 61 Kansas City, MO 27.1 555.2 1 62 62 Cleveland-Elyria-Mentor, OH 26.3 1,023.8 2 64 63 Putnam-Rockland-Westchester, NY 25.8 563.2 -4 59 64 Memphis, TN-MS-AR 25.1 608.8 -11 53 65 Detroit-Livonia-Dearborn, MI Metropolitan Division 18.5 717.1 -14 51 66 Camden, NJ Metropolitan Division 16.3 504.8 -12 54 -
Midsized Cities Rankings – 2014 Best Cities for Job Growth
Read about how we selected the 2014 Best Cities for Job Growth
This year’s rankings use five measures of growth to rank all 398 metro areas for which full data sets were available from the past 10 years. "Large" areas include those with a current nonfarm employment base of at least 450,000 jobs. "Midsize" areas range from 150,000 to 450,000 jobs. "Small" areas have as many as 150,000 jobs. This year’s rankings reflect the current size of each MSAs employment. Only one MSA—Modesto, CA—changed size categories moving from “Small” to “Midsized.” In the instances where the analysis refers to changes in ranking order within the size categories, this MSAs changes are reported as if they had been included in their current category in the prior year.
2014 Rank Among Medium Cities Area 2014 Weighted INDEX 2013 Nonfarm Emplmt (1000s) Size Mvmnt 2013 Size Ranking 1 Boulder, CO 88.7 175.6 0 1 2 Provo-Orem, UT 87.9 209.3 0 2 3 Grand Rapids-Wyoming, MI 85.9 410.2 5 8 4 Cape Coral-Fort Myers, FL 82.0 222.9 35 39 5 Lafayette, LA 81.9 161.8 1 6 6 Bakersfield-Delano, CA 79.0 253.7 -1 5 7 Des Moines-West Des Moines, IA 78.7 340.1 13 20 8 Boise City-Nampa, ID 78.2 276.5 10 18 9 McAllen-Edinburg-Mission, TX 76.3 237.9 3 12 10 Fayetteville-Springdale-Rogers, AR-MO 75.8 216.9 -7 3 11 Savannah, GA 73.4 161.7 14 25 12 Baton Rouge, LA 72.9 389.9 -3 9 13 Greenville-Mauldin-Easley, SC 71.2 316.4 22 35 14 Fresno, CA 70.7 310.7 50 64 15 Springfield, MO 70.7 202.5 -2 13 16 Corpus Christi, TX 70.3 188.7 -12 4 17 Charleston-North Charleston-Summerville, SC 69.5 310.0 -7 10 18 Durham-Chapel Hill, NC 68.6 288.7 -1 17 19 Asheville, NC 68.5 176.7 0 19 20 North Port-Bradenton-Sarasota, FL 68.2 260.4 20 40 21 Lincoln, NE 66.5 183.5 1 22 22 Ogden-Clearfield, UT 65.7 205.9 -6 16 23 Trenton-Ewing, NJ 64.3 249.8 -2 21 24 Santa Rosa-Petaluma, CA 63.4 185.5 55 79 25 Modesto, CA 63.3 157.6 34 59 26 Madison, WI 59.5 360.2 31 57 27 El Paso, TX 58.9 289.2 -4 23 28 Framingham, MA NECTA Division 58.0 162.3 2 30 29 Ann Arbor, MI 57.8 209.6 -15 14 30 Stockton, CA 56.7 203.2 31 61 31 Lake County-Kenosha County, IL-WI Metropolitan Division 55.9 397.7 38 69 32 Tulsa, OK 55.0 436.2 1 33 33 Reno-Sparks, NV 54.7 201.1 40 73 34 Kansas City, KS 54.6 449.6 -23 11 35 Santa Barbara-Santa Maria-Goleta, CA 53.3 172.7 -20 15 36 Columbia, SC 52.9 364.5 2 38 37 Colorado Springs, CO 52.1 257.3 0 37 38 Anchorage, AK 51.8 176.1 -11 27 39 Fort Wayne, IN 49.1 212.9 -5 34 40 Lansing-East Lansing, MI 48.5 224.4 47 87 41 Huntsville, AL 48.1 213.3 29 70 42 New Haven, CT NECTA 46.7 277.6 23 65 43 Wilmington, DE-MD-NJ Metropolitan Division 46.2 345.1 29 72 44 Lexington-Fayette, KY 46.2 258.2 -37 7 45 Tacoma, WA Metropolitan Division 46.1 278.7 11 56 46 Deltona-Daytona Beach-Ormond Beach, FL 45.3 159.2 13 59 47 Knoxville, TN 44.7 335.8 -16 31 48 Harrisburg-Carlisle, PA 44.2 329.6 -7 41 49 Pensacola-Ferry Pass-Brent, FL 43.1 160.9 3 52 50 Green Bay, WI 42.9 170.0 -22 28 51 Oxnard-Thousand Oaks-Ventura, CA 42.8 289.3 4 55 52 Canton-Massillon, OH 42.6 170.3 -28 24 53 Lakeland-Winter Haven, FL 42.2 198.9 21 74 54 Spokane, WA 42.0 215.0 -9 45 55 Winston-Salem, NC 41.3 209.3 -7 48 56 Akron, OH 41.0 330.3 -12 44 57 Poughkeepsie-Newburgh-Middletown, NY 40.5 254.8 -14 43 58 Bridgeport-Stamford-Norwalk, CT NECTA 40.5 413.2 27 85 59 Allentown-Bethlehem-Easton, PA-NJ 40.0 345.7 -30 29 60 Little Rock-North Little Rock-Conway, AR 39.0 345.1 -13 47 61 Calvert-Charles-Prince George’s, MD 38.6 386.4 17 78 62 Portland-South Portland-Biddeford, ME NECTA 36.8 193.5 9 71 63 Worcester, MA-CT NECTA 36.7 248.9 -3 60 64 Toledo, OH 35.6 308.9 13 77 65 Lancaster, PA 35.4 231.8 -12 53 66 Reading, PA 34.6 170.7 -40 26 67 Chattanooga, TN-GA 34.6 238.9 -16 51 68 Montgomery, AL 34.0 169.0 8 76 69 Evansville, IN-KY 33.1 177.2 -2 67 70 Tallahassee, FL 33.0 170.4 12 82 71 Tucson, AZ 32.7 366.4 -9 62 72 Augusta-Richmond County, GA-SC 32.6 217.4 -14 58 73 Wichita, KS 32.6 290.7 17 90 74 Albany-Schenectady-Troy, NY 32.6 446.4 -38 36 75 Greensboro-High Point, NC 32.4 348.7 9 84 76 Gary, IN Metropolitan Division 32.4 273.8 -8 68 77 Roanoke, VA 31.9 159.1 -27 50 78 Jackson, MS 31.8 259.4 -32 46 79 Springfield, MA-CT NECTA 31.6 293.3 12 91 80 Baltimore City, MD 29.6 359.3 -48 32 81 York-Hanover, PA 26.6 177.0 -32 49 82 Syracuse, NY 23.7 315.7 -7 75 83 Youngstown-Warren-Boardman, OH-PA 23.5 225.1 6 89 84 Davenport-Moline-Rock Island, IA-IL 22.4 181.3 -30 54 85 Shreveport-Bossier City, LA 22.1 171.5 -4 81 86 Peoria, IL 21.8 177.6 -44 42 87 Mobile, AL 19.8 172.7 -4 83 88 Scranton–Wilkes-Barre, PA 19.4 253.2 -25 63 89 Albuquerque, NM 18.6 368.1 -3 86 90 Palm Bay-Melbourne-Titusville, FL 17.9 194.7 -10 80 91 Beaumont-Port Arthur, TX 17.7 156.9 -25 66 92 Dayton, OH 16.4 374.2 -4 88 -
Small Cities Rankings – 2014 Best Cities for Job Growth
Read about how we selected the 2014 Best Cities for Job Growth
This year’s rankings use five measures of growth to rank all 398 metro areas for which full data sets were available from the past 10 years. "Large" areas include those with a current nonfarm employment base of at least 450,000 jobs. "Midsize" areas range from 150,000 to 450,000 jobs. "Small" areas have as many as 150,000 jobs. This year’s rankings reflect the current size of each MSAs employment. Only one MSA—Modesto, CA—changed size categories moving from “Small” to “Midsized.” In the instances where the analysis refers to changes in ranking order within the size categories, this MSAs changes are reported as if they had been included in their current category in the prior year.
2014 Rank Among Small Cities Area 2014 Weighted INDEX 2013 Nonfarm Emplmt (1000s) Size Mvmnt 2013 Size Ranking 1 Bismarck, ND 96.1 69.8 32 33 2 Elkhart-Goshen, IN 94.1 119.2 63 65 3 Columbia, MO 92.3 101.8 38 41 4 St. George, UT 87.9 52.2 79 83 5 Greeley, CO 87.7 92.0 19 24 6 Midland, TX 87.3 87.5 -5 1 7 Auburn-Opelika, AL 87.1 58.8 3 10 8 Naples-Marco Island, FL 84.9 129.2 88 96 9 College Station-Bryan, TX 84.8 104.3 104 113 10 El Centro, CA 84.7 52.9 38 48 11 San Angelo, TX 84.4 48.0 -6 5 12 Anderson, SC 84.1 66.3 175 187 13 Spartanburg, SC 83.8 131.0 34 47 14 Jonesboro, AR 82.7 53.0 -7 7 15 Odessa, TX 82.4 74.0 -13 2 16 Lubbock, TX 81.9 135.1 19 35 17 Fort Collins-Loveland, CO 81.6 145.4 13 30 18 Napa, CA 81.3 67.2 -6 12 19 Fargo, ND-MN 80.8 133.9 7 26 20 Houma-Bayou Cane-Thibodaux, LA 80.3 101.0 14 34 21 Victoria, TX 79.8 54.7 0 21 22 Columbus, IN 79.5 49.8 -19 3 23 Iowa City, IA 79.1 98.1 41 64 24 Laredo, TX 78.4 97.0 -4 20 25 Haverhill-North Andover-Amesbury, MA-NH NECTA Division 77.3 81.6 -3 22 26 Cleveland, TN 77.3 44.7 -22 4 27 Ames, IA 76.2 50.8 72 99 28 Bowling Green, KY 76.1 64.5 29 57 29 Brownsville-Harlingen, TX 75.4 135.3 16 45 30 Palm Coast, FL 75.0 20.4 37 67 31 Holland-Grand Haven, MI 74.8 115.4 -6 25 32 Coeur d’Alene, ID 74.5 55.5 135 167 33 Myrtle Beach-North Myrtle Beach-Conway, SC 74.3 114.2 53 86 34 Sioux Falls, SD 73.5 143.7 -7 27 35 Logan, UT-ID 72.5 56.6 53 88 36 Winchester, VA-WV 72.4 59.2 -23 13 37 Wilmington, NC 71.9 142.6 47 84 38 Cheyenne, WY 71.8 46.2 -24 14 39 Portsmouth, NH-ME NECTA 71.6 56.5 -21 18 40 Killeen-Temple-Fort Hood, TX 71.4 132.7 29 69 41 Bend, OR 71.3 64.6 128 169 42 Brockton-Bridgewater-Easton, MA NECTA Division 70.9 93.2 19 61 43 Gainesville, GA 70.1 77.3 50 93 44 Merced, CA 70.0 61.2 -4 40 45 Ocean City, NJ 69.8 36.7 44 89 46 Chico, CA 69.7 75.5 99 145 47 Punta Gorda, FL 69.6 44.1 115 162 48 San Luis Obispo-Paso Robles, CA 69.4 106.4 -39 9 49 Morgantown, WV 69.3 68.4 5 54 50 Greenville, NC 69.1 82.2 -34 16 51 Kokomo, IN 68.9 44.2 7 58 52 New Bedford, MA NECTA 68.7 70.1 -24 28 53 Pascagoula, MS 68.6 57.9 131 184 54 Olympia, WA 68.3 104.3 83 137 55 Visalia-Porterville, CA 68.0 114.6 5 60 56 Mankato-North Mankato, MN 67.9 55.3 19 75 57 St. Cloud, MN 67.4 104.2 -2 55 58 Bellingham, WA 67.2 85.3 97 155 59 Tyler, TX 65.8 97.3 44 103 60 Port St. Lucie, FL 65.4 129.3 67 127 61 Missoula, MT 64.6 57.9 17 78 62 Wenatchee-East Wenatchee, WA 64.5 40.1 -9 53 63 Mount Vernon-Anacortes, WA 64.4 46.4 93 156 64 Idaho Falls, ID 64.3 50.9 41 105 65 Kennewick-Pasco-Richland, WA 64.0 102.3 98 163 66 Blacksburg-Christiansburg-Radford, VA 64.0 73.7 -49 17 67 Barnstable Town, MA NECTA 63.8 96.1 -56 11 68 Santa Cruz-Watsonville, CA 63.6 93.5 17 85 69 Monroe, MI 62.8 41.1 150 219 70 Casper, WY 62.7 42.1 -38 32 71 Ithaca, NY 61.5 69.4 -1 70 72 Pueblo, CO 61.4 59.8 38 110 73 La Crosse, WI-MN 61.4 77.4 4 77 74 Longview, TX 61.1 101.2 -45 29 75 Sherman-Denison, TX 61.1 44.6 7 82 76 Battle Creek, MI 61.0 58.4 0 76 77 Flagstaff, AZ 60.8 63.0 4 81 78 Springfield, OH 60.8 52.8 115 193 79 Dover, DE 60.6 66.9 122 201 80 Vallejo-Fairfield, CA 60.6 126.9 20 100 81 Clarksville, TN-KY 59.9 88.5 -43 38 82 Grand Forks, ND-MN 59.8 57.2 -45 37 83 Jacksonville, NC 59.8 48.9 -21 62 84 Billings, MT 59.7 81.8 -65 19 85 Lake Charles, LA 59.3 94.1 -41 44 86 Lafayette, IN 59.1 99.8 -71 15 87 Lebanon, PA 58.8 51.4 -16 71 88 Great Falls, MT 58.5 36.3 48 136 89 Dubuque, IA 58.3 59.2 -46 43 90 Madera-Chowchilla, CA 57.7 35.2 43 133 91 Sioux City, IA-NE-SD 57.0 76.4 0 91 92 Athens-Clarke County, GA 55.6 90.7 20 112 93 Charlottesville, VA 55.2 104.0 71 164 94 Janesville, WI 55.2 64.8 80 174 95 Owensboro, KY 54.8 52.8 -89 6 96 St. Joseph, MO-KS 54.7 63.0 -46 50 97 Eau Claire, WI 54.6 83.3 -25 72 98 Tuscaloosa, AL 54.5 97.7 -18 80 99 Sumter, SC 54.3 38.3 21 120 100 Fond du Lac, WI 54.1 47.0 102 202 101 Redding, CA 54.0 61.0 119 220 102 Salem, OR 53.6 146.3 80 182 103 Joplin, MO 53.6 82.3 6 109 104 Crestview-Fort Walton Beach-Destin, FL 52.7 79.5 -41 63 105 Prescott, AZ 52.5 57.5 52 157 106 Elizabethtown, KY 52.1 49.7 -9 97 107 Abilene, TX 51.5 67.5 -51 56 108 Williamsport, PA 50.9 56.3 -100 8 109 Panama City-Lynn Haven-Panama City Beach, FL 50.9 72.1 74 183 110 Rochester, MN 50.6 107.6 -61 49 111 Hagerstown-Martinsburg, MD-WV 50.5 104.2 -80 31 112 Las Cruces, NM 50.0 70.6 32 144 113 Yuba City, CA 49.4 39.1 45 158 114 Florence, SC 49.3 85.5 61 175 115 Burlington-South Burlington, VT NECTA 49.3 118.2 -79 36 116 Jackson, TN 49.0 61.7 -74 42 117 Duluth, MN-WI 48.6 132.8 13 130 118 Yakima, WA 48.4 80.1 -3 115 119 Wheeling, WV-OH 47.5 68.4 49 168 120 Oshkosh-Neenah, WI 47.3 94.4 -19 101 121 Harrisonburg, VA 47.2 65.0 -70 51 122 Danbury, CT NECTA 46.4 69.9 -11 111 123 Grand Junction, CO 46.3 60.8 -1 122 124 Lawrence, KS 46.1 52.1 -30 94 125 Amarillo, TX 46.0 114.1 -33 92 126 Medford, OR 45.7 78.3 51 177 127 State College, PA 45.5 76.2 -11 116 128 Peabody, MA NECTA Division 44.6 103.7 -69 59 129 Eugene-Springfield, OR 44.6 146.2 57 186 130 Longview, WA 44.1 37.4 13 143 131 Hattiesburg, MS 43.8 60.4 -17 114 132 Rapid City, SD 43.8 61.4 -11 121 133 Corvallis, OR 43.6 39.3 -46 87 134 Manchester, NH NECTA 43.1 101.3 -16 118 135 Fairbanks, AK 42.8 38.0 -45 90 136 Waterloo-Cedar Falls, IA 41.7 92.1 -84 52 137 Waco, TX 41.6 107.0 -91 46 138 Salinas, CA 41.6 126.7 33 171 139 Florence-Muscle Shoals, AL 41.5 55.8 3 142 140 Kankakee-Bradley, IL 41.0 44.2 -38 102 141 Hinesville-Fort Stewart, GA 41.0 19.9 10 151 142 Monroe, LA 40.9 78.6 -13 129 143 Lowell-Billerica-Chelmsford, MA-NH NECTA Division 40.8 120.4 -45 98 144 Gulfport-Biloxi, MS 40.6 107.2 84 228 145 Lawton, OK 40.6 44.3 -4 141 146 Gainesville, FL 40.5 131.5 -51 95 147 Columbus, GA-AL 40.5 121.8 -13 134 148 Muskegon-Norton Shores, MI 40.2 61.8 -82 66 149 Gadsden, AL 40.2 36.9 41 190 150 Lewiston, ID-WA 40.0 26.5 41 191 151 Appleton, WI 39.7 118.4 -25 126 152 Bloomington, IN 39.1 83.1 13 165 153 Waterbury, CT NECTA 38.8 65.1 70 223 154 Lewiston-Auburn, ME NECTA 38.0 49.1 19 173 155 Saginaw-Saginaw Township North, MI 37.5 87.7 23 178 156 Bangor, ME NECTA 37.4 66.5 -33 123 157 Sandusky, OH 37.3 34.9 75 232 158 Hanford-Corcoran, CA 37.1 36.5 -12 146 159 Morristown, TN 37.1 46.6 53 212 160 Warner Robins, GA 37.1 58.7 -35 125 161 Sebastian-Vero Beach, FL 36.8 46.5 27 188 162 Pocatello, ID 36.6 36.8 17 179 163 Fayetteville, NC 36.1 132.5 -56 107 164 Sheboygan, WI 35.6 58.7 47 211 165 Cedar Rapids, IA 35.5 140.4 -61 104 166 Manhattan, KS 35.2 56.5 -127 39 167 Valdosta, GA 35.0 54.1 -36 131 168 Goldsboro, NC 34.7 43.6 28 196 169 Nashua, NH-MA NECTA Division 34.3 129.3 -10 159 170 Topeka, KS 34.1 110.7 -62 108 171 Cape Girardeau-Jackson, MO-IL 34.0 44.7 -31 140 172 Hot Springs, AR 33.9 37.3 -48 124 173 Ocala, FL 33.5 93.1 -26 147 174 Niles-Benton Harbor, MI 32.5 60.0 40 214 175 Cumberland, MD-WV 31.6 39.6 -56 119 176 Bay City, MI 30.6 37.2 -108 68 177 Bremerton-Silverdale, WA 30.6 84.3 26 203 178 Yuma, AZ 30.4 52.5 -26 152 179 Macon, GA 29.7 99.1 -100 79 180 Santa Fe, NM 29.5 61.5 12 192 181 Kingston, NY 29.4 60.1 44 225 182 Leominster-Fitchburg-Gardner, MA NECTA 28.8 49.0 16 198 183 Farmington, NM 27.8 49.6 6 189 184 Muncie, IN 27.8 51.9 -161 23 185 Lima, OH 27.3 52.7 46 231 186 Erie, PA 27.3 129.7 -38 148 187 Rochester-Dover, NH-ME NECTA 27.3 56.4 -49 138 188 Rome, GA 26.9 39.3 -7 181 189 Kingsport-Bristol-Bristol, TN-VA 26.8 119.9 -36 153 190 Springfield, IL 26.8 110.8 -58 132 191 Anderson, IN 26.3 40.4 -117 74 192 Wausau, WI 25.7 68.2 25 217 193 Altoona, PA 25.5 60.7 -58 135 194 Salisbury, MD 25.4 52.7 -44 150 195 Burlington, NC 25.3 59.1 4 199 196 Jackson, MI 24.3 54.5 19 215 197 Pittsfield, MA NECTA 23.8 35.8 -25 172 198 Champaign-Urbana, IL 23.7 107.9 6 204 199 Hickory-Lenoir-Morganton, NC 23.3 146.1 31 230 200 Alexandria, LA 22.8 62.8 -3 197 201 Flint, MI 22.5 136.7 25 226 202 Lake Havasu City-Kingman, AZ 22.5 45.3 16 218 203 South Bend-Mishawaka, IN-MI 22.5 135.2 18 221 204 Decatur, AL 22.3 54.3 18 222 205 Fort Smith, AR-OK 21.9 116.6 -11 194 206 Racine, WI 21.8 75.2 3 209 207 Huntington-Ashland, WV-KY-OH 21.6 114.8 -27 180 208 Terre Haute, IN 21.3 70.9 -32 176 209 Albany, GA 21.0 61.6 -24 185 210 Rockford, IL 20.9 146.9 -44 166 211 Jefferson City, MO 20.8 76.5 -16 195 212 Glens Falls, NY 20.0 52.2 -106 106 213 Johnson City, TN 19.9 78.3 -59 154 214 Lynchburg, VA 18.4 102.3 -54 160 215 Utica-Rome, NY 17.7 127.9 9 224 216 Texarkana, TX-Texarkana, AR 17.7 55.2 -77 139 217 Dothan, AL 17.4 56.9 -11 206 218 Parkersburg-Marietta-Vienna, WV-OH 17.2 69.8 -2 216 219 Danville, VA 17.1 39.9 -146 73 220 Kalamazoo-Portage, MI 16.6 137.2 9 229 221 Brunswick, GA 16.5 40.1 -60 161 222 Steubenville-Weirton, OH-WV 15.4 44.1 16 238 223 Johnstown, PA 15.1 58.5 -74 149 224 Vineland-Millville-Bridgeton, NJ 14.3 57.7 -17 207 225 Mansfield, OH 13.4 52.2 11 236 226 Bloomington-Normal, IL 12.3 88.9 -109 117 227 Elmira, NY 12.0 38.9 -17 210 228 Wichita Falls, TX 10.3 57.7 -1 227 229 Charleston, WV 9.3 144.3 -59 170 230 Anniston-Oxford, AL 7.0 45.5 -25 205 231 Norwich-New London, CT-RI NECTA 6.4 126.0 2 233 232 Decatur, IL 5.6 51.3 5 237 233 Dalton, GA 5.4 63.5 8 241 234 Rocky Mount, NC 5.3 55.3 6 240 235 Carson City, NV 4.8 27.3 0 235 236 Binghamton, NY 4.3 106.1 -2 234 237 Atlantic City-Hammonton, NJ 3.9 132.5 2 239 238 Danville, IL 3.9 28.7 -38 200 239 Michigan City-La Porte, IN 3.8 41.8 -26 213 240 Pine Bluff, AR 3.1 35.4 -32 208 -
2014 How We Pick the Best Cities For Job Growth
Read about how we selected the 2014 Best Cities for Job Growth
The methodology for the 2014 rankings largely corresponds to that used in previous years, which emphasizes the robustness of a region’s growth both recently and over time, with a minor addition to mitigate the volatility that the Great Recession has introduced into the time series. It allows the rankings to include all of the metropolitan statistical areas (MSAs) for which the Bureau of Labor Statistics reports monthly employment data. They are derived from three-month rolling averages of U.S. Bureau of Labor Statistics "state and area" unadjusted employment data reported from November 2002 to January 2014.
The data reflect the North American Industry Classification System categories, including total nonfarm employment, manufacturing, financial services, business and professional services, educational and health services, information, retail and wholesale trade, transportation and utilities, leisure and hospitality, and government.
This year’s rankings use five measures of growth to rank all 398 metro areas for which full data sets were available from the past 10 years. "Large" areas include those with a current nonfarm employment base of at least 450,000 jobs. "Midsize" areas range from 150,000 to 450,000 jobs. "Small" areas have as many as 150,000 jobs. This year’s rankings reflect the current size of each MSAs employment. Only one MSA—Modesto, CA—changed size categories moving from “Small” to “Midsized.” In the instances where the analysis refers to changes in ranking order within the size categories, this MSAs changes are reported as if they had been included in their current category in the prior year.
The index is calculated from a normalized, weighted summary of: 1) recent growth trend: the current and prior year’s employment growth rates, with the current year emphasized (two points); 2) mid-term growth: the average annual 2008-2013 growth rate (two points); 3) long-term momentum: the sum of the 2008-2013 and 2002-2007 employment growth rates multiplied by the ratio of the 2002-2007 growth rate over the 2008-2013 growth rate (one point); 4) current year growth (one point); and 5) the average of each year’s growth rate, normalized annually, for the last ten years (two points). This methodology varies slightly from 2013 in that long-term momentum (factor 3) is reduced slightly in importance and long-term consistency (factor 5) has been added to mitigate the distortions created by instances of huge swings down and up by some MSA’s associated with the Great Recession. The goal of the rankings methodology is to capture a snapshot of the present and prospective employment outlook in each MSA and these revisions allow the reader to have a better sense of employment climate in each.
-
Should Middle Class Abandon the American Dream?
Over the past few years, particularly since the bursting of the housing bubble, there have been increasing calls for middle-class Americans to “scale down” from their beloved private homes and seek a more constrained existence. Among these voices recently was Michael Milken, for whom I have worked and have enormous respect. He suggested Americans would be better off not buying homes and living smaller, for the sake of their own economic situations, families and the environment.
To some extent, the Great Recession has done much to make downsizing a reality, just as Milken and others propose. Homeownership in America, which peaked in 2002 at nearly 70 percent, dropped, according to the U.S. Census Bureau, to 65 percent in 2013, the lowest level in 15 years. Some of this may be seen as correcting the excesses of the housing bubble, but the trajectory suggests – and many analysts agree – that ownership may continue to fall in years ahead.
The question now is, do we want Americans to abandon homeownership, leave the less-crowded periphery for congested areas, adopting the chock-a-block lifestyle much as many of their grandparents did? This poses an easier proposition for the ultrarich, who already live far larger than the average American and whose biggest real estate worry more likely involves which pied a terre or country house they want to purchase next.
This is very different than the reality of the average middle-class family, whose concerns are more prosaic, such as finding room for home offices, deciding how few bathrooms a family can accommodate without armed conflict and if it is even feasible to afford the close-in communities their betters want them to inhabit.
Unable to play the stock game on the scale of gain like those who invest in private equity, hedge funds or venture capital, for the middle classes the home remains the one place where they can gain equity and, perhaps more importantly, some sense of autonomy. For many, it is the only large investment they can afford, since at least it provides a place to live and offsets the rent that they would have to pay otherwise.
The recovery has been sweet for the rich, in large part because they have the extra money to invest in stocks. They have 24 percent of their wealth in homes, compared with 40 percent for middle-income families.
And, since the rich can afford to send their kids to elite schools, where degrees increasingly are the last ones to produce much value at the high end of the job market, to such people, the investment in education urged by Milken may seem like a good bet. Investing more in conventional education, however, is no panacea for many middle-class and working-class families, whose kids are often saddled with debt and attend the second-tier schools whose returns on income are far less attractive, say, than those who can send their kids to Harvard.
This is not to say that many larger homes seem foolhardy investments. But there are many legitimate reasons why people may need larger spaces. Among the most prominent is the growing tendency for people to work at home – most metro areas have far more telecommuters than transit commuters – as well as the increasing numbers of multigenerational households, which, after falling for decades, have risen from 12 percent of total households to 16 percent since 1980.
The phenomena of some among the rich calling for the middle class to scale back represents one of the least-attractive aspects of the current gentry liberal ascendency. In one remarkable piece, Dave Zahniser, writing for the LA Weekly, went to the homes of L.A.’s “smart growth” advocates, most of whom want ever more density and multifamily apartments as opposed to houses. And where did they live? Almost all in large houses, often in gated communities, far from any bus line. Zahnhiser’s headline captured the hypocrisy: “Do what we say, not what we do.”
Cloaked in sensible rhetoric, the current drive to discourage middle-class homeownership really represents a kind of class warfare, albeit unacknowledged, waged by wealthy people upon the middle class, who, the wealthy suggest, should live smaller even as they indulge ever-expanding luxury. Talk about adding insult to injury: Middle-income groups have fared far worse during the recovery than the rich or, in relative terms, the poor.
Some advocacy for middle-class downsizing is brazenly self-interested. The Wall Streetadvocates of a “rentership” society see a great opportunity for profit as Americans are deprived of their aspirations by the weak economy. As the dream of some autonomy fades, more families are forced to become renters in apartments or houses that such hedge funds as Blackstone have collected from distressed former owners.
In the process, a huge portion of the population is being transformed from property owners to renting serfs; money that might have gone to building a family nest egg ends up paying the mortgages for the investor class. In this neofeudalist landscape, landlords replace owner-occupants, perhaps for as long as the next generation.
“There is the possibility that Wall Street and the banks and the affluent 1 percent stand to gain the most from this,” said Jack McCabe, a real estate consultant based in Deerfield Beach, Fla. “Meanwhile, lower-income Americans will lose their opportunity for the American Dream of building wealth through owning a home.”
Other wealthy folks – notably some in Hollywood and Silicon Valley – also support a California planning regime that makes difficult the purchasing and construction of family-size homes, largely as a means to reducing the dreaded human “carbon footprint.” Yet they, too, are often unconsciously hypocritical, as many of them live in palatial houses, and often fly on private jets, one of the quickest ways to boost one’s carbon emissions. Google’s top executives, among the most reliable allies of the middle-class-destroying green and urban-planner lobby, famously have a fleet of planes based at San Jose Airport.
Others, like the environment magazine Grist, embrace a more idealistic vision of a new generation that rarely owns and doesn’t embrace conventional ambitions. They see the current millennial generation, facing limited economic prospects and high housing prices, as “a hero generation,” rejecting the material trap of suburban living and work that engulfed their parents.
This story originally appeared at The Orange County Register.
Joel Kotkin is executive editor of NewGeography.com and Distinguished Presidential Fellow in Urban Futures at Chapman University, and a member of the editorial board of the Orange County Register. He is author of The City: A Global History and The Next Hundred Million: America in 2050. His most recent study, The Rise of Postfamilialism, has been widely discussed and distributed internationally. He lives in Los Angeles, CA.
-
Silicon Valley’s Giants Are Just Gilded Age Tycoons in Techno-Utopian Clothes
Silicon Valley’s biggest names—Google, Apple, Intel and Adobe—reached a settlement today in a contentious $3 billion anti-trust suit brought by workers who accused the tech giants of secretly colluding to not recruit each other’s employees. The workers won, but not much, receiving only a rumored $300 million, a small fraction of the billions the companies might have been forced to pay had they been found guilty in a trial verdict.
The criminality that the case exposed in the boardrooms the tech giants, including from revered figures like Steve Jobs who comes off as especially ruthless, should not be jarring to anyone familiar with Silicon Valley. It may shock much of the media, who have generally genuflected towards these companies, and much of the public, that has been hoodwinked into thinking the Valley oligarchs represent a better kind of plutocrat—but the truth is they are a lot like the old robber barons.
Starting in the 1980s, a mythology grew that the new tech entrepreneurs represented a new, progressive model that was not animated by conventional business thinking. In contrast to staid old east coast corporations, the new California firms were what futurist Alvin Toffler described as “third wave.” Often dressed in jeans, and not suits, they were seen as inherently less hierarchical and power-hungry as their industrial age predecessors.
Silicon Valley executives were not just about making money, but were trying, as they famously claimed, to “change the world.” One popularizing enthusiast, MIT’s Nicholas Negroponte, even suggested that “digital technology” could turn into “a natural force drawing people into greater world harmony.”
This image has insulated the tech elite from the kind of opprobrium meted out to their rival capitalist icons in other, more traditional industries. In 2011, over 72 percent of Americans had positive feelings about the computer industry as opposed to a mere 30 percent for banking and 20 percent for oil and gas. Even during the occupy protests in 2012, few criticisms were hurled by the “screwed generation” at tech titans. Indeed, Steve Jobs, a .000001 per center worth $7 billion, the ferocious competitor who threatened “war” against Google if they did not cooperate in his wage fixing scheme, was openly mourned by protestors when news spread that he had passed away.
But the collusion case amply proves what has been clear to those watching the industry: greed and the desire to control drives tech entrepreneurs as much as any other business group. The Valley is great at talking progressive but not so much in practice. In the very place where private opposition to gay marriage is enough to get a tech executive fired, the big firms have shown a very weak record of hiring minorities and women. And not surprisingly, firms also are notoriously skittish about revealing their diversity data. A San Jose Mercury report found that the numbers of Hispanics and African Americans employees in Silicon Valley tech companies, already far below their percentage in the population, has actually been declining in recent years. Hispanics, roughly one quarter of the local labor force, account for barely five percent of those working at the Valley’s ten largest companies. The share of women working at the big tech companies – despite the rise of high profile figures in management—has also showed declines.
In terms of dealing with “talent,” collusion is not the only way the Valley oligarchs work to keep wages down. Another technique is the outsourcing of labor to lower paid foreign workers, the so called “techno-coolies.” The tech giants claim that they hire cheap workers overseas because of a critical shortage of skilled computer workers but that doesn’t hold up to serious scrutiny. A 2013 report from the labor-aligned Economic Policy Institute found that the country is producing 50% more IT professionals per year than are being employed. Tech firms, notes EPI, would rather hire “guest workers” who now account for one-third to one half of all new IT job holders, largely to maintain both a lower cost and a more pliant workforce.
Some of this also reflects a preference for hiring younger employees at the expense of older software and engineering workers, many of whom own homes and have families in the area.
“I want to stress the importance of being young and technical,” Facebook’s CEO Mark Zuckerberg said at an event at Stanford University in 2007. “Young people are just smarter. Why are most chess masters under 30? I don’t know. Young people just have simpler lives. We may not own a car. We may not have family. Simplicity in life allows you to focus on what’s important.”
Of course what’s really “important” to Zuckerberg, like moguls in any time and place, is maximizing profits and raking in money, both for themselves and their investors. The good news for the bosses has been that employees are rarely in the way. Unlike the aerospace, autos or oil industries, the Valley has faced little pressure from organized labor, which has freed them to hire and fire at their preference. Tech workers wages, on the other hand, have been restrained both by under the table agreements and the importation of “technocoolies.”
Rather than being a beacon of a new progressive America, the Valley increasingly epitomizes the gaping class divisions that increasingly characterize contemporary America. Employees at firms like Facebook and Google enjoy gourmet meals, childcare services, even complimentary house-cleaning to create, as one Google executive put it, “the happiest most productive workplace in the world.” Yet, the largely black and Hispanic lower-end service workers who clean their offices, or provide security, rarely receive health care or even the most basic retirement benefits. Not to mention the often miserable conditions in overseas factories, notably those of Apple.
It’s critical to understand that the hiring restrictions exposed by Friday’s settlement, reflect only one part of the Valley’s faux progressiveness and real mendacity. These same companies have also been adept at circumventing user privacy and avoiding their tax obligations.
One might excuse the hagiographies prepared by the Valley’s ever expanding legion of public relations professionals, and their media allies, but the ugly reality remains. The Silicon Valley tech firms tend to be every bit as cutthroat and greedy as any capitalist enterprise before it. We need to finally see the tech moguls not as a superior form of oligarch, but as just the latest in long line whose overweening ambition sometimes needs to be restrained, not just celebrated.
This story originally appeared at The Daily Beast.
Joel Kotkin is executive editor of NewGeography.com and Distinguished Presidential Fellow in Urban Futures at Chapman University, and a member of the editorial board of the Orange County Register. He is author of The City: A Global History and The Next Hundred Million: America in 2050. His most recent study, The Rise of Postfamilialism, has been widely discussed and distributed internationally. He lives in Los Angeles, CA.
-
Time Magazine Gets it Wrong on the Suburbs
Time Magazine’s Sam Frizell imagines that the American Dream has changed, in an article entitled "The New American Dream is Living in a City, Not Owning a House in the Suburbs." Frizell further imagines that "Americans are abandoning their white-picket fences, two-car garages, and neighborhood cookouts in favor of a penthouse view downtown and shorter walk to work." The available population data shows no such trend.
Frizell’s evidence is the weak showing in single family house building permits last month and a stronger showing in multi-family construction.
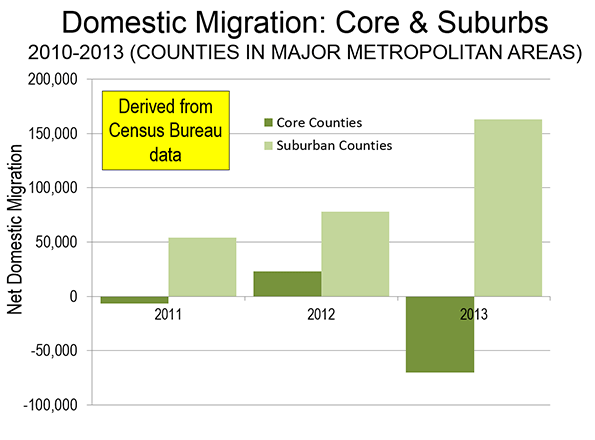
This is just the latest in the "flocking to the city" mantra that is routinely mouthed without any actual evidence (see: Flocking Elsewhere: The Downtown Growth Story). The latest Census Bureau estimates show that net domestic migration continues to be negative in the core counties (which include the core cities) of the major metropolitan areas (those with more than 1,000,000 residents). The county level is the lowest geographical level for which data is available.
At the same time, there is net domestic inward migration to the suburban counties. Moreover, much of the net domestic migration to metropolitan areas has been to the South and Mountain West, where core cities typically include considerable development that is suburban in nature (such as in Austin, Houston and Phoenix). As the tepid "recovery" has proceeded, net domestic migration to suburban counties has been strengthened (see: Special Report: 2013 Metropolitan Area Population Estimates), as is indicated in the Figure.
There is no question but that core cities are doing better than before. It helps that core city crime is down and that the South Bronx doesn’t look like Berlin in 1945 anymore. For decades, many inclined toward a more urban core lifestyle were deterred by environments that were unsafe, to say the least. A principal driving force of this has been millennials in urban core areas. Yet, even this phenomenon is subject to over-hype. Two-thirds of people between the ages of 20 and 30 live in the suburbs, not the core cities, according to American Community Survey data.
To his credit, Frizell notes that the spurt in multi-family construction is "not aspirational," citing the role of the Great Recession in making it more difficult for people to buy houses. As I pointed out in No Fundamental Shift to Transit: Not Even a Shift, 2013 is the sixth year in a row that total employment, as reported by the Bureau of Labor Statistics was below the peak year of 2007. This is an ignominious development seen only once before in the last 100 years (during the Great Depression).
In short, urban cores are in recovery. But that does not mean (or require) that suburbs are in decline.
-
Insights into Planning for the Future From Long Island
Recently, Long Island-based Foggiest Idea launched an all-new feature called The Foggiest Five, which asks influential Long Islanders five questions regarding the future of the region. The first participant was Andrew Freleng, who serves as Suffolk County’s Chief Planner. Freleng’s experience and dedication to the field made for the perfect first featured guest.
The Foggiest Idea was started in 2010 as a dedicated effort to make land use and development issues approachable and understandable to the general public. Since its creation, the site has been used by journalists, policymakers and residents in order to research and understand the issues that shape their community. The Foggiest Five serves to present different viewpoints and perspectives on development issues, while at the same time adhering to strict urban planning principles often forgotten in the name of simplifying the issues for quick consumption.
The feedback to the feature has been positive, with the first round of answers by Suffolk County’s Chief Planner Andrew Freleng generating much discussion on the Nassau and Suffolk’s future. Freleng’s segment can be read here.
What makes Freleng’s commentary so compelling is that despite his entrenchment in the milieu of Long Island’s development scene, his instinct for and adherence to following sound planning principles is not only intact, but heightened. The questions presented were simple:
1. What is your favorite part of living on Long Island?
2. What is our greatest regional challenge?
3. What is an easy first step to solving this challenge?
4. What has been the biggest change that you’ve seen on Long Island during the course of your career?
5. What do you think Long Island will be like in 20 years?The answers reflected greater undertones that showed an underlying frustration with the way land use planning is conducted on Long Island, and a sense of optimism that we can always improve.
What was most compelling about Freleng’s answers was that he touched upon many aspects of regional development now often ignored. Those engaged with the issues forget that development issues are complex, and cannot solely be captured by buzzwords or agendas.
In recent years, the conversation regarding the future of America’s definitive suburb has been dominated by involved stakeholders, "advocates" and politicians. All of these groups have something to gain when it comes to the successful promotion of hard, aggressive solutions that push for infrastructure improvements and increasing density yield. To have developers dictating the terms and conditions of the regional debate on housing is akin to having Oil Barons from Texas singularly dictating energy policy – it just doesn’t make sense. On Long Island, it truly is a case of the foxes watching the hen house when it comes to urban development.
Long Island, like so many other regions nationwide, is a victim of its own success. The rapid expansion of both Nassau and Suffolk overwhelmed the municipalities preference for home-rule community building, allowing development to run rampant on any vacant lot from Elmont to Riverhead with very limited regulation until it was proven necessary by groundwater studies. These federally funded studies, conducted in the late 1970s through mid-1980s, provided the scientific justification for the county to pursue its nationally trailblazing open space preservation efforts and employ stricter land use controls.
In recent years, the solution to high cost of living, lack of affordable housing and limited economic opportunity has been clustered development in various downtown centers across Long Island, a concept backed by valid planning principles. However, the excellence is in execution, with developers taking the once-valid planning terms "walkable", "sustainable" and "mixed-use", and using them to justify large increases of density without the appropriate infrastructure upgrades to support it – all in the name of Smart Growth that lately has been anything but.
The lessons learned from Nassau and Suffolk Counties can be applied broadly across the United States. First and foremost, planning is a mixture of public education, participation, and implementation. The minute any one of these aspects are forgotten by the municipality or developer looking to increase their yield, the legitimacy of their endeavor is compromised. Nationwide, the smart growth movement has been used to justify anything from storefront apartments to roundabouts. What is needed is a focus that doesn’t dumb down the concepts, but rather, presents them in an approachable manner.
Overall, Freleng’s responses capture two distinct needs that get lost in the zeal to build “smart growth mixed-use walkable communities” to “plug the brain drain”: the need for further utilization of Transfer of Development Rights (TDR) in conjunction with increased efforts to preserve open space. These important land use tools, paired with the proper use of home-rule authority that maintains the distinct “sense of place” that Freleng mentions in his favorite part of living on the Island, can help Long Island not only be fiscally and environmentally sustainable, but help the region grow in future decades.
As Chief Planner for the County, Freleng has worked on a multitude of projects both large and small, allowing him a unique perspective to the issues that many don’t share. When asked what Long Island’s greatest regional challenge is, Freleng succinctly responded:
“…to recognize that there is a carrying capacity/saturation population to our island. In that respect, finding a model for sustained economic growth is a huge challenge.”
It’s very telling for a planner to state that the greatest challenge we face as a region is admitting that we have limits. He did not say that we need more development, nor did he claim that more growth is needed to capture millennials, as countless others have said when asked the same question. Those answers would serve as the easy way out. Unfortunately, many opt for that path. Development and growth is needed, but in the right places, and offset by equal (if not more) preservation.
Freleng chose to point out the fact that despite what stakeholders and others claim, our land use decisions are determined by environmental factors first and economic interests second. For Long Island to remain competitive in the coming decades, we must start planning for the needs of our environment, not doing so as an afterthought. To be blunt, we as an Island cannot build our way to a solution to many of our regional challenges.
Often, I write that the key to planning is maintaining the balance between Long Island’s environment, economy and social equity. In recent years, the tone and pace of the conversation regarding our approach to critical regional issues has been determined by involved stakeholders (housing groups, environmentalists and builders), and invested policymakers more concerned about the election cycle and maintaining their fiefdoms.
Despite the stacked odds, Long Island must always have prevailing sense of optimism. Freleng’s final response noted that the Long Island of the future will have room for all generations, which is an encouraging sign we may finally be able to diversify our housing stock. Suffolk County Government seems to be optimistic that the Island’s carrying capacity can be increased thanks to advanced wastewater treatment techniques and traffic congestion management, two key factors that limit the Island’s growth. Advances in both would help ease the burdens of growth, but sound planning now is necessary for both to be successful.
Now, more than ever, we must properly lay the foundation for a stronger, sustainable Long Island. If we just throw density at the issue, we’ll have a whole host of other problems that are far more extensive and expensive to deal with.
Richard Murdocco writes regularly on land use, planning and development issues for various publications. He has his BA in both Political Science and Urban Studies from Fordham University, and his MA in Public Policy from Stony Brook University, and studied planning under Dr. Lee Koppelman, Long Island’s veteran planner. You can follow Murdocco on Twitter @TheFoggiestIdea, Like The Foggiest Idea on Facebook, and read his collection of work on urban planning at TheFoggiestIdea.org.