Blog

  • California is in for a World of Hurt

    California’s political class, led by Governor Brown, has been patting itself on the back for solving California’s problems. This celebration is ludicrous.  What they’ve done amounts to a mere slowing down in a long-term political, fiscal, and demographic decline. 

    Demographic trends themselves are creating a crisis brought about by a population that is simultaneously losing its children and getting older, and to a frightening extent poorer. From 2000 to 2010, the percentage of Los Angeles’ population under 15 years old fell by 15.6 percent. This was the greatest decline of any U.S. major metropolitan area, and about double the U.S. average of 7.4 percent.

    California’s poverty statistics are just as depressing.  The state now is home to one-third of all US welfare recipients. According to a Census Bureau report, The Research SUPPLEMENTAL POVERTY REPORT: 2011 California has the nation’s highest poverty rate of any state. By its Supplemental Poverty Measure, 23.5 percent of California’s population is poor, while only 15.8 percent of the nation’s population is poor.  No other state is above 20 percent.

    Because of its aging and increasingly poor population, its dearth of young people and migratory trends, demand for government services in California will be increasing as the number of people available to pay for those services will be decreasing.  Financing concurrent expenses will be hard enough.  Paying for today’s excesses may prove impossible.

    Let’s go through the evidence:

    Figure 1 shows California’s Department of Finance’s (DOF) estimate of domestic migration, migration between California and other states.  According to the DOF, California’s domestic migration has been negative in 18 of the past 20 years.  This is less dismal than the U.S. Census’ estimate that California’s domestic migration has been negative for 20 consecutive years.  This is the longest sustained period of negative domestic migration in California’s history.  We’ve seen this before, in the rust belt.  It leads to decay, poverty, increased crime, and unlivable cities.

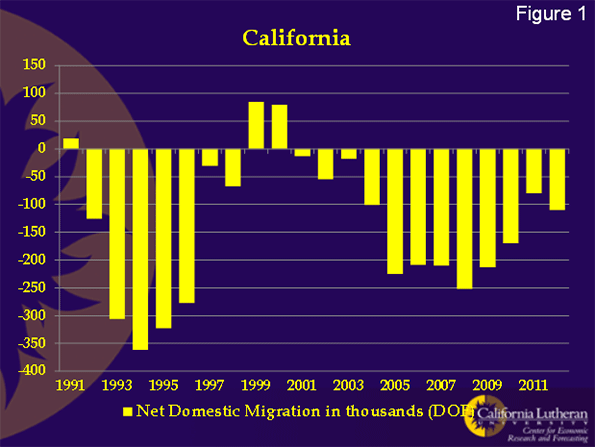
    Domestic migration is important because it should be seen as an early warning signal of eventual decline.  Migrants are the proverbial “canaries in the coal mine”.  When domestic migration is negative, people are voting with their feet.  They are saying that California doesn’t provide enough opportunity to stay, particularly given its high cost of living.  Given how comfortable it is to live in California, I think they make that decision reluctantly.

    Over most of California’s recent history, international migration has been strong enough that total migration remained positive.  That’s no longer true.

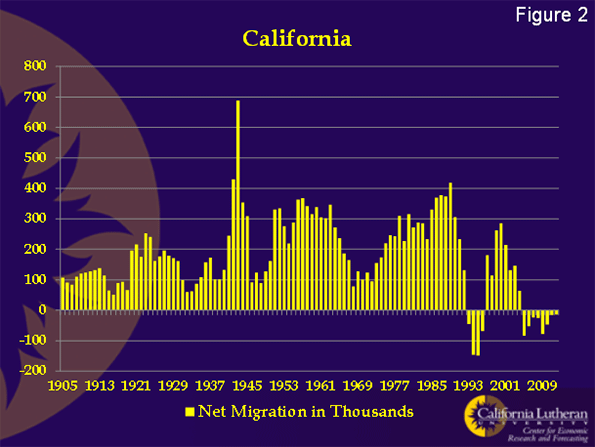
    Figure 2 shows California’s total net migration for the past 107 years.  Prior to 1993, California had never seen a year where total migration was negative.  Now, we’ve have negative migration for eight consecutive years.

    More critically, the rate of foreign migration in the state’s cities is falling behind many competitor cities. For example, over the last decade, New York had almost six times the increase in foreign born than Los Angeles. Houston, which has barely one third the population of LA-Orange County, increased its foreign born nearly four times as fast. Overall, LA-Orange had the lowest percentage increase of any major US metro. Given that the Southland has been the state’s immigration magnet for a generation, this is not good news.

    Weak, negative migration is likely to continue.  We used to characterize domestic migration as pull migration; rapidly growing economies attract migrants looking for opportunity. International migration, especially from other countries in this hemisphere, was thought to be push migration; conditions were so bad in the country of origin that migrants would come to California even in a recession.

    Apparently, that’s no longer true.  Mexico, for example, has an unemployment rate of about half of California’s today.  When you add the increased cost imposed by coyotes on illegal immigrants (a price increase from about $3,000 a few years ago to about $6,000 today plus the requirement to carry drugs), it’s no mystery why California’s growers are having a hard time finding an adequate workforce.

    Negative migration is important because migrants have been a critical part of California’s growth and creativity.  Not only is California losing the services of the migrants who choose, say, Texas instead of California, California is suffering a drain of some of its talent pool, particularly among those about to have children.

    For a long time, many people thought that California’s Hispanic population would cause its population growth rate to increase.  That turns out to not be true.

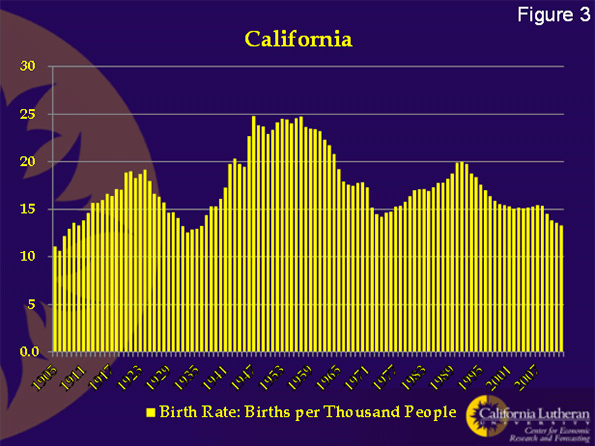
    Figure 3 shows California’s birthrate.  Our births per thousand population is the lowest it’s been since the worst part of the depression.  What’s scary though, is the rate of decline.  Births have fallen below 15 per thousand and seem destined to hit 10 per thousand.  This is a national trend and a key reason to create national policies that encourage increased international immigration.

    If a population is growing, it’s possible to have increasing births (new people) even when the birth rate is declining. Unfortunately, California isn’t there.

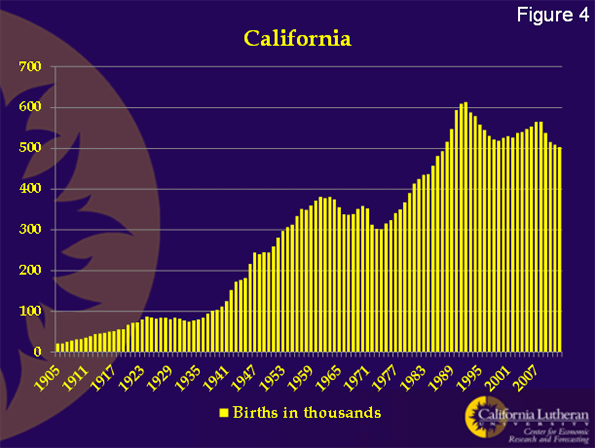
    Figure 4 shows the total number of births in California.  It’s fallen to 500,000 per year from 600,000 per year about 20 years ago.  If California’s birth rate falls to 10 percent, we can expect the number of births to decline to about 350,000.  At that point, the math starts to get to be a problem.  Is a decline to 10 per thousand possible?  You bet.

    According to the CIA, as of 2012, 29 out of 221 countries (13 percent) had birth rates below 10 per thousand.  Those 29 countries included Japan, Germany, Switzerland, South Korea, and Singapore.

    Unfortunately, California — as opposed to states such as Texas — could reach a 10 per thousand birth rate within 10 years if existing birth rate trends continue.  Even more disturbing, there is no reason to believe that 10 per thousand is a lower bound.  Germany, for example, has a birth rate of 8.33, while Hong Kong and Singapore have rates of only 7.54 and 7.72 respectively.

    For California’s population to continue to grow, births have to outnumber the losses to migration and deaths.  We’ve already discussed migration.  What about deaths?

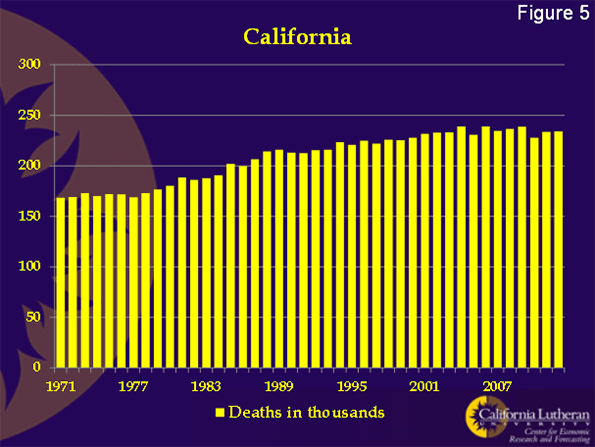
    Figure 5 shows annual California deaths from 1971 through 2012.  While recently flat, the trend is up, and an aging population implies more increases. For our calculations, we’ll assume California deaths at 250,000 per year.  This is a conservative assumption. As the Baby Boomers age, California deaths will increase.

    When California’s birth rate falls to 10 per thousand, we can expect 350,000 births.  Deaths will be about 250,000. Apparently, as long as outmigration doesn’t exceed 100,000 California’s population won’t decline overall.

    The good news is that outmigration in excess of 100,000 has only happened once.  California’s net outmigration exceeded 100,000 for two consecutive years in the 1990s, when California was undergoing a dramatic economic realignment brought about by the end of the Cold War. 

    The bad news is that we’ve come very close to losing 100,000 twice in the past eight years, particularly during the housing boom. Many people believe that low home prices are restraining domestic outmigration, because people are waiting for equity to return before making the move. Higher home prices and increased tax rates could drive big increases in the numbers of people leaving California.

    Unless there is some dramatic change, it is almost inevitable that California will suffer a declining population within a generation. The way to avoid this calamity is create an economic environment that encourages job growth and economic activity. 

    At the same time, it appears prudent to begin planning now for an aging and possibly smaller population.  Increased government revenues through more robust and varied economic activity would help here, but more probably needs to be done. California needs to reform its business climate, reduce its debt and unfunded liabilities, and do so quickly.

    Bill Watkins is a professor at California Lutheran University and runs the Center for Economic Research and Forecasting, which can be found at clucerf.org.

  • What Killed Downtown?

    What Killed Downtown?: Norristown, Pennsylvania, from Main Street to the Malls
    by Michael E. Tolle

    For those of us who have grown dyspeptic on the over-indulged topic of the collapse of the American city center, Michael Tolle’s What Killed Downtown? Norristown, Pennsylvania, from Main Street to the Malls earns much of its anodyne appeal by straying from a commonly accepted convention in urban studies—that an analysis of the socioeconomic decline of a community should draw heavily upon socioeconomic variables. Isn’t there another way to get the point across? And more importantly, aren’t there other contributing factors?

    This compassionate narrative of the 20th century rise and fall of an older Philadelphia suburb avoids graphs and charts for the most part, becoming much more engaging for its alternative approach. And likeability is exactly what it will need to win over skeptics, or the merely apathetic, because most people in the US probably have never heard of Norristown. In fact, it’s likely that quite a few people on the other side of the Keystone State aren’t familiar with it either. After all, the borough at its 1960 peak only had 39,000 inhabitants (the 2010 Census records a population of 34,000). But Norristown merits further observation, not so much because its downtown has declined in the mid-20th century—that happened everywhere, in municipalities of all sizes—but because Norristown sits squarely in the middle of Montgomery County, an expansive bedroom community of Philadelphia with 800,000 people and a median household income of over $78,000, placing it within the top 100 wealthiest counties in the nation. Meanwhile, Norristown’s median household income, according to the latest Census, is approximately $43,000 and its poverty level of 16.4% is almost triple that of the county’s 5.7%, and still a fair amount higher than the state’s rate of 12.6%. While Montgomery County boomed over the last half century, Norristown has not shared in that prosperity. It is by no means a devastated town—many old neighborhoods remain charming and fully intact—but the commercial heart of Norristown has never healed.

    The above paragraph contains a higher concentration of raw data than one should ever expect to encounter in Tolle’s new book. Rather than delving into the Bureau of Labor Statistics, the US Census Bureau, or rankings from Urban Land Institute or the Brookings Institution, Tolle manages to chronicle the rapid ascent of this suburban outpost, its 75-year dominion over commercial activity within the county, and its precipitous decline shortly after the Second World War—and he achieves it through a diligent perusal of old city directories, interviews with almost two dozen of Norristown’s older citizenry, and a vigorous exploration of the internal machinations of the Borough Council. He applies an anthropologist’s lens to a subject that sociologists have long overcrowded.

    While Norristown’s early history—first as a manor under one of William Penn’s initial surveys, followed by a subdivision into smaller farms by Isaac Norris in 1712—is clearly never the focal point for Tolle’s methodical dissection of downtown, he avoids glossing over it. Not surprisingly, Norristown emerged as the most desirable plot of land in the sprawling manor because of its accessibility: it abutted the “canoeable part of the Schuylkill” and the interconnected American Indian trails that allowed for easy fording of the river. By 1784, the Pennsylvania Assembly carved Montgomery County out of the existing Philadelphia County, and a subsequent deed conveyed lots reserved for county buildings at the intersection of two of the only extant roads at the time. Due to its advantageous location, it became a nearly self-sufficient Town of Norris within a few years, abiding by Penn’s “Town Model” for Philadelphia and other Pennsylvania cities, employing tightly organized, gridded streets that maximized uses of available space. The construction of some of the earliest turnpikes helped to stimulate the town’s steady growth and prepare it for its incorporation as a borough of 520 acres in 1812, followed shortly thereafter by the rail networks that galvanized further expansion.


    Swede Street just north of Main Street, known by some as Lawyers’ Row. Photo from Spring 2011, courtesy of Matthew Edmond.

    The early chapters of the book may only provide a backdrop for Norristown’s 20th century rise and fall, but Tolle chronologically accounts for the factors that helped Norristown emerge as the primary urban center in Montgomery County. And unlike neighboring 19th century boomtowns that dot both the Delaware and Schuylkill Valleys, Norristown “lacked the characteristics that define similar towns of sufficient size and influence that could easily explain the downtown’s decline. . . [It] was never a one-company town. It was never dependent on [a] single employer whose corporate fate might have led it to a catastrophic domino effect; rather Norristown’s workforce has always been distributed among many workplaces.” It owed much of its steady growth to its fortuitous location 17 miles northwest of Philadelphia, the convergence of several modes of transportation, and its role as the administrative center of a large and increasingly prominent county.

    By the book’s twentieth page, Tolle reveals the real heart of his study: the bustling commercial core of Norristown’s six-block Main Street. At the borough’s Centennial Celebration, population approached 30,000, swelling largely from immigrants who arrived to work in various industries: first the northern European Protestants, then the Irish, then, in by far the highest concentration, the Italians, overwhelmingly from Sicily. Mennonites, Amish, and Jews (predominantly of German heritage) along with African Americans arrived in smaller numbers. While the population self-segregated along largely ethnic and economic lines (working and lower-middle class Protestants on the West End; the wealthy, Northern European original settlers in the North End and DeKalb Street; Italians and African Americans in the blue-collar East End), all the strata converged along Main Street’s densely commercialized blocks. Tolle explores the full week’s worth of celebratory activities, from the details of the floats in the Industrial Day parade to overhead weave of flags, bunting, and electrical wires. The pace of the narrative slows at this point, but Tolle employs a humanism that he retains across the ensuing pages. When he intermittently bogs down in relentless detail, he’s easily forgivable—even a little admirable for not shying away from his obsessions.


    A view of DeKalb Street, Norristown’s most affluent residential address, from its southern junction with Main Street. This was once the center of commercial activity in the borough. Tolle details the controversy of the implementation of the Comprehensive Plan to make DeKalb Street one-way northbound in 1951, a restriction which remains today. Photo from Spring 2011, courtesy of Matthew Edmond.

    The Directory of the Boroughs of Norristown and Bridgeport, Montgomery County, Pa, for the years 1860-1861 serves as the bedrock for his chronological exploration of the commercial health of downtown Norristown. For some of the most resilient businesses—Chatlin’s Department Store, Egolf’s Furniture, Zummo’s Hardware—Tolle offers vignettes on their immigrant backgrounds and the financial maneuvering necessary to start their trades. Interspersed with these brief accounts are updates from subsequent City Directories, chronicling the change in business composition over time. But Tolle generally eschews tables and charts—with few exceptions, he narrates the changing commercial landscape of Norristown by integrating the livelihoods of the proprietors with the demands of the consumers. Because the authorial voice depends so heavily on firsthand accounts of the business climate—articles from the Norristown Times Herald, advertisements (including misspellings and solecisms), and, in the later years, eyewitness accounts—the routine references to City Directory data never grow stuffy or monotonous.


    What Killed Downtown? is a concatenation of anecdotes. While such an indulgence in human-interest nostalgia could take a maudlin turn, Tolle again counterbalances these episodes with moments of acerbic subjectivity, as any conscientious anthropologist cannot help but do. My two favorite anecdotes feature a building and a person. The Valley Forge Hotel emerged in the roaring 1920s, purely driven by the local business community, who felt that the proud city demanded a first-class hotel. A stock subscription campaign raised enough to complete the massive six-story brick structure by November of 1925. Though it rarely made a profit, its size and relative opulence made it an icon for the city, and as an emblem of civic pride, it succeeded. The other great anecdote involves the detailed account of the life of the city’s most colorful politician, the recalcitrant Paul Santangelo. Lacking greater aspirations than borough administration, Santangelo earns more ink on these pages than any other civic leader, including the mayors. He fiercely defended the interests of the poorer Sicilian immigrants who comprised much of his district, voting ferociously in their favor but often—in Tolle’s opinion—at the expense of city progress as a whole.


    Norristown Main Street, west of Swede Street and looking westward. Photo from Spring 2011, courtesy of Matthew Edmond.

    Tolle’s account of Norristown’s Main Street after its 1950 apex avoids mind-numbing predictability even has he identifies the usual culprits contributing to its decline: growing dependence on the automobile, competition from suburban shopping plazas like the now-mammoth King of Prussia, shift of the population center toward the far-southern part of Montgomery County, construction of limited access highways outside of the borough’s limits. And of course, all these factors converge with the suburban amenity that wounds Norristown the most: “free, ample parking”—a mantra which Tolle repeats enough that it tacitly answers the question to his book’s title. Anyone with a scintilla of knowledge of American urbanism will know where this is headed. But by the1950s, Tolle reaches a point in time where procures firsthand accounts of Main Street’s changes. The worm’s-eye view continues, imbuing the narrative of Norristown’s saddest days—by the 1970s it is not safe to walk Main Street at night—with empathy and hope.


    Courthouse Plaza along Main Street, one of many mid-century projects that removed commercial buildings and replaced them with staid, largely unused civic space. Photo from Spring 2011, courtesy of Matthew Edmond.

    For a person as enamored by details as me, Tolle’s worm’s-eye view never really grows old, even when he’s a fussbudget over counts of shuttered storefronts from year to year. At the same time, this intricate approach to an already small subject could easily undermine the ability for What Killed Downtown? to find a broad audience. What happens to a little-known suburban city can hardly resonate as much as if he had explored the devolution of downtown Philadelphia—or even Allentown or Erie. The fixation on downtown storefronts—at the expense of geographic context—firmly ensconces the book in the “local interest” category. His 250-page narrative rarely explores impacts on Norristown Main Street outside of Montgomery County. From an early point in the book, he describes street intersections with specificity that would only mean anything to a local; then he only provides two referential maps.

    None of these cavils really amount to an inherent weakness of the book—after all, it might prove just the right medicine for Tolle’s fellow Norristowners. But the narrowness of scope does foretell an oversight as to the broader implications for this city’s decline, which could have made for a much bolder peroration than the one the book currently provides. The only atypical bogeyman contributing to downtown Norristown’s precipitous decline is the persistent political gridlock and resultant incompetence of the Borough Council, which he relates with the same humanist eye he applies to his wonderful vignettes of immigrant entrepreneurialism. But Tolle had the chance to make this story matter on a scale that could mean something to someone from Ashtabula or Waukegan, and he spurned the opportunity.

    My knowledge of Philadelphia, having lived there for a time, gives me an unfair advantage, but I can’t help but ask a few questions. Norristown, the seat of wealthy Montgomery County, declined and its main street is moribund to this day. But Media, the much smaller seat of neighboring Delaware County, boasts a flourishing main street of local shops and restaurants—all despite the fact that Delaware County, while equally urbanized, is much less affluent than Montgomery County. Meanwhile, cities like Chester (also in Delaware County) and Camden, New Jersey can claim a similar lifespan to Norristown, strong transportation access, and an industrial boom. But today these two cities are not only among the most devastated municipalities in their respective states, Chester and Camden are among the poorest cities in the country. Perhaps most interestingly, after several decades of population decline, Norristown began to trend upward again in the 2000 census, and by the 2010 Census the city grew virtually 10%–an unprecedented occurrence for a city that still has the reputation of being the poorest place in its respective county.

    What Killed Downtown? remains a welcome contrast to countless other chronicles of downtown decline whose narratives depend on sociological detachment. Recognizing that true objectivity is impossible, Tolle instead depicts the Norristown transformation from the perspective of people who experienced it. Because its vision is geographically precise and obscure to people outside southeast Pennsylvania, I suspect our author felt driven to write it even if it enjoyed a readership of zero. Such an endeavor could reek of self-indulgence, but Michael Tolle’s opus has way too much empathy for that. Hopefully Norristown’s coterie of model train owners and newspaper collectors will put this book on their to-do lists—and then recommend it to others.

    Eric McAfee is a licensed urban planner currently working in emergency management. Though he hails from Indianapolis, his professional field grants him a certain degree of itinerancy, which he uses to his advantage to write about and photograph landscapes across the country in his blog, American Dirt. He lived and worked as a military planner in northern Afghanistan from 2010 to 2012, letting him fudge on the “American” aspect of his blog a little bit. In the past, Eric’s writing has won him Outstanding Paper in Real Estate at the University of Pennsylvania, as well as an outstanding research on housing award from the Joint Center for Housing Studies at Harvard University.  Aside from American Dirt, he has featured his writing on Urban Indy.com, Streetsblog.net, and Urbanophile.com. 

  • New Metropolitan Area Definition Winners: New York, Charlotte, Grand Rapids, and Indianapolis

    Metropolitan America continues to expand. The new Office of Management and Budget metropolitan area definitions, based upon the 2010 census indicate that the counties composing the 52 metropolitan areas with more than 1 million population increased by 1.65 million from the previous definition. This includes more than 1.4 million new residents in the previous 51 major metropolitan areas and more than 200,000 in Grand Rapids, which has become the nation’s 52nd metropolitan area with more than 1 million population.

    The fastest growers due to the addition of counties were New York, Charlotte, Grand Rapids, and Indianapolis. New York had a 670,000 increase in its metropolitan population, resulting from the addition of Dutchess and Orange counties. New counties also increased the population of the Charlotte metropolitan area by 459,000, the Grand Rapids metropolitan area by 215,000 and Indianapolis by 132,000. The largest percentage gains were in Grand Rapids (28%) and Charlotte (26%).

    Ten metropolitan areas had population increases under 100,000 from expansion of the metropolitan area definitions.

    For the most part, the major metropolitan area county components were unchanged, with 31 having the same boundaries as under the previous definition. Six metropolitan areas were reduced in geographic size.

    The changes in population for 2000 based upon the new metropolitan area definitions are indicated in the table. The components of metropolitan areas are determined by commuting patterns to urban areas (not to the historical core municipalities).

    Effect of New Metropolitan Area Geographic Definition on Population: 2010
    Population Change Rank Metropolitan Area Old Definition New Definition (2013) Change % Change
    12 Atlanta, GA        5,268,860        5,286,728 17,868 0.3%
    15 Austin, TX        1,716,289        1,716,289 0 0.0%
    15 Baltimore, MD        2,710,489        2,710,489 0 0.0%
    15 Birmingham, AL        1,128,047        1,128,047 0 0.0%
    15 Boston, MA-NH        4,552,402        4,552,402 0 0.0%
    15 Buffalo, NY        1,135,509        1,135,509 0 0.0%
    2 Charlotte, NC-SC        1,758,038        2,217,012 458,974 26.1%
    15 Chicago, IL-IN-WI        9,461,105        9,461,105 0 0.0%
    46 Cincinnati, OH-KY-IN        2,130,151        2,114,580 (15,571) -0.7%
    15 Cleveland, OH        2,077,240        2,077,240 0 0.0%
    7 Columbus, OH        1,836,536        1,901,974 65,438 3.6%
    8 Dallas-Fort Worth, TX        6,371,773        6,426,214 54,441 0.9%
    15 Denver, CO        2,543,482        2,543,482 0 0.0%
    15 Detroit,  MI        4,296,250        4,296,250 0 0.0%
    3 Grand Rapids, MI           774,160           988,938 214,778 27.7%
    15 Hartford, CT        1,212,381        1,212,381 0 0.0%
    49 Houston, TX        5,946,800        5,920,416 (26,384) -0.4%
    4 Indianapolis. IN        1,756,241        1,887,877 131,636 7.5%
    15 Jacksonville, FL        1,345,596        1,345,596 0 0.0%
    48 Kansas City, MO-KS        2,035,334        2,009,342 (25,992) -1.3%
    15 Las Vegas, NV        1,951,269        1,951,269 0 0.0%
    15 Los Angeles, CA     12,828,837     12,828,837 0 0.0%
    51 Louisville, KY-IN        1,283,566        1,235,708 (47,858) -3.7%
    13 Memphis, TN-MS-AR        1,316,100        1,324,829 8,729 0.7%
    15 Miami, FL        5,564,635        5,564,635 0 0.0%
    15 Milwaukee,WI        1,555,908        1,555,908 0 0.0%
    6 Minneapolis-St. Paul, MN-WI        3,279,833        3,348,859 69,026 2.1%
    5 Nashville, TN        1,589,934        1,670,890 80,956 5.1%
    11 New Orleans. LA        1,167,764        1,189,866 22,102 1.9%
    1 New York, NY-NJ-PA     18,897,109     19,567,410 670,301 3.5%
    15 Oklahoma City, OK        1,252,987        1,252,987 0 0.0%
    15 Orlando, FL        2,134,411        2,134,411 0 0.0%
    15 Philadelphia, PA-NJ-DE-MD        5,965,343        5,965,343 0 0.0%
    15 Phoenix, AZ        4,192,887        4,192,887 0 0.0%
    15 Pittsburgh, PA        2,356,285        2,356,285 0 0.0%
    15 Portland, OR-WA        2,226,009        2,226,009 0 0.0%
    15 Providence, RI-MA        1,600,852        1,600,852 0 0.0%
    15 Raleigh, NC        1,130,490        1,130,490 0 0.0%
    52 Richmond, VA        1,258,251        1,208,101 (50,150) -4.0%
    15 Riverside-San Bernardino, CA        4,224,851        4,224,851 0 0.0%
    10 Rochester, NY        1,054,323        1,079,671 25,348 2.4%
    15 Sacramento, CA        2,149,127        2,149,127 0 0.0%
    47 St. Louis,, MO-IL        2,812,896        2,787,701 (25,195) -0.9%
    50 Salt Lake City, UT        1,124,197        1,087,873 (36,324) -3.2%
    15 San Antonio, TX        2,142,508        2,142,508 0 0.0%
    15 San Diego, CA        3,095,313        3,095,313 0 0.0%
    15 San Francisco-Oakland, CA        4,335,391        4,335,391 0 0.0%
    15 San Jose, CA        1,836,911        1,836,911 0 0.0%
    15 Seattle, WA        3,439,809        3,439,809 0 0.0%
    15 Tampa-St. Petersburg, FL        2,783,243        2,783,243 0 0.0%
    14 Virginia Beach-Norfolk, VA-NC        1,671,683        1,676,822 5,139 0.3%
    9 Washington, DC-VA-MD-WV        5,582,170        5,636,232 54,062 1.0%
    Total   167,861,575   169,512,899    1,651,324 1.0%


  • Richard Florida Concedes the Limits of the Creative Class

    Among the most pervasive, and arguably pernicious, notions of the past decade has been that the “creative class” of the skilled, educated and hip would remake and revive American cities. The idea, packaged and peddled by consultant Richard Florida, had been that unlike spending public money to court Wall Street fat cats, corporate executives or other traditional elites, paying to appeal to the creative would truly trickle down, generating a widespread urban revival.

    Urbanists, journalists, and academics—not to mention big-city developers— were easily persuaded that shelling out to court “the hip and cool” would benefit everyone else, too. And Florida himself has prospered through books, articles, lectures, and university positions that have helped promote his ideas and brand and grow his Creative Class Group’s impressive client list, which in addition to big corporations and developers has included cities as diverse as Detroit and El Paso, Cleveland and Seattle.

    Well, oops.

    Florida himself, in his role as an editor at The Atlantic, admitted last month what his critics, including myself, have said for a decade: that the benefits of appealing to the creative class accrue largely to its members—and do little to make anyone else any better off. The rewards of the “creative class” strategy, he notes, “flow disproportionately to more highly-skilled knowledge, professional and creative workers,” since the wage increases that blue-collar and lower-skilled workers see “disappear when their higher housing costs are taken into account.” His reasonable and fairly brave, if belated, takeaway: “On close inspection, talent clustering provides little in the way of trickle-down benefits.”

    One group certain to be flustered by this new perspective will be many of the cities who have signed up and spent hard cash over the years to follow Florida’s prescription of focusing on those things—encouraging the arts and entertainment, building bike paths, welcoming minorities and gays—that would attract young college-educated workers. In his thesis, the model cities of the future are precisely those, such as San Francisco and Seattle, that have become hubs of highly educated migrants, technology, and high-end business services.

    That plan, though, has been less than successful in many of the old rust belt cities that once made up much of his client base. Perhaps even more galling to these cities, Florida has turned decidedly negative in his outlook on many of those cities—now looking remarkably gullible—that once made up much of his client base.

    The most risible example of this may have been former Michigan Jennifer Granholm’s “cool cities” campaign of the mid-oughts, that sought to cultivate the “creative class” by subsidizing the arts in Detroit and across the state. It didn’t exactly work. “You can put mag wheels on a Gremlin,” comments one long-time Michigan observer. “but that doesn’t make it a Mustang.”

    Alec MacGillis, writing at The American Prospect in 2009, noted that after collecting large fees from down-at-the-heels burgs like Cleveland, Toledo, Hartford, Rochester, and Elmira, New York over the years, Florida himself asserted that we can’t “stop the decline of some places” and urged the country to focus instead on his high-ranked “creative” enclaves. “So, got that, Rust Belt denizens?” MacGillis noted wryly in a follow-up story last year at the New Republic. Pack your bags for Boulder and Raleigh-Durham and Fairfax County. Oh, and thanks again for the check.”

    One key constituency advocating “creative class” oriented development has been the grandees of urban real estate. Albert Ratner of Cleveland-based Forest City Enterprises, a major urban developer with a taste for subsidies, in New York and elsewhere, suggests Florida’s ideas provides the “playbook for developers.”

    For Rust Belt cities, notes Cleveland’s Richey Piiparinen, following the “creative class” meme has not only meant wasted money, but wasted effort and misdirection. Burning money trying to become “cooler” ends up looking something like the metropolitan equivalent to a midlife crisis.

    It would have been far more sensible, Piiparinen suggests, for such areas to emphasize their intrinsic advantages, such as affordable housing, a deep historic legacy tied to a concentration of specific skills as well as a strategic location. He urges them to cultivate their essentially Rust-Belt authenticity rather than chase standard issue coolness promoted by big developers like Forest City. Focusing on attracting the “hip cool” single set, Piiparinen maintains, simply sets places like Cleveland up for failure.

    Geography of Hip Coolness

    Perhaps the best that can be said about the creative-class idea is that it follows a real, if overhyped, phenomenon: the movement of young, largely single, childless and sometimes gay people into urban neighborhoods. This Soho-ization—the transformation of older, often industrial urban areas into hip enclaves—is evident in scores of cities. It can legitimately can be credited for boosting real estate values from Williamsburg, Brooklyn, Wicker Park in Chicago and Belltown in Seattle to Portland’s Pearl District as well as much of San Francisco.

    Yet this footprint of such “cool” districts that appeal to largely childless, young urbanistas in the core is far smaller in most cities than commonly reported. Between 2000 and 2010, notes demographer Wendell Cox, the urban core areas of the 51 largest metropolitan areas—within two miles of the city’s center—added a total of 206,000 residents. But the surrounding rings, between two and five miles from the core, actually lost 272,000. In contrast to those small gains and losses, the suburban areas—between 10 and 20 miles from the center —experienced a growth of roughly 15 million people.

    The smallness of the potentially “hip” core is particularly pronounced in Rust Belt cities such as Cleveland and St. Louis, where these core districts are rarely home to more than 1 or 2 percent of the city’s shrinking population. Yet the subsidy money for developers is often justified in the name of “reviving” the entire city, most of which has continued to deteriorate.

    Nor has this dynamic changed since the onset of the Great Recession, as urban boosters such as Aaron Ehrenhalt have suggested. Ehrenhalt, citing the perceived preferences of millennials, envisions an urban future where more reject the suburban life, in part as a reaction to the wreckage of the last housing bust. To Ehrenhalt, places like downtown Chicago are emerging as the modern-day version of early-20th-century Vienna, central cores that attracted the elites while the working class and middle class dullards regress to the suburbs. Yet in reality, an examination of data between 2011 and 2012 by Jed Kolko at Trulia found despite a spike in downtown residents, population losses continue in surrounding close-in urban neighborhoods, while the fastest growth has continued to be located further out in the periphery.

    Class Politics in the “Creative Age”

    Investments in “cool” districts may well appeal to some young professionals, particularly before they get married and have children. But overall, as Florida himself now admits, it has done little overall for the urban middle class, much less the working class or the poor.

    Indeed in many ways the Floridian focus on industries like entertainment, software, and social media creates a distorted set of economic priorities. The creatives, after all, generally don’t work in factories or warehouses. So why assist these industries? Instead the trend is to declare good-paying blue collar professions a product of the past. If you can’t find work in deindustrialized Michigan, suggests Salon’s Ray Fisman, one can collect “ more than a few crumbs” by joining the service class and serving food, cutting hair or grass in creative capitals like San Francisco or Austin.

    These limitations of the “hip cool” strategy to drive broad-based economic growth have been evident for years. Conservative critics, such as the Manhattan Institute’s Steve Malanga have pointed out that many creative-class havens often underperform economically compared to their less hip counterparts. More liberal academic analysts have denounced the idea as “ exacerbating inequality and exclusion.” One particularly sharp critic, the University of British Columbia’s Jamie Peck see it as little more than a neo-liberal recipe of “biscotti and circuses.”

    Urban thinker Aaron Renn puts it in political terms: “the creative class doesn’t have much in the way of coattails.”

    Why Hipness Can’t Save New York

    The sad truth is that even in the more plausible “creative class” cities such as New York and San Francisco, the emphasis on “hip cool” and high-end service industries has corresponded with a decline in their middle class and a growing gap between rich and poor. Washington D.C. and San Francisco, perennial poster children for “cool cities,” also have among the highest percentages of poverty of any major urban center—roughly 20 percent—once cost of living is figured in.

    Nowhere are the limitations of coolness more evident than in New York, our country’s cultural capital and now one of Florida’s three residences, along with Toronto and Miami Beach. Manhattan suffers by far the highest level of inequality among the country’s 25 most populous counties, a gap between rich and poor that’s the widest it’s been in a decade. New York’s wealthiest one percent earns a third of the entire city’s personal income—almost twice the proportion for the rest of the country.

    This geography of inequality is now extending to the outer boroughs. In nouveau hipster and increasingly expensive Brooklyn, nearly a quarter of people live below the poverty line. While artisanal cheese shops and bars that double as flower shops serve the hipsters, one in four Brooklynites receives food stamps. New York has seen the nation’s biggest rise in homelessness; the number of children sleeping in the shelters of Mike Bloomberg’s “luxury city” has risen 22 percent in the past year.

    The Issue of Race

    On paper, the “creative class” theory worships at the altar of diversity. “The great thing about cities,” Florida told NPR last year, “is they’re diverse. There’s diverse people in them.” Yet even leaving aside their lack of economic diversity, the exemplars of “hip cool” world, notes urban analyst Renn, tend to be vanilla cities with relatively small minority populations. San Francisco, Portland and Seattle are becoming whiter and less ethnically diverse as the rest of the country, and particularly the suburbs, rapidly diversify.

    Creatives may espouse politically correct views, but the effect of Florida’s policy approach, notes Tulane sociologist Richard Campanella, often undermine ethnic communities. As they enter the city, creatives push up rents, displacing local stores and residents. In his own neighborhood of Bywater, in New Orleans, the black population declined by 64 percent between 2000 and 2010, while the white population increased by 22 percent.

    In the process, Campanella notes, much of what made the neighborhood unique has been lost as the creatives replace the local culture with the increasingly predictable, and portable, “hip cool” trendy restaurants, offering beet-filled ravioli instead of fried okra, and organic markets. The “unique” amenities you find now, even in New Orleans, he reports, are much what you’d expect in any other hipster paradise, be it Portland, Seattle, Burlington, Vermont or Williamsburg.

    Families and the Future

    Campanella also suggests another byproduct of hipster gentrification: a dearth of families. Ten years ago his increasingly “creative class” neighborhood of Bywater was family oriented. Now, it’s “a kiddie wilderness.” In 2000, 968 youngsters lived in the district. Just 10 years later, the number had dropped by 70 percent, to 285. When his son was born in 2012, it was the first post-Katrina birth on his street, the sole child on a block that had 11 when he first arrived from Mississippi in 2000.

    Unsurprisingly, there’s not much emphasis about families in Florida’s work, in part because his basic theory puts focuses largely on groups like singles, childless young professionals and gays. He largely discounts suburbs, generally the nation’s nurseries, as outdated for the “creative age” and considers homeownership and single family houses, also vastly preferred by families, as fundamentally passé.

    Indeed, the places that most attract “the creative class” are also the ones with the fewest families and children, led by San Francisco, Seattle, Manhattan, and rapidly gentrifying Washington, D.C. The very high prices per square foot, understandably celebrated by urban real estate boosters, have made it hard not only on the poor but on middle- and even upper-middle-class families. When you have children, you often have to let go of your bohemian fantasies; it’s hard to imagine being a parent in a place like San Francisco where there are a raging debates about the right of people to walk around naked.

    The Real Geography of Opportunity

    To be sure, the leading “creative class” cities have much to recommend them, and some of them, such as Portland and Boston, have registered impressive rises in their per capita income in recent years. But over the past decade, most “cool cities” have not been enjoying particularly strong employment or population growth; in the last decade, the populations of cities like Charlotte, Houston, Atlanta, and Nashville grew by 20 percent or more, at least four times as rapidly as New York, Los Angeles, San Francisco, or Chicago. This trend toward less dense, more affordable cities is as evident in the most recent census numbers than a decade.

    One reason for this: the fastest job growth has taken place in regions—Houston, Dallas, Oklahoma City, Omaha—whose economies are based not on “creative” industries but on less fashionable pursuits such as oil and gas, agriculture and manufacturing. Energy mecca Houston, for example, last year enjoyed the largest GDP growth of any major American city, easily outpacing “creative” urbanist favorites like Chicago, New York, San Francisco, or Boston. The other two top GDP gainers were Dallas-Fort Worth and, surprisingly, Detroit, largely as a result of the auto industry’s comeback.

    Of course, some these ascendant cities now are sprouting their own “hip” neighborhoods. But these regions also accommodate far faster growth in rapidly expanding, family-friendly suburbs and exurbs. Equally important, none, including “creative class” hotspots Raleigh and Austin, are dense, transit-centered places of the kind urbanists suggest create economic vibrancy and attract the largest number of migrations.

    In fact both Raleigh and Austin are both very low-density regions with only compact urban pockets surrounded by vast suburban communities. Take a walk in downtown Raleigh sometime; about five minutes from the densest central areas and you find yourself on tree-lined streets with nice single-family houses, essentially, older suburbs. Austin, too, is a relatively low-density place surrounded by the kind of suburban sprawl detested by Floridians; this is also the case with Charlotte, Atlanta, and other fast-growing cities.

    These facts, of course, are unlikely to interfere with the self-interested lobbying by large developers for subsidies for downtown development much less the defined prejudices of the urban-centric media. But contrary to the narrative espoused by Florida and other proponents of high-density cities, the predominant future urban form in America is emerging  (largely unrecognized to the media) elsewhere, in places less dense, economically diverse and, perhaps, just a bit less hip and cool.

    Joel Kotkin is executive editor of NewGeography.com and a distinguished presidential fellow in urban futures at Chapman University, and a member of the editorial board of the Orange County Register. He is author of The City: A Global History and The Next Hundred Million: America in 2050. His most recent study, The Rise of Postfamilialism, has been widely discussed and distributed internationally. He lives in Los Angeles, CA.

    This piece originally appeared in the The Daily Beast.

    Seattle photo by Bigstock.

  • Sydney to Abandon Radical Urban Containment Policy

    The New South Wales government has proposed a new Metropolitan Strategy for the Sydney area which would significantly weaken the urban containment policy (also called urban consolidation, smart growth, livability, growth management, densification, etc.) that has driven if house prices to among the highest in the affluent New World (Australia, Canada, New Zealand and the United States) relative to household incomes.

    According to the Australian Financial Review, the state’s Liberal-National government plans to allow the building of more than 170,000 new homes, with the vast majority being on greenfield sites, largely beyond the current urban footprint. Premier Barry O’Farrell and his party had promised in their electoral campaign in 2011 to liberalize land-use regulation and to moderate the previous Labor government’s quota that required 70% of new houses to be built within the current urban footprint and 30% on greenfield sites. In fact, however, under the Labor government’s administration, new house building had been produced at a well below demand level.

    Among the major New World metropolitan areas rated in annual Demographia International Housing Affordability Surveys, Sydney has been the most unaffordable, along with Vancouver, in recent years. Sydney and Vancouver have had among the most stringent urban containment policies in the New World, and the resulting unaffordable house prices under such circumstances are consistent with economic principle.

    Premier O’Farrell told the Sydney Morning Herald that the government wanted to "make home ownership a reality again." He continued, "The more blocks of land (lots) we can release, the greater downward pressure we can put on housing because it’s been so high for so long." In a press release issued by his office, the Premier recalled that “Before the election, I said I wanted to ensure owning a home wasn’t a fading dream for young families" and noted that the massive housing package "will go a long way to delivering on that commitment."

    In the longer run (by 2031), the government intends to provide for a total of 545,000 new homes, while abandoning the practice of allocating locations based upon planning theory. Planning and Infrastructure Minister Bradley Hazzard told the Sydney Morning Herald that the government intended to “look further afield” than the presently planned greenfield suburban growth centers. He continued: "We’re trying to [be] less constrictive and restrictive and what we’re saying is the marketplace should have far more of a say in what the mix of housing is and where it should be,” adding that ”it doesn’t matter” what percentage was delivered in greenfield and established suburbs. He concluded: ”No one should be preoccupied by particular prescriptive formulas.”

    The government also indicated its intention to encourage one half of employment growth over the next 20 years to be in Western Sydney. Western Sydney is virtually across the urban area from the central business district. This dispersion of employment, along with roadway improvements in the area, is likely to improve the metropolitan balance between jobs and housing.

    The plan for greater job dispersion would, if successful, bring Sydney more into line with urban best practices, which are exhibited by the location of most new jobs in edge cities, as well as throughout the entire urban area. Sydney has among the longest work trip travel times in the New World. The one-way work trip travel time is newly reported in the Metropolitan Strategy to have reached 35 minutes. Work trip travel times are worse only in Melbourne, at 36 minutes. By comparison, Dallas-Fort Worth, with a larger population, a much lower urban area density and a mere fraction of the Melbourne or Sydney transit work trip market share has a far shorter one-way work trip travel time (26 minutes).

    The Sydney developments are the latest in a trend toward liberalizing urban land use in four nations.

    In October, the New Zealand government announced plans to liberalize land-use amid growing concern about the extent to which that nation’s urban containment policies have destroyed housing affordability. In the introduction to the 9th Annual Demographia International Housing Affordability Survey, Deputy Premier Bill English said:

    Land has been made artificially scarce by regulation that locks up land for development. This regulation has made land supply unresponsive to demand. When demand shocks occur, as they did in the mid-2000s in New Zealand and around the world, much of that shock translates to higher prices rather than more houses.

    Recent polling has shown support, by an almost 2 to 1 margin for government action to improve housing affordability, with even higher stronger support in the 18 to 34 age group, where the margin was more than 3 to 1.

    The United Kingdom Cameron government is also embarked on a program to liberalize that nation’s restrictive land use policies, which former Bank of England Monetary Policy Committee member Kate Barker found to be the cause of severe housing unaffordability in a report commissioned by the Blair Labour government. Planning Minister Nick Boles has characterized the unaffordability of housing as "the biggest social justice problem we have."

    In 2011, Florida repealed its statewide smart growth mandate and closed the administrative bureaucracy that had overseen the program. Before that, the government of the Australian state of Victoria substantially expanded the urban growth boundary of the Melbourne urban area.

  • America’s Fastest- and Slowest-Growing Cities

    Since the housing crash of 2007, the decline of the Sun Belt and dispersed, low-density cities has been trumpeted by the national media and by pundits who believe America’s future lies in compact, crowded, mostly coastal and northern, cities. But apparently, most Americans have not gotten the memo — they seem to be accelerating their push into less dense regions of the Sun Belt.

    An analysis of population data by demographer Wendell Cox, including the Census report for the most recent year released late last week, shows that since 2000, virtually all the 10 fastest-growing metropolitan areas in the United States are located in Sun Belt states. The population of the Raleigh, N.C., metropolitan statistical area has expanded a remarkable 47.8% since 2000, tops among the nation’s 52 metro areas with over 1 million residents. That is more than three times the overall 12.7% growth of those 52 metro areas.

    Austin, Texas, and Las Vegas also expanded more than 40%, putting them second and third on our list. The populations of the other metro areas in the top 10 all expanded by at least 25%, or twice the national average. This jibes nicely with domestic migration trends and growth in the foreign-born population, both of which have been strongest in many of these same cities.

    The most recent numbers, covering July 2011 to July 2012, also reveal some subtle changes in the Sun Belt pecking order. Over the 2000-2012 period, the growth winners   included places like Las Vegas, Riverside-San Bernardino and Phoenix, all of which suffered grievously in the housing bust. Although they all clocked population growth better than the national average over the past year, none, besides Phoenix, ranked in the updated top 10.

    Growth momentum has shifted decidedly toward Texas. Austin’s population expanded a remarkable 3% last year, tops among the nation’s 52 largest metro areas. Three other Lone Star metropolitan areas — Houston, San Antonio and Dallas-Ft. Worth — ranked in the top six and all expanded at roughly twice the national average. The other fastest-growing metros over the past year include Raleigh, Orlando, Phoenix, Charlotte and Nashville. One unexpected fast-growth area has been Oklahoma City, which ranked 20th between 2000 and 2012, but notched the 12th spot last year, with a growth rate 60% above the national average.

    What explains these subtle shifts? Some of it can be traced, of course, to the stronger growth in energy-rich areas such as Texas as well as Oklahoma City. The differences are particularly striking when looking at varying economic growth rates among the country’s largest regions. In 2011 the Houston metro area, whose population is up by 1.4 million since 2000, also enjoyed the fastest GDP growth, at 3.7%, of any of the nation’s top 20 regions. Dallas-Fort Worth clocked a respectable 3.1%.

    In contrast, the GDP growth rates for the hip, dense metro areas lagged behind. Among the elite cities, the tech hubs of San Francisco , Seattle and Boston have done the best, posting GDP growth around 2.5%. But the economies of New York, Los Angeles, Philadelphia and, surprisingly, Washington D.C., grew at roughly half the rate of Houston.

    But it’s not just economic factors at play. One remarkable similarity in all the fastest-growing areas is their relatively low population densities. Although Raleigh and Austin are held out as “hip” cities, they have very low-density urban cores. Not one of the top 10 growth cities for 2010 to the present, or last year, had urban core densities more than a half of those of places like Boston (40th for 2000 to the present), New York (41st),  Los Angeles (42nd) or Chicago (43rd).

    At the same time, we have to consider the issue of housing affordability, something that rarely comes up among proponents of “cool” cities. In contrast to slower-growing San Francisco, New York and Los Angeles, most of the fastest-growing cities have lower housing prices relative to income. Particularly notable are the low prices in areas such as Austin, Raleigh, Houston and Dallas-Fort Worth, where housing costs are half or less than in the more highly regulated “cool” cities.

    Lower housing costs also seem to impact another critical growth component: family formation. Immigrants and domestic in-migrants are important to population growth but equally critical is whether longtime residents in a region choose to have children. Virtually all the top 10 metro areas, both last year and since 2000, have also ranked among the fastest growing in terms of the population under 15; Raleigh’s child population alone has expanded by almost 45% since 2000, compared to 2% nationally;  Austin’s toddler population surged a remarkable, 38%. The child populations of Houston, Dallas-Fort Worth, Atlanta, Phoenix, Las Vegas and Orlando all  increased by 20% or more.

    In contrast, none of the hip cities posted under 15 population growth better than 5%. The number of children has actually declined in many, including New York, Los Angeles, Boston, San Francisco and Chicago. Even with substantial influxes from abroad, particularly in New York, it’s difficult for these areas to sustain population increases when the number of children keeps dropping.

    The problem may be even more intense in Los Angeles and Chicago, whose economies continue to lag further behind. But the demographic challenges of the Big Orange and the Windy City pale compared to those faced by many cities in the old industrial Rust Belt, which have either lost population or posted only weak increases.

    Cleveland’s population is down 3.9% since 2000, the worst performance among the nation’s biggest metro areas apart from disaster-struck New Orleans. Cleveland lags in both family formation and has seen strong outmigration, but also attracts few foreign-born residents. Much the same can be said of Providence, R.I., Pittsburgh, Buffalo and Detroit. Nor do things seem to be improving with time; these areas continued to inhabit the nether regions in the most recent Census reports.

    So what do these trends tell us about the demographic evolution of our major metropolitan areas? Certainly sustained economic growth, low density and more affordable housing all clearly continue to push the center of population gravity toward certain Sun Belt cities, primarily in the Southeast and Texas. It turns out that neither the Great Recession, the housing bust or a much hyped preference for dense urbanity is turning this around.

    Major Metropolitan Areas (Over 1,000,000) Population
    Ranked by Population Change Percentage: 2000-2012 (2013 Geography)
    Rank Metropolitan Area 2000 2012 2000-2012 Growth 2000-2012 % 2011-2012 %
    1 Raleigh, NC           804,436        1,188,564        384,128 47.8% 3.3%
    2 Austin, TX        1,265,715        1,834,303        568,588 44.9% 3.1%
    3 Las Vegas, NV        1,393,370        2,000,759        607,389 43.6% 3.1%
    4 Orlando, FL        1,656,835        2,223,674        566,839 34.2% 2.5%
    5 Charlotte, NC-SC        1,729,023        2,296,569        567,546 32.8% 2.4%
    6 Riverside-San Bernardino, CA        3,277,578        4,350,096     1,072,518 32.7% 2.4%
    7 Phoenix, AZ        3,278,661        4,329,534     1,050,873 32.1% 2.3%
    8 Houston, TX        4,716,964        6,177,035     1,460,071 31.0% 2.3%
    9 San Antonio, TX        1,719,262        2,234,003        514,741 29.9% 2.2%
    10 Dallas-Fort Worth, TX        5,239,149        6,700,991     1,461,842 27.9% 2.1%
    11 Atlanta, GA        4,297,419        5,457,831     1,160,412 27.0% 2.0%
    12 Nashville, TN        1,387,274        1,726,693        339,419 24.5% 1.8%
    13 Jacksonville, FL        1,126,224        1,377,850        251,626 22.3% 1.7%
    14 Sacramento, CA        1,808,442        2,196,482        388,040 21.5% 1.6%
    15 Denver, CO        2,194,022        2,645,209        451,187 20.6% 1.6%
    16 Washington, DC-VA-MD-WV        4,862,582        5,860,342        997,760 20.5% 1.6%
    17 Salt Lake City, UT           942,666        1,123,712        181,046 19.2% 1.5%
    18 Portland, OR-WA        1,936,108        2,289,800        353,692 18.3% 1.4%
    19 Tampa-St. Petersburg, FL        2,404,273        2,842,878        438,605 18.2% 1.4%
    20 Oklahoma City, OK        1,097,874        1,296,565        198,691 18.1% 1.4%
    21 Seattle, WA        3,052,379        3,552,157        499,778 16.4% 1.3%
    22 Richmond, VA        1,058,816        1,231,980        173,164 16.4% 1.3%
    23 Indianapolis. IN        1,664,431        1,928,982        264,551 15.9% 1.2%
    24 Columbus, OH        1,681,865        1,944,002        262,137 15.6% 1.2%
    25 Miami, FL        5,025,806        5,762,717        736,911 14.7% 1.1%
    26 San Diego, CA        2,824,987        3,177,063        352,076 12.5% 1.0%
    27 Minneapolis-St. Paul, MN-WI        3,044,901        3,422,264        377,363 12.4% 1.0%
    28 Kansas City, MO-KS        1,818,073        2,038,724        220,651 12.1% 1.0%
    29 Louisville, KY-IN        1,123,966        1,251,351        127,385 11.3% 0.9%
    30 Memphis, TN-MS-AR        1,216,293        1,341,690        125,397 10.3% 0.8%
    31 San Jose, CA        1,739,669        1,894,388        154,719 8.9% 0.7%
    32 Birmingham, AL        1,053,394        1,136,650          83,256 7.9% 0.6%
    33 San Francisco-Oakland, CA        4,136,658        4,455,560        318,902 7.7% 0.6%
    34 Baltimore, MD        2,557,501        2,753,149        195,648 7.6% 0.6%
    35 Grand Rapids, MI           934,388        1,005,648          71,260 7.6% 0.6%
    36 Virginia Beach-Norfolk, VA-NC        1,584,042        1,699,925        115,883 7.3% 0.6%
    37 Cincinnati, OH-KY-IN        1,999,787        2,128,603        128,816 6.4% 0.5%
    38 Philadelphia, PA-NJ-DE-MD        5,693,275        6,018,800        325,525 5.7% 0.5%
    39 Hartford, CT        1,150,915        1,214,400          63,485 5.5% 0.4%
    40 Boston, MA-NH        4,402,611        4,640,802        238,191 5.4% 0.4%
    41 Los Angeles, CA      12,398,950      13,052,921        653,971 5.3% 0.4%
    42 New York, NY-NJ-PA      18,976,899      19,831,858        854,959 4.5% 0.4%
    43 Chicago, IL-IN-WI        9,117,732        9,522,434        404,702 4.4% 0.4%
    44 St. Louis,, MO-IL        2,678,224        2,795,794        117,570 4.4% 0.4%
    45 Milwaukee,WI        1,502,305        1,566,981          64,676 4.3% 0.4%
    46 Rochester, NY        1,066,335        1,082,284          15,949 1.5% 0.1%
    47 Providence, RI-MA        1,586,744        1,601,374          14,630 0.9% 0.1%
    48 Pittsburgh, PA        2,429,023        2,360,733        (68,290) -2.8% -0.2%
    49 Buffalo, NY        1,169,159        1,134,210        (34,949) -3.0% -0.3%
    50 Detroit,  MI        4,457,471        4,292,060      (165,411) -3.7% -0.3%
    51 Cleveland, OH        2,147,948        2,063,535        (84,413) -3.9% -0.3%
    52 New Orleans. LA        1,336,795        1,227,096      (109,699) -8.2% -0.7%

    Analysis by Wendell Cox, Demographia

    Joel Kotkin is executive editor of NewGeography.com and a distinguished presidential fellow in urban futures at Chapman University, and a member of the editorial board of the Orange County Register. He is author of The City: A Global History and The Next Hundred Million: America in 2050. His most recent study, The Rise of Postfamilialism, has been widely discussed and distributed internationally. He lives in Los Angeles, CA.

    This piece originally appeared at Forbes.com.

  • Wanted: A Reasoned Approach to Dealing with America’s Infrastructure Needs

    It seems like not a week goes by without fresh warnings about the nation’s”crumbling infrastructure" and renewed appeals to rebuild our aging highways and bridges.  President Obama reinvigorated the campaign with his State-of-the-Union proposal for a $50 billion program of infrastructure investments, $40 billion of which would be devoted to a "fix-it-first" program targeted at urgent improvements such as "structurally deficient" bridges. The following day, the House Committee on Transportation and Infrastructure held a hearing on "The Federal Role in America’s Infrastructure," focusing on the importance of infrastructure for the U.S. economy and the federal role in its preservation and expansion. The same day, the U.S. Chamber held a "Transportation Infrastructure Summit," a day-long gathering to explore "transportation infrastructure challenges and promising solutions" with prominent industry representatives. Yet another meeting, this one convened by Rep. Rosa DeLauro (D-NY), a longtime proponent of a National Infrastructure Bank, will explore innovative strategies for financing infrastructure in a March 18 forum on Capitol Hill.

    Two recent reports have added to a sense of urgency about America’s deteriorating infrastructure. The Building America’s Future coalition has published a report, Falling Apart and Falling Behind, urging development of a long-term national infrastructure strategy, establishing a National Infrastructure Bank and lifting restrictions on tolling. The American Society of Civil Engineers (ASCE) has released a report, Failure to Act: The Impact of Current Infrastructure Investment on America’s Future, warning that if the investment gap is not addressed, the economy is likely to suffer $1 trillion in lost business and a loss of 3.5 million jobs.  ASCE’s 2013 Report Card for America’s Infrastructure, a detailed analysis of the performance and condition of America’s infrastructure  to be  released on March 19, may be expected to reinforce this gloomy forecast (a previous  "report card," issued in 2009, gave the U.S. infrastructure an unflattering grade of D.)     

    What kind of impact this flood of warnings and advocacy efforts will have on public opinion and on congressional attitudes and fiscal decisions remains to be seen. They come at a time of severe budget pressures and intense Republican efforts to curb excessive discretionary spending. To be successful, the pro-infrastructure campaign must persuade fiscally conservative lawmakers that there are urgent reasons for a boost in spending on public works that override the imperative to reduce the deficit and get the nation’s fiscal house in order. 

    Further, infrastructure advocates must convince the nation’s  taxpayers— who see no visible signs of  "crumbling infrastructure"— that spending more  on transportation will not be wasted but will result in concrete benefits in the form of reduced congestion or shorter commutes. Infrastructure alarmists also must contend with a public that lately has grown skeptical about warnings of catastrophic consequences of minor cuts in spending.  

    Lastly, the advocacy campaign must overcome a cynical perception that pressures to increase funding for transportation are nothing more than special interest pleadings of interest groups that stand to profit from higher levels of public spending.  As one transportation advocate at a recent conference observed, "there is an enormous disconnect between us and the American public" — a disconnect that may not be easy to overcome.

    Significantly, improving the nation’s infrastructure was not a topic of discussion at the President’s meeting with Senate Republicans, according to Sens. Roger Wicker (R-MS) and Orrin Hatch (R-UT), as reported in POLITICO.  The President must have come to a conclusion that his $50 billion infrastructure plan stands no chance of winning a favorable Senate vote —not to mention being an anathema with the House Republicans.

    A Reasoned Approach

    No one disputes the infrastructure advocates’ claim that some of America’s transportation facilities are reaching the limit of their useful life and need replacing. Nor does anyone disagree about the need to expand infrastructure to meet the needs of a growing population. But fiscal conservatives among these advocates (and we count ourselves among them) contend that this does not rise to the level of a national crisis requiring a $50 billion crash program as proposed by the President, or a two trillion dollar infrastructure investment program over fifteen years as recommended  by ASCE . 

    The condition of infrastructure varies widely from state to state as studies by the transportation research group TRIP and by the Reason Foundation have shown. Most states maintain their transportation assets in a state of good repair and only a few need extensive modernization. "There are still plenty of problems to fix, but our roads and bridges aren’t cumbling," said David Hartgen, lead author of the Reason study. "The overall condition of the public road system is getting better and you can actually make the case that it has never been in better shape." Hartgen’s conclusion is backed by a detailed study of the condition of America’s roads and bridges. The study is based on a variety of sources, primarily from the states themselves as reported to the federal government from 1989 through 2008. ( "Are Highways Crumbling? State and U.S. Highway Performance Trends, 1989-2008, Reason Policy Study 407, February 2013).

    The generally acceptable condition of the nation’s transportation infrastructure in most places, argues for a more selective approach. Rather than launching a new massive national public works program in the name of "fix-it-first," state-level efforts should be targeted specifically at aging facilities that are in a demonstrable need of replacement or modernization.  "The nation simply cannot afford blindly to throw money at the problem," in the words of one senior congressional Republican. "We have learned from the Administration’s $8 billion high-speed rail fiasco that scattering resources in an unfocused manner in order to satisfy demands for geographic equity, leads to imprudent, irresponsible and often downright wasteful spending."     

    To the extent that large-scale multi-year megaprojects demanding billions of dollars still figure on the drawing boards of state DOTs,  they can—indeed, they will —be financed through public-private partnerships, tolling and credit instruments such as TIFIA and state infrastructure banks. They include the I-495 Beltway Hot lanes project in Virginia, New York’s Tappan Zee Bridge replacement, the San Francisco Bay Bridge Eastern Span replacement, the I-5 Columbia River Crossing, the Highway 520 floating bridge in Seattle, the Miami Port Tunnel, the Midtown Tunnel linking Norfolk and Portsmouth VA, and two Ohio River bridges in Louisville, a joint undertaking of the Indiana and Kentucky DOTs. All of the above projects will be financed with long-term obligations rather than funded on a pay-as-you-go basis through annual congressional appropriations.

    A transition from funding to financing of major transportation infrastructure projects was also the preferred approach of the financial practitioners and analysts assembled at the October 2012 conference on Public-Private Partnerships convened by the American Road and Transportation Builders Association (ARTBA). The most practical way to build future transportation megaprojects, these experts concluded, will be through project financing and public-private partnerships.

    In sum, the Highway Trust Fund no longer can serve as a source of capital for new infrastructure, and funding large capital-intensive projects with current user fee revenues on a pay-as-you-go basis is no longer feasible. Instead, look for the states to assume responsibility for remedial "fix-it-first" activities, and for a shift from funding to financing for multi-year construction megaprojects. This may turn out to be the only practical long-term solution to our transportation funding dilemma.

  • California Needs More Immigrants

    Southern California, just a few decades ago the fastest-growing region in the high-income world, is hitting a demographic tipping point. With a decade or more of domestic out-migration and a sharp fall in immigration, the region is morphing from a destination that attracts dreamers and builders into a place increasingly dominated by those born or bred here.

    To some demographers, this transition from a magnet for migrants to a more native-born population represents something of a boon. As for migrants, one USC demographer wrote that California acts like "a gold pan that sifts through aspiring talent and keeps the best." Our new steady state is a good thing, the argument goes, since it offers a respite from the travails of rapid growth. All we need to focus on is spending more money on schools, and, not surprisingly, universities, and everything will turn out alright.

    There may be some truth to all these points, but, historically, a decline in new migration also suggests something else: a picture oddly reminiscent of the kind of demographic stagnation long associated with places like Cleveland, Buffalo, N.Y., Pittsburgh and Detroit. A more native-dominated region may be both more socially stable but increasingly hidebound and lacking innovation.

    For cities, demographic stagnation is not a recipe for success. Over the past decade, notes demographer Wendell Cox, the Los Angeles-Orange County area has seen the fifth-highest growth in the percentage of locally born people in its population, among nation’s 51 largest metropolitan areas. The concern is not so much that people are leaving these places in droves; the real issue is that not enough new people, with new ideas and great ambition, are coming in.

    Already, notes economist Bill Watkins, large parts of the state, particularly along the coast, are evolving into "geriatric ghettos" populated by aging, often-affluent baby boomers. And, as for keeping the "best," the steady decline in California’s relative educational ranking, particularly in the younger cohorts, should convince us that we cannot reasonably rely on native-born residents to meet the challenges of the future.

    Domestic Outmigration

    Watkins also points out that California has been losing domestic migrants for 10 of the past 15 years. It’s been worse in this region; over the past decade the Los Angeles-Orange County area suffered the third-highest rate in the country of net outmigration, slightly above New York’s. Amazingly, on a per capita basis, people are leaving our sun-drenched metropolis more rapidly than from Rust Belt disaster areas such as Cleveland and Detroit.

    In recent decades, this shortfall has been more than made up by foreign immigration. But in a stunning reversal of the trends in past decades, the number of foreign-born in our region has started to stagnate. Indeed, over the most-recent decade, the Southland has experienced the slowest rate of growth in its foreign-born population of any major region in the country. Los Angeles-Orange County gained 110,000 immigrants over the decade, one-sixth as many as New York City and only a quarter as many as Houston. Our immigrant population has grown less than that of much smaller regions such as Minneapolis-St. Paul, Austin, Texas, Atlanta and Dallas-Fort Worth.

    These patterns suggest a dangerous shift in our demographic DNA and a decline in our historic archetype as one of the world’s most culturally and economically innovative regions. Throughout history, the movement of newcomers has accented the rise of great cities at their peak, from ancient Athens, Rome and Baghdad to early 20th century London, Berlin, New York and Chicago. Similarly, the ascendency of the great cities of modern Asia – from Tokyo to Shanghai to Hong Kong and Singapore – resulted from mass migration, usually from the countryside to the urban centers.

    Pioneering Migrants

    Southern California’s evolution into one of the world’s premier urban regions has been, for the most part, propelled by outsiders, people who came to this place in search of a better life. Starting in the 1880s, these tended to be other Americans, including Los Angeles Times publisher Harrison Gray Otis (Marietta, Ohio), and railway magnate Henry Huntington (Oneonta, N.Y.), and, later, Walt Disney (Kansas City, Mo.), Howard Ahmanson Sr. (Omaha, Neb.) and Dr. Jerry Buss (Kemmerer, Wyo.).

    For such newcomers – including James Irvine, a native of Ireland – Southern California provided an opportunity to create new things of every type. Everything distinctive developed in Southern California was created largely by outsiders. The creators of the movie business were mostly Jews from Eastern Europe, while the aerospace industry was largely populated by Midwestern emigres. Even the people who built our cities came from elsewhere. Consider Ahmanson, who funded much of it. Developers like Eli Broad, a native of Detroit, or Nathan Shapell, a holocaust survivor from Poland, built many of the region’s suburban communities.

    In recent decades, L.A.’s outsiders have come increasingly from abroad. Most have come from Mexico and Asia, but also from the Middle East, the former Soviet Union and, increasingly, Africa. Their influence is everywhere, from the food trucks to the ethnic malls, at the universities and in the music scene. A large number of the smaller banks in the region are tied to immigrant communities.

    Nowhere is the influence greater than in the entrepreneurial arena. In the 1980s and 1990s, when Los Angeles-Long Beach frequently led in new immigration, newcomers from abroad fueled the rise of industries from garments to international trade and food processing. They are the primary creators of our food truck culture and often the chefs and owners of our finest restaurants.

    Business Starters

    Simply put, immigrants provided the critical oxygen for our economy, which, as a group, they are still doing. Even in the midst of the recession, newcomers continued to form businesses at a record rate, while the start-up rate for native-born entrepreneurs declined. The immigrant share of new businesses, notes a Kauffman Foundation survey, more than doubled, from 13.4 percent in 1996 to 29.5 percent, in 2010.

    Nationally, immigrants are responsible for roughly a quarter of all high-tech start-ups. Asians, who constitute more than 40 percent of newcomers, now account for roughly 20 percent of tech workers, four times their percentage of the population.

    How much is this dynamism, which once blessed the Southland, is now heading to Houston, Dallas-Fort Worth or even Charlotte, N.C.? It seems likely that, without the economic push from the immigrants and their countries, the reinvention of our economy will be far slower. Southern California natives seem far less likely to take the risks, and create the new industries, the region desperately needs.

    Regaining our allure to newcomers is now arguably our biggest challenge. We have some fine assets, such as great weather, universities and a strong entrepreneurial legacy. Critically, despite the stagnant past decade, the Los Angeles-Orange County region still remains the second-largest repository of immigrants, at 4.4 million, behind only the greater New York area’s 5.5 million. Virtually any ethnic group can find schools, shops and banks tied to their home countries; for some, like Chinese, Vietnamese, Mexicans and Iranians, Southern California remains a critical ethnic bastion and beacon.

    Shift Focus

    In this process, immigration reform could prove helpful, although most attention has been paid to legalizing undocumented immigrants already in the country. This may well be justified on moral ground but, in some ways, that debate is fighting the last war, as the flow of illegal immigration from Mexico has slowed, and may even be reversing. Legal immigration from Mexico also has declined markedly in recent years.

    A far more strategic concern would be easing the flow of Asian immigrants, who, according to a recent Pew study, are generally better educated and affluent than other newcomers. Asian immigrants are also more likely to start business; a 2012 Kauffman study notes that close to 40 percent of immigrant entrepreneurs come from India or China. We should be looking to capture all such skilled and entrepreneurial newcomers, from any country and, hopefully, also from within this country.

    To accomplish this we need to convince prospective migrants that this region, for all its faults, deserves to become, once again, a preferred destination for ambitious outsiders. It’s a task that our local leaders, both in the business world and government, need to take seriously, rather than take comfort in the prospect of a more stable, and fundamentally stagnant, demographic future.

    Joel Kotkin is executive editor of NewGeography.com and a distinguished presidential fellow in urban futures at Chapman University, and a member of the editorial board of the Orange County Register. He is author of The City: A Global History and The Next Hundred Million: America in 2050. His most recent study, The Rise of Postfamilialism, has been widely discussed and distributed internationally. He lives in Los Angeles, CA.

    This piece originally appeared in the Orange County Register.

    Photo by telwink