Blog

  • Britain’s Housing Crisis: The Places People Live

    For twenty years British house building has fallen behind demand, forcing up prices and rents. Here’s a series of photos showing some of the things people have had to do to live.

    Victoria Campbell was living in a shed in her parents’ garden in Havant, while she and her fiance saved up for a deposit, but the Council has told her that she has to move out.


    This family in Plashet Park have been living in a shed for some time.


    In East London, council officers are going checking out garden sheds to make sure that they are not being rented out, as they check too to see if houses are over-occupied.

    In Caledonian Road, super-exploiting landlord Andrew Panayi converted unprofitable shops into money-making flats, and decided to convert their cellars into more flats.


    This is the flats’ skylight, outside.


    This is the passage and stairway down to the flats.


    This is the underground landing with the flats’ front doors.


    And this is the interior.

    These garden sheds in Southall have been turned into homes, and ones like them are rented out to labourers.

    Carl Bond and Stacey Drinkwater converted a double-decker bus for somewhere to live.

    In Crystal Palace Laura Park lives in this converted public toilet.

    Many people have tried to evade the planning laws that stop people from building, but disguising homes as sheds or barns.

    Alan and Sarah Beesely built their home inside a barn, as you can see from the skylights. They were told by the council to knock it down.

    Carl Jones built this garage, but building inspectors decided it was really a house, and told him to take it down.

    So too this toolshed in a garden centre in Stroud was found to be a home, and ordered was ordered to come down.

    In the Pembrokshire National Park Brithdir Moor, Janet and Tony Wrench built the Roundhouse, which was also ordered taken down.

    For years now housebuilders in Britain have failed to build enough homes for people to live in.

    We were told that more homes would encroach on the ‘green belt’ and the countryside. Foolish commentators like Simon Jenkins and Tristram Hunt warned – laughably – of a ‘Tsunami of concrete’ threatening the countryside. Powerful lobbies like the Campaign to Protect Rural England, the Urban Taskforce and the Green Party did all they could to stop new building. But it turns out that less than one tenth of Britain is developed.

    Instead of developing the land we need government and municipal authorities said that they would ‘build up, not out’, and that they could get more people, into less space, by more compact, smart growth. At the time the development advocacy Audacity told them that this could only lead to overcrowding, and that their ‘smart growth’ would take us back to Victorian social problems.

    Today, more people are willing to acknowledge that there is a problem with a shortage of affordable housing – but too few are willing to grasp the nettle and say we need to build many, many more houses to meet housing need.

    Some commentators have made the point that there should be council housebuilding to meet the need. Others that the planning laws should be liberalised so that private developers can build. Both of those would be a good idea, but neither should be turned into a dogma that must be observed before new homes are built. The issue is that however it is done, Britain needs to build the houses that people need to live in.

    James Heartfield’s book Let’s Build! Why We Need Five Million New Homes in the next 10 Years is available from Amazon.

  • Prescription for an Ailing California

    Only a fool, or perhaps a politician or media pundit, would say California is not in trouble, despite some modest recent improvements in employment and a decline in migration out of the state. Yet the patient, if still very sick, is curable, if the right medicine is taken, followed by the proper change in lifestyle regimen.

    The first thing necessary: Identify the root cause of California’s maladies. The biggest challenge facing our state is not climate change, or immigration, corporate greed, globalization or even corruption. It’s the demise of upward mobility for the vast majority of Californians, and the rise of an increasingly class-ridden, bifurcated society.

    California’s class problem spills into virtually every aspect of our malaise. It is reflected in both the nation’s highest poverty rate, above 23 percent, and a leviathan welfare state; California, with roughly 12 percent of the population, now accounts for roughly one-third of the nation’s welfare recipients. This burgeoning underclass exacerbates the demand for public services, deprives the state of potential taxpayers and puts enormous pressure on the private sector middle-class to come up with revenue.

    The growing class chasm also distorts state priorities, creating an inordinate demand for public sector employment – and related jobs in health and education – while inculcating deep-seated resentment among private-sector entrepreneurs and professionals toward a state that asks much of them, but gives increasingly little.

    Conservatives generally have recoiled from a class-based analysis, hoping to play on ethnic or cultural fears to advance their agenda of lower taxes and less regulation. Their incoherence and inability to adjust to changing demographics have left them increasingly irrelevant.

    On the other hand, progressives feel comfortable with class as an issue, but see more regulation and ever higher taxes on the private sector as the solution. Yet the experience of the past decade has shown their folly, as California’s middle class has continued to shrink, and poverty has worsened, particularly in the state’s interior. The dangers of a large permanent underclass of unemployed and underemployed should be clear even to the most dreamy progressive.

    Essentially, there is only one practical solution to this dilemma: a program that promotes economic growth. This strategy would transcend the recent reliance on asset-based bubbles that have boosted property markets and technology stocks. Another bubble, whether an investor-driven spike in property values in Newport Beach or a stock mania in Silicon Valley, may provide a temporary boost in revenue but will do very little to improve employment for the vast majority or to stabilize long-term finances.

    The recent surge in tech employment in places like Silicon Valley is neither likely to persist or improve conditions for many Californians. The days of huge employment gains in Silicon Valley – where jobs more than tripled from 1970-2000 – are over. Even in the current boom, the Valley’s employment remains down from a decade ago, and the rest of the state is doing decidedly worse. Social media simply will never be a major job producer or productivity enhancer; Facebook has 4,300 American employees, while old-line firms, like Intel, which have been shifting employment out of the state, have 10 times as many.

    Other proposed bromides, like Gov. Jerry Brown’s promised 500,000 "green jobs," need to be dismissed for what they are – stories we tell our children so they will fall asleep. High-speed rail, another modern-day Moonbeam program, is seen, even by many progressives, such as Mother Jones’ Kevin Drum, as an "ever more ridiculous" boondoggle based on "jaw-droppingly shameless" assumptions.

    Instead of delusion, California needs policies that can boost economic growth in precisely those areas – construction, agriculture, manufacturing and energy – with the best prospects for creating good, high-paying jobs for both blue- and white-collar Californians. Yet, right now the Legislature and, even more so, the empowered state apparat, seem determined to do everything they can to strangle an incipient recovery in these industries.

    Sadly, much of this is done in the name of the environment, but often based on dubious assumptions. Laws that seek to reduce water allocations to the Central Valley are justified as protecting a bait fish, but create windswept new deserts, along with shocking poverty, in the state hinterland. It is no longer enough to protect the still-wild environment; mankind itself must be pushed away from areas that, in some cases, for generations, has provided food for the world, income for families and revenue to the state.

    Concerns over climate change have justified much of the state’s regulatory tsunami. Yet it is absurd to assert that California by itself can change global climate conditions in any meaningful way, given that the big increases of carbon emissions are all coming from the developing world; overall, America’s emissions already are dropping far more quickly than in other high-income parts of the world, largely due to the natural gas boom.

    Yet such mundanities matter little when our greatest policy goal seems to be to make the regulatory apparat, Hollywood and Silicon Valley moguls and their favored nonprofits feel better about themselves; if it provides job opportunity for zealots or the rent-seeking kind for favored venture capitalists and companies like Google, all the better.

    Worse, the consequences of these policies, such as soaring energy prices, likely will not be felt in Portola Valley, Corona del Mar or Pacific Palisades, but, rather, in Santa Ana, Modesto and Oakland. Our regulatory regime already has cost California the opportunity to cash in on two significant booms – in manufacturing and in fossil fuel energy – that are creating middle-income job opportunities and upward mobility in other parts of the country.

    On the environmental side, these policies could have an overall negative effect by driving both people and industries to areas that, because of climate and regulatory environment in their new homes, likely will expand their carbon footprint. Arguably the best thing California can do to reduce global carbon emissions would be to boost its industrial profile. The state also should be leading the shift to natural gas, which California, a potentially big player, so far largely has refused to join.

    Another great opportunity lies in housing, a key source of both white- and blue-collar jobs. Population growth may have slowed, but the pent-up demand, largely from immigrants and millennials, for single-family homes, remains potentially strong. If the supply was increased, and prices moderated, homebuying would become more attractive for families with children. Emissions could be cut in more family-friendly ways, by encouraging more fuel-efficient cars, the dispersion of industry and, most particularly, telecommuting.

    Sparking the revival of these basic industries and higher-wage employment would enhance California’s budget situation over time far more than increasing taxes on the remaining residue of entrepreneurs and professionals. Energy work, in particular, pays high wages, often more than for many tech jobs, and both manufacturing and construction generally provide higher incomes than the low-wage service work that has become the only option for millions of Californians.

    Getting kids from the Central Valley or East Los Angeles working on housing sites, factories and energy facilities is both the most humane, and practical, way to right our fiscal ship. Growth in these industries would also spur the knowledge sector of the economy; many of the strongest gains in STEM (science, technology, engineering and mathematics) jobs in recent years have occurred in manufacturing regions, such as Detroit, or in the energy belt, notably Houston. California’s technical know-how should not be expended simply on developing computer games and social networks; resuscitating the tangible economy would also diversify employment opportunities for the highly skilled.

    Government can play a critical, even determinative, role here. But it needs to shift priorities from redistribution and wealth suppression to providing the basic infrastructure essential for a growth economy. It means transforming our education system from a jobs and pension program for public sector workers and corporate rent-seekers to a focus on providing our economy with the skills – including those used in basic industries – needed for a revived California. It means spending money on the kind of infrastructure, such as gas pipelines, roads, urban bus lines, water and energy systems, that can spur growth instead of misallocations such as high-speed rail and subsidized green energy boondoggles.

    This back-to-basics approach could restore California’s aspirational promise, and not only for a favored few in a handful of favored places, but for the majority of our people, from the mountains to the sea.

    Joel Kotkin is executive editor of NewGeography.com and a distinguished presidential fellow in urban futures at Chapman University, and a member of the editorial board of the Orange County Register. He is author of The City: A Global History and The Next Hundred Million: America in 2050. His most recent study, The Rise of Postfamilialism, has been widely discussed and distributed internationally. He lives in Los Angeles, CA.

    This piece originally appeared in the Orange County Register.

  • Detroit Future City

    Recently the Detroit Works Project released their long awaited strategic plan for the city. This is the one led by Toni Griffin that produced a lot of public controversy because of suggestions it would result in the planned shrinkage or decommissioning (or even forced residential relocations) in sparsely populated neighborhoods.

    Called “Detroit Future City,” this plan doesn’t shy away from facing the tough realities that face Detroit, but its recommendations are somewhat muted with regards to shrinkage. Nevertheless, the message is clear: in a broke, declining city, neighborhood triage is a must.

    The full document is 184 pages. I perused it, but wasn’t able to review at the level of detail I normally like to. Partially this is because it was published in a hyper-annoying “cinemascope” type format that makes it almost impossible to read on screen without magnification and lots of horizontal scrolling. This aspect of the plan’s publication was an immediate knock against it in my view. However, it will share a few observations I gleaned.

    Neighborhood Development

    The plan is notable for admitting that Detroit can never be repopulated. In fact, its only goal is to stabilize population loss 20 years from now, and settle in for a population of 600-800,000 people, or approximately the same as now.

    The plan is frank about the scale of the challenges, including 150,000 vacant and abandoned parcels, empty land equal to the area of Manhattan, and vastly oversized infrastructure relative to the population and industrial base, along with poor service delivery in areas ranging from public safety (Detroit has the second highest violent crime rate in the country) to street lighting (about half of the street lights don’t work).

    Part of that does involve identifying how to deploy infrastructure in neighborhoods. Here’s a graphic on that which will no doubt get some airplay:


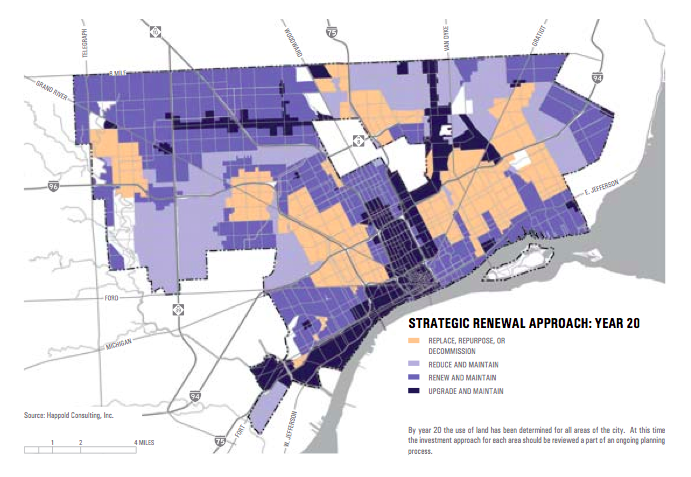
    Some areas are slated for upgrades, others reductions, and some perhaps “decommissioning.”

    The strength of the plan, however, is in its approach to development in which the core concept is to develop a multi-nodal network of neighborhoods, and to have neighborhoods that are strategically differentiated from each others. This is very different from the core-centric or “hub and spoke” model that exists today, and is somewhat similar to my “100 Monument Cirles” concept for Indianapolis. Suffice it to say, I like it. What was missing from this was strengthening neighborhood identify, something Pete Saunders identified as a key weakness of the city.

    A lot of the content behind this is disappointingly standard, however. The focus is green infrastructures, transit, mixed use neighborhoods, etc. This is basically planning conventional wisdom that would be at home in lots of different cities.

    I was pleased to see that they de-emphasized rail transit. Only the M-1 light rail on Woodward remains. The rest of the core network would be BRT. I’d argue that reliable and higher frequency “plain old bus service” is the core need, however. There’s the proposed transit map:


    Some may decry this, but in a city that’s over-infrastructured as it is, the last thing you need is more physical plant to maintain over time.

    And perhaps the focus on green is to some extent understandable given the vast quantity of vacant land in Detroit. One of their intriguing concepts is “landscape as infrastructure”, though it didn’t fully connect with me. They did talk about ideas like medium intensity agriculture and new urban forest typologies. The Hanzt Farm example shows this already underway.

    Lastly, the focus, and especially the near term recommendations around, regulatory restructuring is critical. Detroit benefits today from a sort of laissez-faire environment because government is so ineffective. If government effectiveness were restored, it could easily strangle the good things happening in Detroit, which are largely non-conforming. The answer is to get the regulatory system up to date with what we want to see. I would have preferred to see some types of harder targets around this, such as “85% of new development approved as of right.”

    Economic Development

    The plan considers boosting the number of jobs in Detroit as the most important mission. The city today has the 5th lowest number of jobs per resident of any of the top 100 cities in America, this despite large population losses. Jobs in the city are needed both for residents and rebuild the tax base.

    The numbers on this seemed a bit squishy though. The report says that there is one job for ever four residents of Detroit. As there are about 700,000 residents, this would mean about 175,000 jobs. Yet they say there are 350,000 jobs. (If the resident figure included only working age adults, the projected number of current jobs would be even lower than my estimate).

    The goal by 2030 is to increase this to between 2 and 3 jobs for every resident. This implies simply staggering job growth. Their mid-point population estimate for 2030 is still 700,000, so to go from 0.25/1 to 2/1 or 3/1 implies 700-1100% job growth. This is a CAGR of 11-13% – off the charts. To put it in perspective, metro Houston’s job growth CAGR from 2000 to 2011 was only 1.3%.

    I may be totally off base on what they were getting at in these numbers, but having solid and realistic projections is critical, and, alas, all too rare. Unrealistic growth rate assumptions are common in civic plans, as I highlighted in the example of Cincinnati’s Agenda 360 plan.

    [ Update: I was contacted by someone from the study’s technical committee indicating that the 2 or 3 jobs per resident figure was an error in the PDF that was not present in the official version of the plan. There are apparently about 193,000 jobs in the city, with the plans actual goal a doubling of that over 30 years. Still ambitious, but not mathematically impossible. ]

    The job growth is projected to come from four key target sectors: eds and meds, digital and creative, industrial, and local entrepreneurship. These sectors are reasonable as these things go given where Detroit is, but seem unlikely to drive the major growth they seek, excepting possibly entrepreneurship.

    Neither Wayne State nor Detroit’s health care/life science infrastructure is nation leading. Every city and state in America is chasing eds and meds, and as I noted, the great growth curve in these industries may be over. Additionally, the trend nationally seems to be towards more decentralization of health care infrastructure in metro areas. While I’m sure there will be some growth here, I’m not optimistic about major expansion.

    Similarly, digital and creative jobs are the fad du jour. I strongly doubt anyone will even consider there to be categories of jobs called “digital” or “creative” by 2030. These will be absorbed into industry generally. These are also the same types of sectors being pursued everywhere. Detroit certainly has a concentration of these because of its auto design cluster and just simply being a big city. But other than autos, does it really have a competitive advantage here? The big expansion opportunity would seem to be mostly suburban relocations of the type spearheaded by Dan Gilbert. I wonder how much gas is left in that tank, however.

    The other two are more promising. Local entrepreneurship is a catch-all, but clearly indigenous startups are a great way to boost the economy. The report’s focus on equipping and facilitating minority entrepreneurship was especially relevant. Given the collapse of the city, Detroit’s residents have had to become innovative and self-sufficient of necessity. These skills from the school of hard knocks are in many ways worth much more than formal education when it comes to starting a business. If the city can figure out how to marry these “survival skills” of residents with a commercial orientation, it could be powerful. The same recipe of figuring how to do business in unstable and tough environments is common in the Middle East, where there’s a longstanding entrepreneurial and trading tradition. Unsurprisingly, Middle Easterners have been prominent among those who’ve thrived in Detroit. The challenge is how to activate the similar skills in other ethnicities for business purposes.

    Industrial employment would also seem to be a possible area of growth, but not in the way envisioned in this plan. Industrial employment has been in decline, and new industrial facilities have tended to locate in outlying areas, not traditional urban manufacturing zones.

    However, there are types of industrial businesses that can have a hard time finding a home. For places that are willing to welcome them, there could be opportunity. I noted this around the heavy industrial zone in Northwest Indiana.

    This involves being willing to take on more brown than green industry, however. And it raises a whole host of issues around environmental justice, etc. However, Detroit, as this plan notes, is desperate for jobs. Trade-offs at least need to be considered. Rather than “focusing on the look and feel” of industrial areas, as the plan put it, why not roll out the red carpet for businesses like tanneries, scrap metal processing, etc. that are increasingly unwelcome in places like Chicago? Being friendly to to these types of businesses is probably the most likely road to success in industrial employment.

    Conclusion

    On first read, there’s some interesting stuff in here. They plan is less creative than I’d hoped overall, but probably takes the most aggressive line that was politically realistic. The real questions is, what happens next? Can any of this actually be actioned, or will fiscal and other problems effectively render it a dead letter? Only time will tell.

    Aaron M. Renn is an independent writer on urban affairs and the founder of Telestrian, a data analysis and mapping tool. He writes at The Urbanophile, where this piece originally appeared.

  • World’s Most Affluent Metropolitan Areas: 2012

    Late in 2012, the Brookings Institution published its annual Global Metro Monitor (by Emilia Istrate and Carey Anne Nadeau), which estimates economic data for the 300 world metropolitan areas with the largest gross domestic product (GDP). The Global Metro Monitor also provides estimates of the GDP per capita for each of the qualifying metropolitan areas. The surprising news: after at least five years of the most laggard economic performance in adult memory, the United States continues to dominate the highest GDP per capita data.

    Summary by Geography

    Among the 10 metropolitan areas with the highest GDP per capita, nine are in the United States (Figure 1). Hartford ($79,900 per capita), for the second year in a row, was ranked the most affluent metropolitan economy by Brookings. The US accounts for 36 of the top 50 metropolitan economies, and 67 of the top 100.

    Europe is also strongly represented, with 23 of the most affluent 100 economies as rated by Brookings. Yet for the most part European metropolitan regions were concentrated between 50th and 100th. Only seven European metropolitan areas made the top 50. The highest ranking was Edinburgh, Scotland ($59,400), at 21st. Two former East Bloc European metropolitan economies also broke into the top 100, Prague at 70th and Moscow at 92nd.

    East Asia placed 3 metropolitan areas in the top 100. Singapore ($62,500) did best at 14th.  Singapore’s ranking behind so many US metropolitan areas may be surprising, since Singapore has a higher GDP per capita than the United States. However, the most affluent US metropolitan areas are more affluent than Singapore, which is both a city and a country. The highest ranking Chinese metropolitan area was Macau, the former Portuguese Special Administrative Region, which ranked 26th.

    No mainland Chinese metropolitan area was in the top 100. However, should China’s economic growth continue at its fast pace, it will not be long before the most affluent metropolitan areas break into the top 100. The strongest candidates could be Suzhou and Wuxi (between Shanghai and Nanjing) and Hong Kong neighbor Shenzhen (Note).

    Two Middle Eastern metropolitan economies were represented in the top 100, both in the top 50. Oil-rich Abu Dhabi ($66,500) was the only metropolitan area outside the United States to place in the top 10, ranking 8th, while Kuwait City ($56,100) ranked 32nd.

    Three of Canada’s largest metropolitan areas made the list, led by Calgary ($61,600), which ranked 15th, while Edmonton ($52,000) rounded out the top 50. Two of Australia’s largest metropolitan areas were represented. The most affluent was Perth ($63,400), which ranked 11th and was the second ranking metropolitan area outside the United States (Figure 2). Perth was also the only Australian metropolitan area to rank in the top 50.

    None of the metropolitan areas of Latin America, South Asia (such as India or Indonesia) or Africa was ranked in the top 100.

    Highlights: Metropolitan Area Highlights

    Some of the metropolitan areas that might have been expected to be ranked the highest were instead well down on the list.

    This is particularly evident with respect to the large financial centers. New York ranked 12th, behind Perth and immediately ahead of Des Moines, which experienced the greatest percentage growth in financial sector jobs in the United States over the last five years (See: The Dispersion of Financial Center Jobs). Other principal financial centers were ranked even lower, London was ranked 51st, behind its perennial competitor, Paris, which was 43rd.

    Other money centers did even worse, with Frankfurt 53rd, Hong Kong 65th, and Tokyo 112th. Canada’s principal financial center, Toronto, was ranked 96th, well behind Calgary and Edmonton (but ahead of Ottawa at 108th, Vancouver at 114th, and Montreal at 150th). Australia’s leading financial center, Sydney, was ranked 88th, far behind Perth but ahead of Melbourne (113th).

    Information technology centers were well represented in the top 10, including San Jose (2nd), Boston (5th), Durham, home to most of Research Triangle Park (6th), San Francisco (7th), and Seattle (9th).

    The high rankings of Abu Dhabi, Perth, Calgary, as well as Houston (10th), Kuwait City (32nd), Oslo (34th) and Edmonton (50th) demonstrate the importance of natural resources to metropolitan economies.

    GDP Per Capita and Urban Population Density

    There has been considerable confusion about cities, productivity and population density. For example, the urban scaling research of the Santa Fe Institute has been misinterpreted to indicate that higher density cities are more productive. In fact, the research specifically denies any such relationship, finding that productivity generally rises simply as a function of higher metropolitan populations (see Density is not the Issue: The Urban Scaling Research). Further, it has often been suggested that as cities grow they become more dense. In contrast, the evidence is overwhelming that cities tend to become less dense as they grow (see The Evolving Urban Form).

    Supplementing the Brookings Institution GDP per capita estimates with population density estimates (from Demographia World Urban Areas) provides further indication that greater affluence is not associated with higher population density.

    For example, Hartford, with the highest GDP per capita of all 300 metropolitan areas covered by Brookings has an urban area density (1,800 per square mile or 7000 per square kilometer) similar to that of Atlanta, the least dense urban area in the world with more than 2 million population. Bridgeport and Durham (North Carolina) have similarly low densities and are ranked in the top 10. San Jose (5,800 per square mile or 2,200 per square kilometer) and San Francisco (6,300 per square mile or 2,400 per square kilometer) have the highest density urban areas among the 10 most affluent metropolitan areas, though their densities are low to middling by European standards and well below East Asian densities (Figure 3).

    Out of the 100 most affluent metropolitan areas (Figure 4), 35 have population densities under 2,500 per square mile (1,000 per square kilometer). Many have very low densities, with 17 have density similar to or lower than Atlanta (such as Knoxville, TN, Little Rock, AR, Worcester, MA and Columbia, SC).

    Another 33 metropolitan areas have urban densities between 2,500 and 5,000 per square mile (1,900 per square kilometer). This includes metropolitan areas such as Denver, Perth, Dallas-Fort Worth, Houston, Vancouver, Portland and Seattle. There are also 26 metropolitan areas with between 5000 and 10,000 per square mile (3,900 per square mile), such as Los Angeles, Paris, Stockholm, Toronto and Vienna. There were only six metropolitan areas with urban densities above 10,000 per square mile (3,900 per square kilometer), Macau, Hong Kong, Singapore, London, Kuwait City and Prague.

    The Future?

    The continued strong showing of the United States in the world affluent metropolitan area league tables cannot be taken for granted. While it seems likely that US metropolitan areas will not be displaced by their European counterparts, the strong growth in Canada and Australia could propel their metropolitan areas much higher. And then, there is always China and other increasingly affluent cities of east Asia.

    Wendell Cox is a Visiting Professor, Conservatoire National des Arts et Metiers, Paris and the author of “War on the Dream: How Anti-Sprawl Policy Threatens the Quality of Life.”

    —–

    Note: The GDP per capita of metropolitan areas in China is adjusted, using the population figures from the 2010 census (which included the urban migrant population). The issue is described in Endnote 19 in the Brookings Global Metro Monitor.

  • New Zealand Housing Hits Political Hot Button

    The release of the 9th Annual Demographia International Housing Affordability Survey on Monday appears to have caused a political storm in New Zealand. This year’s Survey was particularly controversial in New Zealand for two reasons.

    Not only did it show deteriorating housing affordability, as measured by a worsening of New Zealand’s ‘median multiple’ (median house price divided by gross annual median household income), but the foreword of the Survey was written by none other than New Zealand’s Finance Minister, Bill English, who had some stern words to say about the state of housing affordability in New Zealand, brought about largely by the strangulation of supply:

    “Housing affordability is an important focus for the New Zealand Government . Last year’s New Zealand Productivity Commission report on housing affordability, relying in part on Demographia affordability data, showed a substantial worsening in housing affordability in New Zealand in the last thirty years…

    In its response to the Productivity Commission, the Government agreed with the Commission’s analysis that supply side factors explain the deterioration in New Zealand’s housing affordability.

    The Government’s response to the Commission’s report concentrated on land supply, infrastructure provision, costs and delays due to regulatory processes, and improving construction sector productivity…

    It costs too much and takes too long to build a house in New Zealand. Land has been made artificially scarce by regulation that locks up land for development. This regulation has made land supply unresponsive to demand. When demand shocks occur, as they did in the mid-2000s in New Zealand and around the world, much of that shock translates to higher prices rather than more houses. It simply takes too long to make new land available for development.

    We may be seeing the beginning of a repeat of the mid-2000s demand shock. As interest rates stay below historic norms, expectations are shifting that these rates are here to stay. As a result, demand for real assets has increased, observed in booming equities markets in 2012. Demand for real estate is also increasing, with the median house price in Auckland recently exceeding the highs of 2007.

    Costs of other housing inputs contribute to New Zealand’s affordability problem. Building materials cost more in New Zealand than neighbouring Australia. The structure of infrastructure financing, and the timing levies are to be paid, raises the market price for housing. Appeals under the Resource. Management Act, New Zealand’s land use regulation, can hold up developments and city planning for a decade or more in some cases. Time is money because development is risky…

    Certainly, the affordability situation in New Zealand has, once again, started to deteriorate, with house prices in New Zealand’s two major markets – Auckland and Christchurch – rising strongly over the past two years (see next chart).


    In late 2009, the Reserve Bank of New Zealand dropped the official cash rate to just 2.5%, where it has remained ever since. In turn, the discount variable mortgage rate has fallen to just 5.45%, which has fueled a sharp rise in mortgage finance commitments and house prices (see below charts)


    At the same time as credit demand has been rising, the supply situation in New Zealand has also deteriorated. The February 2011 Canterbury earthquakes wiped‑out more than 10,000 homes in Christchurch, New Zealand’s second largest city, adding to the already tight housing supply.

    Meanwhile, in New Zealand’s largest city – Auckland – the Council has moved to tighten the city’s already highly restrictive urban growth boundary (called the “Metropolitan Urban Limit” or MUL) into an even tighter “Rural Urban Boundary” that would effectively ban development outside of the rural-urban line and limit the area in which development could take place (see here and here for details).

    The Productivity Commission’s Final Report into housing affordability, released last year, was scathing of land-use planning in New Zealand, citing a body of evidence showing that strict policies of urban containment and slow development approval times had adversely affected the rate of new home construction and housing affordability in New Zealand.

    In particular, the Productivity Commission’s Report noted that the land value of housing had risen significantly, particularly in Auckland, with land-use constraints a key driver of this escalation (see next chart).


    Moreover, the Productivity Commission report showed that the cost of new housing blocks had escalated in real terms, particularly in Auckland:


    And that the land price escalation has occurred at the same time as the number of sections sold has plummeted:


    The release of the Demographia Survey on Monday appears to have brought New Zealand’s housing affordability problems into the limelight.

    Yesterday, in response to the study, the New Zealand Prime Minister announced a reshuffle of Cabinet, assigning Nick Smith to housing in an attempt to improve affordability. The Government has also threatened to take planning control from local councils if they do not improve the supply situation, with the Auckland Council, in particular, in its sites.

    For its part, the Auckland Council is holding firm to its Plan to tighten the city’s growth boundary, stating that it doesn’t “agree with the unplanned wholesale release of land which is going to cost the ratepayers a fortune to service”.

    Meanwhile, the Opposition Labour Party has promissed to build 100,000 basic homes for first-home buyers, focusing on Auckland, over 10 years, in order to relieve the supply situation and improve affordability.

    It looks like housing affordability is, once again, gearing up as a hot political issue in New Zealand.

    This piece first appeared at Macro Business.

  • State Components of Population Change: 2010-2012

    What have the last two years of modest recovery meant to the growth and redistribution of population among the states? New data on the components of change for states are now available.  In March county level data will permit a more detailed portrait.

    For states I present four maps, overall population change, change from natural increase, immigration (net international migration) and internal migration between states.

    Population Change

    Not surprisingly, most of the states with larger absolute and percent gains continue trends from the last decade: the South Atlantic states from Florida to Delaware, in the South dominantly Texas (both amount and rate), along with Colorado and Washington State as centers of substantial Western growth. But North Dakota, due to rapid energy development, is the prime addition to the “winning” state for growth, with South Dakota following. The District of Columbia had the highest rate of growth,a beneficiary of expanding government growth, and perhaps more importantly, power.

    Conversely, low rates of growth, even a loss for Rhode Island and possibly Michigan, characterize the northeast and the south central states.

    Natural Increase

    For most states, natural increase (the difference between births and deaths) is the largest component of growth. The rates and amounts are significant to overall growth across the west, California still leads in absolute growth, entirely due to natural increase. In contrast Utah and Idaho also stand out for high rates, in part from their Mormon population.  Some slower growth northeastern states do have substantial natural increase, due to their size, including IL, MI, OH, and NY, while NC and SC and especially FL have lower rates of natural increase due to aging of their populations and migration of older people from the north.

    Immigration

    Total US population growth from 2010-2012 was 5.17 million, of which 3.32 million was from natural increase (8.9 million births and 5.6 million deaths), leaving a substantial part of growth from international migration of 1.85 million. Despite the flak about immigration, the pace has not slowed.

    While immigration in the West (CA, WA, HI) of 277,000 remains significant, the  dominant flow of immigrants went to the  Atlantic seaboard states – how old-fashioned! – such as greater New York,  Florida, and increasingly to GA and NC. New York gained 210,000 and Florida 212,000!   Immigration was fairly modest to the interior of the country. This reflects largely the decreasing immigration from Mexico. Illinois (with a gain of 61,000 from immigration) and Texas are both are experiencing slowdowns.  And note that AZ and NM immigration have become quite small.

    The highest rate of immigration was to HI followed by NJ and FL.

    Internal Migration

    The volume of interstate migration was still lower than was typical in the 1960s through the 1990s, but still potent in explaining the growth differential among the states.

    The pattern of absolute and relative gains and losses was essentially a continuation of trends over the last twenty years, with net in-migration to much, but not all of the South and to the West, except for California, which grows from natural increase and immigration but loses to the rest of the country. 

    Texas, with a net gain of 291,000, easily grew the most, followed by Florida (219,000), then North Carolina (72,000) and Colorado (62000). The highest rate was North Dakota, with net in-migration at 2.6% of the base population, followed by the District of Columbia (2.35%) and Colorado (1.24%). The North Dakota phenomenon is the most remarkable, since it marks an abrupt reversal from decades of loss, and of unknown duration.  In the West, Colorado became the preferred destination, followed by Washington, with Arizona and Nevada less popular than a decade earlier. South Dakota also changed to a small gain due to its strong economy and low unemployment.

    Out-migration characterized 28 states, encompassing the entire northeastern part of the country, from Minnesota to Maine, Kansas and Nebraska to Pennsylvania and New Jersey, and several states experienced high amounts and rates of loss, e.g. New York, -224,000; Illinois, -156,000; New Jersey, -103,000; and Michigan, -93,000; but the highest rates of loss were for Rhode Island, Illinois, New Jersey and New York. Outside the northeast, the biggest loss, as usual was for California: 104,000.

    Differences in Components of Change From the 2000-2010 Decade
    Population growth

    Overall the rates of population growth, of natural increase, and of international immigration are remarkably unchanged. The perhaps surprising turnarounds towards much greater rates of growth occurred in DC, LA (recovery from Katrina), and  the Dakotas. States whose growth slowed markedly were AZ, ID, NV, NM, and UT in the West (partly due to much lower migration from Mexico), and Georgia. Only RI shifted from growth to a loss.

    AK, HI, LA and ND enjoyed increased immigration, while it fell for AZ, CO, NM and TX.  Natural increase grew in ND and DC.  

    Internal migration

    DC, LA and ND changed the most, changing from losses to gains, and CO and SD had increased rates. Twelve states had lower rates of in-migration: AL, AZ, AR, DE, GA, KY, NV, NC, OK, OR, SC, and even VA – presumably a recession effect. But it was worse for seven states which shifted from gains to losses: ID, ME, MO, NH, NM, PA and VT, and for 3 states with bigger losses: CT, IN and NJ. But then seven states reduced rates of loss: CA, HI, IA, MD, MA, NE, and NY. Obvious explanations for some of these changes do not spring quickly to mind.

    What all this shows is that it is hard to make long term projections on the basis of seemingly robust trends over even fairly long periods. Preferences change, economic sectors rise and fall.

    Political Implications

    Analysis of the 2012 elections have shown that the Obama victory is a consequence of demographic change as the country shifts from a domination of white males to a rainbow coalition of yes, white liberals, mostly urban, but propelled largely by a strongly supportive minority population moving toward a majority. At first glance the maps seem to tell us that growing areas in the South and mountain states favor the Republicans while the declining Northeast was the stronghold of Democrats. Yet it is more complex, since states like Virginia, Florida, Colorado and even North Carolina – all with large and growing minority as well as white urban populations – vote increasingly Democratic.

    Richard Morrill is Professor Emeritus of Geography and Environmental Studies, University of Washington. His research interests include: political geography (voting behavior, redistricting, local governance), population/demography/settlement/migration, urban geography and planning, urban transportation (i.e., old fashioned generalist).

  • Why Republicans Need the Cities

    Republicans took an all around shellacking in the 2012 elections. Part of the reason is that Democrats dominated the cities. President Obama won 69% of the big city vote, according to a New York Times exit poll analysis. Some of this is perhaps on account of the racial makeup of the cities, as blacks overwhelmingly vote Democratic. Yet it’s clear that, even among the upscale white urbanist crowd, Republican policies and candidates are finding few takers.

    This bodes ill for the Republicans, but also for the future of cities. Most places suffer when under single-party rule, whether liberal or conservative. This has plagued big cities. Chicago, for example, doesn’t have a single Republican member of its city council. For a long time Republicans dominated large tracts of the suburbs.

    These geographically discrete monopolies have resulted in a thoroughly corrupt bi-partisan system that Chicago Tribune columnist John Kass has dubbed “The Combine.” Some competition remained at the state level, but it should come as no surprise that as the state as a whole as gone solidly blue, state and city finances have cratered, leaving Illinois as a national basket case.

    Cities can benefit from Republican ideas on a variety of fronts. As Harvard Economist Ed Glaeser points out in City Journal, Republicans have been leaders in ideas around urban crime reduction, education reform, and privatization and rationalization of city services.

    Unfortunately, Republicans have largely abandoned the urban playing field, preferring to condemn the cities as cesspools of Democratic corruption, high taxes, and decay. The Republican party today is largely driven by exurban and rural leaders, as well as populist movements like the Tea Party, with values that are not widely shared by urban dwellers. This has not only cost the party votes, but, critically, it has left it on the outside looking in on many debates, as culture is shaped in large urban centers where Republicans have little voice.

    It’s well past time for Republicans to take cities seriously again. This starts with valuing urban environments, and respecting (or at least taking time to understand) the values of the people who live there. For example, urban dwellers expect and indeed require a higher level of public services than many suburban residents. The suburbs might not need quality street lighting, for example, but cities do. The rural area I grew up in can rely on people passing by in pickup trucks with chain saws to clear away trees that fall on the road. Cities can’t. Thus, Tea Party-type policy prescriptions in which basically everything the government does is considered bad, and in which cutting taxes is the main political value, aren’t likely to sell. Urban dwellers actually want to know how you are going to deliver services more effectively. Similarly, just bashing transit as a waste of money, lashing out against location-appropriate density, opposing all environmental initiatives, and shrill anti-immigrant rhetoric only turn urban dwellers off.

    If Republicans took urban concerns seriously, they would find that they have much to offer urban residents and voters. For example, Democrats pay lip service to transit, but much transit policy in America today (heavily shaped by Democrats) is more oriented towards protecting entrenched constituencies than it is towards actual effectiveness. A serious Republican-led effort to reform the federal process and reduce the insane construction price premium (effectively a transit surtax) for American transit versus overseas systems would be welcomed, as long as it was not a Trojan horse for undermining transit. Republicans have so abandoned transportation (other than highway spending), that ideas which Republicans invented, like congestion pricing, have been claimed by the left as their own.

    As an example of what a more urban focused Republican/conservative could be, consider the Manhattan Institute, a free market think tank (full disclosure: I have been a writer for their City Journal magazine). Because they are based in New York City, demonizing transit and such is just not realistic. Hence they’ve focused on policy ideas that are actually relevant to the city. They’ve also not hesitated to praise Mayor Bloomberg’s transportation reforms, and even gave an award to Rhode Island Democratic state treasurer Gina Raimondo for her leadership in pension reform. If more conservatives were similarly focused on driving better urban outcomes in the inner city rather than demonizing it, or on scoring political points, Republicans might be back in the game.

    Republicans have a huge opportunity in the enormous income and wealth gap in inner cities, which Democratic policies, focused on things like greening the city, have done little to address. Indeed, all too much urbanism amounts to a sort of trickle down economics of the left, in which a “favored quarter” of artists, high end businesses, and the intelligentsia are plied with favors and subsidies while precious little ever makes it to those at the bottom rungs of society. A key lever to end this is to cut away at the massive regulatory burden that stifles small scale entrepreneurs, particularly minorities and immigrants. Regulatory relief is right up the Republicans’ alley.

    Republicans also need to take on cities, especially the biggest ones, in order to get more of a voice in the cultural debates. Culture and media emanate from big cities, particularly New York, Los Angeles, and Washington, DC. Major academic centers also are idea generation factories.

    Republicans became all but excluded from the cultural/media industry as the 60s generation took over. The party’s response has been to create a parallel infrastructure of think tanks, talk radio shows, web sites, and even its own TV network, Fox News. This worked well in the era immediately following the end of the Fairness Doctrine, but as the so-called mainstream media reacted by shifting to the left, this has left the Republicans often talking mostly to themselves while the national culture gets shaped by Hollywood, etc. A good example is the web site Atlantic Cities, which fully embodies the values of the international urban elite left, with few identifiable conservative ideas.

    The 2012 election shows the limits of this strategy. Just as evangelical Christians have decided that they must look to plant their flag in the inner cities – both to reach an increasingly secularized, ,upscale population, and to engage with culture where it is made – Republicans need to start showing up seriously in the cities again if they want to influence the culture. There are already some top-notch conservatives participating in and writing about serious culture (e.g., Terry Teachout). More ambitious, talented young conservatives should seek to enter culture and media industries apart from simply writing for conservative magazines. This battle won’t be easy by any means, but defeat is certain if you never fight.

    One thing is for sure: if Republicans want to have any future in America, they can’t afford to cede any more constituencies as monolithic Democratic voting blocks. Urban America is one constituency the Republican Party can’t afford to ignore.

    Aaron M. Renn is an independent writer on urban affairs and the founder of Telestrian, a data analysis and mapping tool. He writes at The Urbanophile.

    Flickr photo by jvoves: Immigrants protest a Republican-sponsored proposal in Chicago.

  • Applying the Urbanophile’s Beliefs About Cities to Houston

    Last month The Urbanophile posted his statement of beliefs about cities, and a lot of them resonated with me about Houston.  Here are some favorite excerpts along with my own thoughts.

    * Great cities, like great wines, have to express their terroir. There is no one-size-fits-all model of urban success. Our cities are as diverse as their citizenry. To succeed, they need to express their own essential and unique character.  

     This is why you always have to be skeptical when somebody says something like "For Houston to be world class we have to do X like city Y."  I believe that especially applies to heavy rail commuter transit in our decentralized, car-based city, but it also applies to recent questions like "Why can’t Houston have downtown retail like Chicago’s Magnificent Mile or New York’s Fifth Avenue?"  Because we’re not like them, and we already have our pedestrian-oriented upscale shopping district: it’s called The Galleria, one of the largest malls in the country, and with plenty of parking and climate control to boot!

    * Don’t try to beat other cities at their game. Instead, make them beat you at yours. Cities are unique – yours included. Instead of fretting about measuring up to the planet’s elite metropoli or trying to emulate them, cities should figure out their unique strengths that other places can’t match.

    Hear, hear! To quote an old post of mine: "Houston starts the 21st-century with a set of amenities 99% of the planet’s cities would kill for: a vibrant core with several hundred thousand jobs; a profitable and growing set of major industry clusters (Energy, the Texas Medical Center, the Port); the second-most Fortune 500 headquarters in the country (26); top-notch museums, festivals, theater, arts and cultural organizations; major league sports and stadiums; a revitalized downtown; astonishing affordability (especially housing); a culture of openness, friendliness, opportunity, and charity (reinforced by Katrina); global diversity; a young and growing population; progressiveness; entrepreneurial energy and optimism; efficient and business-friendly local government; regional unity; a smorgasbord of tasty and inexpensive international restaurants; and tremendous mobility infrastructure (including the freeway and transit networks, railroads, the port, and a set of truly world-class hub airports)."

    * It says something powerful about a city when people vote with their feet to move there, to plant their flag, to seek their fortune. There is no more telling statistic about a place than in-migration. It’s important to know if people are moving into or out of a city–and why.

    The most ignored statistic of the creative class city boosters, because their idols – NYC, Boston, Chicago, SF, LA – fail horribly on it.

    * Moreover, new blood isn’t just nice to have, it’s essential. In an ever-more globalized, rapidly changing, competitive world, a city’s best interests are not served by being populated with people who’ve never lived anywhere else.

     Points for our global diversity.

    * But it isn’t just about the best and brightest, either. Attracting the educated is important, but cities are also where the poor come to become middle class, where immigrants come to build a better future for themselves and their families. Their needs must be taken up, too–and equally.

    Hallelujah for Opportunity Urbanism (and more here).

    * A great city needs great suburbs. To pull our cities up, there’s no need to tear our suburbs down. To be successful in the modern era, its important for every part of a metropolitan region to thrive and bring its “A game”. 

    * “Building on assets” is a trap. The only reason we have any man-made assets in the first place is that previous generations of leaders didn’t follow that strategy. Only building on assets is a strategy about defending the past, not embracing the future. It is the spending down of our urban inheritance. Yes, leverage assets, but also add totally new things to the pot for future generations.

    Absolutely.

    * We need to look forward, not backward. There is no more corrosive force than nostalgia. We should know where we’ve come from and what we stand for. But we can’t become imprisoned by a yearning for an imagined past that never really was.

    * We need to embrace a 21st century vision of urbanism. Urbanism – Yes, but trying to copy Greenwich Village 1950 is not the answer. To find it, we must boldly re-imagine the possibilities of what a city can be and bravely identify what works today-and what doesn’t.

    Yep – time to rethink Jane Jacobs.

    * We don’t know where this ride is taking us. We’re at a pivotal time in America’s urban history. So much is changing, and more change is yet to come. For our own sake, we should not assume that we’ve arrived where we’re headed, or that we have the answers. If there’s one thing we should take away from the urban planning failures of the past, it is a strong dose of humility.

    "Planning for utopia" doesn’t work.  Cities need the freedom to evolve organically.

    This piece first appeared at Houston Strategies.