Blog

  • Demographic and Economic Challenges: The 9th Annual Demographia International Housing Affordability Survey

    The just released 9th Annual Demographia Housing Affordability Survey (pdf) indicates that housing affordability has deteriorated modestly in the last year. A number of major metropolitan areas remain severely unaffordable.

    Highlights: Metropolitan Areas

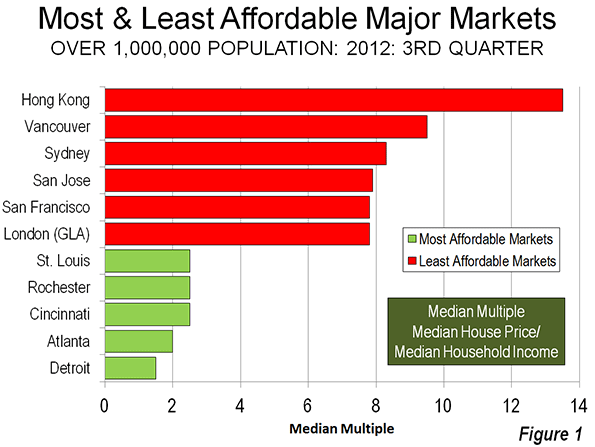
    Among the 337 Metropolitan markets analyzed, Hong Kong remained the most unaffordable, with a median multiple (median house price divided by pre-tax median household income) of 13.5, up nearly a full point from last year’s 12.6. No other housing market has ever reached such an intense level of unaffordability since the Survey began (Los Angeles reached 11.5 in 2007).

    Rounding out the least affordable major markets (over 1,000,000 population) were Vancouver at 9.5, Sydney at 8.3, San Jose (US) at 7.9, and a tie in fifth place between San Francisco and London (Greater London Authority) at 7.8. The most affordable markets were Detroit at 1.5 (Note 1); Atlanta, at 2.0 (Note 2); and Cincinnati, Rochester (US), and St. Louis at 2.5 (Figure 1).

    Rating Housing Affordability

    The Demographia Housing Affordability Surveydefines four housing affordability categories (Table 1), starting with "affordable." Affordable housing markets have a median multiple of 3.0 or less, the upper bound of overall housing affordability that existed virtually across all major markets in the United States, the United Kingdom, Canada, Australia, Ireland and New Zealand before the adoption of urban containment policy (also called densification policy, urban consolidation, compact cities, smart growth, or growth management).


    Table 1

    Demographia International Housing Affordability Survey

    Housing Affordability Rating Categories

    Rating

    Median Multiple

    Severely Unaffordable

    5.1 & Over

    Seriously Unaffordable

    4.1 to 5.0

    Moderately Unaffordable

    3.1 to 4.0

    Affordable

    3.0 & Under


    Highlights: Nations

    Of all nations, only the United States has affordable major markets and a strong representation in the moderately unaffordable category. Six major markets in the United States were rated in the severely unaffordable category, including San Jose, San Francisco, San Diego, Los Angeles and New York.

    Canada had two markets rated moderately unaffordable, while one half of its major markets were rated severely unaffordable, including Vancouver, Toronto and Montréal. Ireland’s one major market, Dublin, was rated moderately unaffordable.

    One half of the major markets in the United Kingdom were also rated severely unaffordable, including London (GLA), Plymouth & Devon, the London Exurbs (Southeast and East of England), Bristol, Liverpool, Newcastle, Birmingham, and Sheffield. All of the major markets in Australia (Sydney, Melbourne, Brisbane, Perth and Adelaide), China (Hong Kong), and New Zealand (Auckland) were rated severely unaffordable (Table 2).

    Hong Kong and Singapore are the world’s largest city-states. An analysis of a large share of the Singapore market suggests a median multiple of approximately 6.0, which is substantially more affordable than Hong Kong.

    Table 2

    Housing Affordability Ratings by Nation: Major Markets (Over 1,000,000 Population)

     Nation

    Affordable

    (3.0 & Under) 

    Moderately

    Unaffordable (3.1-4.0)

    Seriously Unaffordable (4.1-5.0)

    Severely Unaffordable (5.1 & Over)


    Total


    Median

    Multiple

     Australia

    0

    0

    0

    5

    5

    6.5

     Canada

    0

    2

    1

    3

    6

    4.7

     China (Hong Kong)

    0

    0

    0

    1

    1

    13.5

     Ireland

    0

    1

    0

    0

    1

    3.6

     New Zealand

    0

    0

    0

    1

    1

    6.7

     United Kingdom

    0

    0

    8

    8

    16

    5.1

     United States

    20

    20

    5

    6

    51

    3.2

     TOTAL

    20

    23

    14

    24

    81


    Longer Term Trends

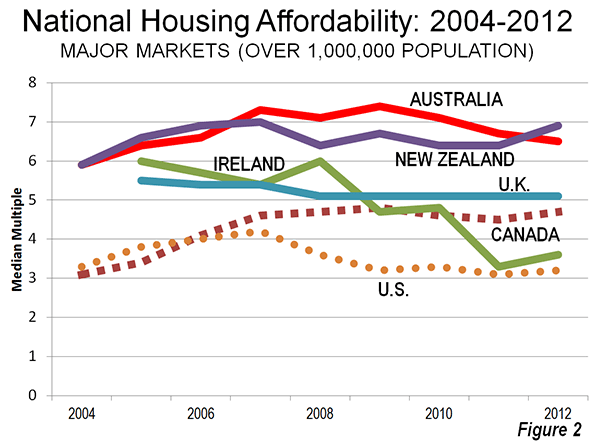
    Over the years of the Demographia International Housing Affordability Survey, housing affordability has improved by far the most in Ireland. It has also improved in the United States. Affordability in Canada’s major markets was the most favorable in 2004, but has seen large Median Multiple increases in each of the three largest metropolitan areas. As a result, there is increasing concern about housing affordability in Canada.

    Australia and New Zealand have had the most unaffordable major markets, with every market being severely unaffordable in every year, reflecting earlier adoption of densification policy by states and metropolitan areas. Housing affordability has also been severely unaffordable in United Kingdom major markets over the period covered (Figure 2).

    A Competitive Land Supply: Key to Housing Affordability

    Overwhelming economic evidence indicates that urban containment policies, especially urban growth boundaries raise the price of housing relative to income. This inevitably leads to a reduced standard of living and increases poverty rates, because the unnecessarily higher costs of housing leave households with less discretionary income to spend on other goods and services. The higher costs ripple into rental markets, tightening the budgets of lower income households, who already suffer from lower discretionary incomes.

    The principal driver of unaffordable housing relative to median incomes is failure to maintain a "competitive land supply." Brookings Institution economist Anthony Downs describes the process, noting that more urban growth boundaries can convey monopolistic pricing power on sellers of land if sufficient supply is not available, which, all things being equal, is likely to raise the price of land and housing that is built on it. This has, more often than not, been associated with urban containment policy and virtually never with the more liberal land use policy that preceded it.

    Recent Policy Developments

    The last year has seen public policy progress. The New Zealand central government plans to expand the land supply and provide alternatives for infrastructure finance, both of which are likely to lead to improved housing affordability. In his Introduction to this years’ Survey, Hon. Bill English, Deputy Prime Minister of New Zealand pinpoints the factors leading to the policy changes:

    It costs too much and takes too long to build a house in New Zealand. Land has been made artificially scarce by regulation that locks up land for development. This regulation has made land supply unresponsive to demand. When demand shocks occur, as they did in the mid-2000s in New Zealand and around the world, much of that shock translates to higher prices rather than more houses.

    The Conservative-Liberal Democrat Coalition is proposing policies to build housing on more competitively priced land, to improve housing affordability. Planning Minister Nick Boles has called Britain’s lack of housing affordability "the biggest social justice crisis we have," and called it bigger than education and unemployment (video). These proposals have been long in coming. It has been four decades since Sir Peter Hall and associates documented the consequences of urban containment, and nearly a decade since the similar conclusions of Kate Barker for the Labour Government.

    In Hong Kong, facing public demonstrations on issues such as housing affordability, the government has adopted a plan to improve housing affordability.

    However, the policy is deteriorating in California, where state regulations could virtually outlaw new single-family housing on the urban fringe. In the last year housing affordability losses have been substantial and could portend another housing bubble in this state that precipitated Great Financial Crisis with its egregious house price increases.

    Evolving Perspectives

    Planning perspectives could be evolving. New York University Professor Shlomo Angel writes in his book Planet of Cities of the importance of housing affordability and argues against urban planning restrictions that restricting adequate housing to ordinary households.

    A team of UK academic researchers questioned the "default" preference for urban containment policy. This is an important development, since much of urban planning is committed to outlawing more liberal land-use policies.

    The Economic Challenge

    Nations around the world face serious economic challenges. Governments have taken on unaffordable obligations, and repayment continues to elude authorities in the United States, the European Union, and elsewhere. Future demographic trends are likely to only exacerbate this difficulty, driven by plummeting birth rates and a rising elderly population (See The Rise of Post-Familialism: Humanity’s Future?).

    Urban policy needs a "reset." The emphasis should be shifted away from "designing" urban areas toward facilitating a better standard of living for the people who live in them. In his epic Civilization: The West and the Rest, historian Niall Ferguson, in his Civilization notes that

    The success of the civilization is measured not just in its aesthetic achievements but also, and surely more importantly in the duration and quality of life of its citizens.

    This requires greater affluence and less poverty, both of which require more affordable housing.

    —–

    Note 1: The city of Detroit has experienced a severe economic decline. However, the Detroit metropolitan area (which includes the city, the suburbs and exurbs) has fared much better. The city (municipality or local government authority of Detroit experienced a population loss from 1,850,000 to 714,000 in the last 60 years, while suburban and exurban areas added 2.2 million. There are a variety of theories about Detroit’s municipal decline, involving both "push" and "pull" factors (such as the incompetence and corruption of the municipal government to the not unrelated attraction of suburban living).  Further, the overall population growth rate of the Detroit metropolitan area has not been strong, but exceeded that of the other three worst hit "Rust Belt metropolitan areas, Cleveland, Buffalo and Pittsburgh (which lost population). Metropolitan Detroit’s growth rate was similar to that of the New York metropolitan area (35 percent compared to 42 percent), which ranked 46th in growth (out of 51) compared to Detroit’s 48th.

    Note 2: At the peak of the housing bubble, affordability deteriorated to a moderately unaffordable 3.1 in Atlanta. Atlanta had been among the high income world’s fastest-growing metropolitan areas for at least three decades, but slowed briefly during the Great Financial Crisis. Growth has returned, with Atlanta ranking third in net domestic migration among US metropolitan areas with more than 5 million population.

    —-

    Photograph: Hong Kong (by author)

    Wendell Cox is a Visiting Professor, Conservatoire National des Arts et Metiers, Paris and the author of “War on the Dream: How Anti-Sprawl Policy Threatens the Quality of Life.”

  • California’s Politics of Farce

    Karl Marx wrote, "History repeats … first as tragedy, then as farce." Nothing better describes how California, with its unmatched natural and human riches, has begun to morph into what the premier California historian Kevin Starr has called "a failed state" – a term more usually applied to African kleptocracies than a place as blessed as the Golden State.

    The tragedy begins with the collapse of a governance system once widely hailed as a leader in efficiency and foresight but which now perpetually teeters at the brink of insolvency and suffers among the worst credit ratings of all the states. Only 20 years ago, the state’s fiscal debt per capita was just below the national average; now it ranks consistently toward the bottom No surprise, then, that California routinely ranked as the "worst governed" state in America.

    This poor performance has consequences, particularly in terms of business. Today, CEOs rank California as just about the worst place to do business in the country, and have for a remarkable eight years in a row. And it’s not just the plutocrats who are angry; a survey by the economic forecasting firm EMSI shows that, in 2011, California also ranked 50th, just ahead of Michigan, in new business startups.

    Unlike my conservative friends, I do not think the fault lies entirely with the Democrats. Instead, it has to do with the total eclipse of the state’s once-lively two-party system. As Starr has noted, California’s golden age of governance from the 1940s to the 1960s was largely a bipartisan affair, with power shifting between the parties. "Despite their differences," Starr writes, "Democrats and Republicans saw sufficiently eye-to-eye" to embrace policies that drove California’s growth.

    Progressives, for their part, often suggest this paradigm died with the 1978 passage of Proposition 13, which diminished local government and concentrated fiscal power in Sacramento. Yet even as late as early 1990s, when the state was facing a dire recession due to the end of the Cold War, liberal Democrats such as Assembly Speaker Willie Brown and state Sen. John Vasconcellos managed to work well with Republican Gov. Pete Wilson and business leaders like Peter Ueberroth to force policy changes that helped spur the state’s last sustained recovery.

    The more recent demise of California governance stems from demographic trends and political miscalculations that have turned our state increasingly into something akin to Mexico under the old dictatorship of the PRI (Institutional Revolutionary Party). Wilson’s decision to embrace the anti-illegal-immigration measure Prop. 187 as part of his 1994 re-election strategy helped precipitate this shift. Although Prop. 187, which passed easily, helped in the short run, it crippled the Republican Party in the ensuing decades.

    Before 1994, Republicans were capable of winning upward of two-fifths of the Latino vote. But after that, as the Latino portion of the electorate grew, from 7 percent in 1980 to more than 21 percent today, these voters became, much like the African-American vote, essentially a bloc owned by the Democrats. In 2010, Jerry Brown won nearly two-thirds of their votes in his bid to return as governor. Asian voters, despite their decidedly middle-class and entrepreneurial bent, sensed the whiff of nativism among Republicans and also turned to the Democrats. With minority communities’ share of the electorate growing every year, the GOP essentially has backed itself into permanent minority status.

    This has set the stage for a bizarre political farce, where minority representatives in Sacramento – with few exceptions – consistently vote against the interests of their own constituents on issues such as water allocations in the Central Valley or regulations that boost energy and housing prices. In their clamor to join the "progressive" team, they, in effect, are placing the California "dream" outside the reach of the state’s heavily minority working class.

    It’s almost surreal to see people who represent impoverished East Los Angeles and Fresno, for example, vote exactly the same way as those who represent rich, white and older voters in Marin County and Westside Los Angeles. You don’t have to watch "Downton Abbey" to see "upstairs, downstairs" politics. Despite mouthing progressive rhetoric, California’s minority legislators seem intent of creating an increasingly feudalized California.

    And what of the middle class – once the bastion of both the GOP and the kind of "responsible liberalism" that promoted growth under the late Gov. Pat Brown? This largely Anglo group has been shrinking, both for decades as a percentage of California’s population and, during the past 10 years, in absolute numbers. From 2000-10 the number of non-Hispanic whites in the state dropped from 15.8 million to 14.95 million.

    Increasingly, the residual California middle class is either part of the public sector nomenklatura or the swelling ranks of retirees. These people often feel no compulsion to leave California for the reasons – such as weather and high property taxes – that drive their counterparts out of places like New York or Illinois. In contrast, the productive, working-age private middle class, harassed by taxes, regulations and soaring costs, increasingly appears more of an endangered species than the famed Delta smelt.

    Of course, there remain pockets of private sector strength, such as Silicon Valley and Hollywood, as well as the various biomedical and biotech companies that still thrive in places such as Orange County and San Diego. These, however, increasingly represent legacy industries, beneficiaries of past accomplishments and better entrepreneurial conditions. Yet, even here, despite the current tech boom, California’s position over the past decade has declined relative to more business-friendly states.

    In the immediate future, we should expect more of the same from our one-party government. Flush from the passage of Prop. 30, tax increases backed by public sector unions, there is little to restrain them beyond occasional resistance from Gov. Brown. Having made California’s income taxes the highest in the U.S., legislators and local officials are already busily concocting new taxes, fees and another spate of bond issues to prop up the nation’s most-cosseted public sector, and, of course, fund its rich pensions at the expense of mostly middle-class taxpayers.

    Indeed the emphasis on income taxes, representing now close to half of state revenue, creates perverse economic outcomes. With their funds hidden in overseas accounts and other dodges, Hollywood moguls and their Silicon Valley counterparts may hang around, mouthing progressive shibboleths while dining exquisitely. But there is clearly erosion among the less-glamorous entrepreneurial class. The number of households earning above $300,000 dropped by 45,000 from 2006-09, according to the Department of Finance, while those earning under $100,000 has grown by more than 180,000. It’s likely that Prop. 30 will accelerate this trend.

    But it’s not only taxes that will depress growth. Our Mad Hatter one-party, public-sector-dominated state seems keen to press its regulatory assault on employers and job creators. With climate change-related legislation certain to boost already high energy costs, we also can expect industries, from food processing to semiconductors and aerospace, to continue heading to friendlier locales.

    Unless these policies are challenged, California will continue to underperform well below its potential. Even worse, a state that created the modern American Dream of upward mobility will continue to devolve toward a kind of neofeudalism dominated by a few rich, with many poor and a well-fed, tenured government caste. The only way to halt this continuing farce in Sacramento is for Californians of all backgrounds to recognize that government that so earnestly claims to serve "the people" is doing anything but that.

    Joel Kotkin is executive editor of NewGeography.com and a distinguished presidential fellow in urban futures at Chapman University, and a member of the editorial board of the Orange County Register. He is author of The City: A Global History and The Next Hundred Million: America in 2050. His most recent study, The Rise of Postfamilialism, has been widely discussed and distributed internationally. He lives in Los Angeles, CA.

    This piece originally appeared in the Orange County Register.

  • The New Power Class Who Will Profit From Obama’s Second Term

    When President Obama takes the oath of office for the second time, he will also usher in a new era in American power politics. Whereas the old left-wing definition of “who rules” focused on large corporations, banks, energy companies and agribusinesses, the Obama-era power structure represents a major transformation.

    This shift stems, in large part, from the movement from a predominately resource and tangible goods-based economy to an information-based one. In the past, political struggles were largely fought over how to divide up the spoils generated by the basic productive economy; labor, investors and management all shared a belief in the ethos of economic growth, manufacturing and resource extraction.

    In contrast, today’s new hegemons hail almost entirely from outside the material economy, and many come from outside the realm of the market system entirely. Daniel Bell, in his landmark 1973 The Coming of Post-Industrial Society, may have been the first to identify this ascension to “pre-eminence of the professional and technical class.” This new “priesthood of power,” as he put it, would eventually overturn the traditional hierarchies based on land, corporate and financial assets.

    Forty years later the outlines of this transformation are clear. Contrary to the conservative claims of Obama’s “socialist” tendencies, the administration is quite comfortable with such capitalist sectors as entertainment, the news media and the software side of the technology industry, particularly social media. The big difference is these firms derive their fortunes not from the soil and locally crafted manufacturers, but from the manipulation of ideas, concepts and images.

    Apple, Google, Facebook, Amazon and Microsoft are far from “the workers of the world,” but closer to modern-day robber barons. Through their own ingenuity, access to capital and often oligopolistic hold on lucrative markets, they have enjoyed one of the greatest accumulations of wealth in recent economic history, even amidst generally declining earnings, rising poverty and inequality among their fellow Americans.

    Last year the tech oligarchs emerged as major political players. Microsoft, Google and their employees were the largest private-sector donors to the president. More important still, tech workers also provided the president and his party with a unique set of digital tools that helped identify potential supporters among traditionally uninformed and disinterested voters, particularly among the young.

    An even greater beneficiary of the second term will be the administrative class, who by their nature live largely outside the market system. This group, which I call the new clerisy, is based largely in academia and the federal bureaucracy, whose numbers and distinct privileges have grown throughout the past half century.

    Even in tough times, high-level academics enjoy tenure and have been largely spared from job cuts. Between late 2007 and mid-2009, the number of U.S. federal workers earning more than $150,000 more than doubled, even as the economy fell into a deep recession. Even as the private sector, and state government employment has fallen, the ranks of federal nomenklatura have swelled so much that Washington, D.C., has replaced New York as the wealthiest region in the country.

    As a former professor at the prestigious University of Chicago, and a longtime ally of public-sector unions, Barack Obama’s political persona is all but indistinguishable from these new hierarchies. Their support for him has become critical, particularly as the onetime “hedge fund candidate,” decided to wage a very effective class warfare campaign on the hapless Mitt Romney.

    This decreased Obama’s support among the plutocrats, even if they have thrived under his watch, but he made up for this in part by tapping bureaucracies that benefit from expanding government. Indeed the clerisy accounted for five of the top eight sources of Obama’s campaign funding, led by the University of California, the federal workforce, Harvard , Columbia and Stanford. Academic support for Obama was remarkably lock-step: a remarkable 96% of all donations from the Ivy League went to the president, something more reminiscent of Soviet Russia than a properly functioning pluralistic academy.

    To understand the possible implications of the new power arrangement, it is critical to understand the nature of the new clerisy. Unlike traditional capitalist power groups, including private-sector organized labor, the clerisy’s power derives not primarily through economic influence per se but through its growing power to inform opinion and regulate everything from how people live to what industries will be allowed to grow, or die.

    The clerisy shares a kind of mission which Bell described as the rational “ordering of mass society.” Like the bishops and parish priests of the feudal past, or the public intellectuals, university dons and Anglican worthies of early 19th century Britain, today’s clerisy attempts to impart on the masses today’s distinctly secular “truths,” on issues ranging from the nature of justice, race and gender to the environment. Academics, for example, increasingly regulate speech along politically correct lines, and indoctrinate the young while the media shape their perceptions of reality.

    Most distinctive about the clerisy is their unanimity of views. On campus today, there is broad agreement on a host of issues from gay marriage, affirmative action and what are perceived as “women’s” issues to an almost religious environmentalism that is contemptuous toward traditional industry and anything that smacks of traditional middle class suburban values. These views have shaped many of the perceptions of the current millennial generation, whose conversion to the clerical orthodoxy has caught most traditional conservatives utterly flat-footed.

    As befits a technological age, the new clerisy also enjoys the sanction of what Bell defined as the “creative elite of scientists.” Prominent examples include the Secretary of Energy, the Nobel Prize-winning physicist David Chu; science advisor John Holdren; NASA’s James Hansen; and the board of the U.N.’s Intergovernmental Panel on Climate Change. In the words of New York Times hyper-partisan Charles Blow, Republicans have devolved into the “creationist party.” In contrast Obama reigns gloriously hailed as “the sun king” of official science.

    Let’s be clear — this new ascendant class is no threat to either the “one percent,”  or even the much smaller decimal groups. Historically, the already rich and large economic interests often profit in a hyper-regulated state; the clerisy’s actions can often stifle competition by increasing the cost of entry for unwelcome new players. Like Cardinal Richelieu or Louis XIV’s finance minister, Jean-Baptiste Colbert, our modern-day dirigistes favor state-directed capital that has benefited, among others, “green” capitalists, Wall Street “too big to fail” firms and, of course, General Motors.

    More disturbing still may be the clerisy’s regal disregard for democratic give and take. Both traditional hierarchies, or new ones like the Bolsheviks after the 1917 revolution, disdain popular will as intrinsically lacking in scientific judgment and societal wisdom. Some leading figures in the clerisy, such as former Obama budget advisor Peter Orszag, openly argue for shifting power from naturally contentious elected bodies to credentialed “experts” operating in places Washington, Brussels or the United Nations.

    Such experts, of course, see little need for give and take with their intellectual inferiors, in Congress or elsewhere. This attitude is expressed in the administration’s increasing use of executive orders to promote policy goals such as better gun control, reduced greenhouse emissions or reform of immigration. Whatever one’s views on these issues, that they are increasingly settled outside Congress represents a troublesome notion.

    Like empowered bureaucrats everywhere, the clerisy also sometimes reserves a nice “taste” for themselves, much as the old bishops and upper clergy indulged in luxury and even prohibited pleasures of the flesh. Just look at the lavish payouts accorded to Orszag and Treasury Secretary-designate Jacob Lew, who, after serving in the bureaucracy, make millions off the same Wall Street firms that have so benefited from administration policies.

    So who loses in the new order? Certainly unfashionable companies  – oil firms, agribusiness concerns, suburban homebuilders — face tougher times from regulators and the mainstream media . But the biggest losers likely will be the small business-oriented middle class. Not surprisingly Main Street, far more than Wall Street, harbors the gravest pessimism about the president’s second term.

    The small business owner, the suburban homeowner, the family farmer or skilled construction tradesperson are intrinsically ill-suited to playing the the insiders’ game in Washington. Played up to at election time, they find their concerns promptly abandoned thereafter, outliers more than ever in a refashioned political order.

    Joel Kotkin is executive editor of NewGeography.com and a distinguished presidential fellow in urban futures at Chapman University, and a member of the editorial board of the Orange County Register . He is author of The City: A Global History and The Next Hundred Million: America in 2050. His most recent study, The Rise of Postfamilialism, has been widely discussed and distributed internationally. He lives in Los Angeles, CA.

    This piece originally appeared at Forbes.com.

    Official White House Photo by Pete Souza.

  • Will Driverless Cars Help us Drive Less?

    The war on automobiles is real. Backed by a legion of city officials, environmentalists, and new urbanists, the argument to mitigate vehicle usage has so far been an easy sell – at least in planning circles. Their assumptions echo concerns about the trajectory American cities – the downfall of rural life and open space to name a few.  The problem is the trifecta of pollution, congestion, and urban sprawl. Out with cars, they propose – people could ride high-speed transit instead of sitting in traffic.

    But technical innovation could make this proposal more like a plea. Google, along with GM, Ford, and Daimler are now designing cars that drive themselves, making private vehicles more efficient, flexible, and thereby more irreplaceable. The US is not alone. Manufacturers in Japan and Germany are coordinating with their national government to launch their autonomous cars within the next decade. IEEE, a group of technology professionals, says that self-driving vehicles would comprise 75 percent of the global traffic stream by 2040. 

    “Currently, a car spends 96% of its time idle,” says Koushik Dutta of ClockworkMod. He says there’s an unforgiving economic incentive to make sure an airplane is always in use, since they spend almost their entire lifetime in operation. To leave a plane idle is inefficient and unprofitable; similar logic applies to parked car. Some predict the autonomous vehicle technology will decrease this idle time as households begin to link their commutes in one car, rather than one car per person. Sergey Brin, Google’s cofounder, believes the technology, now tangible, will be on the market in five years.

    But what precisely is this new technology? As it turns out, much of it is not new; a number of automated features can be found in today’s cars: timed braking during collisions, motion sensors that detect distance between the vehicle and what’s in front of it, and adaptive cruise control. Many of the latest features have applications that use advanced sensors to self-park and prevent drifting to adjacent lanes and self-park.

    Unprecedented is the use of a network for vehicles to communicate with one another. A study finds that if vehicles use sensors alone, highway capacity can increase by 43 percent, and if all of the vehicles use both sensors and vehicle-to-vehicle (V2V) communication, the increase swells to 273 percent. Additionally, networks can facilitate information exchange between vehicles and road infrastructure (V2I). With live data streams, cars will be able to inform one another about oncoming traffic, and perhaps even instinctively reroute the car onto less congested roads.

    The move to driverless cars will make the private vehicle much more attractive compared to other modes of travel. This is particularly important for older drivers whose ability to drive has diminished; the coming of driverless cars brings them back onto the road. Less reliant on their friends and family as chauffeurs, boomers may happily embrace the ability to travel further and more frequently.

    This appeal will extend to all generations. The driverless car offers the current conveniences of the private auto – such as door-to-door travel, safety, and status – while reducing its level of risk and mental stress. Also, the stigmas of driving are eased; self-driving cars are expected to be more eco-friendly, time-efficient, and user-friendly. Once on the market, driverless technology will change lives by saving lives. Advocates of self-driving cars believe that with less human operation and more automated maneuvering on the road, fewer accidents will occur.

    But before autonomous cars can save lives, it must squirm through some political barriers. For one, city officials in large metropolitans are glued to the idea that the best communities exemplify mixed used, high-density, transit-oriented development. Hoping to reverse the still far from over exodus to the suburbs, cities like Los Angeles are banking on public transit to revitalize its inner-urban areas. Though public transit ridership has increased in the last two decades, its market share of ridership has being declining. Metropolitan officials hope that millennials, who tend to be more cognizant of mankind’s carbon footprint, will reverse the trend. It is, however, difficult to imagine why any future generation would enjoy the conveniences of taking transit if a car ride can be just as untroubled. Driverless will make vehicle ownership much more attractive. Public transit will lose its status as an amenity. One of the chief advantages of public transit is the fact that one can ride it stress free without worrying about maneuvering to the destination. With driverless cars, this advantage is superseded.

    Congestion may increase because more vehicles will find the frustrations of wading in traffic mitigated. Time in congestion can be replaced with a book, movie, perhaps even a nap. But there’s also the possibility that more households will link their trips using one shared vehicle, decreasing the number of vehicles on the road. Some suggest this may help Americans come to terms with letting go of the private vehicle and, instead, embrace the idea of having one household vehicle, a prevailing trend across the rest of the world.

    Transportation planners often promote tolls as revenue sources because building high-occupancy and toll (HOT) lanes. The concept is deemed equitable since it links the payers with the users, begetting a sustainable funding model. Much of the funding for these projects is based on the congestion premium – what people will pay to avoid a crammed highway. This is useful in determining how much to price a toll or high-occupancy lane. But since driverless technology will likely lower this premium, the revenue of these lanes may be overvalued.

    With the pieces in place, the journey to driverless cars is vastly feasible. In September 2012, California Governor Jerry Brown enacted a state measure to legalize driverless technology in cars running on public roads; at any given moment, a dozen driverless cars are operating somewhere in California. Currently, each vehicle is manned by two testers and marked by a distinguishable license plate. In the future, the vehicle will only be required to have a one driver. And not too far is the idea of a completely unmanned vehicle, what some call the robocar, which will revolutionize not just our mode of travel but our relationship with time and distance.

    Jeff Khau graduated from Chapman University with a degree in business entrepreneurship. Currently, he resides in Los Angeles where he is pursing his dual-masters in urban planning and public policy at the University of Southern California.

    Retrofitted driverless Lexus photo by WikiCommons user Steve Jurvetson via Mariordo.

  • Rust Belt Cities: Invest in Odysseus, Not Barney Fife

    Given its legacy of shrinking, the Rust Belt has issues. The issues arose naturally, and relate to the fact things leave, or that so much has left. Particularly, when things leave, the mind—both the individual and the collective city mind—can get protective and restrictive. Neediness arises. The smell of desperation ensues like a pall that can tend to hang over cities, influencing decision making on all levels.

    Enter “brain drain”, or that term coined to refer to the outmigration of an area’s educated citizens, particularly it’s young. You know the drill: Johnny goes to State college, comes back home for a spell, but then leaves Cleveland, Ohio for Chicago or New York. That is brain drain. And city leaders hate it, spending billions of dollars to stop it—often at the cost of coming off ridiculous, lame.

    For instance, in Pittsburgh, there was a civic booster campaign thought up to keep educated folks from going. It was called “Boarder Guard Bob”. According to researcher Chris Briem, “Bob” was a Smokey-the-Bear-type of public service announcement made into a Barney Fife character, with the billboard-size messaging of “Bob” intended to “stop young people at Western Pennsylvania’s borders before they had a chance to leave for other cities”. And while this particular retention strategy (luckily) never went to print, various “plug the brain drain” strategies persist in one form or another at exorbitant cost to taxpayers.

    But beyond the near-pitiful messaging, there are major problems with the brain drain approach, especially from an economic development perspective. For example, when, as a community, you are intentionally telling your citizen’s not to go, you are asking them to sacrifice personal development for the benefit of a place. To this point, my colleague, Jim Russell—a leading thinker in brain drain boondoggles and blogger at Burgh Diaspora—says it best, stating: “Discouraging geographic mobility is the same as restricting access to higher education”. In other words, it’s like telling Johnny to stick with his high school diploma so as to forego leaving the community for a 4-year degree.

    What’s more, getting people to stay put does little to grow a local economy. In fact it hurts it. Because leaving home is often a rite of passage. It develops a person. I mean, can you imagine if there was no odyssey in the epic Odyssey? If so, Odysseus wouldn’t be the changed man with perspective and experience as he was when he returned back to his homeland, and so there’d be no “there” there. In this sense, the Rust Belt needs to engage their young to embark on their own “Hero Journey” if only to gain skills and broaden geographic connections. This is international economics 101 (see China, India, Brazil, etc.). It should be a domestic economic priority for the Rust Belt, and it would be if only the Cleveland’s of the world could let go of the protectionism that defines their longstanding existential fears of shrinking into one big pile of ruin porn.

    Of course confidently encouraging outmigration is part and parcel with an understanding that many expats will “boomerang” back. But many are, and at a faster rate. To wit: as the alpha cities of the America like NYC get too expensive or creatively-class cute, many Rust Belt refugees are pivoting back from a certain left-wanting lifestyle if only for the opportunity, tradition, and honest-to-god reality that is “Rust Belt Chic”. And when they do, they often become “economic ass kickers”, which is term Russell uses to exemplify the fruits of the Hero Journey that is not only individually experienced, but felt in the local economy as well.

    Take Sean Watterson, the co-proprietor of the wildly successful restaurant the Happy Dog on Cleveland’s Near West Side. He moved back from D.C. because, according to a recent Plain Dealer article, “Cleveland-ness is like Polish-ness or Irish-ness. It’s an ethnicity”. Here, Watterson not only runs a great hot dog business, but uses his establishment to advance a circulation of ideas by hosting a variety of events like “Life, the Universe, and Hot Dogs”, which is a series hosted by researchers from the Institute for the Society of Origins. Another big hit is the live performances by members of the Cleveland Orchestra called Classical Revolutions.

    Cool sounding events, sure. But there is more to it than that, as such happenings spark cross-fertilization between parts of Cleveland—the blue collar West Side and the intelligentsia of the East Side—that have long been divided, often at the cost of Cleveland as a place of cultural and economic innovation. And how exactly does Watterson’s own “Hero Journey” come into play in his self-stated goal to break down barriers “between east and west and between high culture and low culture”? It likely relates to the fact he experienced experience outside of a legacy city bubble that enabled him to see and cross bridges that others have difficulty envisioning.

    Now, does this mean that cities simply need to let people leave to prosper? Obviously not. If the place expats are boomeranging back to is stagnant and disparate, with openness and connection disabled by a collective insular mentality that: “that’s just the way things are done around here”, well, the boomeranging effect won’t hold. And the economic ass-kickers won’t ass-kick.

    The goal, then, of cities should be on fostering return migrant connections, or to know who they are, why they are there, and to help get them together so that their collective unchained perspective can pop bubbles of inert status quo. This need is real. For instance, take this first-hand return migrant account published in Rust Belt Chic by Dana Marie Textoris:

    Funny how your location-based identity, your physical and mental place in the world, can flip like a switch: Before I was a Clevelander managing to make it in San Francisco….right now I feel a lot like a San Franciscan stuck in Cleveland. In either place, I felt just a little bit Other. A bit of a novelty. Just a tad on the outside looking in. Where does that leave me? Where is home? As I type this, I realize, with sort of an internal groan, that the place I’m left in, the guide to what I’m searching for, is probably just right here, inside me, where my two lives — West Coast and Midwest — are now combined. I’m not really a true Clevelander anymore…I’ve picked up way too much San Francisco for that. The balance I’ve become, a little of this and that, is just what I’m hoping I’ll find, one day.

    So, to all Rust Belt cities—this is where your attention must be turned: not on the ones who are leaving for good reason, but on those returning who have not left for good. They have brought the path of their self-discovery back to your doorstep.

    Don’t close the door by screaming at the backs of others.

    Richey Piiparinen is a writer and policy researcher based in Cleveland. He is co-editor of Rust Belt Chic: The Cleveland Anthology. Read more from him at his blog and at Rust Belt Chic.

  • The California-China-CO2 Connection

    Michael Peevey, President of the California Public Utilities Commission, is sincere and concerned about CO2 emissions. At a recent presentation at California State University Channel Islands, he spoke about California’s efforts to limit emissions. He mentioned green jobs, but, to his credit, he did not repeat the debunked claim that restricting CO2 emissions will be a net job creator. He also acknowledged that it doesn’t much matter what California does, if China doesn’t change its behavior. It turns out that if California were to reduce its carbon emissions to zero, in about a year and a half global CO2 would be higher anyway, just because of the growth in China’s emissions.

    Peevey talked about California’s increasingly ambitious plans for carbon reduction in the future. The goals include returning to 1990-level CO2 emmisions by 2020, and then an 80 percent reduction by 2050, regardless of population changes.

    This is going to be expensive. And the price of some of the potential technology — such as capturing atmospheric CO2 and pumping it underground — will include a lot more than the direct cost. The ultimate costs will, unfortunately, include increased global CO2 emissions.

    Some readers will remember the first time Larry Summers, the former US Treasury Secretary (under Bill Clinton) put his public career at risk because of his bluntness. In 1991, while Chief Economist at the World Bank, Summers gained international notoriety by saying in a memo, “I’ve always thought that under-populated countries in Africa are vastly under polluted.”

    That was the first of many times that lots of people demanded his head. He’s since claimed that it was sarcasm, but I don’t believe it. I believe he meant that environmental quality is a luxury good; that poor people need things like food and shelter, and they don’t much care if they trash the environment in the process. So, if pollution were localized, the poor would gain jobs and the wealthy would have an improved environment. Presumably, each would be happier.

    Of course, that sounds terrible to most people. But that’s precisely what we are doing here in California, only we’re doing it worse.

    California, by making production so very expensive, is chasing producers to places with low pollution controls. It’s worse than the situation Summers describes, because carbon dioxide emissions do not remain local. They spread throughout the atmosphere. Perversely, California is causing a global increase in CO2 emissions by its regulations limiting CO2 emissions in California.

    The problem is the result of acting on the concept of Think Globally and Act Locally (TGAL). TGAL works when pollution is local. But when air pollution is free to float around the world, you have to have a different strategy, and get the most reduction for your investment.

    And you don’t get the most for your investment in California. In terms of carbon efficiency — the ability to generate output while emitting less CO2 — California is one of the world’s most efficient economies. Each new reduction in CO2 becomes increasingly expensive. That is, reducing emissions is subject to increasing marginal costs. Reducing carbon emission in California is really expensive because we’re so carbon efficient already. Reaching the 2050 goal will be incredibly expensive. Worse, it won’t do any good.

    It’s not as if California can really afford it. Last month, I participated in the South Coast Association of Governments (SCAG) Third Annual Economic Summit. This great event provided lots of information about the economic challenges facing Southern California. For example, we learned that Los Angeles County’s economy will probably not reach its pre-recession level of jobs until at least 2018 and perhaps not until 2020.

    That’s a sobering thought.

    California State Sen. Roderick Wright, D-Los Angeles, a powerful speaker, documented California’s industrial decline, and made an emotional appeal for polices that produce jobs. The audience gave Wright a rousing ovation, something quite rare at economic conferences. The problem is that the audience was comprised of economic development people. Too bad no one else was listening. It was poorly attended by policy makers. There were only a handful of elected officials.

    California’s economy is struggling, even if many in the political class refuse to acknowledge the fact. Because of that, our investments need to be wise. The correct strategy for California is global. We need to go looking for the low hanging fruit.

    The low hanging fruit is mostly in developing countries like China, India and Brazil. We’ve tried to get them to cut their emissions at Kyoto and the like, but they refused, pointing out that they are much poorer than the West, and that we were able to develop with lower-cost polluting industries. They have a point.

    We should help them cut their carbon emissions. Reducing a ton of CO2 emissions is far cheaper in China than in California. So, let’s reduce it there.

    There are political problems with this proposal. California’s carbon regulations were sold to the people on the absurd claim that the regulations would be profitable: better than low cost, better than a free lunch.

    The bigger problem would be convincing California voters to tax themselves to clean up Chinese factories. That seems to me to be an information dissemination problem. If Californians knew the true cost of the existing program, and how little reduction in global CO2 concentrations it brings, they might logically be willing to look at other approaches. If they knew how much more effective a dollar spent on Chinese emissions was than a dollar spent on California emissions, they might seriously consider the proposal. The proposal could always be sweetened by requiring that all the work be done by California companies.

    It would be good for Californians. It would be a big step towards restoring California’s economic vigor. It would make a serious dent in global CO2 concentration. It would be less costly than our current plan.

    Let’s do it.

    Bill Watkins is a professor at California Lutheran University. and runs the Center for Economic Research and Forecasting, which can be found at clucerf.org.

    Flickr photo by doc tobin: Smog on the Great Wall.

  • How Polarization Plays Out in Washington state: Voting for President and the Same-sex Marriage

    Washington may be a left coast “blue” state, but the geography of the voting well illustrates the national phenomena of intensifying polarization.  The division may be among individual people,   but also expressed in geographies down to precincts and census tracts. 

    The Washington 2012 elections provided ample data to assess this political and geographic divide. I review here the two most polarized races, for president (Obama vs. Romney) and for R74, to reaffirm the right to same sex marriage.  

    Here are a series of 6 maps, 3 for the presidential race, for the state as a whole, and for the greater Seattle area, and one showing just the extreme tracts for Obama in the Seattle area, and 3 for the R74 contest, for the state, for greater Seattle and again of just the extreme tracts, all in the city of Seattle.  These maps illustrate the extreme dimensions of polarization impacting the regions.         

    The results suggest three overlapping dimensions. The dominant one is itself ecological – that is the urban-rural, or better large dense metropolitan territory versus rural, small towns, with smaller cities and metropolitan suburbs in between, and less polarized geographically. The strongest correlations in demographic variables are transit use vs. SOV use, density, single persons, and multi-family versus mobile homes.  

    These factors apply to both the Obama race and for R74, but more strongly for Obama. The second dimension is of social liberalism, and is characterized by variables on household relationships, unmarried partners, gay and lesbian, education, e.g., share  with BA vs. with high school only, occupation, e.g., percent managerial professional vs. percent in laboring and construction occupations. The social divide also shows difference by age, those 20-34 more liberal, areas with high shares under 18, that is families, more conservative. This dimension too applies to both contests, but more strongly to R74. The third dimension is race, minority racial areas vs. more white areas, and positively correlated with support for Obama, although the Asian share is much more related to support for R74.  In Washington we will see that the racial dimension really is somewhat distinct from the urban-rural, as Obama did well, but R 74 did poorly in rural small town areas that are now heavily minority (Hispanic and Native American).

    In a few cases with a large difference should be noted. Areas dominantly white are non-supportive of Obama, but not opposed to R74.  Similarly, areas high in managerial-professional occupations and higher education generally are more correlated with support for R74, than for Obama.

    Obama carried Washington state by 464,000 votes, 56 to 44 percent, and R74 won by some 229000 votes, 54 to 46 percent.  Consider first the maps for Washington State as a whole, realizing that like the US as a whole, rural territory dominates most of the physical space.  I use the same intervals for mapping, so comparison is easier.  The main difference between the Obama and R74 maps is race and ethnicity – many of the lighter blue rural small town areas are  Native American Indian reservations, or strongly Latino areas, which voted for Obama, but also cast ballots overwhelmingly against R74, likely reflecting the role of local churches. Obama also did better than R74 in traditional logging areas of western Washington, a continuation of a long history of their identification with Democratic voting, but more conservative on the social issues like same sex marriage. 

    Rural to smaller city areas voting for both Obama and R74 include university towns, notably Pullman (Washington State in eastern Washington,  Bellingham  (Western Washington U), Olympia, the state capitol, and many areas of “spillover” of more educated and professionals, out of the Seattle core to desirable water and mountain environments, for retirement and second homes,    At the other extreme are two areas in western Washington which are extremely “red” , the Centralia area in southwestern Washington,  and the city of Lynden, up at the border with Canada, and still dominated by its Dutch Reformed church adherents.

    Turning to the equivalent maps for Obama and R 74 for the greater Seattle area, with two-thirds of the state population, the picture is broadly the opposite of that for the state. Here blue dominates, with “red” areas pushed to the rural edge.  But the differences in the maps are interesting, illustrating the dimensions of polarization.  The Obama map exhibits a simpler belted pattern, the dense urban core, the city of Seattle with spillover north and south, with an inner suburban belt of moderate Obama domination (60 to 75 percent) and an outer suburban and exurban ring. This pattern was repeated for the city of Tacoma to the south. To the west, however, are two islands of very high Obama support, Vashon and Bainbridge, with very high proportions of professionals commuting to the Seattle core. Areas of support for Romney include a few fairly close in affluent areas and more rural areas, including actual farming areas to the southeast.

    The map for R74 is subtly different. The area of strongest support is reduced to the city of Seattle, plus the commuter islands, but support for R74 is quite a bit weaker in less affluent and educated black and latino areas. Likewise the majority of inner suburban areas are still supportive for Obama but far less than the core. These are mainly family areas, while the areas of highest support in the city are dominated by singles and childless couples, including unmarried partners.

    Conversely, moderately higher support for Obama and R74 extends somewhat farther east to affluent educated suburbs, e.g, the Microsoft workshed, which is also high in Asian population.  The final two maps are of the tracts with the highest support for Obama and for R74, most of which are confined to the city of Seattle. The areas of over 90 % support are two: the historic CD or Central District, which defined the Seattle Black population as of 1970-1980, not much gentrified at the north end, but also including the core of Seattle’s GLBT community (the westward extension over 90 %. The second area is in near north Seattle, extending from west of the University of Washington westward  in areas dominated by young singles and unmarried couples, including many students. The map for R74 is quite different, with no areas of extreme support to the south of the core GLBT area, but with stronger support than for Obama in the highly affluent and professional areas, just north of the GLBT core.

    Clearly the 3 dimensions of polarization, by settlement type, by social values-education, and by race, all are exemplified by the map results. The geographic concentration of the vote, especially for R74 can be seen in these amazing numbers:

    Vote Results in Washington State
    State State Outside King Co. King Co Seattle King Co. Outside Seattle
    Obama 1,755 1,087 668 279 389
    Romney 1,291 1,015 276 46 230
    Difference 464 72 392 233 159
       
    R74 yes 1,660 1,021 639 274 365
    R74 no 1,431 1,107 315 57 258
    Difference 229 -86 324 217 107


    Obama carried the state by 464,000. Half of this was accounted for by just the city of Seattle. The
    Pro vote for R74 was even more concentrated in the metropolitan core, as the margin just in the central  city of Seattle , 217,000, was essentially the margin for the state!  King County outside Seattle provided an additional margin of 107,000, offsetting a net loss of 86,000 in the entire rest of the state, where the vote was 1,107,000 to 1,021,000 against. 

    It is similarly amazing to note the relative location of areas with very high or very low vote shares for Obama and for R74.  Eighty-nine census tracts were carried by Obama with over 85% of the vote and 83 tracts voted more than 83 percent for R74. The distributions were:

    Number of Census Tracts Voting 85% for Obama or 83% for Measure R74
    Obama R74
    North Seattle 37 33
    Central Seattle 19 26
    South Seattle 26 1
    Pierce (Tacoma, reservation) 1  
    Whatcom (WWU) 2 2
    Whitman (WSU) 2 1
    Yakima (Reservations) 3  
    Thurston (Olympia) 1  

    Eighty-two of 89 of tracts with high Obama shares were in the city of Seattle, dominating the city and well distributed across it. The other 7 were in Tacoma, Olympia, Whatcom and Whitman, both university communities, and in Yakima county Indian reservations.  All these tracts were urban core tracts, except for those on the Yakama reservation.   Sixty of 63 tracts with the highest shares for R74 were in the city of Seattle,  concentrated in the north (University of Washington dominated) or highly professional, and in the center, home of the large GLBT community, with few in the south of the city, which is less affluent and higher in minorities.  The remaining 3 are in Whatcom (WWU) and Whitman (WSU). All these tracts are urban.

    The distribution of tracts with very low shares for Obama and for R74 shows the other side of the   polarization.  Of the 71 tracts where Obama received less than a third of the vote, 34 were in south central Washington, the region of the Tri Cities of Richland, Kennewick and Pasco, Yakima, county and Grant county, home of the Columbia basin irrigation project, all areas high in Mormon and Latino populations. Another 19 were in north central and northeastern Washington, including much of Okanogan and Lincoln counties, and even some exurban counties around Spokane. Another 8 were in southeastern Washington (wheat country), leaving 9 in western Washington.  Three each were in rural parts of Clark County and Lewis County in the southwest, and 3 were in the very conservative small city of Lynden, on the Canadian border, and home of a large Dutch reformed community. All these tracts are rural except for the city of Lynden and 3 suburban tracts in the Tri-Cities.

    Similarly, of 81 tracts with shares below one third for R74, 32 were again in south central Washington, 21 in north central and northeastern Washington, 4 in the southeast, and now a larger 15 in western Washington. The Lynden area of Whatcom county accounts for 4, but now 6 in socially conservative Lewis County, 4 in rural parts of Clark County, and 2 in family dominated military parts of Pierce County.  All these tracts are rural, small town, except for those in Lynden, again in suburban Tri-cities and 2 in suburban Tacoma.

    Differences between Obama and R74 Shares

    The last discussion compares the vote for Obama and for R74, identifying areas with the greatest difference, recalling that the overall correlation was a very high .87.  Please also see Map 7.

    The Obama vote exceeded the share for R74 by more than 20 percent in 56 census tracts.
    In rural areas Obama did well with the large Latino vote, which also voted against R74. This was true as well in Indian reservation tracts.  In Seattle and Tacoma the tracts are mainly lower to middle class, worker areas, Black or Latino or both.  All of the King county tracts were in south Seattle, extending southward into lower and middle class industrial suburbs.

    The R74 vote exceeded the Obama vote by 5% or more in 51 tracts.

    Overall, R74 fared better than Obama in affluent professional areas, socially more liberal but economically more conservative.  But the pattern surprisingly occurs in several military base areas, as in Island and Kitsap counties. In 15 tracts R74 won but Obama lost, all affluent suburb or military areas in several parts of the state.  In King the 4 tracts are the 2 richest tracts in the state plus 2 near the Microsoft Redmond campus.  In 12 tracts both Obama and R74 won, but R74 polled higher. These tracts were spread across the state, in mainly exurban economically conservative areas. In 24 tracts Obama and R74 won. All but one were in King, most in the professional suburbs east of Seattle and a few in the wealthiest tracts inside the city of Seattle.

    Conclusion

    The electorate of Washington, like that of the country, is ideologically divided, and which is manifest geographically in the familiar red and blue mosaics. Washington overall is on the economically and socially liberal side, although statewide maps would not recognize the degree of this, simply because of the extreme concentration of these sub-populations in the urban cores, and especially in and around the   city of Seattle.

    Richard Morrill is Professor Emeritus of Geography and Environmental Studies, University of Washington. His research interests include: political geography (voting behavior, redistricting, local governance), population/demography/settlement/migration, urban geography and planning, urban transportation (i.e., old fashioned generalist).