Blog

  • California’s Demographic Dilemma

    It’s been nearly 20 years since California Gov. Pete Wilson won re-election by tying his campaign to the anti-illegal immigrant measure Proposition 187. Ads featuring grainy images of presumably young Hispanic males crossing the border energized a largely white electorate terrified of being overwhelmed, financially and socially, by the incoming foreign hordes.

    The demographic dilemma facing California today might be better illustrated by pictures of aging hippies with gray ponytails, of legions in wheel-chairs, seeking out the best rest home and unemployed young people on the street corner, watching while middle-age families drive away, seeking to fulfill mundane middle-class dreams in other states.

    The vital, youthful California I encountered when moving here more than 40 years ago soon could be a thing of the past – if we don’t address the root causes of an impending demographic decline. The days of fast population growth have certainly passed; the state’s population growth barely equaled the national average in the past decade. In the urban strips along the coasts, particularly in the Los Angeles Basin, growth has been as little or half that level.

    To be sure, particularly in this region, few would want to see a return to breakneck population growth. But there’s little denying that California has shifted from a vibrant magnet for the young and ambitious to a state increasingly bifurcated between an aging, predominately white coastal population and a largely impoverished, heavily Hispanic interior. This evolution, as suggested in last week’s essay, has much to do with what passes for "progressive" policies – high taxation, regulation and an Ecotopian delusion that threatens to crush the hopes of many blue-collar and middle-class Californians.

    California’s consistent net outmigration over the past two decades continues, albeit at a slower rate. Over that period, California, notes a recent Manhattan Institute report, has lost a net 3.4 million people. This outflow has slowed with the recession and housing bust, but could swell again, as in the past, when the housing market recovers, and people can sell their homes.

    This long-term outmigration likely stems from a combination of persistently weak job growth, relatively higher unemployment rates amid generally far higher housing prices. Until 1970, notes demographer Wendell Cox housing prices in California, including Los Angeles and Orange County, were generally in line with national averages, adjusted for income.

    But over the past four decades, California’s housing prices relative to income have mushroomed to more than twice the national average. This is particularly true in places such as Orange County, where housing prices, particularly near the coast, are so high that younger even solidly middle-class families have little chance to enter the market.

    These high prices are the result not merely of market forces, but also the perverse impact of Proposition 13, which allows people to stay longer in their homes, as well as regulatory restraints on new housing construction. The regulatory vise, if anything, is almost certain to get worse as the state’s "climate change"-inspired regulations seek to all but ban new single-family house construction, all but guaranteeing higher prices.

    Until recently, the impact of net outmigration has been ameliorated by immigration, not just the kind memorialized in Wilson’s grainy ads but of the legal variety, as well. Over the past decade, however, immigration enforcement data indicates that California has suffered a gradual erosion in its appeal to immigrants; this is particularly true for the L.A. Basin. In 2000, for example, Los Angeles-Orange County received 120,000 new immigrants; a decade later the annual intake had dropped by 87,000.

    Essentially, immigration into the L.A. Basin fell 27.5 percent while immigration nationwide remained essentially stable; the numbers of Houston, Dallas, Seattle, Washington and New York, in contrast, remained level or grew.

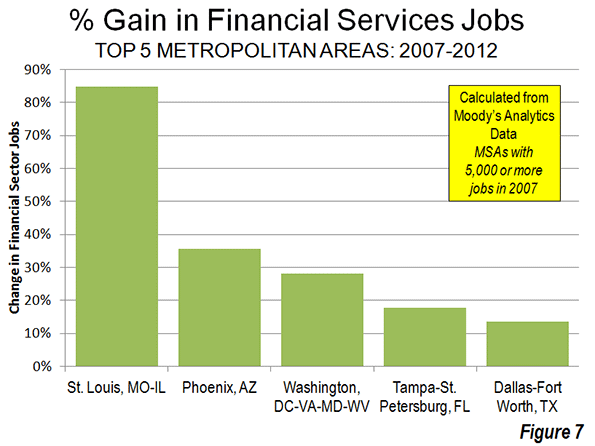
    Particularly troubling has been the relative decline in Asian immigrants, whose numbers now surpass Hispanics, and who also tend to be better educated than other newcomers. An analysis of migration of Asians conducted by demographer Wendell Cox, shows Asians heading increasingly to places like Houston, Dallas-Fort Worth, Raleigh, N.C., and Nashville, Tenn. Still home to the largest concentration of Asian-Americans, the L.A. Basin’s growth rate is now among the lowest in the nation, 24 percent in the past decade, compared with 39 percent in New York, and more than 70 percent in Dallas-Fort Worth and Houston.

    Some, like USC’s Dowell Myers, suggest slowing migration and population growth may actually be a positive, and claims "the demographic picture is brighter than it is has been in decades." He suggests that, rather than depend on the energy of newcomers, we now ride on "the skills of homegrown Californians."

    Certainly, slower growth may help with our traffic problems and even provide a break on housing inflation, but the contours of our demographics appear less than favorable. Over the past decade, for example, virtually all the largest metropolitan areas – including Silicon Valley – have seen slower percentage growth in college graduates than the national average. The big exception has been Riverside-San Bernardino, which started from a low base but has appeared to attract some college-educated people from the more expensive coastal regions.

    In contrast, largest rate of growth in educated people has taken place in regions such as Raleigh, N.C.; Austin, Texas, Phoenix and Houston; all these cities have increased the number of bachelor’s degrees at least one-third more quickly than the major California cities. Although California retains a strong educational edge, this is gradually eroding, particularly among our younger cohorts. In the population over age 65, California ranks an impressive fourth in terms of people with bachelor’s or higher degrees; but in the population under 35 our ranking falls to a mediocre 28th. If we are becoming more reliant on our native sons than in the past, we may be facing some serious trouble.

    This pattern can also be seen in those with graduate educations, where we are also losing our edge, ranking 19th among the younger cohort. More worrying still is the dismal situation at our grade schools, where California now ranks an abysmal 50th in high school attainment. Our students now rank among the worst-performing in the nation in such critical areas as science and math.

    If these issues are not addressed forcefully, what then is our demographic trajectory? One element seems to be a decline in the numbers of children, particularly in the expensive coastal areas. Over the past decade, according to the Census, the Los Angeles-Orange County region has suffered among the most precipitous drops in its population under age 15 – more than 12 percent – than any large U.S. metropolitan area.

    The numbers are staggering: in 2010 the region had 363,000 fewer people under age 15 than a decade earlier, while competitors such as Dallas-Fort Worth and Houston increased their youngsters by over 250,000 each. Orange County alone suffered an 8 percent decline in its under-15 population, a net loss of 54,000.

    If current trends continue, we may not be able to rely on immigrants to make up for an nascent demographic or vitality deficit. In fact, demographer Ali Modarres notes that L.A.’s foreign born-population is now older than the native-born, as their offspring head off for opportunities in lower-cost, faster-growing regions.

    Ultimately the state’s political and economic leadership needs to confront these demographic shifts, and the potential threat they pose to our prosperity. We can’t just delude ourselves that we attract the "best and brightest" from other states without creating improving the basics critical to families, from other states and abroad, such as education, reasonable housing costs and business climate. California ‘s beauty, great weather and a bounteous legacy remain great assets, but the state can no longer rest on its laurels if it hope to attract, and retain, a productive population capable of rebuilding our state’s now-faded promise.

    Joel Kotkin is executive editor of NewGeography.com and a distinguished presidential fellow in urban futures at Chapman University, and a member of the editorial board of the Orange County Register . He is author of The City: A Global History and The Next Hundred Million: America in 2050. His most recent study, The Rise of Postfamilialism, has been widely discussed and distributed internationally. He lives in Los Angeles, CA.

    This piece originally appeared in the Orange County Register.

    Photo illustration by krazydad/jbum

  • First Impressions of Rhode Island

    My latest post is online over at GoLocalProv. It is called “My First Impressions of Rhode Island” and is a first take on the Providence region after six months of living there. Here’s an excerpt:

    Thinking about it this way, the basic problem of Providence (and by extension the rest of Rhode Island) becomes obvious: it is a small city, without an above average talent pool or assets, but with high costs and business-unfriendly regulation. Thus Providence will neither be competitive with elite talent centers like Boston, nor with smaller city peers like Nashville that are low cost and nearly “anything goes” from a regulatory perspective. There’s little prospect of materially changing either the talent/asset mix or the cost structure in the near term even if there was consensus to do so, which there isn’t. So expect struggles to continue, even if there’s a bit of lift from a change in national macroeconomic conditions.
    ….
    But as a place to live, there’s a lot to enjoy about being here. One thing that has really surprised me is the people of Rhode Island. I come from the Midwest and the land of “Hoosier Hospitality.” I was thinking honestly it would be hyper rude and abrasive, like some stereotype of Boston. Yet the people of Rhode Island have been fantastic to me. And while the total talent pool (college degree attainment) is about average compared to peer cities, I’ve met some truly top notch people who would thrive in any city. The people of Rhode Island are really first rate.

    Click through to read the entire op-ed.

    Here are some related articles you might enjoy:

    New England vs. Midwest Culture
    Providence and the Virtues of Scale
    Is Providence the Rust Belt’s Most Northeasterly Point?
    A Quiet Revival in Providence
    Don’t Fly Too Close to the Sun

  • The Evolving Urban Form: Kuala Lumpur

    The Kuala Lumpur region of Malaysia is generally defined by the state of Selangor and two geographical enclaves (the federal territories of Kuala Lumpur and Putrajaya), carved from the state. These enclaves are the two seats of the federal government. Kuala Lumpur houses the national parliament and Putrajaya the executive and judicial branches.

    Population Growth in the Kuala Lumpur Region

    The Kuala Lumpur region had a population of approximately 7.1 million, according to the 2010 census. This includes 1.6 million in the federal territory (core city) of Kuala Lumpur and 5.5 million in the suburbs (which include Putrajaya). The region has experienced strong growth since modern Malaysia evolved between 1957 and 1963. In 1950, the region had only 900,000 residents. By 1980, the population had more than doubled to nearly 2.4 million and by 2010, the population had tripled from its 1980 level.

    Unlike many urban cores, the city of Kuala Lumpur continues to experience strong population growth. Since 1980 (the first census after the creation of the new territory), the city has experienced a population increase of 77 percent.

    Yet, the suburbs and exurbs (Note 1) have grown far more rapidly. The suburbs and exurbs have grown 280 percent and have added nearly six times the population increase of the city (Figure 1).  This general distribution of growth continued over the past decade, with the suburbs attracting 83 percent of the new population, while the city of Kuala Lumpur received 17 percent of the growth (Figure 2).


    The region continues to grow faster than the nation and at the current growth rate, the Kuala Lumpur region could approach a population of 10 million by 2025.

    The Urban Area

    The Kuala Lumpur urban area (area of continuous urban development) has an estimated population of 6.6 million (2013). Kuala Lumpur ranks as the 49th largest urban area in the world (Note 2). The urban area covers an estimated 750 square miles (1,940 square kilometers), ranking it 42nd largest in the world. The population density is 8,800 per square mile (3,400 per square kilometer). Among the 70 world urban areas with more than 5,000,000 population, Kuala Lumpur ranks 56th in population density, with approximately the same density as Western European urban areas in the same size classification (Figure 3).

    The highest population densities are in the city of Kuala Lumpur, at 17,300 per square mile (6,700 per square kilometer), approximately the density of the city of San Francisco. The suburban areas have a population density of 6,800 per square mile (2,600 per square kilometer), approximately five percent higher than the suburbs of Los Angeles (Figure 4).

    The Economy

    Kuala Lumpur is a prosperous region by developing world standards. Only high-income Singapore is more prosperous in Southeast Asia. According to the most recent Brookings Global Metro Monitor, Kuala Lumpur has gross domestic product per capita of $23,900 annually (based on purchasing power). This is higher than all metropolitan economies in Latin America other than Brasilia, Monterrey and Buenos Aires. If Kuala Lumpur were in China, it would rank in the top quarter of the richest per capita metropolitan economies (Note 3).

    The Setting

    The urban area stretches from the core of Kuala Lumpur more than 20 miles (32 kilometers) westward to Port Klang on the Strait of Malacca, with similar expanses to the north and south. The urban area stretches less than 10 miles into the Titiwangsa Mountains, which forms the central cordillera of the Malay Peninsula.

    Physical Description

    The Kuala Lumpur urban area is located in a densely forested tropical region. The urban areas somewhat low density has permitted retention of substantial greenery. As a result, Kuala Lumpur appears to be among the "greenest" urban environments in East Asia, and for that matter, in the world. The greenery is especially evident in residential areas, where most housing is either detached or row house (Photos).


    Detached housing

    Row Houses

    However, the greenery also extends to the central business district (Photo: Kuala Lumpur’s Green Central Business District), where the largest buildings are much less densely packed than in most large world cities. Kuala Lumpur’s central business district is home to the Petronas Towers (Photograph above), twin towers that became the tallest buildings in the world upon completion in 1998, displacing Chicago’s Sear’s Tower (now Willis Tower). The title was lost to Taipei’s Tower 101 in 2004.


    Photo: Kuala Lumpur’s Green Central Business District

    Kuala Lumpur is not monocentric. The central business district accounts for only 12 percent of regional employment, a figure that is projected to decline (Figure 5). The central business district share is slightly more than the United States average (10 percent) and less than the Western European average (18 percent).

    Transport

    The Kuala Lumpur region principally relies on personal mobility (cars and motorcycles) for its transportation. As late as 1985, 35 percent of travel in the Kuala Lumpur was by mass transit. By 2010, this had fallen to between 10 and 12 percent. This is after opening three metro lines, a monorail and three commuter rail lines, with the metro and monorail lines having opened since 1995. Kuala Lumpur’s mass transit market share is more reflective of a high-income nation region than a middle income nation, comparable to Sydney, Toronto or New York and one-third below that of Western Europe. However, Kuala Lumpur is much more transit dependent than most US metropolitan areas, at five to 10 times that of Los Angeles, Portland, Seattle, Dallas-Fort Worth and Phoenix.

    The Kuala Lumpur region is served by an extensive network of expressways. One segment includes the "SMART" tunnel, which is a 6 mile (10 kilometer) long tunnel that serves both vehicles and storm water. While the tunnel has levels dedicated to both vehicles and storm water, the entire tunnel can be converted to storm water usage when there is serious flooding.

    Prospects

    Kuala Lumpur seems well positioned for the future. As the urban area has expanded in population and land area, its populace has achieved a level of affluence toward which much of the world strives.

    Wendell Cox is a Visiting Professor, Conservatoire National des Arts et Metiers, Paris and the author of “War on the Dream: How Anti-Sprawl Policy Threatens the Quality of Life.”

    ——————

    Note 1: See "Definition of Terms used in The Evolving Urban Form"

    Note 2: The comprehensive Demographia World Urban Areas is published at least annually, with the next (9th) annual edition due in the Spring of 2013.

    Note 3: The ranking for Chinese metropolitan areas is adjusted, using the population figures from the 2010 census (which included the urban migrant population). The issue is described in Endnote 19 in the Brookings Global Metro Monitor.

    ——————-

    Photograph: Petronas Towers (all photos by author)

  • The New Places Where America’s Tech Future Is Taking Shape

    Technology is reshaping our economic geography, but there’s disagreement as to how. Much of the media and pundits like Richard Florida assert that the tech revolution is bound to be centralized in the dense, often “hip” places where  “smart” people cluster. Some, like Slate’s David Talbot, even fear the new tech wave may erode whatever soul is left to increasingly family free, neo-gilded age San Francisco.

    Such claims have been bolstered by the tech boom of the past few years — especially the explosion of social media firms in places like Manhattan and San Francisco. Yet longer-term trends in tech employment suggest such favored media memes will ultimately prove well off the mark. Indeed, according to an analysis by the Praxis Strategy Group, the fastest growth over the past decade in STEM (science, technology, engineering and mathematics-related) employment has taken place not in the most fashionable cities but smaller, less dense metropolitan areas.

    From 2001 to 2012, STEM employment actually was essentially flat in the San Francisco and Boston regions and  declined 12.6% in San Jose. The country’s three largest mega regions — Chicago, New York and Los Angeles — all lost tech jobs over the past decade. In contrast, double-digit rate expansions of tech employment have occurred in lower-density metro areas such as Austin, Texas; Raleigh, N.C.; Columbus, Ohio; Houston and Salt Lake City. Indeed, among the larger established tech regions, the only real winners have been Seattle, with its diversified and heavily suburbanized economy, and greater Washington, D.C., the parasitical beneficiary of an ever-expanding federal power, where the number of STEM jobs grew 21% from 2001 to 2012, better than any other of the 51 largest U.S. metropolitan statistical areas over that period.

    The question is whether the last two to three years, during which places like San Francisco, New York and Boston have enjoyed stronger STEM growth than their peripheries, represents a paradigm shift or is just a cyclical phenomenon. As with tech in general, the long-term trends are not so city-centric; over the past decade,  the core counties nationwide overall have lost about 1.1% of their tech jobs while more peripheral areas have experienced a gain of 3.5%.

    Today’s urban tech boom looks a lot like a rerun of the dot-com boom of the late 1990s. In that period media-savvy dot-com startups proliferated in such places as South of Market in San Francisco and the Silicon Alley in lower Manhattan. At their height, these firms and their founders were as likely to be covered in the fashion and lifestyle sections as on the business pages.

    Yet by the early 2000s, many of these dot-com darlings had merged, been acquired or simply gone out of business. Anchored largely on hype, they fell victim to flawed business models, and rapid industry consolidation.  In San Francisco, for example, tech employment crashed from a high of 34,000 in 2000 to barely 18,000 four years later. Silicon Alley suffered a similar downward trajectory, losing 15,000 of its 50,000 information jobs in the first five years of the decade.

    The peaking social media boom, marked by the weak performance of Facebook’s IPO last year, suggest another bust at the end of the “hype cycle.” Urban darlings such as  San Francisco’s Zynga and Chicago’s Groupon have floundered in spectacular fashion. More are likely to join them.

    These firms may have generated buzz, but they have done not so well at the mundane task of making money. One problem may be that  the most avid users of social media are largely young people from the “screwed” generation who lack much in the way of spending power — a clear turnoff to advertisers. Now , with venture capital flows declining overall,  cooler heads in the Valley are shifting bets to more business-oriented engineering and research-intensive fields more grounded in marketplace realities.

    And what about the future of the Valley — still home to virtually all the Bay Area’s top tech firms? Its glory days as a job generator and economic exemplar seem to have passed. Between 1970 and 1990 the number of people employed in tech in the Valley more than doubled to 268,000, and then burgeoned to over 540,000 in the 1990s. At the peak of the last tech boom in 2001, the unemployment rate in Santa Clara County was a tiny 3%; the Silicon Valley Manufacturing Group confidently predicted there would be another 200,000 jobs by 2010.

    However, at what may be the peak of the current boom, the number of tech jobs in the Valley remains down from a decade ago and unemployment is over 7.7%, just around the national average. In reality, social media was never going to reverse the downward trajectory in the rate of job growth. Old-line companies like  Hewlett-Packard or Intel, with over 50,000 employees in the U.S. alone, were capable of creating a broad range of opportunities for workers; in contrast, the social media big three of Facebook, LinkedIn and Twitter together have less than 6,500 employees.

    As the social media industry matures and consolidates,   employment is likely to continue shifting to less expensive, business-friendly areas. The Bay Area, where the overall cost of living is 68% higher than the national average and housing is the most expensive in the nation, may continue to attract and retain only the highest-end, best-paid workers. But for the most part they will follow the path of established tech firms such as  Apple, Intel, Adobe, eBay and IBM  to lower-cost places like Austin, Columbus and Salt Lake City. A similar phenomena also can be seen in other urban-centered industries, such as entertainment and finance where  virtually all employment growth is in places like St. Louis, Des Moines and Phoenix, even as the largest centers, New York, Chicago, Boston, Los Angeles and San Francisco have suffered significant job losses.

    Demographic forces may further accelerate these trends. The critical fuel for tech growth, educated labor, is now expanding faster in places like Columbus, Austin, Raleigh, Dallas and Houston than in Boston, San Jose and San Francisco. The old centers may still enjoy a lead in brains, but other places are catching up rapidly.

    Companies may also discover that with many millennials starting to hit their 30s, some may seek to leave their apartments to buy houses and start families. In California new local regulations essentially ban the construction of new single-family homes in some of the state’s biggest metro areas, pricing this option out of reach for all but a few, and forcing a key demographic group to seek residence elsewhere.

    Under these conditions, Silicon Valley will be forced to rely increasingly on inertia and mustering of financial resources than innovation. As a result, the nation’s tech map will continue to expand from the Bay Area, Boston, Seattle and Southern California to emerging metropolitan areas in North Carolina, Texas, Utah, Colorado and the Pacific Northwest. In the future parts of Florida, Phoenix, and even Great Plains cities like Sioux Falls and Fargo could also achieve some critical mass.

    Ultimately, one of the main dynamics of the information age — that even sophisticated tasks  can be done from anywhere — works against the dominion of single hegemonic industry centers like Wall Street, Hollywood and Silicon Valley. The tech sector is particularly vulnerable to declustering, due in large part thanks to the freedom from geography created by technologies of its own making.   Silicon Valley may continue to reap riches from the periodic technology  gold rush , but in the longer term, tech growth will continue its long-term dispersion to ever more parts of the country.

    STEM Occupations in the Nation’s 51 Largest Metropolitan Areas
    MSA Name 2001 – 2012 Growth 2005 – 2012 Growth 2010 – 2012 Growth 2012 Location Quotient LQ Change, 2001 – 2012
    Washington-Arlington-Alexandria, DC-VA-MD-WV 21.1% 12.7% 3.7% 2.19 10.6%
    Riverside-San Bernardino-Ontario, CA 18.6% -1.4% 2.2% 0.57 1.8%
    San Antonio-New Braunfels, TX 18.3% 17.2% 4.5% 0.83 1.2%
    Baltimore-Towson, MD 17.9% 11.4% 3.9% 1.37 15.1%
    Raleigh-Cary, NC 17.9% 14.6% 6.2% 1.53 0.0%
    Las Vegas-Paradise, NV 17.2% -2.6% 0.8% 0.52 4.0%
    Salt Lake City, UT 16.3% 18.1% 7.4% 1.16 4.5%
    Houston-Sugar Land-Baytown, TX 15.7% 17.2% 6.6% 1.20 -2.4%
    Seattle-Tacoma-Bellevue, WA 15.4% 22.2% 6.7% 1.86 8.1%
    Jacksonville, FL 13.0% 6.5% 2.4% 0.87 8.7%
    Austin-Round Rock-San Marcos, TX 12.2% 17.2% 9.1% 1.82 -8.5%
    San Diego-Carlsbad-San Marcos, CA 11.3% 8.0% 2.1% 1.38 6.2%
    Columbus, OH 10.4% 12.8% 4.7% 1.27 7.6%
    Orlando-Kissimmee-Sanford, FL 9.4% -1.1% 0.8% 0.84 -3.4%
    Indianapolis-Carmel, IN 6.9% 6.5% 2.7% 1.04 2.0%
    Nashville-Davidson–Murfreesboro–Franklin, TN 6.7% 3.5% 2.4% 0.77 -1.3%
    Sacramento–Arden-Arcade–Roseville, CA 6.4% 3.5% 0.4% 1.33 2.3%
    Oklahoma City, OK 5.5% 9.6% 6.4% 0.89 -1.1%
    Pittsburgh, PA 5.3% 10.3% 4.9% 1.07 5.9%
    Virginia Beach-Norfolk-Newport News, VA-NC 4.8% 2.3% 0.5% 1.10 3.8%
    Charlotte-Gastonia-Rock Hill, NC-SC 4.3% 8.2% 5.7% 0.99 -3.9%
    Kansas City, MO-KS 4.0% 5.8% 4.6% 1.12 4.7%
    Richmond, VA 3.8% 4.4% 3.4% 0.99 0.0%
    Cincinnati-Middletown, OH-KY-IN 3.7% 5.5% 6.8% 1.02 4.1%
    Buffalo-Niagara Falls, NY 3.2% 6.4% 3.6% 0.90 4.7%
    Dallas-Fort Worth-Arlington, TX 3.1% 11.4% 5.5% 1.19 -5.6%
    San Francisco-Oakland-Fremont, CA 2.5% 15.0% 9.9% 1.63 5.8%
    Phoenix-Mesa-Glendale, AZ 2.3% 3.5% 3.9% 1.05 -6.3%
    Minneapolis-St. Paul-Bloomington, MN-WI 2.2% 6.7% 5.9% 1.31 1.6%
    Portland-Vancouver-Hillsboro, OR-WA 1.6% 6.4% 5.4% 1.19 -3.3%
    Louisville/Jefferson County, KY-IN 0.9% 9.6% 6.9% 0.76 0.0%
    Denver-Aurora-Broomfield, CO 0.5% 10.8% 3.7% 1.43 -2.1%
    Atlanta-Sandy Springs-Marietta, GA -1.0% 5.5% 6.5% 1.07 -2.7%
    Boston-Cambridge-Quincy, MA-NH -1.3% 11.2% 6.0% 1.64 -1.2%
    Providence-New Bedford-Fall River, RI-MA -1.5% -1.6% 1.9% 0.88 2.3%
    Philadelphia-Camden-Wilmington, PA-NJ-DE-MD -2.8% -1.4% 1.4% 1.06 -1.9%
    Hartford-West Hartford-East Hartford, CT -4.5% 1.5% 0.3% 1.10 -3.5%
    New York-Northern New Jersey-Long Island, NY-NJ-PA -4.6% 2.8% 3.2% 0.90 -6.2%
    St. Louis, MO-IL -4.8% -1.7% 1.4% 1.05 -0.9%
    Milwaukee-Waukesha-West Allis, WI -6.1% -0.8% 4.0% 1.00 0.0%
    Tampa-St. Petersburg-Clearwater, FL -6.3% -4.3% 2.5% 0.89 -3.3%
    Miami-Fort Lauderdale-Pompano Beach, FL -6.4% -8.3% 0.6% 0.67 -8.2%
    Los Angeles-Long Beach-Santa Ana, CA -7.1% -3.5% 3.1% 0.98 -5.8%
    Memphis, TN-MS-AR -7.3% -4.0% 0.7% 0.62 -4.6%
    Cleveland-Elyria-Mentor, OH -8.8% -2.1% 4.3% 0.89 1.1%
    Chicago-Joliet-Naperville, IL-IN-WI -10.8% -1.4% 3.5% 0.87 -7.4%
    Birmingham-Hoover, AL -11.4% -8.0% -2.0% 0.76 -8.4%
    Rochester, NY -12.0% -2.1% 4.1% 1.14 -10.2%
    San Jose-Sunnyvale-Santa Clara, CA -12.6% 12.4% 8.3% 3.18 -4.8%
    New Orleans-Metairie-Kenner, LA -16.0% -7.4% -2.4% 0.74 0.0%
    Detroit-Warren-Livonia, MI -17.7% -10.3% 10.5% 1.42 -3.4%
    Analysis by Mark Schill, Praxis Strategy Group
    Data Source: EMSI 2012.4 Class of Worker – QCEW Employees, Non-QCEW Employees & Self-Employed 

    The LQ (location quotient) figure in the table above is the local share of jobs that are STEM occupations divided by the national share of jobs that are STEM occupations. A concentration of 1.0 indicates that a region has the same concentration of STEM occupations as the nation. The analysis covers 80 STEM occupations in all industries.

    Joel Kotkin is executive editor of NewGeography.com and a distinguished presidential fellow in urban futures at Chapman University, and a member of the editorial board of the Orange County Register . He is author of The City: A Global History and The Next Hundred Million: America in 2050. His most recent study, The Rise of Postfamilialism, has been widely discussed and distributed internationally. He lives in Los Angeles, CA.

    This piece originally appeared at Forbes.com.

    Computer engineer photo by BigStockPhoto.com.

  • Globalization: Too Many Americans Are Dropping Under the Radar

    By the time I arrived in Silicon Valley in 1986 California’s middle class economy was already being remade by globalization. Globalization’s dramatic impact on northern California hit me square in the face the moment I arrived at my first career expo later that year at the Westin Hotel in Santa Clara. There I found myself surrounded by a multitude of H‑1B workers from all over the world, excitedly speaking in a myriad of languages. I was staggered. Born in the U.S.A., I felt like a foreigner in the land of my birth.  

    In this new Pacific Rim "promised land," an American-born engineer residing in Palo Alto would need four or five times his annual salary to purchase the same home his father had gotten with only two. Valley infrastructure was not keeping up with the expanding population and the inevitable supply-demand dynamic was rapidly dividing the middle class into winners and losers. The winners would enjoy at least a 4-bed/3-bath/2-car home and early retirement; the losers would compete for tiny 1-bed condos. This trend has not only continued but is escalating across a variety of benchmarks—both in the Valley and all over America.

    Now, let’s get close to the ground and see if we can find who’s been dropping under the radar.

    Some Are Hot, But Most Americans (Particularly White Males) Are Not

    Half of Silicon Valley’s technology workforce is now Asian, and many come from abroad. This was already the case among software development engineers back in 1990 when I was working for Consilium. Hispanics, Latinos, and African-Americans are all losing ground, though not as quickly as whites.

    US taxpayers have unknowingly funded a training program called JEEP to train foreign Asian students for jobs in some booming career fields such as offshore call centers that serve US businesses. As a result, according to Congressman Tim Bishop (D-New York), American workers have lost some five hundred thousand jobs in just five years.

    Last November figures obtained from inside IBM seemed to indicate that for the first time more of the tech giant’s workforce would be employed in India than in the US. Of IBM’s total global workforce of 430,000 less than one quarter now work in the US. IBM benefits from the hefty difference in employee salaries, which can amount to as much as $100,000 per year.

    All this cost-cutting from H-1B work visas, outsourcing, and offshoring is having a leveling impact on US wages, including among technology specialists such as software development engineers and project managers—even though new technology developments continue at a breathtaking pace.

    Age-Related Losers, Old and Young

    When I arrived, you could see how youth-obsessed 80s Silicon Valley was. It still is, only more so. In her article Silicon Valley’s Dirty Secret: Age Bias, Sarah McBride details a number of cases of age-related bias that show how much tougher it is for the over-40 techie to find her next job than for the 20s person, even from another country. I know Age-bias first-hand. One day in 2002, while a technical writer for startup E2open, I was confronted by two young  engineers: "What’s an over-40 dude doing here—aren’t you retired yet?"

    It’s not just Silicon Valley anymore. A 2012 United States GAO report noted that   "…long-term unemployment has particularly serious implications for older workers (age 55 and over). Job loss for older workers threatens not only their immediate financial security, but also their ability to support themselves during retirement."

    Think you’re too young to worry about age? Think again. Even pretty young women might not be quite good enough in the brave new world. In 2011, clothing giant H&M reported that they are now using "perfect" virtual models—not real humans—for their online shopping site.

    Globalization’s Broadband Impact on America

    In The Slow Disappearance of the American Working Man, Bloomberg Businessweek Magazine (Aug. 2011) highlights the particularly devastating impact on the American male worker.

    • "The portion of men who work and their median wages have been eroding since the early 1970s."
    • "The portion of men holding a job—any job, full or part-time—fell to 63.5 percent in July 2012."
    • "These are the lowest numbers in statistics going back to 1948."
    • "Among the critical category of prime working-age men between 25 and 54, only 81.2 percent held jobs."
    • "To put those numbers in perspective, consider that in 1969, 95 percent of men in their prime working years had a job."
    • "After accounting for inflation, median wages for men between 30 and 50 dropped 27 percent"…putting them "back at their earnings capacity of the 1950s."

    In Race Against the Machine (2011) MIT’s Erik Brynjolfsson and Andrew McAfee show how jobs formerly enjoyed by the median US worker are now being lost to cutting-edge technologies. Artificial Intelligence (AI) is to today’s white collar STEM worker what robotics was to many blue collar workers.   We were already advancing this trend at Oracle in 1990 with the development of our SQL*Forms application generator, obviating the need for thousands of application developers.

    A number of disturbing statistics indicate that US workers are now both producing and earning less.
    The Central Intelligence Agency World Factbook ranks the United States 11th in the world in GDP per capita. We used to be number 1. This figure indicates that while rich Americans keep getting ever richer, the middle class is producing less and less per capita. The US-born middle class worker keeps on sinking.

    A recent National Employment Law Project report indicates that the current "recovery" continues to be slanted toward low-paying jobs, reinforcing the mounting inequality s. The fastest growing low-wage jobs include retail salespeople, food prep workers, waiters and waitresses, laborers and freight workers, office clerks and customer representatives, and personal and home care aides—mostly paying median hourly wages between $7.69 and $13.83 per hour. Is this America’s new path to "prosperity?"

    The Organization for Economic Co-operation and Development (OECD) reports, amazingly, that the United States actually has a higher percentage of workers doing low-wage work than any other major industrialized nation:

    The Future: Dimmest for the Brightest, Brightest for the Dimmest?

    Last year a NY Times article covered the appalling plight of recent college grads. Half of today’s graduates are jobless or underemployed. They are more likely to be employed in jobs not requiring a college diploma—such as receptionists, cashiers and food-service helpers—than as engineers, physicists, or computer professionals.

    And while Americans are busy paying for US corporations to move work to Asia, US federal employment accounts for the entire net increase in jobs since at least 2008. Washington’s cure to de-industrialization of the US has been to expand government payrolls. But is the creation of more and more "security" jobs and unnecessary bureaucracy the proper cure for persistent unemployment and swelling welfare rolls?

    Where Do We Go From Here?

    All of the benchmarks point to the unavoidable conclusion that ever more Americans are simply dropping under the economic radar screen. This includes some very broad downtrends for American workers of all races; "older" workers; young workers who perform work that robotics and AI are learning to do more cost-effectively; the American male workforce and  middle income workers in general; and even recent college graduates. With neither the free market or   government helping very much the message seems quite clear: globalization’s losers must get organized and work together for improved economic opportunity.

    Rob Argento is a senior technical writer and project leader with a background in aerospace engineering and some 18 years in Silicon Valley with Oracle, Xerox, Microsoft, and Sony. His broad industry experience includes NASA, e-commerce, US Navy, Biotech, and PC Games. He has degrees in physics and theological studies.

    Global population photo by Bigstock.

  • The Dispersion of Financial Sector Jobs

    When you think of financial services, one usually looks at iconic downtowns such as New York’s Wall Street, Montgomery Street San Francisco’s or Chicago’s LaSalle Street. But since the great financial crisis of 2007-8 the banking business is on the move elsewhere. Over the last five years (2007 to 2012), even as the total number of financial jobs has declined modestly, they have been growing elsewhere.

    This is the conclusion of an analysis of data supplied by Moody’s Analytics for an article in The Wall Street Journal ("Meet Them in St. Louis: Bankers Move). This analysis adjusts the data provided by Moody’s Analytics, combining portions of metropolitan areas (called "metropolitan divisions")into their complete metropolitan areas (See Note 1).

    The financial sector tends to be comparatively concentrated. In 2007, approximately one-third of the financial sector jobs reported by Moody’s were located in the New York metropolitan area. New York is the home of one of world’s largest financial sector hubs, Manhattan.

    New York: Financial Sector Employment Losses and Dispersion

    However, the New York metropolitan area and the other four largest concentrations of financial sector jobs – New York, Chicago, Boston, Los Angeles and San Francisco – accounted all of the net job losses over the period. Between 2007 and 2012, the five largest financial sector markets, lost 39,000 jobs. Outside these five metropolitan areas, the number of financial sector jobs increased by 12,000 (Figure 1).

    The extent of this dispersal away from the five most concentrated markets is illustrated by the decline in their financial sector jobs compared to the other metropolitan areas. In 2007, the five most concentrated markets had 32,000 more financial sector jobs than the other metropolitan areas. By 2012, the other metropolitan areas achieved a total number of 19,000 more financial sector jobs than the five most concentrated markets (Figure 2).

    The dispersion of financial sector jobs is evident even within the New York area itself. The central metropolitan division of the New York metropolitan area (New York-White Plains-Wayne), which includes Manhattan, lost 19,000. However, the balance of the New York metropolitan area experienced a 2500 increase in financial sector jobs, resulting in a overall loss of 16,500 jobs in the metropolitan area

    Not all of the New York metropolitan area jobs were lost to places like Dallas-Fort Worth and Des Moines. The balance of the New York combined statistical area (formerly called consolidated metropolitan statistical areas) added 2000 jobs, principally in the Bridgeport (Fairfield County, Connecticut) metropolitan area (Figure 3). Thus, while the core of the New York metropolitan area was losing 9 percent of its financial sector jobs, the more suburban balance of the combined area gained 11 percent, even as the total region lost employment.

    California: Substantial Financial Sector Employment Losses

    However, New York’s percentage losses paled by comparison to those in the Los Angeles (Los Angeles and Riverside-San Bernardino) and San Francisco combined (San Francisco and San Jose) statistical areas. The losses in the Los Angeles area were 21 percent, while in the San Francisco area the losses reached 17 percent. The losses in Los Angeles and San Francisco regions exceeded that of the New York combined statistical area, which had three times as many financial sector jobs in 2007. San Diego also experienced a 5percent job loss, while Sacramento’s loss was miniscule. Overall, California lost 17 percent of its financial sector jobs between 2007 and 2012.

    Texas: Gaining Financial Sector Employment

    The large metropolitan areas of Texas and did better. Dallas-Fort Worth, Houston, San Antonio and Austin added 5400 financial sector jobs, an increase of 14 percent (Figure 4).

    Metropolitan Area Performance

    St. Louis added 5,600 financial sector jobs, the most of any single metropolitan area (Figure 5). The Washington area added 4,400, followed by Phoenix (3,900), Dallas-Fort Worth (2,600) and Bridgeport (2,000). New York, as mentioned above, lost 16,500 financial sector jobs, the most of any individual metropolitan area (Figure 6). Boston had the second largest loss (8,300), followed by Los Angeles (6,800), Miami (4,800) and San Francisco (4,400).

    The metropolitan areas with the largest percentage gains include net job leader St. Louis which grew 85 percent (Figure 7). Phoenix gained 36 percent, Washington 28 percent, Tampa-St. Petersburg 18 percent and Dallas-Fort Worth 14 percent. Des Moines, which had only 1,400 financial sector jobs in 2007 had the largest percentage gain, at 96 percent.

    Miami had the largest loss, at 27 percent (Figure 8). Charlotte, having risen to prominence with its large banks may have been in the wrong place at the wrong time, losing 24 percent of its financial sector jobs, followed by Boston and Los Angeles (19 percent) and San Francisco (17 percent).

    Dispersing to Lower Density Areas

    The data is not sufficiently precise to distinguish between central business district, urban core and suburban trends. However, the metropolitan areas with high density historical core municipalities (above 10,000 persons per square mile or 4,000 per square kilometer in 2010), suffered a loss of 35,000 financial sector jobs between 2007 and 2012, more than the total national metropolitan loss of 27,000. The six high density historical core municipalities (Note 2) include New York, Chicago, Philadelphia Boston, San Francisco and Miami all suffered significant losses while the metropolitan areas with less dense cores gained 9,000 financial sector jobs (Figure 9).

    Further, the losses were concentrated in the metropolitan areas with the four most dense major urban areas, Los Angeles, San Francisco, San Jose and New York and the losses in these areas exceeded the overall industry loss. This movement away from density reinforces the often misconstrued conclusions of the Santa Fe Institute Urban Scaling research to the effect that metropolitan area size was a principal determinant of productivity, however not urban density (see: Density is Not the Issue: The Urban Scaling Research). Larger, less dense regions did far better — for example Houston, Dallas and St. Louis — than their more dense rivals.

    Dispersion to Housing Affordability

    There is also a strong trend of financial sector job gains where housing is more affordable and job losses where housing is less affordable. This is indicated by the median multiple (median house price divided by gross median household income) data from the 8th Annual Demographia International Housing Affordability Survey (Table below).


    Demographia International Housing Affordability Survey

    Housing Affordability Rating Categories

    Rating

    Median Multiple

    Severely Unaffordable

    5.1 & Over

    Seriously Unaffordable

    4.1 to 5.0

    Moderately Unaffordable

    3.1 to 4.0

    Affordable

    3.0 & Under


    Metropolitan areas rated as affordable (median multiple 3.0 or lower) gained 9,300 financial sector jobs between 2007 and 2012. Metropolitan areas rated moderately unaffordable (median multiple 3.1 to 4.0) gained 2,600 jobs. The metropolitan areas with the most unaffordable housing suffered a net loss in financial sector jobs. Seriously unaffordable (median multiple 4.1 to 5.0) metropolitan areas lost 3,700 jobs. Metropolitan areas rated seriously unaffordable (median multiple 5.1 or higher) lost 35,000 jobs. This is more than the overall loss reported in the data of 27,000 (Figure 10).

    Financial Sector Jobs: Reflecting Urban Dispersion

    The dispersion of financial sector jobs away from concentrated areas may come as a surprise, given the close association that the industry has with the largest central business districts. Yet, the trend mirrors the more general, but overwhelming trends of dispersion indicated over the last decade in both population and domestic migration.

    Wendell Cox is a Visiting Professor, Conservatoire National des Arts et Metiers, Paris and the author of “War on the Dream: How Anti-Sprawl Policy Threatens the Quality of Life.”

    ——

    Note 1: The data used in this analysis is limited to that provided in The Wall Street Journal article. Data was provided for only is only for a part of the Boston metropolitan area (the Boston-Quincy metropolitan division).

    Note 2: In 1940, at least 15 of the historical core municipalities had population densities exceeding 10,000 per square mile (4,000 per square kilometer)

    Photo by Flickr user IABoomerFlickr

  • California’s Poor Long-term Prognosis

    California’s current economic recovery may be uneven at best, but things certainly look better now than the pits-of-hell period in 2008. A cautiously optimistic New York Times piece proclaimed "signs of resurgence," and there was even heady talk in Sacramento of eventually sighting that rarest of birds, a state budget surplus.

    Yet such outbreaks of optimism should not blind us to the bigger issue: the long-term secular decline of the state’s economy. Whether you believe that the new higher taxes may now slow our growth, as my colleagues at Chapman University now believe, or right the fiscal ship, as is widely hoped in the blue California press, it’s more important to look more at the long-term trends, and assess where we stand compared with our domestic competitors.

    California, despite its enormous natural and human resources, is losing ground in most basic areas. Its unemployment rate, a still-horrendous 10 percent, stands as the nation’s third-highest. This is not a new development or the product of a run of bad luck. The state’s unemployment rate has been consistently above the national average for almost all of the past 20 years. Most interior counties, including the Inland Empire and the Central Valley, now suffer unemployment rates well into the double digits, with some approaching 15 percent.

    Overall, the state is still down a half-million jobs during the recession. California’s losses since its employment peak have been considerably above the national average, some 3 percent, far worse than the 2.3 percent erosion seen nationwide. Despite the modest recent uptick, the California Budget Project projects the state would need to add twice as many jobs per month to fully recover from the recession by the summer of 2015.

    Other long-term trends confirm the state’s secular decline in competitiveness. Take per capita income – a decent indicator of relative progress. In 1945, journalist John Gunther, writing his famous "Inside USA," gushingly described California "the most spectacular and most diversified American state … so ripe, golden." At the time, the state boasted the third-highest per capita income in the nation. As late as 1980, the state still ranked fourth. Today, despite Silicon Valley’s money machine, California has fallen to 12th and appears headed for further decline.

    Despite hopes in Sacramento and in the media, high-tech alone can not bail out the state. The much hoped-for windfall around the time of the Facebook IPO has failed to produce the expected fiscal bonanza for the state treasury. Silicon Valley famously gets nearly half the country’s venture capital, but its impact on the rest of the state has diminished. In the 1980s and 1990s, tech booms stretched prosperity throughout its surrounding regions and as far as Sacramento. Now it barely covers half the Bay Area; unemployment in Oakland remains at around 13 percent and one child in three lives in poverty.

    Part of this reflects the shift from an industrial high-tech focus to one fixated on software and social media. Given the extraordinary ease with which support and even research operations can be moved, once companies start to grow, they easily head to India, China or over to lower-cost locales like Utah or Texas. "Sure, we are getting half of all the venture capital investment but in the end we have relatively small research and development firms only," observes Jack Stewart, president of the California Technology and Manufacturing Association. "Once they have a product or go to scale, the firms move elsewhere. The other states end up getting most of the middle-class jobs."

    This can be seen in the long-term trends in STEM (science, technology, engineering, mathematics-related) jobs. Over the past decade, even with the current bubble, Silicon Valley’s STEM employment, according to estimates by Economic Modeling Specialists Inc., has increased by a mere 4 percent over the past decade. In contrast, science-based employment jumped 25 percent in Seattle, 20 percent in Houston and 16.8 percent in Austin, Texas.

    The tech scene in the Los Angeles Basin is doing even worse. STEM employment in the Los Angeles-Santa Ana area is still stuck below 2002 levels, partially a residue of the continued decline of the region’s once-globally dominant aerospace industry. The region, once arguably the world’s largest agglomeration of scientists and engineers, has now dipped below the national average in proportion of STEM jobs.

    Far greater problems can be seen further down the economic food chain, where many working-class and middle-class Californians traditionally have been employed. The state’s heavy industry – traditionally the source of higher-paid blue-collar employment – has missed out on the nation’s broad manufacturing resurgence. Over the past 10 years, according to an analysis by the Praxis Strategy Group, California has ranked 45th among the states in terms of heavy metal job creation, losing 126,000 jobs – more than 27 percent; San Francisco-Oakland ranked last among 51 large metropolitan areas. Both Los Angeles-Orange and San Bernardino ranked in the bottom 10.

    Despite hype about "green jobs," the immediate prospect for a big manufacturing turnaround is not bright. Because of its high energy costs and other regulatory costs, industrial investment has dried up in California. According to the California Technology and Manufacturing Association, California in 2011 did not even make the top 10 states in terms of new industrial investment, accounting for a paltry 2 percent. This was about one-third or less the share garnered by rivals such as Texas, North Carolina and rebounding "rust belt" states, like Pennsylvania.

    Construction, another pillar of higher-paid blue-collar employment, has recovered a bit but remains in worse shape than elsewhere. Overall, the state has lost almost 300,000 construction jobs from the 2007 peak, an almost 40 percent loss compared with 29 percent for the country as a whole.

    Even the trade sector, stalwart performer in producing high-wage jobs, may soon be declining. Recent labor disputes by highly paid, politically powerful California port workers – shutting down operations for eight days in Los Angeles and Long Beach – has reinforced the notion that the state’s an increasingly unreliable place to do business. After peaking around 2002, our ports are watching growth shift to the Gulf ports, such as Houston, and to the ports of the south Atlantic. The challenge will become far greater once the Panama Canal is widened in 2014 to accommodate larger ships from Asia.

    California is also squandering its chance to participate in a potential fourth source of basic employment, the massive expansion in domestic oil-and-gas production. The Golden State sits on potentially the largest gusher in the nation – the Monterey Formation is now estimated to be four times as rich in oil as North Dakota’s Bakken Formation. But our green consciousness dictates we don’t exploit our resources too much. In the past decade, Texas created some 200,000 generally high-paying energy jobs, while greener-than-thou California has generated barely one-tenth as many.

    As a result, wealthier, older, whiter, generally better-educated coastal areas can recover, but the prospects are dismal the further you head into the increasingly Latino, younger and less-educated inland areas. You have flush times for venture capitalists and celebrities, but growing poverty elsewhere. For at least two decades California’s poverty rate has remained higher than the national average. Now, notes a new Census estimate, the Golden State has a poverty rate of more than 23 percent, the highest in the country, something unthinkable a generation ago.

    Clearly, progressive policies are having socially regressive effects. Over the past few years the state, as a recent Public Policy Institute of California study demonstrates, has become ever substantially more unequal than the rest of the nation. Typical California middle-income workers have seen their median wage, adjusted for inflation, decline 4.5 percent since 2006, and now is at the lowest level since 2008. Only the highest-paid workers have avoided a decline in earnings.

    Fortunately, the elements to regain our former broad-based prosperity are still in place. The critical human assets are there: entrepreneurs, hardworking immigrants, top universities. We boast advantages from legacy industries – entertainment and fashion to technology and agriculture. And, perhaps most importantly, California retains its remarkable natural blessings of massive energy resources, fertile soil and a benign climate.

    The imperative now is to take fuller advantage of all these blessings in the coming years. Otherwise California will become poorer, more socially bifurcated and relegated by other places to the proverbial "dustbin of history."

    This piece first appeared in the Orange County Register.

    Joel Kotkin is executive editor of NewGeography.com and is a distinguished presidential fellow in urban futures at Chapman University, and contributing editor to the City Journal in New York. He is author of The City: A Global History. His newest book is The Next Hundred Million: America in 2050, released in February, 2010.