Blog

  • Angry Gran: Mobile Game or Demographic Game-Change?

    “Angry Gran” was one of the top mobile app games of 2012 globally. In it, the gamer assumes the persona of a grandmother gone rogue: Angry Gran is angry and needs money! Whack your enemies like piñatas until the cash comes flying out… The objective? Support Gran’s ‘active’ and ‘financially savvy’ retirement by assaulting unsuspecting passers-by with various weapons. If the assault succeeds, Gran steals their money and the gamer’s score rises; if the assault fails, Gran sprains her back and the gamer’s progress is delayed. Given the aging global demographic, one wonders if this sense of humour is best categorized as fiction, or as paradoxical truth?

    Gran gone rogue – an emerging trend? – In Japan, there’s more truth than fiction to angry Gran (and, presumably, Gramps). Its elderly population is 23% of the total; that’s the highest in the world. The National Policy Agency notes that the overall crime rate has fallen steadily, with the exception of offenses committed by the elderly. Theft offenses by the elderly increased 98% in the past eight years, from about 17,000 to more than 34,000. Previously, it was suggested that elderly offenders committed non-violent offenses due to loneliness, social isolation and poverty. But a more brutal streak is emerging, too: Elderly offenders of assault-related crimes increased a startling 570%, from 348 to 2,337.

    In 2008, Japan’s Ministry of Justice dedicated an entire section to elderly offenders in its annual white paper on crime, that is now a regular feature. In recognising the need for additional analysis, the Ministry cited an increase in the proportion of elderly offenders in each stage of the criminal justice system, which was disproportionately higher than the increase in the elderly within the total population.

    While the numbers are low, the rate of increase in elderly offenders raises a chilling prospect. Will an aging demographic result in a “geriatric crime wave”? It does not seem to be the case in the US: the national increase in elder arrests has not been disproportionate to increases in the national crime rate. Contribution to the national crime rate by the elderly remains low, with swings in, for example, the US murder rate largely accounted for by the percentage of young adults 15 – 29 years old.

    But Japan’s situation is not isolated. Other countries also show divergences from the usual age-crime assumptions. In Korea, the number of elderly sex offenders aged 61 or older increased by more than 50% in three years, beginning in 2008.

    In a 1990s report from Canada’s correctional services, 72.8% of older offenders were first time offenders admitted late in life; their rate of sexual crimes, homicide and manslaughter was double that of young offenders. In the Netherlands, older age groups were also over-represented in organized crime offenses, where 33% were over 40, and 76% over 30.

    Health and a swinging hatchet: Declining elderly disability – Florida, which is demographically similar to Japan, offers other insights. Between 1980 and 1998, there was a marked increase in elderly offenders committing forcible sex offenses, robbery and aggravated assault. The nature of such crimes indicates that these elderly offenders are not frail, but rather, somewhat able-bodied.

    Data remains scarce, but within a similar time frame across the US, severe disability among those 65 years and older declined approximately 25%. Studies also show that better childhood health reduces the risk factors for old-age disability and other serious illnesses. The future Gran who was born in the 1970s may eventually be quite sprightly in comparison to the one born in the 1920s.

    So the likelihood that Gran is healthy enough to grab the hatchet and swing it with full force has increased. It was recently reaffirmed that personality characteristics which predict criminal activity in young people may apply to older people, as well. Late-life stressors such as loneliness and caregiving situations gone bad are specific to older offenders, and, equally worrying are the onset of age-related mental illness, and the lack of early detection and management. For instance, family members have almost no recourse against an elderly relative who owns a firearm. Yet in a study of elderly charged with violent offenses and referred for psychiatric evaluation in South Carolina, 78.3% used guns and 40.7% of victims were family members – and nearly half of the perpetrators presented with dementia.

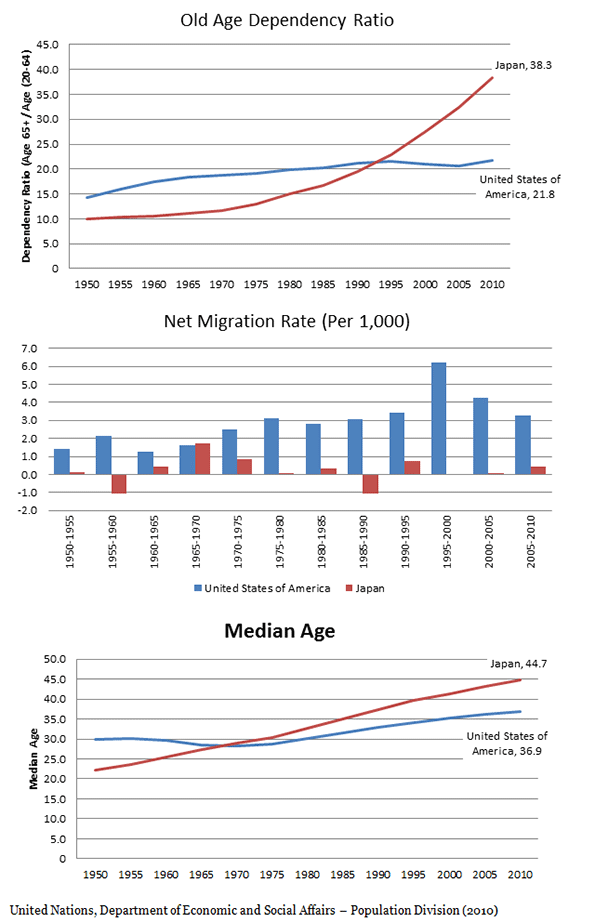
    We’re not Japan – In 2011, Wendell Cox and I wrote about aging global demographics. The differences between the US and Japan were notable. Currently, Japan’s old age dependency ratio (the ratio of those aged over 65 to those from 20 – 64) is 76% higher than that of the US. But the US median age continues to rise: At 36.9 years it is currently only 8 years lower than Japan’s 44.7 years. Given the aging global demographic, migration is unlikely to offset these rises indefinitely. In the coming years, will age-crime assumptions be challenged in the US too?

    The Future: An Aging Criminal Class? – Sixteen percent (246,600) of the US prison population is age 50 and older. The burgeoning elderly prison population has been attributed to longer prison sentences, brought on by more punitive sentencing principles during the 1970s and onwards. Yet there appear to be few studies on elderly or older prisoner release, rehabilitation and recidivism.

    And stemming the inflow of older offenders into prisons is also necessary. In Florida, admissions of offenders over 50 increased 205%, from 1,130 in 2000 to 3,452 in 2010 – from just 4.4% to almost 10% of total admissions. Despite an increased need to dedicated research on the behaviour and characteristics of older groups, a proportion of whom will reoffend in their golden years, the current work focuses largely on juveniles. In Japan, 25% of offenders in their late 40s become repeat offenders within 10 years of their first conviction, almost five times more frequently than those who are first convicted in their early 20s.

    Little is understood about what motivates the Colt-wielding Granny or Gramps. Older offenders present new challenges for justice systems, and for society as a whole. The opportunity now is to prevent criminal acts by the elderly. Discussion and analysis of geriatric crime is very much warranted.

    Emma Chen was a Senior Strategist at the Centre for Strategic Futures, Singapore. She is currently pursuing postgraduate studies.

  • The Expanding Economic Pie & Grinding Poverty

    A review of data from the past 200 years indicates not only a huge increase in the world’s population, but an even more significant increase in real incomes. This is illustrated using the data series developed by the late Angus Maddison of the Organization for Economic Cooperation and Development that included historic estimates of economic performance by geographical area (nations and other reported geographies) from 1500 to 2000. The Maddison data is expressed in international dollars adjusted for purchasing power, so that the impact of inflation and differing prices is factored out, to the extent feasible. Caution is required, however, because there are difficulties with longer term purchasing power and inflation time-series, not least because technological advances make it nearly impossible to accurately account for the changed standard of living. For example, there were no telephones of any sort in 1820, yet today, low-income Nigeria has 143 million mobile phones, nearly 90 for every 100 persons.

    I extended the Maddison data for another 10 years, to 2010, using the database of the International Monetary Fund (IMF) and converted all data to 2010 inflation adjusted international dollars.

    Fast Population Growth and Faster Economic Growth

    Between 1820 and 2010, the world population grew from 1.0 billion to 6.8 billion as indicated in the databases. This 550% increase, however, pales by comparison to the increase in the world real gross domestic product (GDP), which grew nearly 13 times as fast as the population (Figure 1). The relationship between rising urbanization and increasing wealth is evident in comparing Figure 1 to Figure 2 from the recent feature What is A Half-Urban World.   Between 1820 and 1900, the real economic growth rate was 1.5 times of that of population growth. This improved to 2.2 times between 1900 and 1950. In each of these succeeding decades, the economic growth rate relative to population growth was even greater, except in the decade of the 1980s when economic growth was 1.9 times population growth. Despite the economic difficulties, particularly in Japan and the West, 2000 to 2010 showed the largest rate of economic growth compared to population growth, at 3.0.

    GDP Per Capita (Purchasing Power)

    The real GDP per capita data strongly indicates the expanding economic pie. In 1820, the world GDP per capita was approximately $1100, expressed in 2010$, adjusted for purchasing power. By 1900, this had nearly doubled to $2100. The largest gains came after 1950 when the GDP per capita reached $3500. Since that time the GDP per capita has risen to $12,200 (Figure 2).

    A History of Poverty

    Even so, the history of economics is a history of poverty. University of Rochester (NY) Economist stated the case this way:

    Modern humans first emerged about 100,000 years ago. For the next 99,800 years or so, nothing happened. Well, not quite nothing. There were wars, political intrigue, the invention of agriculture – but none of that stuff had much effect on the quality of people’s lives. Almost everyone lived on the modern equivalent of $400 to $600 a year, just above the subsistence level.

    The $1100 GDP per capita from 1820 would rank among the poorest areas in the world today. The world’s richest area at that time was the Netherlands, which had a GDP per capita of $3100. This is more than Nigeria today, with its 143 million mobile phones and nearly as high as the GDP per capita of India.

    Distribution of Income

    Today, the large majority of the world’s population lives in lower income areas.

    • 16% of the population lives in areas with a GDP per capita of less than $2500. The largest of these are Bangladesh and Tanzania.
    • 29% of the world’s population is in areas with a GDP per capita of $2500 to $5000. The largest are India, Indonesia, Pakistan, Bangladesh, Nigeria and the Philippines.
    • 26% live in low middle income areas with a GDP per capita of between $5000 and $10,000, such as China and Ukraine.
    • 14% live higher middle income areas (a per capita GDP of $10,000 to $20,000). The largest such areas are Brazil, Mexico and Russia.
    • 10% of the population lives in relatively well off areas (a GDP per capita of $20,000 to $40,000) including France, the United Kingdom, Korea and Japan.
    • Only 5% of the world’s population enjoys a GDP per capita exceeding $40,000, the largest of which are the United States, Germany, Canada and Australia. (Figure 3).

    The Richest Areas

    The very richest countries in the world on a per capita basis are generally small. Oil rich Qatar has the highest GDP per capita at nearly $100,000 annually. Europe’s Luxemburg is the second most affluent, followed by the city-state of Singapore. Resource rich Brunei-Darassalam is the world’s fifth richest area. The United States ranks sixth and is by far the largest of the richest areas. More than 55% of the world’s population in areas with more than $40,000 GDP per capita lives in the United States. The balance of the richest 10 is completed by the United Arab Emirates, another oil rich Gulf state, the world’s other large city-state, Hong Kong,  as well as the Netherlands and Switzerland in Europe (Figure 4).

    Generally, IMF data indicates that the largest high-income world economies have experienced real GDP per capita growth of from 40% to 80% since 1980. The UK has grown the most among the examples, while Italy has grown the least (Figure 5). Germany’s lower growth rate is, at least in part, due to the complexity of combining virtually bankrupt East Germany with far healthier West Germany in the early 1990s. The US has been hobbled by its housing bubble-induced economic bust, which hurt other economies as well. Canada’s recent stronger growth could presage an improved ranking in the years to come. Other areas, such Italy, Spain, Japan and France could experience slower growth in the future, due to the seemingly intractable fiscal difficulties and, in some cases, demographic stagnation or even decline.

    Who’s Growing Rich Fastest?

    A number of countries have experienced spectacular growth in their GDP per capita over the past three decades, according to the IMF data (Figure 6). Oil rich Equatorial Guinea experienced the greatest growth, reaching a GDP per capita more than 16 times the 1980s figure. Equatorial Guinea is small, with a population of only 700,000 people (similar to the size of metropolitan areas such as Colorado Springs, Colorado, Hamilton, Ontario or Florence, Italy).

    The broadest and most significant progress has been made by China. According to the IMF data, in 1980 China had the second lowest GDP per capita of any reporting area, ranking above only Mozambique. This was approximately the same time that the economic reforms began, under the leadership of Deng Xiaoping.  By 2010, China’s GDP per capita had reached more than 12 times the 1980 figure. China’s gross GDP-PPP grew more than that of any other area. Once on the low end of the poverty league table    China now has entered the middle rank in terms of wealth.

    Other areas have also done well, especially in Asia. The largest of these include Korea, Vietnam, Taiwan, Thailand and Singapore. One African area is included among the fastest growing per capita economies, Botswana (Figure 6). Each of these areas grew from four to five times in GDP per capita from 1980.

    The Poorest Areas

    All 10 of the world’s poorest areas are located in Africa. The poorest is the Democratic Republic of the Congo, with a GDP per capita of less than $400.   Torn by civil war  its GDP per capita would rank it among the poorest areas even in the 1820 listing. The four next poorest areas have also faced severe domestic disruptions, Liberia, Zimbabwe, Burundi and Eritrea (Figure 7).

    Some Areas Getting Poorer

    The severity of the world’s poverty is indicated by the fact that 26 of the 138 areas for which there is data experienced declines in their GDPs per capita from 1980. The population of these declining areas was about 300 million, or approximately four percent of the world’s total. The Democratic Republic of the Congo, the world’s poorest area, experienced a 60% decline in real GDP per capita, which was the largest decline.

    Conclusion

    While the economic pie has expanded much faster than its population, there is still plenty of poverty in the world. It is no surprise that the developing world focused the attention of the recent 2012 Rio +20 conference on poverty, with a declaration that eradicating poverty is the greatest global challenge facing the world today.

    Wendell Cox is a Visiting Professor, Conservatoire National des Arts et Metiers, Paris and the author of “War on the Dream: How Anti-Sprawl Policy Threatens the Quality of Life.”

    Photo: Regency Park, Shanghai (by author)

  • Higher Gas Tax Unlikely to Gain Support in Congress

    Although some infrastructure advocates are hoping to use the current budget negotiations to win support for an increase in the federal gasoline tax, the idea is unlikely to gain support in Congress or the Administration.  While  the 2010 Simpson-Bowles deficit-reduction commission proposed raising the federal gas tax by 15 cents/gallon as part of a broad deficit-reduction plan, neither House Speaker John Boehner (R-OH) nor Senate Majority Leader Harry Reid (D-NV) have endorsed the idea.  Nor is an increase in the federal gasoline tax popular among  the rank-and-file.  Most lawmakers see the pressure to raise it as coming only from a narow coalition of liberal advocacy groups and transportation stakeholders that stand to benefit from increased federal transportation spending.

    Nor is the Obama administration eager to advocate a gas tax increase whose burden would fall most severely on the middle class —precisely the constituency it  wishes to protect from the pain of any further tax increases.  Given this perception, it is almost certain that a federal gas tax increase will remain off the table in the current fiscal cliff negotiations  and probably throughout the next session of Congress as well.

    Look instead for the states to assume a larger share of responsibility for funding their transportation needs. An early harbinger may be the state of Arkansas whose voters recently approved a half-cent statewide sales tax increase to back a $1.3 billion bond issue to fund highway construction over the next ten years. The measure has been called "the largest infusion of new tax dollars into a state transportation system in recent history." Local  referenda supporting public transportation also have appeared on the ballot in numerous states.  According to the Center for Transportation Excellence,  last November voters approved 70 percent of such initiatives.

    In addition to greater local financial participation, look for a shift in emphasis from federal funding to public and private financing of large infrastructure projects. The shift will be fueled by a vastly expanded TIFIA lending authority —by more than 600 percent, from $122 million in FY 2012 to $750 million in FY 2013—and by a large reservoir of equity in pension funds and private infrastructure investment funds looking for attractive investment opportunities. (TIFIA stands for the Transportation Infrastructure Financing and Innovation Act).

    This means an expanded role for tolling, for TIFIA and private sources of capital can only be used to finance facilities that are backed by a dedicated stream of revenue to cover interest payments on the loan and the loan repayment itself.   Tolls are viewed by many as a fairer way to pay for new and reconstructed highways and bridges because, unlike the gas tax,  they are paid only by the users of the particular tolled facility. In other words, drivers in Montana will not be required to pay for a road or bridge built for and benefiting mainly  the residents of say, Texas.  

    The likely prospect that  financing will replace stagnant or dwindling federal funding, dominated discussion among financial practitioners at ARTBA’s Public-Private Partnership Conference in Washington on October 10-11. Participants were encouraged to hear that 19 projects worth $27.5 billion have already submitted letters of interest for TIFIA loans in the past three months. Four more projects totaling $1.9 billion have been announced since October.  More applications are certain to follow as it becomes clear that the Highway Trust Fund no longer can continue to serve as a source of investment capital for transportation infrastructure.


    In sum, rather than hoping for an increase in the gas tax, the transportation community should look forward to three new trends as the most likely response to the perceived inadequacy of current  transportation revenue:  greater financial participation by state and local taxpayers,  a shift in emphasis from federal funding to private and public financing, and an expanded use of tolling.

  • Where Americans Are Moving

    The red states may have lost the presidential election, but they are winning new residents, largely at the expense of their politically successful blue counterparts. For all the talk of how the Great Recession has driven people — particularly the “footloose young” — toward dense urban centers, Census data reveal that Americans are still drawn to the same sprawling Sun Belt regions as before.

    An analysis of domestic migration for the nation’s 51 largest metropolitan statistical areas by demographer Wendell Cox shows that the 10 metropolises with the largest net gains from 2000 through 2009 are in the Sun Belt, led by Phoenix, and followed by Riverside-San Bernardino, Calif.; Atlanta; Dallas-Ft. Worth; and Las Vegas.

    Migration has slowed from a high of nearly 2 million annually in 2006 to less than 800,000 last year, but the most recent numbers show that the Sun Belt states, though chastened by the recession, are far from dead, as often alleged. This part of America, widely consigned to what the Bolshevik firebrand Leon Trotsky called the “dustbin of history” by Eastern pundits, somehow manages to continue to draw Americans seeking opportunities, in particular from the large coastal metropolitan regions.

    Migration data for the most recent one-year period available, July 2010 t0 July 2011, show the Great Recession has shaken the rankings up quite a bit within the circle of fast-growth regions. The biggest winner has been Texas. The Lone Star state boasts four of the 10 metro areas with the largest net migration gains for the past two years.  Dallas ranks first, followed by Austin in third place, Houston in fifth and San Antonio in eighth. In contrast, some of the growth leaders over the 2000-09 period, notably Las Vegas, and to a lesser extent Phoenix, have tumbled considerably in the rankings. The lesson here: a strong economy has to be based on something more than gaming, tourism and home construction. Energy, technology, manufacturing and trade are far preferable as an economic base.

    Also posting strong net migration gains for 2010-11 were Miami (second place), Washington, D.C. (sixth), and Seattle (ninth). In each of these areas, economic conditions appear to have improved. The once disastrous condo glut in the Miami area, which includes Dade, Broward and Palm Beach counties, has begun to clear up as foreign buyers pour into the region. Taxpayer-funded Washington is surging with new jobs and the highest incomes in the land. Seattle continues a long-term evolution toward the healthiest of the blue-state private economies. San Francisco, a consistent big loser for the last decade, jumped to 19th, presumably as a result of the current dot.com bubble.

    Another huge turnaround can be seen in New Orleans, which ranked a dismal 43rd for 2000-09 as residents fled not only Katrina but a stagnant, low-wage, corruption-plagued economy. But in our 2010-11 ranking, the Crescent City surged to a respectable 16th, one of the biggest migration turnarounds in the country.

    How about the biggest losers? From 2000-09, the metropolitan areas that suffered the biggest net domestic migration losses resemble something of an urbanist dream team: New York, which saw a net outflow of a whopping 1.9 million citizens, followed by the Los Angeles metro area (-1,337,522), Chicago, Detroit, and, despite recent improvements, San Francisco-Oakland. The raw numbers make it clear that California has lost its appeal for migrants from other parts of the U.S., and has become an exporter of people and talent (and income).

    And despite the cheap money Bernanke-Geithner policies of the past few years that have benefited giant banks centered in the bluest big cities, people continue to leave these areas.  The 2010-11 numbers show the deck chairs on the migratory titanic have stayed remarkably similar, with New York still ranking first among the 51 biggest metro areas for net migration losses, followed by Chicago, Los Angeles, Detroit and Philadelphia. In most of these cases only immigration from abroad, and children of immigrants, have prevented a wholesale demographic decline.

    What can we expect now? It seems clear that the urban-centric policies of the Obama administration have not changed Americans’ migration patterns. The weak recovery has slowed migration, but expensive, overregulated and dense metropolitan areas continue to lose population to lower-cost, less regulated and generally less dense regions. This may speed up as recent tax hikes squeeze the hard-pressed middle class and if, as appears likely, the social media bubble continues to deflate.

    If the economy somehow gains strength, it may only serve to further accelerate these trends. The incipient recovery in housing prices seems likely, at least in places like California and the Northeast, to create yet another bubble. This will give people more incentive to move to less expensive areas, particularly those who can cash in by selling a house in a pricier city and moving to a less expensive one. The differential in housing costs between New York and Tampa-St. Petersburg now stands at historic highs, and near peak bubble highs between Los Angeles and Phoenix; the traditional growth states are looking more attractive all the time for people looking to make quick money in an economy with shrinking opportunities elsewhere. This includes the massive wave of aging boomers, many of whom may see selling a house in California or the Northeast as a way to make up for less than adequate IRAs. The combination of low prices and warmer weather in the past has proven an irresistible one for those retiring or simply down-shifting their careers. This appeal is likely to grow as the senior population expands.

    Other demographic factors could further drive this trend. As the millennial generation ages and starts looking for places to buy homes and raise families, many will seek out places that are both affordable and offer better economic opportunities. These will tend to be in the South and Southwest, particularly Texas, and Plains States metro areas such as Oklahoma City.

    Finally we can expect immigrants, particularly from Asia, to continue to seek out housing bargains and new opportunities primarily in the Sun Belt states, as our recent study of changing Asian settlement patterns revealed. More will be shifting from the high-priced, low-growth big metros for opportunity cities such as Houston, Dallas-Fort Worth, Raleigh and Charlotte.

    Overall we can  expect domestic migration to pick up, and to follow the well-trodden path from the great cities of the Northeast and California to the Sun Belt’s  resurgent boom towns. This may be bad news to many urban pundits and big city speculators, but it also should create new opportunities for more perceptive, and less jaded, investors.

    2010-2011 Net Domestic Migration for the Nation’s 51 Largest Regions
    Rank by Net Flow Metropolitan Area Net Flow Rate Per 1,000 Residents Rank by Rate
    1 Dallas-Fort Worth-Arlington, TX 39,021 6.04 10
    2 Miami-Fort Lauderdale-Pompano Beach, FL 36,191 6.43 9
    3 Austin-Round Rock-San Marcos, TX 30,669 17.47 1
    4 Tampa-St. Petersburg-Clearwater, FL 27,157 9.68 3
    5 Houston-Sugar Land-Baytown, TX 21,580 3.58 16
    6 Washington-Arlington-Alexandria, DC-VA-MD-WV 21,517 3.80 15
    7 Denver-Aurora-Broomfield, CO 19,565 7.59 7
    8 San Antonio-New Braunfels, TX 19,515 8.97 4
    9 Seattle-Tacoma-Bellevue, WA 17,598 5.07 13
    10 Riverside-San Bernardino-Ontario, CA 15,131 3.54 17
    11 Charlotte-Gastonia-Rock Hill, NC-SC 13,778 7.74 6
    12 Raleigh-Cary, NC 13,262 11.53 2
    13 Atlanta-Sandy Springs-Marietta, GA 12,419 2.33 18
    14 Portland-Vancouver-Hillsboro, OR-WA 11,388 5.07 12
    15 Orlando-Kissimmee-Sanford, FL 10,394 4.82 14
    16 New Orleans-Metairie-Kenner, LA 10,153 8.59 5
    17 Nashville-Davidson–Murfreesboro–Franklin, TN 9,323 5.81 11
    18 Oklahoma City, OK 8,746 6.90 8
    19 San Francisco-Oakland-Fremont, CA 5,880 1.35 22
    20 Phoenix-Mesa-Glendale, AZ 5,585 1.32 24
    21 Pittsburgh, PA 3,740 1.59 20
    22 Jacksonville, FL 2,911 2.15 19
    23 Sacramento–Arden-Arcade–Roseville, CA 2,856 1.32 23
    24 Columbus, OH 2,219 1.20 26
    25 Indianapolis-Carmel, IN 1,940 1.10 27
    26 Louisville/Jefferson County, KY-IN 1,886 1.46 21
    27 Richmond, VA 1,546 1.22 25
    28 Salt Lake City, UT 915 0.80 28
    29 San Diego-Carlsbad-San Marcos, CA 816 0.26 29
    30 Minneapolis-St. Paul-Bloomington, MN-WI 536 0.16 30
    31 Baltimore-Towson, MD -1,341 -0.49 32
    32 Boston-Cambridge-Quincy, MA-NH -1,627 -0.36 31
    33 Birmingham-Hoover, AL -2,452 -2.17 35
    34 Buffalo-Niagara Falls, NY -2,558 -2.25 38
    35 San Jose-Sunnyvale-Santa Clara, CA -2,704 -1.46 34
    36 Kansas City, MO-KS -2,820 -1.38 33
    37 Memphis, TN-MS-AR -2,933 -2.22 37
    38 Rochester, NY -3,320 -3.15 40
    39 Hartford-West Hartford-East Hartford, CT -4,749 -3.92 45
    40 Milwaukee-Waukesha-West Allis, WI -4,862 -3.12 39
    41 Providence-New Bedford-Fall River, RI-MA -6,254 -3.91 44
    42 Las Vegas-Paradise, NV -6,353 -3.24 41
    43 Virginia Beach-Norfolk-Newport News, VA-NC -7,086 -4.22 47
    44 Cincinnati-Middletown, OH-KY-IN -7,149 -3.35 42
    45 St. Louis, MO-IL -10,260 -3.64 43
    46 Cleveland-Elyria-Mentor, OH -12,521 -6.04 51
    47 Philadelphia-Camden-Wilmington, PA-NJ-DE-MD -13,133 -2.20 36
    48 Detroit-Warren-Livonia, MI -24,170 -5.64 49
    49 Los Angeles-Long Beach-Santa Ana, CA -50,549 -3.92 46
    50 Chicago-Joliet-Naperville, IL-IN-WI -53,908 -5.68 50
    51 New York-Northern New Jersey-Long Island, NY-NJ-PA -98,975 -5.22 48


    Joel Kotkin is executive editor of NewGeography.com and is a distinguished presidential fellow in urban futures at Chapman University, and contributing editor to the City Journal in New York. He is author of The City: A Global History. His newest book is The Next Hundred Million: America in 2050, released in February, 2010.

    This piece originally appeared at Forbes.

    Dallas photo by Bigstock.

  • Millennials Ready to Play Key Role in Housing Market Recovery

    Recent data from a survey commissioned by Better Homes and Garden Real Estate (BHGRE) suggests a pent up desire among 18-35 year olds to own a home of their own that could easily fuel a real estate boom for at least the rest of this decade. 

    In contrast to predictions from some futurists that the Millennial generation, born 1982-2003, will be content to be lifelong renters, BHGRE’s survey found home ownership still ranked as young Americans’ most important definition of personal success.  Overall, three-fourths of those surveyed named home ownership as an indicator of having succeeded financially, more than seven times the number who named other major expenditures such as taking extravagant vacations, buying an expensive car, or owning designer clothing. Even among those living in the Northeast or in cities, seventy percent identified home ownership as the best indicator of having made it financially. This is fully in line with earlier studies by Pew Research that found home ownership was among the top three priorities in life for members of the Millennial generation.

    Unlike comments often made about this generation by some of their elders, most Millennials didn’t express sentiments suggesting that they feel entitled to be simply handed this badge of success.  Seventy percent of those in BHGRE’s survey said they needed to possess the skills to own a home; only thirty percent said they “deserved it.” Respondents also made it clear they were prepared to sacrifice to achieve their dream of home ownership.  About sixty percent were willing to eat out less and/or only spend on necessities to save the money needed to buy a home. These sentiments were most strongly expressed by those who had grown up in a home  owned by their parents.  In addition, forty percent were willing to take a second job. And, almost a quarter  of the generation accused of  “failing  to launch”  were prepared to live with their parents for a couple of years to save the money they would need to own a piece of the American Dream.  

    The collapse of the housing market that triggered the Great Recession also has made Millennials sophisticated, knowledgeable consumers when making decisions about how and when to purchase a home.  Rather than thinking they should buy a home as soon as they get married or qualify for a mortgage, seventy percent of BHGRE’s respondents said the time to buy a house is when a person can “afford it and maintain their lifestyle.” 

    Millennials are careful consumers, as befits a group shaped by the most lengthy economic downturn in decades. Sixty-one percent suggested they would want to have a secure job before buying a house and more than half said people should wait until they had saved enough for the down payment before making such a purchase.  When asked to indicate the factors they would research in determining whether to buy a home, financial considerations were cited by a majority of the respondents.

    They understand the power of money. Interest rates, home prices and how those two factors impacted their ability to secure a mortgage, all ranked much higher in importance than the type of neighborhood a house was in, school district ratings or foreclosure rates.  With the median sales price of both new and existing homes up almost five percent this year, Millennials are likely to jump into the market soon before it becomes too expensive for them to do so.      

    These findings suggest the current policies of the Federal Reserve and its Chairman, Ben Bernanke to keep interest rates low in order to stimulate this key part of the U.S. economy are right on target. If home builders and sellers can tailor their offerings to these technologically sophisticated, family-oriented potential buyers, Millennials could well play an important role in reinvigorating the nation’s housing market, further spurring the nation’s recovery from the Great Recession.

    Morley Winograd and Michael D. Hais are co-authors of the newly published Millennial Momentum: How a New Generation is Remaking America and Millennial Makeover: MySpace, YouTube, and the Future of American Politics and fellows of NDN and the New Policy Institute.

    Homes image by BigStock.

  • Finally, A Vegas Train That Makes Sense

    Las Vegas Railway Express has signed an agreement with the Union Pacific Railroad to operate a conventional speed train from Fullerton, in Orange County to downtown Las Vegas, according to a story by Michelle Rindells of the Associated Press.

    This is not to be confused with the proposed Xpress West (formerly DesertXpress) high-speed rail line which would operate from Victorville to Las Vegas, expecting riders to drive through Los Angeles Basin traffic congestion to get to the station. Further, unlike Xpress West, the Las Vegas Railway Express train would require no financial assistance from taxpayers for its largely leisure travelers. As we indicated previously, our analysis concludes that XpressWest revenues are unlikely to be sufficient to repay a proposed federal loan. This could expose taxpayers to a loss of $5.5 billion or more — approximately 10 times as great as taxpayer losses in the Solyndra federal loan guarantee debacle.

    The Las Vegas Railway Express promoters intend to take the full financial risk, as do most entrepreneurs who start businesses. Moreover, the Las Vegas Railway Express train would operate only when demand is substantial, with all trips between Thursday and Monday. The first trip is tentatively scheduled for New Year’s Eve, 2013.

    Here’s hoping the train is successful and that the owners make at least a competitive return on investment, while providing employees commercially funded (not subsidized) jobs, paying, not consuming taxes and with revenues earned from willing customers, rather than relying on public funding. And just as important, if they fail, taxpayers will not be left holding the bag. That’s how things should work.

  • Off the Rails: How the Party of Lincoln Became the Party of Plutocrats

    For a century now, Republicans have confused being the party of plutocrats with being the party of prosperity. Thus Mitt Romney.

    To win back the so-called 47 percent—an insulting description Romney doubled down after the election when he blamed his loss on Obama’s “gifts”—Republican might look farther back, past Calvin Coolidge and Herbert Hoover to their first president, Abraham Lincoln.

    Not only did he spring from the ranks of the plebeian, not the preps, but—as Michael Lind points out in What Lincoln Believed—he aimed to both increase opportunity and expand national power. A corporate attorney, he backed railroad interests and their expansion, which paced the nation’s economic ascendancy, but saw this as part of creating greater opportunity, particularly in the West, for the country’s middle and working classes. He also enacted the Homestead Act, which supplied aspiring settlers with a gift: 160 acres of federal land.

    Whether or not these acts were populist in their intent, their effects helped people achieve their aspirations. Expansion westward was nothing less than the basis of the American dream, allowing millions, many from land-poor and feudalized Europe, an opportunity to strike out on their own.

    This aspirational element should be the centerpiece of the Republican message in this age of growing class bifurcation. The loss of upward mobility long predates President Obama, though it has accelerated under him—with median household incomes down by more than $4,000 since he took office. Even the tepid economy has not done much to improve middle-class fortunes since nearly three-fifths of new jobs are in lower-wage positions.

    Without some unforeseen economic rebound, class issues will dominate our politics in the future even more than they do today. To recover, Republicans, now losing consistently (and often deservedly) on cultural issues, need to outmaneuver the Democrats on their ability to provide opportunity and upward mobility to a broad range of Americans.

    In his time, Lincoln understood the usefulness of class warfare. Tied to industrial interests, he waged a bloody class war on the slave-owning gentry of the South, a group so detestable it makes today’s Wall Street elites seem almost saintly by comparison. Financiers and industrialists may have supported this brutal war between the states, but it was largely aspiring yeoman farmers, skilled workers, and small merchants—all beneficiaries of Lincoln’s expansive economic vision—who fought it.

    In recent decades, Republicans—conscious of their patrician backers—have suppressed thinking about class, often criticizing Democrats for having no such scruples.

    This made them unable to turn issues such as the bank bailouts to their favor; Romney, himself an economic royalist, could not bring himself to denounce the administration’s policies that have worked out wonderfully for large banks now enjoying record profits while pummeling the middle class.

    In the past, Republican deflected class concerns by focusing on cultural issues, national defense, or ideology—but these tactics have worn themselves out. Of course, some conservatives will blame their defeat on a candidate of uncertain convictions and without commitment to the social regressive policies. Yet evangelicals mounted a record effort to get out the vote; it’s hard to see how Romney would have done better trying to sound more like Todd Akin and Richard Mourdock.

    What should concern Republicans was declining turnout in traditionally GOP-leaning suburbs, the very places where middle-class professionals and business owners reside. These voters were not energized by Romney. So even though he improved the GOP’s 2008 vote among the middle class and independents, Romney’s total was about 1,000,000 below that of John McCain. Had Romney equaled McCain’s performance in four states (Florida, Ohio, Virginia, and Colorado), he would have won, rather than losing to a president who received 7 million fewer votes than in the previous election.

    Let’s take a measurement of base stagnation: the nation’s population has grown 20 million since George Bush was elected in 2004, but the GOP vote has actually shrunk. This correlates as well with a stunning decline of roughly 8 million white voters compared to 2008. The white population may be getting old, but it’s not dying off that rapidly.

    This low turnout is remarkable given how unfavorably Obama is viewed by much of the yeoman class. In fact, as Gallup notes, nearly 60 percent of small-business owners disapprove of Obama. The problem was many simply did not see Romney as a viable—let alone an attractive—alternative. In contrast, the Obama team did a far better job of turning out their base of minority, youth, single and childless women, and union members—an effort that delivered their margin of victory in swing states including Ohio, Nevada, and Colorado.

    To change the political dynamic, Republicans need to address class concerns, particularly those of small property owners and aspirant small entrepreneurs. Yet the GOP has no program for this group other than lower taxes and hollow promises to cut the budget (which, of course, they have not done, even when holding both houses of Congress and the presidency). The party’s hodgepodge of corporate managerialism, social regressiveness, and, above all, protection of the plutocratic class is demonstrably not compelling to most Americans.

    It’s hard for a Main Street business owner, or sole proprietor working from home, to relate to a plutocrat, like Romney, who pays lower effective tax rates than they do. Outrage against looming tax hikes would be justifiable, if the true motivation were not so plainly to preserve the privileges of the haute bourgeoisie. This is a politically doomed approach; while small business is widely revered by Americans, big business and banks are among the least well-regarded.

    Class also would provide a means to define negatively the current regime. Instead of making silly attacks on President Obama as a “socialist,” he would be more accurately portrayed as the tribune of both the crony capitalists on Wall Street or Silicon Valley and of big labor, particularly public-employee unions. Obama should also be toxic to grassroots entrepreneurs, who will bear the brunt of the new regulatory regime, health-care system, higher energy prices, as well as rising income taxes.

    Rather than label him as a radical, Republicans should identify him as an avatar of those who are doing best in our concussed economy, and presumably want things to stay that way. His most ardent backers include many of our richest, most celebrated citizens—fabulously wealthy Hollywood types, the Silicon Valley elite as well as those controlling our major media and universities. There’s a reason Obama bested Romney in eight of America’s 10 richest counties.

    In Marin County, Calif.—where Obama claimed nearly 75 percent of the vote—expensive energy and higher housing prices represent not a burden but an environmental good, and, when it comes to housing, an economic opportunity for some to benefit from artificial, government-imposed scarcity. Ban new single-family homes, and the value of the existing stock goes up; for the elite investing class, incentives for “green energy” developments offer insider opportunities to enjoy windfall profits at the expense of middle-class-rate payers.

    If Wall Street wants to join the “progressive” gentry parade again, as it did in 2008, Republican should encourage them. Being the candidate of the phenomenally unpopular financial overclass may have bought Romney the nomination, but it sealed his fate in the general election.

    To reclaim its Lincolnesque transformation, the GOP needs to fundamentally pivot on the role of government. Laissez-faire ideology has its merits, but cannot compete successfully with a population weaned on the welfare state, whose members are keenly attuned to their vulnerability in our volatile era.

    By admitting that government is sometimes a necessary partner in nurturing and sometimes financing infrastructure critical for economic expansion, Republicans can offer their own vision of what growth-inducing services such as new roads—as opposed to the increased regulation and transfer payments and pension bloat peddled by Democrats—government can and should provide. This could appeal to Hispanics, Asians, and younger people who would be the prime beneficiaries of tangible investments.

    As generational chroniclers Morley Winograd and Mike Hais have suggested, most younger people support government action to solve problems but generally dislike the kind of top-down solutions often supported by Democrats. As these voters age, seek to buy homes and start businesses, they might listen to a sensible alternative that does not seek to enhance the left-wing clerisy’s ambition to control all aspects of their lives.

    It’s time for Republicans to break with the traditions of Goldwater, Reagan, and, particularly, Bush and shift to something more akin to the party’s roots in the mid-19th century. This party needs less preaching and libertarian manifestos that essentially defend plutocracy. Instead it’s time to embrace class warfare on today’s gentry, and embrace the aspirations of today’s middle-class. Honest Abe in 2016?

    Joel Kotkin is executive editor of NewGeography.com and is a distinguished presidential fellow in urban futures at Chapman University, and contributing editor to the City Journal in New York. He is author of The City: A Global History. His newest book is The Next Hundred Million: America in 2050, released in February, 2010.

    This piece originally appeared at The Daily Beast.

    Lincoln Memorial photo by Bigstock.

  • Detroit: America’s Whipping Boy Needs a Second Chance

    Every so often, Detroit seems to pop up in our popular consciousness in a negative way.  Ever since the ’67 riots, a steady stream of bad press has altered the national perception of the Motor City.  Right now the city’s efforts to prevent state takeover because of its fiscal problems seems to shape discussion about Detroit.  The most recent demonstration of this is the State of Michigan’s proposal to make Detroit’s Belle Isle Park, the jewel of the city’s park system, into a state park through an extended lease agreement. 

    But I’ve had a rather counterintuitive thought for some time – Detroit is our nation’s urban “boogeyman”, our poster child for urban decline, and we are the ones who prevent the city’s revitalization because we won’t let that image go.  America needs Detroit to be our national whipping boy. 

    Whipping boys came into prevalence in 15th Century England.  I think Wikipedia’s entry on the subject captures it well:

    They were created because of the idea of the divine right of kings, which stated that kings were appointed by God, and implied that no one but the king was worthy of punishing the king’s son. Since the king was rarely around to punish his son when necessary, tutors to the young prince found it extremely difficult to enforce rules or learning.

    Whipping boys were generally of high status, and were educated with the prince from birth. Because the prince and whipping boy grew up together they usually formed a strong emotional bond, especially since the prince usually did not have playmates as other children would have had. The strong bond that developed between a prince and his whipping boy dramatically increased the effectiveness of using a whipping boy as a form of punishment for a prince. The idea of the whipping boys was that seeing a friend being whipped or beaten for something that he had done wrong would be likely to ensure that the prince would not make the same mistake again (emphasis added).

    If that doesn’t accurately describe Detroit’s position in our nation’s collective conscience, I don’t know what does.

    I grew up in Detroit.  Like so many others, I’ve long since moved away (been gone for 30 years), but I occasionally come back to visit family.  I left the city as a teen, but I remain an avid fan of the city’s sports teams.  I regularly read about events and happenings in the city via the Internet.  And, if given a chance, I could still navigate pretty easily throughout the city.  I heartily root for the city’s revitalization.

    I sincerely believe that growing up in 1970s Detroit contributed to my ultimate career path.  As a kid, I remember news reports of people leaving the city for the suburbs or any number of Sun Belt cities – Houston, Dallas, Atlanta, Phoenix.  I remember reports of arson fires to abandoned buildings.  I remember Mayor Coleman Young taking such a defiant political stance on most issues that he may have urged (if not necessarily directly so) continued “white flight” and suburban expansion.  And, of course, I remember the tag that dug deep – “Murder Capital of the World”.  That kind of environment might prompt – did prompt – many people to just give up on cities in general and Detroit in particular, but I always had the vague notion that someone should stick around and try to make the city better.  I was first exposed to the field of urban planning during an eighth-grade career fair, and I later made it my career choice.

    It was clear, however, that most people did not react to Detroit’s decline as I did.  The city’s decline allowed it to be pushed into the recesses of the American mindscape.  It was only to be recalled as a foreboding reminder of the evils of cities.

    In my mind, four films from the last fifteen years seem to capture the general national image of Detroit and continue to shape our perceptions.  The 1997 film Gridlock’d features Tupac Shakur and Tim Roth as heroin addicts traversing a bleak urban environment, trying without success to get the help they need to drop the habit.  The much more celebrated 2002 Eminem film 8 Mile takes place in the same stark physical environment and details the visceral world of MC battling.  The 2005 film Four Brothers covers yet again the same desolate setting as four adopted young men seek to avenge the senseless murder of their mother.  And 2008’s Gran Torino, featuring Clint Eastwood, put a different spin on the meme by putting an elderly white widower into the same gritty landscape, full of resentment toward the people around him who represent the city’s demise. 

    Of course, we don’t need films to tell us what to think about Detroit.  Journalists, business leaders, artists, and others are more than happy to report on a physical environment that is a gray and gritty, post-industrial collection of smokestacks, abandoned buildings.  Everyone knows that Detroit is a city with huge swaths of vacant land and substandard housing.   Time Magazine famously purchased a house in Detroit to provide a launching pad for reporters to chronicle the city’s collapse.  On more than one occasion I’ve heard people suggest that Detroit is undergoing a “slow-motion Hurricane Katrina”.  The image of the city’s people is one of, at best, ordinary blue-collar, hockey-loving, working-class slugs, holding on but facing inevitable economic obsolescence because of an inability to compete in today’s bottom-line global economy.  At worst, they are poorly educated and isolated miscreants who relish burning buildings every October 30th (“Devil’s Night”), and causing mayhem when one of the local sports teams actually wins a championship.

    There are aspects of this in virtually every large city in America.  You can find Detroit in Cleveland, St. Louis, Buffalo, Milwaukee, Baltimore and Philadelphia.  You can find it in Indianapolis, Minneapolis, Cincinnati, Columbus and Louisville.  You can find it in Atlanta, Miami, Houston, Dallas and Phoenix.  You can find it in Las Vegas, Seattle, San Francisco and Portland.  And yes, you can definitely find it in New York, Chicago, Los Angeles and Washington, DC.  You can find elements of the Detroit Dystopia Meme ™ in every major city in the country.  Yet Detroit is the only one that owns it and shoulders the burden for all of them.

    Why is Detroit our national whipping boy?

    The image of Detroit serves as a constant reminder to cities of what not to become. This is the real Boogeyman syndrome right here.  City leaders around the nation can always refer to Detroit as the quintessential urban dystopia, invoking images of crime and crumbling infrastructure.  By doing this they can garner support for (or just as likely, against) a local project, because if this project does or doesn’t happen, you know what could happen to our fair city?  We could become like Detroit!

    The image of Detroit allows the rest of the nation’s cities to avoid facing their own issues – urban and suburban. As long as Detroit’s negative image remains prominent in people’s minds, they can forget about trying to improve what may be just as bad, or even worse, in their own communities.  I remember visiting Las Vegas about twelve years ago, and was astounded by the amount of homelessness I saw, away from the Strip.  No one immediately associates homelessness with Las Vegas, but such an issue would be completely understandable for discussion to the average guy when talking about Detroit.  Cities like Miami and New Orleans have long histories of high crime rates, but that perception rarely registers like Detroit’s because they have other assets like South Beaches and French Quarters to mitigate it.  Cities like Memphis and Baltimore have a violent crime profile similar to Detroit’s, but they fail to excite in the way Detroit does.

    The image of Detroit allows the rest of the nation to maintain a smug arrogance and sense of superiority. I imagine a nation pointing its collective finger at Detroit and saying its situation is the result of its own bad decisions.  Shame on Detroit, they say, for going all in on auto manufacturing.  Shame on Detroit for aligning itself so closely with labor unions.  Or the Big Three.  Shame on Detroit for not dealing with its racial matters.  Shame on Detroit for its political failures and corruption.  And I imagine this being said without the slightest bit of irony by the American people.  We are not you, they say, because we made better choices.  But the truth is dozens of cities made the same choices but escaped a similar impact, or had other physical or economic assets that could conceal the negatives.  This is a conceit that prevents not only Detroit’s revitalization, but that of former industrial cities around the nation.

    Detroit needs a reprieve.  It needs a second chance.  Motown needs our nation to let go of its past and allow it to move on into the future.  There are millions of people who have had troubled lives in the past, but do we continually hold that against them?  There are corporations that betray the public trust, but we go back to buying their products.  There are Hollywood actors who make atrocious movies, but we go back to see their latest flick.  There are politicians who’ve been disgraced out of office, and even they are able to come back.  Detroit needs to be allowed to move into its next act.

    More importantly, we must recognize that Detroit’s story is not unique.  It is the story of every American former industrial city, just writ large.  America is the land of second chances – we need to let go of our “at-least-we’re-not-Detroit” smugness and support this city.  Detroit has paid its dues, and it is long past time for the city to cash in.

    By allowing Detroit to move on, we’ll find that it will free up other communities across the nation to actually focus on their own problems.  There’s a checklist of activities that require urban leadership.  Dealing with foreclosures.   Crushing income inequality and economic disparities.  Mind-numbing traffic congestion on our roads.  Crumbling infrastructure.  Unsustainable sprawl development.  The impact of global climate change on water availability in the Sun Belt.  That represents just the tip of the iceberg. Certainly, other cities certainly have their fair share of problems.

    But I look at Detroit like this.  To paraphrase Frank Sinatra in his song “New York, New York” – if it can be fixed there, it can be fixed anywhere.

    Pete Saunders is a Detroit native who has worked as a public and private sector urban planner in the Chicago area for more than twenty years.  He is also the author of "The Corner Side Yard," an urban planning blog that focuses on the redevelopment and revitalization of Rust Belt cities.

    Photo: The “Detroit” we’ve all come to love — and expect