Blog

  • Ten Things You Need to Know About Indianapolis City Culture

    What makes one city different from another? Some of it is the geography, the economy, or the buildings. But a big chunk of it is culture.

    Every city has its own culture. A journalist recently interviewed me about Indianapolis and asked about some of the things that make that city’s culture distinct. I’m reposting ten of my observations here. Keep in mind that many of these points are relative, not absolute. They are comparisons versus what I see in other cities.

    1. Indianapolis has a very open social structure. Many cities have very insular cultures that are difficult to penetrate. The Midwest river cities like Cincinnati, Louisville, and St. Louis are like this. If you weren’t born there, in a sense you’re always something of an outsider. I’ve also heard reports of similar things about Cleveland, where people who come there have trouble making new friends and connections. The stereotype of some Southern cities is that who your daddy was, etc. matters a lot.

    In Indy, outsiders can move to the city and rapidly make friends and contacts, and to get integrated into civic networks. Columbus, Ohio is similar I’m told. I speculate that these cities have a more open orientation because they are state capitals. They frequently have new players circulating in and out, and this opens up the social networks considerably.

    A newcomer is likely to have a much better time of it in Indianapolis than most other Midwest cities.

    2. The social life of Indianapolis happens in back yards. This was an observation made some time ago by local cultural commentator David Hoppe. It’s dead on. In a city like New York or Chicago, there’s a palpable sense of bustling street life. This is largely absent in Indianapolis. If you operate on the assumption that this is the One True Way cities should function, Indy looks bad. But in reality the history and even built environment of Indy simply created different forms of social life. Different doesn’t mean worse.

    People in NYC have tiny apartments, so of course they want to be out and meet people out. People in Indy mostly have single family homes, and so people can gather inside and in back yards. This produces things like Sunday night dinners and porch parties. In my experience, this produces many more useful “collisions” than the merely physical ones you’re likely to have on the street in Chicago.

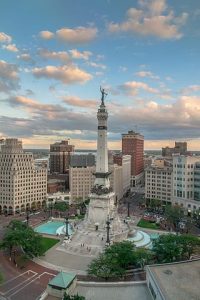
    3. A bimodal distribution of quality. Indianapolis has a “barbell” shaped quality curve. There’s a lot of stuff that’s pretty bad, but some things that are truly excellent. So, for example, the design of the average street in Indianapolis is terrible, but Monument Circle is one of the world’s great urban spaces. This contrasts with say Columbus, Ohio, where the vast majority of things are solid but relatively few stand out as terrible or exceptional. Interestingly, Nassim Taleb recommends barbell strategies. This may be one reason why Indy has the best small city tech scene in the Midwest.

    4. An excessive preference for the pragmatic. This is a common Midwest trait. Again, I’m writing a future magazine column about this and its downsides. But for now note that the Midwest tends to actively discourage ambitious undertakings and the pursuit of excellence. This can produce a stifling environment for people who want to dream big and care about doing things right. Indy is certainly far better than the rest of Indiana on this, but it’s still present.

    Looking at Indy’s barbell quality distribution, it’s clear the community gives itself permission to do A+ level work in certain areas: sports hosting, Monument Circle, etc. But I’ve yet to crack the code on what the characteristics of these are that made them acceptable while so many others were not.

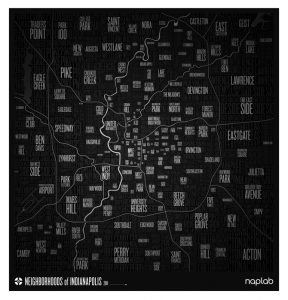
    5. A weak sense of neighborhood identity. Cities like Chicago and Cincinnati are deeply steeped in a sense of neighborhood. They have strongly delineated, long-standing neighborhood areas people strongly feel themselves to be part of. Like Detroit, Indy has always been more about what side of town you live on than what neighborhood you live in. There were some exceptions to this, but the norm has been a weak sense of neighborhood identity. Unigov, where the city took in a lot of suburban and rural areas in a city-county merger, doubtlessly contributed to this, but I suspect it far predates that.

    One reason some friends and I started the Naplab Indianapolis Neighborhood Map project was to start strengthening a sense of neighborhood identity.

    6. Low cultural differentiation vs. the state. People who live in Indianapolis are Hoosiers and think of themselves that way. There’s historically been little sense of urban identity apart from the state. Chicago is like a different planet from Illinois. People in Chicago think of themselves as Chicagoans first, and Illinoisans secondarily if at all. By contrast, in Indy people are Hoosiers first, residents of the city second. It’s telling that there isn’t even a commonly used word to refer to residents of Indianapolis. Indianapolitans anyone?

    Also, the city is mostly a draw from the rest of the state, so it has a very Hoosier feel. In Chicago, there’s a Midwest feel because it draws from a regional catchment area. In Dallas, you meet people from everywhere.

    This is one the urban progressives would probably like to dispute, but they are a relatively small tribe in the city.

    7. Low institutional differentiation vs. the state. As the only big city in the state, the city’s major institutions are frequently pressed into double duty as statewide ones. There’s an Indiana Historical Society but no Indianapolis Historical Society. (Is Indianapolis the biggest city in the country without its own historical society?) The major state economic development groups like TechPoint are basically Indianapolis organizations that serve a statewide audience.

    People in the rest of the state people feel the state and major institutions give too much focus to Indy. But again, in many cases these are de facto Indianapolis institutions doing double duty for the state. In many (most?) states there would be separate organizations for the major urban region and for the state. In Indiana, that’s not the case. (I’m not familiar with how others states with one major city like Georgia and Minnesota are set up. Are they similar?)

    8. A strong civic but weak political culture. Indianapolis is known for having three top notch mayors in a row: Richard Lugar, Bill Hudnut, and Stephen Goldsmith. But in general mayoral leadership and city government have not been the drivers of change. I don’t know how Lugar operated as I was not around. Goldsmith seemed to have a strong mayoral agenda (e.g., outsourcing). But others relied more on a broader civic grouping of people – business, foundations, etc. to get things done.

    I suspect most cities would claim their civic sector is strong. Chicago likes to boast of its corporate involvement, for example. But it’s also clear that Chicago likes to get things done through a powerful mayor in City Hall. In Chicago, if the mayor says Yes to you, you are probably golden. In Indy, however, that’s not the case.

    It’s hard to describe how this works because frankly it’s very opaque. Civic initiatives are largely cooked up in the back room behind the scenes. There seems to be a big focus on consensus. Disputes are generally not aired in public. And there’s a very “go along to get along” civic ethic.

    This has had a lot of benefits. First, while it generally takes longer for Indy to decide to do something than other cities, once the decision is made to go forward, it almost always happens. You don’t see things like Louisville arguing for 40 years over whether and where to build a bridge (which only got built because Mitch Daniels stepped in). You don’t see repeated failures to pass a light rail program, like in Kansas City. When Indy decides to do something, it has a very high success rate. (A critic might say some of these things should have failed and that success at doing something you never should have done in the first place is a Pyrrhic victory).

    Secondly, there is long term continuity in civic initiatives. Rarely do things die when mayors change. The sports hosting strategy has gone back over 30 years, for example. While the current mayor didn’t strongly support the transit initiative developed under his predecessor of a different party, he didn’t stand in its way either. Contrast with how a new mayor came into Cincinnati and tried to pull the plug on a streetcar project. Or at the state level Chris Christie in New Jersey taking office and cancelling a rail tunnel project.

    The downside is a very enfeebled and low capacity city bureaucracy. Also, some changes need to come from the political sector in order to have democratic legitimacy. This makes the Indianapolis system bad at solving certain kinds of civic challenges. It should be no surprise that the mayor-driven (i.e., politically driven) system of suburban Carmel, Indiana was better able to redesign infrastructure, for example.

    Another downside is that it’s an extremely difficult environment for a civic entrepreneur to try to get things done. That’s where cultural fit comes in. If you don’t know how to navigate an opaque civic structure, accumulate political capital in that environment, etc. then you are going to fail to accomplish anything. This tends to reward insiders vs. outsiders. Though because of point #1, outsiders can become insiders fairly easily in Indianapolis, if they know how to play the game. Due to the nature of the civic structure, playing the game is likely to involve significant dilution of their ideas and compromises many people might find unpalatable.

    9. A strong preference for local hires. Indianapolis might be the biggest city in the country that’s basically never hired a global starchitect to design a major civic structure. Now there are many negative things one might say about the starchitect trend, but this is still revealing of the local culture. There’s a strong preference to hire locally in most places, but it’s very high in Indianapolis and often very clearly trumps quality. In fact, an out of towner with high flying ideas is exactly the kind of person who is going to be resented by a significant faction of the local power structure, and probably not be long for this world.

    10. You need to a guide to find the good stuff. Similar to point #2, you’re not just going to stumble into some famous place randomly, like you can in many cities. It’s a city where you need a guide to point you at the good stuff. For example, PRINTtEXT at 52nd and College is one of the best magazine stores in the entire world. I’m not exaggerating. But you’d never find it unless you were looking for it. There are all sorts of great things and great people in Indy, but they take time to find and get to know. In some cities the greatness is on the surface. In Indy, it’s in layers you need to dig up over time.

    Aaron M. Renn is a senior fellow at the Manhattan Institute, a contributing editor of City Journal, and an economic development columnist for Governing magazine. He focuses on ways to help America’s cities thrive in an ever more complex, competitive, globalized, and diverse twenty-first century. During Renn’s 15-year career in management and technology consulting, he was a partner at Accenture and held several technology strategy roles and directed multimillion-dollar global technology implementations. He has contributed to The Guardian, Forbes.com, and numerous other publications. Renn holds a B.S. from Indiana University, where he coauthored an early social-networking platform in 1991.

    Top photo: Daniel Schwen, CC BY-SA 4.0

    Second photo: Monument Circle. Photo Credit: alexeatswhales, CC BY 2.0

    Fourth photo: Indianapolis hosting the Super Bowl. Image via Shutterstock.

    Fifth photo: Image via PRINTtEXT Instagram

  • Suburban and Urban Housing Cost Relationships

    Perhaps this is old hat to you, but this came across as a bit of an epiphany to me earlier today.

    I was listening to the local public radio station this morning and there was a segment about the Chicago regional housing market that was fairly interesting.  Real estate and personal finance expert Ilyce Glink talked about home buying in the Chicago regional market.  Like many other housing markets nationwide, Chicago took an incredible hit in 2008-09 via the Great Recession, and regionally, home prices have been slow to rise from the depths of the early parts of the 2010s.  There’s some greater optimism that prices might be up throughout the area, even as the potential for higher mortgage rates increases, too. 

    In describing the Chicago regional housing market, Glink described many things in our recent housing history that are familiar to a lot of people in metro Chicago, and in other metros as well — depressed prices, numerous foreclosures, and a razor-thin inventory.  But she also alluded to the pre-Great Recession pattern that defined the region’s housing market — the continued movement outward of new home construction at the edges of the region — and how that essentially stopped around 2009 and hasn’t resumed since. 

    That got me thinking.  YIMBYs, the “yes-in-my-backyard” group that’s been pushing for relaxed housing regulation so that more housing units are built in cities to address affordable housing, have been effective in using the obscene housing prices and rents of cities to justify new city housing construction, despite my repeated objections.  My contention has usually been that prices rose so steeply in the hottest city neighborhoods because the demand was so high.  There was a newfound preference for city living, especially among young professionals.  However, there simply wasn’t enough of Lincoln Park or Wicker Park for everyone that wanted in.  Furthermore, there are other neighborhoods, like South Shore, that have the same positive qualities (lakefront location, easy public transit, close to the Loop) that should make it appealing to those wanting to live in the city, but it was being bypassed.  My argument was that such neighborhoods might actually welcome investment.  The combination of these factors, I believed, led to the price and rent spikes in the hottest areas, and it could be resolved in part by city newcomers considering previously unconsidered parts of the city.

    Here’s the epiphany — what if the lack of housing supply, at the regional level, has less to do with the lack of housing production within cities, and more to do with the lack of housing production at the metro area’s margins?

    Just before and well after the last recession, I worked for a city at our region’s edge and it was a huge beneficiary of the pre-2007 housing free-for-all.  In fact, the city where I worked more than doubled its population between 1990 and 2010 on the strength of annexation and new housing construction, becoming one of the largest cities in Illinois.  In 2007, weaknesses in the housing market were becoming apparent; in 2008, the bottom fell out; in 2009 and 2010, people were wondering when the old normal would return, or if a new normal would set in.  I think it’s fair to say the latter, since nothing approaching the pre-2007 boom has returned to the metro edges. 

    This would require further study and analysis by someone far more qualified than me, but here’s what I’m thinking.  Maybe, in a strange way, early urban pioneering was dependent on housing growth at the margins.  It could be affordable for those who chose to live there because it was one part of a housing market conveyor belt: first step a trendy but safety-optional urban apartment, second step a safer and quieter apartment or condo, third step a house in the suburbs.  The lack of edge housing construction disrupts that model, especially if there’s a shift in housing preferences as well.

    In other words, what’s broken is not the ability of cities to accommodate new construction, but the edge-driven model we’ve had for the last 60-70 years. 

    Don’t get me wrong.  I don’t see a return to our suburban-sprawl frenzy as a way to reduce prices and rents in cities.  But maybe it pays to examine the entirety of a regional housing market before designating a culprit.

    Pete Saunders is a Detroit native who has worked as a public and private sector urban planner in the Chicago area for more than twenty years.  He is also the author of “The Corner Side Yard,” an urban planning blog that focuses on the redevelopment and revitalization of Rust Belt cities.

    An unfinished subdivision.  Source: joyyehle.com

  • Hollywood’s Self-Inflicted Wounds

    No industry is more identified with Southern California than entertainment. Yet, in the past, the industry’s appeal has lain in identifying with the always-changing values and mythos of American society. But, today, that connection is being undermined, not just by technology, but also by a seemingly self-conscious decision to sever the industry’s links with roughly half of the population.

    This was painfully obvious during the Oscars — the penultimate event of the seemingly endless award season — when speaker after speaker decided to spend their moments of fame denouncing President Donald Trump. For all his personal failings, and often misguided policies, most Republicans and independents disapprove of the relentless Trump bashing in the media.

    Hollywood’s decision to make itself part of the anti-Trump resistance would make for wonderful satire, if you could get it on film. Imagine feminist icon Emma Watson fighting for “women’s empowerment” while baring her breasts in Vanity Fair. Or a host of social justice warriors, like Meryl Streep, demanding justice for the dispossessed, then returning to their estates where these victims of Trumpism are not likely to be found outside the servants’ quarters.

    The results also have a hard side: dismal ratings, down from a traditional viewership of 40 million to a mere 32 million, following a pattern that has seen it slide badly the last three years. Most Trump voters turned off the political speeches, notes one survey. But the Academy had other ways to show its contempt for its customers: None of the 10 largest grossing movies, notes USA Today’s Mitch Albom, got nominated for best picture, best actor or actress, or for supporting roles.

    The everyman era

    The preference of sophisticated opinion may be quintessential to Europe’s boutique film industry, but the blending of popular tastes with art has long propelled Hollywood’s historical success. This separation between audience and the Academy was not always the case. Films like “Gone with the Wind” (1939), “Around the World in 80 Days” (1956), “Ben-Hur” (1959), “The Sound of Music” (1965), “The Godfather” (1972), “Forest Gump” (1994) and “Titanic” (1997) all managed to be both blockbusters and best picture winners.

    Hollywood, wrote author Leo Rosten in 1940, was “the very embodiment” of “magic success,” allowing a truck driver to dream of being a hero, or a small-town waitress “to compare herself to a movie queen.” Hollywood was Middle American to the core, which appealed not just to our own audiences, but also to those around the world.

    In a political sense, Hollywood connected with Americans across the ideological spectrum. During the contentious 1930s, Hollywood could accommodate both the conservative myth of the loner — Gary Cooper and John Wayne — and also produce powerful dramas that touched on issues of class and inequality, such as “Our Daily Bread” (1934), “How Green Was My Valley” (1941) and “The Grapes of Wrath” (1940).

    Some progressive-leaning films were written by people who were later “blacklisted” during the McCarthy era, a tragedy that deprived the industry of some of its greatest talents. The industry instead favored biblical epochs like “Quo Vadis” (1951) as well as innocuous comedies starring the likes of Doris Day.

    “It was boy meets girl, lives happily ever after,” recalled former Los Angeles and Orange County Republican Congressman Bob Dornan, who grew up during this time. “There were clear-cut heroes and villains. Nazis torturing little old ladies, John Wayne landing on the beaches. … America was the bearer, the hope of the world.”

    Read the entire piece at The Orange County Register.

    Joel Kotkin is executive editor of NewGeography.com. He is the Roger Hobbs Distinguished Fellow in Urban Studies at Chapman University and executive director of the Houston-based Center for Opportunity Urbanism. His newest book, The Human City: Urbanism for the rest of us, was published in April by Agate. He is also author of The New Class ConflictThe City: A Global History, and The Next Hundred Million: America in 2050. He lives in Orange County, CA.

    Photo: BDS2006 [CC BY-SA 3.0 or GFDL], via Wikimedia Commons 

  • Can Tech Oligarchs Thrive Under Trump?

    With the first billionaire in the White House, Wall Street booming and, for the first time in almost a decade, very solid and broad based job growth, one would think America’s business elite would be beaming. But that’s not so because the country’s moguls are more divided than at any time in recent history.

    This conflict stems largely from divergent interests among rival factions of the putative ruling class. Trump’s backers tend to have links with the “real” economy, that is, those people who make things, such as energy producers, domestic manufacturers, agribusiness, suburban home-builders, and aerospace firms. These interests are increasingly concentrated in parts of America Trump painted “red”—the South, the Midwest, the Great Plains, and Appalachia.

    On the other side lies the “ascendant” ephemeral economy, based in such industries as media, entertainment, software, and social media, as well as their financial backers. These industries are less affected by environmental regulations than those in more tangible lines of business. They are also concentrated in the deep blue slivers along the coasts and in college towns, the very places where the progressive social and environmental agenda is most deeply entrenched.

    Obama’s Legacy: A New Post-industrial ruling class

    Barack Obama’s most “transformative” achievement was the consolidation of this potentially hegemonic, post-industrial ruling class. They reaped high returns from the Obama era embrace of ultra-low interest rates, nudging billions into risky tech ventures and speculative urban real estate. These increasingly oligopolistic interests  also benefited  from a Justice Department that eschewed anti-trust inquiries in such areas as smartphone operating systems, search, and social media, where the main players often control  80 and even 90 percent share globally. IT, telecommunications, and media now compose America’s most concentrated sector and is consolidating somewhat faster than older industries, such as manufacturing, property. and wholesale trade.

    In the past, Democrats received some support from business, but the GOP ruled the corporate mainstream. As William Domhoff  illustrated in his classic study Fat Cats and Democrats, Democrats drew support from outsiders, some of them less than savory, in industries from energy,  real estate, and gambling (Trump himself was a long-time Democrat). They also drew on diverse industries. As recently as the Bill Clinton years, Bill White, a savvy oil and gas attorney from Houston, served as chairman of the Democratic Party. It is doubtful now that someone with that background, even with White’s prodigious skills, will again be allowed into the party’s inner sanctum.

    Obama’s post-industrial corporate elite emerged in his first 2008 election, with Google, Microsoft, Time Warner, IBM, and General Electric (NBC) ranking among the largest business donors. During his time in office, companies like Google enjoyed unprecedented access to the White House: More than 250 people moved between jobs at Google or related firms, the federal government, and Democratic political campaigns.

    In the process,  the technology and media oligarchies became core funders of the  Democratic Party. This could prove more important in the future, as six of the ten and eight of the top 15 richest people on the planet, according to Forbes, derive their fortunes from these businesses. And this could just be the beginning: All of the 12 richest entrepreneurs under 40 come from the tech industry.

    Even Hillary Clinton, a far less appealing figure than Obama, garnered most of the big money from tech oligarchs and their employees. Open Secrets notes that among private firms the largest business donors to her campaign included tech media establishments, including Alphabet (Google’s parent company), Microsoft, Apple, Time Warner, and Comcast.

    Trump’s victory shocked this cozy alliance, and placed them in opposition. Silicon Valley, along with its idiot aunt, Hollywood, are now the most likely business constituencies to go into hysterics over the most recent inane Trump tweet, with some CEOs active participants in the anti-Trump “resistance.” Those few in Silicon Valley who backed Trump, like Peter Thiel, are now subject to campaigns to drive them from prominent boards. Uber’s Travis Kalanick, himself a rather unpleasant character, has been forced by such pressure to remove himself from any association with the current White House.

    Ideology here mixes with self-interest. Mark Zuckerberg, whose $50 billion net worth makes him easily the wealthiest American under 40, recently issued a pronunciamiento that places his company’s objective as far from Trumpian nationalism as possible. He wants to create “a global community” even though his industry has helped foster the most social isolation since people discovered caves. His vision of the future, notes Bloomberg’s Leonid Bershidsky, offers something of a “social dystopia” run by Facebook’s management, with terms of discussion powered by computer algorithms.  

    It’s clear what won’t make the cut in Zuckerberg’s “community”: Facebook is  increasingly hostile to any dissenting opinions from the right. The traditional media now wholly or partially  owned by the “ephemeral” economy oligarchs—Jeff Bezos’s Washington Post, Microsoft’s MSNBC and Carlos Slim’s New York Times—have also joined the anti-Trump “resistance,” having just previously served as claques for Obama and Hillary Clinton. Newsrooms may always have tilted somewhat to the left, but today they seem about as objective as those in Putin’s Russia or, for that matter, Fox News.

    Immigration may be the biggest hot button issue separating the oligarchs from a   White House that has fanned nativist flames. But for them, embracing immigration—most notably the odious HIB visa program—does not mean adhering to legal norms or American traditions. Instead, their immigration vision fits that of companies seeking indentured tech servants as well as a cheap and inexhaustible supply of undocumented cheap dog-walkers, toenail painters, and nannies.

    For this constituency, neither Trump’s proposed infrastructure program nor his moves to deregulate the economy have much appeal. After all, the Bay Area oligarchs seem perfectly fine with California’s regulatory insanity, and the piteously poor condition of the state’s infrastructure. Who needs roads and bridges when you have the cloud?

    Of course, not all the new ruling class can dismiss Trump so haughtily. Elon Musk, a Hillary supporter who still sits on the new president’s economic council, needs skilled tradespeople and reasonable regulation to build electric cars and rockets. He yearns to play a role in Trump’s “lunar gold rush.” Caught in the middle, Musk is trying to make nice even in the face of assaults sent to him from the “resistance.”

    Trump’s Oligarchs: Old School and Middle Class Friendly

    The Obama oligarchs, like establishmentarians everywhere, clearly missed what the Chicago sociologist Richard Longworth predicted two decades ago: that rapid globalization,   now known as Davos capitalism,  would cause a full scale “social crisis.” The middle and working classes, as the Guardian has correctly noted, have little reason to love “superstar” oligarchs who employ few of them and, according to a recent paper by the Bureau of Economic Research, are a primary reason for the growth of inequality.

    Trump’s oligarchs, for their part, reflect interests that jibe more closely with those of many middle and working class families. Trump’s so called  “cabinet of billionaires”—their  net worth is estimated at $14 billion—rightly has elicited criticism from   the Guardian and Mother Jones, which predictably also labeled them a bit too pro-Russian. And to be sure, Wall Street’s hoary hand, notably the ubiquitous Goldman Sachs, has secured  top posts at both the Treasury and the head of the National Economic Council.

    Nonetheless, these billionaires have embraced a president who trolls corporations sending jobs overseas and bullies foreign firms, like Softbank, into committing themselves to major employment in the states. Obama and his academic coterie might dismiss such behavior as unseemly, darkly nationalistic and even ahistorical, but there may well be political gold there.

    Of course, self-interest is a guiding factor, something particularly evident in the energy industry. The Trump cabinet features Rex Tillerson, former CEO of Exxon Mobil, as its secretary of State,   Rick Perry, former governor of Texas, as Energy secretary, and Oklahoma’s former attorney general, Scott Pruitt, as director of the EPA. David Wolff, one of the Houston’s largest land owners, notes  the change of administration has sparked renewed optimism across the energy belt. “It is nice to have a president who doesn’t hate your major industry,” Wolff quips.    

    Many manufacturers—at least those who build products  here—also have reason to celebrate the Trump ascension. A lot of firms felt threatened by the Democrats’ regulatory regime, which threatened to boost their energy and other costs. They also were the primary victims of globalist trading polices embraced by the grandees of both parties. The 79-year-old billionaire Wilbur Ross, the new Commerce secretary, made his fortune by buying and selling companies in such trade-impacted sectors as steel, textiles, and coal. Trade advisor Peter Navarro is well-known for pushing neo-protectionist and nationalist policies abhorred by the new oligarchs but popular in large parts of the country.

    Interregnum or Change of Direction?

    To the increasingly disconnected and increasingly concentrated blue state media, Ross and his ilk may epitomize an unhealthy attraction to “backward” sectors that need to be “disrupted” by the geniuses of Silicon Valley. Given their sense of historical inevitably, the tech oligarchs may feel that this shift is just a temporary halt in their drive, as notes Newsweek’s Michael Wolff,  to create “a more careful, regulated, and corrected world.”

    Yet many more Americans—particularly blue collar Americans—may prefer the Trump approach. Manufacturing employs some 11 million workers compared to 2.7 million in information. Both have seen their share of jobs go down since 2004, but, suggests the Bureau of Labor Statistics, industrial jobs are likely to remain six times as numerous by 2024. Throw in the mining sector, which includes energy, and the difference is expected to be roughly 9.4 million jobs compared to 2.4 million in the information sector.

    Ironically, the workforce in these industries is far more diverse than in those businesses run by the Obama oligarchs, who loudly champion the rainbow ideal but rarely in practice.   Silicon Valley  employs very few African-Americans or Hispanics; they make up barely 6 percent, for example, of Facebook’s workforce while overall leading tech firms employ barely 5 percent. In contrast,  according to 2015 data, 16.2 percent of manufacturing workers are Latinos and 9.7 percent are African-Americans. In mining, quarrying, and oil and gas extraction, Latinos make up 16.9 percent of the workforce and African-Americans 4.8 percent, while in agriculture, forestry, fishing, and hunting, nearly a quarter of the workforce—23.0 percent—is Latino and 2.7 percent African-American.

    If Trump policies can unleash a boom in these industries, he may have more staying power than many in the chattering classes admit. At least the Trumpians offer the prospect of upward mobility, greater independence, and the pride of work. In contrast, Silicon Valley’s vision, notes Greg Ferenstein, who has researched the views of the post-industrial elite, suggests a world where a “greater share of economic wealth will be generated by a smaller slice of very talented or original people”—that is, the denizens of Silicon Valley. “Everyone else,” he continues, “will increasingly subsist on some combination of part-time entrepreneurial ‘gig work’ and government aid. “

    One has to wonder whether the prospect of widespread downward mobility for all but the “best and brightest” will prove very attractive to the majority of Americans. In contrast, Trump’s outsized promises, however unrealistic, may retain surprisingly long-term appeal. 

    Trump’s business cronies may be grizzled, and even reactionary. They still may well end up as anachronisms, the last devotes of a dying industrial, largely white, America. But the Trump interregnum could become a new dominant paradigm if the Obama oligarchs fail to develop a vision that allows a better future than the jobless, socially stagnant and politically correct one now on offer.

    This piece first appeared in The Daily Beast.

    Joel Kotkin is executive editor of NewGeography.com. He is the Roger Hobbs Distinguished Fellow in Urban Studies at Chapman University and executive director of the Houston-based Center for Opportunity Urbanism. His newest book, The Human City: Urbanism for the rest of us, was published in April by Agate. He is also author of The New Class ConflictThe City: A Global History, and The Next Hundred Million: America in 2050. He lives in Orange County, CA.

    Photo: Gage SkidmoreCC License

  • Big Box Jesus

    One of my cousins recently attended an event at a suburban church and I tagged along. I’m amoral and omnivorous. I’ll go to any house of worship on the odd chance I might actually learn something useful – and I often do. And I meet a lot of really nice people along the way. But mostly I like to explore the landscapes other people inhabit. Church provides an intimate glimpse into what people are thinking and feeling in a particular location.

    I was immediately impressed with how much this church looked and functioned like a shopping mall. The size, shape, and general construction of the buildings and surrounding parking lots were indistinguishable from a large retail center. I spent more time than I probably should have trying to figure out which denomination it was. Catholic? Definitely not. Lutheran? Not exactly. Baptist? Meh. Mormon? Nope. It was a generic all inclusive Christian arrangement that celebrated the lack of any specific affiliation. Come and worship. We take all kinds. And enjoy the ample free parking and food court while you’re here. There was a well populated Christian school, a substantial auditorium, and all manner of programs and facilities. It was a highly successful suburban version of Big Box Jesus.

    The event my cousin was attending wasn’t strictly religious in nature. It was more of a collection of speakers who each preached a version of financial independence with a Christian slant. The majority of the attendees were suburban women like my cousin looking to start or improve an independent business venture.

    A borrower is a slave to his master. A thousand heads nodded. Always set aside 25% of everything you earn. The congregants listened intently. Start small and build up incrementally. There were biblical parables about prudence leading to abundance. Knowing smiles of agreement followed. There were some folksy stories about the misguided foolishness good people often stumble into. Laughs ensued from the audience. I liked these people.

    But then I looked out at the parking lot. How many people paid cash for their cars? I explored the subdivisions all around the church. How many people bought their suburban homes with cash? How many people are capable of setting aside even a sliver of savings on a regular basis ever. How many people bought their clothes and shoes and had their hair done with a credit card that got rolled over into a big ball of vague but gradually mounting debt? How many people are approaching middle age and still paying off student loan debt?

    I understand the dynamics of contemporary accounting. Carrying mortgage debt provides a substantial tax advantage. Using “other people’s money” at a low interest rate to invest in an asset that consistently rises in value is smart and frees up cash to be deployed in other more productive ways. Putting cash into savings is inefficient since it sits in a bank earning near zero interest these days. Stock values keep rising so investing in equities is a no brainer.

    You can’t go around wearing thrift store clothes and sporting a bowl haircut and expect to be taken seriously in a professional business setting. You don’t want to drive around in an old clunker and put your family at risk when you could have the latest safety and reliability features of a newer car bought on credit. If you can buy that car with a home equity loan and get the tax deduction, all the better. Everything about respectable modern life is predicated on people spending a certain amount of money in a very specific way that is nearly impossible to achieve on a cash basis. And that set of arrangements is in direct conflict with the traditional virtues of frugality, saving, and self reliance. Big Box Jesus takes Visa, Mastercard, and American Express.

    This particular suburb is still very much in the aggressive growth phase of development. Everything is shiny and new. Did the developers build this town on a cash basis? No. It’s built on an Everest of commercial debt. How many of the people at the church earn their living selling real estate, or cars, or brokering mortgages, or refinancing people’s obligations, or helping them manage their stock portfolios? How many people are critically dependent on other people buying their products or services on credit? One way or another… almost everyone.

    Is the city paying as it goes for infrastructure with funds set aside for maintaining and replacing all the pipes, pumps, and pavement when they wear out? Are pensions fully funded? Will this development pattern generate enough taxable value as it ages to support and maintain all the critical public infrastructure of schools, police, and fire protection? I’ve spent a lot of time exploring the municipal finances of towns all over the country for years. They’re all functionally insolvent beyond a certain not-too-distant point.

    What all these practices and institutions need – what they can’t function without – is constant growth based on ever more leverage and debt. This can’t go on forever. Sooner or later there’s going to have to be a day of reckoning when the whole house of cards comes down. If I were a religious man I’d start praying right about now. Instead, I actually do what the preachers say. Pay cash, live below your means, save for the future, and opt out of the situations that trap you in a dysfunctional living arrangement with no future.

    John Sanphillippo lives in San Francisco and blogs about urbanism, adaptation, and resilience at granolashotgun.com. He’s a member of the Congress for New Urbanism, films videos for faircompanies.com, and is a regular contributor to Strongtowns.org. He earns his living by buying, renovating, and renting undervalued properties in places that have good long term prospects. He is a graduate of Rutgers University.

    All photos by Johnny Sanphillippo

  • The Cities Creating the Most Tech Jobs in 2017

    A growing tech industry is often considered the ultimate sign of a healthy local economy. By that measure, the Bay Area still stands at the top of the heap in the United States, but our survey of the metropolitan areas with the strongest tech job growth turns up some surprising places not usually thought of as tech meccas.

    Charlotte, N.C., is more often associated with banks than bots. Yet from 2006 to 2016, tech businesses in the Queen City expanded their job count by 62%, with 18% growth from 2014-16, the fastest clip in the nation. Meanwhile, over the past decade, the metro area logged a 23% increase in the number of workers in STEM occupations (science, technology, engineering and mathematics-related jobs). This rapid job growth and strong recent momentum, driven partly by health care and environmental technology, ranks it second on our list. In the past 10 years, the region has added 7,400 jobs in two key high-tech business services sectors, custom programming and systems design services, along with nearly 700% growth in software publishing employment. To be sure, the share of tech jobs in Charlotte’s economy remains one third that of Silicon Valley, and the tech and STEM workforces are far smaller, but quality of life, lower housing prices, as well as decent plane connections, seem likely to help it to continue to attract tech workers.

    To determine the metro areas that are generating the most tech jobs, Mark Schill of Praxis Strategy Group analyzed employment data from the nation’s 53 largest metropolitan statistical areas from 2006 to 2016, with extra weighting for growth from 2014-16 to give credit for current momentum. Half our ranking is based on employment growth at companies in high-technology industries, such as software and engineering services. (This includes all workers at these companies, some of whom, like janitors or receptionists, do not perform tech functions). Half is based on changes in the number of workers classified as having science, technology, engineering and mathematics-related jobs (aka STEM). This captures the many tech workers in industries not primarily associated with technology, such as finance and business services. Data is sourced from EMSI.

    Another surprising up and comer is Indianapolis in fifth place. The share of STEM jobs in the local economy, 5%, is close to the national average but STEM employment is up 18% since 2006. Tech employment has grown rapidly, with the job count at tech companies up an impressive 68% since 2006, led by 1,700% growth at Internet-based businesses and 8,100 new jobs in custom programming and systems design.

    California-based companies are in the forefront such as Salesforce, which is adding 800 employees to its already 1,600-person office in Indianapolis. Similarly No. 7 Nashville is poaching jobs from the Bay Area with firms such as Lyft but also developing its own roster of defense and health-related tech firms. Since 2006, Nashville added jobs in nearly every tech industry we track, led by 3,700 new jobs in systems design, 1,800 in data processing, and 1,100 in engineering services.

    The Bay Area continues to excel in large part as a product of the rapid growth over the past decade of social media and business applications for technology. The San Francisco metro area, which includes tech-heavy suburban San Mateo County, ranks first. The City by the Bay and its environs, a hub for technical service firms like Uber and Salesforce.com, has experienced remarkable 90% growth in tech employment and a 36.5% expansion in STEM jobs from 2006 to 2016. Silicon Valley, with a concentration of tech industry workers 75% higher than upstart San Francisco, has also achieved rapid job creation, with tech industry employment up 80% and the number STEM workers increasing 32%, ranking it fourth. STEM employment per capita is roughly twice that of San Francisco.

    Other familiar faces make the top 10: No. 3 Austin, No. 6 Raleigh-Durham, No. 8 Seattle and No. 10 Denver. These lower-cost alternatives to the Bay Area have all been attracting people and companies from pricier California. Yet these areas too face rising housing prices, which is a challenge particularly for workers entering their early 30s and looking to settle down.

    Easily the biggest surprise on the list is Detroit, which improved its position to ninth, a remarkable 30-place jump from the last edition of this list in 2015. It generated 26% growth in high-tech jobs and boosted its STEM employment by 8.4%. Despite the decline of the central city, the Detroit metro area has never faded as a technical center; due largely to the auto industry its per capita STEM employment has long been above the national average. This is reflected in a post-recession boom in engineering services in the region – some 14,000 new jobs since 2006 – leaving Detroit with a concentration of engineering services more than three times the national average. Its percentage of STEM workers is 50% above the U.S. norm, roughly equivalent to that of Raleigh-Durham, Boston and Denver.

    More help could be on the way from a reviving urban core, says Chicago-based analyst Pete Saunders, himself a Detroit native. There is some evidence that the city itself is beginning to attract skilled and better educated workers. Microsoft has set up an outpost downtown for 165 employees and there is a small but evolving start-up scene.

    Winners, Losers and Stagnaters

    Detroit’s rise since our last study tells us something about the importance of industry to tech and the allure of lower housing prices. Another clear Rust Belt winner in this year’s survey is Pittsburgh. Still an energy and industrial center, and with low housing prices, the former steel capital jumped 10 places on our list to 21st. Pittsburgh has gained tech momentum as a center for autonomous vehicles, with Uber and Ford setting up operations there to tap talent at Carnegie Mellon. Like other upstart regions, Pittsburgh has seen a rise in high-tech business services, with 2,400 new jobs in engineering and 3,900 in systems design.

    Rochester, N.Y., is up 13 places to 36th, and Washington, D.C., gained 12 spots to 38th, while No. 41 Milwaukee and No. 25 New York both rose 10 places. New York’s improvement is tied to social media and a surge in biotech research and development. The region saw nearly 400% growth in employment at internet and web-based firms, but was not as competitive in many other tech sectors in our analysis. This plays to the city’s communications industry strengths, as well as Wall Street-connected fintech growth. While the metro area has by far the nation’s largest number of STEM workers at 450,500, in part by virtue of its massive population, New York is certainly not likely to emerge as a Silicon Valley competitor –the number of STEM jobs per capita in the New York metro area remains below the national average.

    Many traditional tech powerhouses have just held onto their positions, with little movement up or down. No. 16 Portland and No. 18 Boston held their own. So too, despite the excitement around Snapchat’s IPO, did Los Angeles at 37th. Its per capita STEM employment has now disturbingly dropped below the national average.

    And then there are the big losers, which include some traditional tech powerhouses. Despite its powerful medical and chip technology industry, San Diego dropped sixteen places to 39th. Houston dropped the most, some 39 places to 43rd, due to the energy bust. Yet it’s too early to count either of these places out in the long run since they both retain larger than average shares of STEM workers. A Trump defense boom could help jumpstart San Diego and Houston’s energy industry could be a prime beneficiary of the President’s “America first” energy policy.

    Future Prospects

    In the immediate future, no place will challenge the Bay Area as the mecca of technology and STEM employment. Other metro areas may now be growing as fast — and Charlotte even faster — but the Bay Area juggernaut has a big lead, even if it may finally be slowing down. James Doti, who directs the regional forecast at Chapman University, estimates that the job growth rate in the Valley’s information technology sector dropped to 2% in 2015 from a torrid 9% the previous year.

    Doti and other observers trace this in large part to the area’s soaring housing costs, now the highest in the nation. This particularly impacts millennials, many of whom are now entering their 30s, the prime age for family formation and home buying. If millennials continue their current rate of savings, notes one study, it would take them 28 years to save up enough to afford a median-priced house in the San Francisco area, but only five years in Charlotte, or three years in Atlanta.

    In 2015 7,500 more Americans left the Valley than arrived, the first time there’s been a net loss since 2011, according to the Silicon Valley Competitiveness and Innovation Project.

    If these trends represent the future, there could be an increasing exodus of jobs and talent from the Valley. In many of the upstart regions, there likely will be opportunities for economic migrants in the robustly growing (if less “sexy”) tech services sector, which includes engineering, systems design and custom programming.

    The big question is who will be the biggest beneficiaries, already established tech hubs like Seattle or Denver, or a long list of rising wannabes?

    In a word, as Sherlock Holmes would say, “the game’s afoot.” The future of regional economies around the nation could be at stake.

    2017 Metropolitan Tech-STEM Growth Index
    Rank Region (MSA) Score 2006-2016 Tech Industry Growth 2014-2016 Tech Industry Growth 2016 Tech Industry LQ 2006-2016 STEM Occuptn Growth 2014-2016 STEM Occuptn Growth 2016 STEM Occuptn LQ
    1 San Francisco 98.7 90.0% 17.5% 2.87 36.5% 9.9% 1.79
    2 Charlotte, NC 88.7 62.1% 18.0% 0.91 28.5% 10.4% 1.01
    3 Austin 86.2 76.6% 14.0% 1.93 35.4% 7.4% 1.76
    4 San Jose 85.9 79.6% 12.5% 5.12 32.2% 8.6% 3.43
    5 Indianapolis 72.4 68.1% 16.8% 0.96 17.8% 5.3% 0.98
    6 Raleigh, NC 70.3 46.9% 8.2% 2.07 31.9% 7.0% 1.56
    7 Nashville 65.7 75.6% 12.4% 0.71 13.7% 4.5% 0.80
    8 Seattle 62.7 47.7% 6.9% 2.32 28.5% 4.7% 1.89
    9 Detroit 61.6 26.1% 14.8% 2.12 9.6% 8.4% 1.50
    10 Denver 60.8 40.3% 6.9% 1.72 25.6% 5.5% 1.48
    11 Salt Lake City, UT 60.2 38.9% 6.5% 1.41 24.5% 6.0% 1.19
    12 Dallas 59.7 43.2% 9.3% 1.13 20.5% 5.0% 1.17
    13 Phoenix 59.5 48.5% 12.2% 0.93 10.1% 5.8% 1.16
    14 Grand Rapids 58.8 34.0% 8.9% 0.46 13.4% 7.9% 0.88
    15 Kansas City, MO 57.1 37.5% 9.8% 1.48 15.7% 5.5% 1.16
    16 Portland, OR 53.4 30.4% 7.4% 1.07 16.2% 5.5% 1.36
    17 Tampa 52.4 20.9% 10.6% 0.94 3.8% 8.3% 0.90
    18 Boston, MA 50.5 38.4% 6.6% 2.21 15.3% 3.8% 1.55
    19 Louisville, KY 50.4 27.6% 8.3% 0.57 15.0% 4.3% 0.69
    20 Atlanta 47.6 23.7% 7.7% 1.23 11.8% 4.6% 1.13
    21 Pittsburgh, PA 46.9 32.5% 7.8% 1.15 12.8% 2.8% 1.06
    22 San Antonio 46.1 28.2% 1.5% 0.82 22.2% 3.4% 0.83
    23 Orlando 45.9 8.5% 7.4% 0.89 8.4% 6.8% 0.78
    24 Cincinnati, OH 43.5 21.9% 6.6% 0.81 9.3% 4.1% 1.04
    25 New York 43.3 30.4% 7.7% 0.98 5.9% 3.4% 0.89
    26 Miami 41.9 8.9% 8.4% 0.62 2.3% 6.0% 0.63
    27 Sacramento 40.9 41.0% 7.5% 0.90 3.8% 1.7% 1.26
    28 Baltimore 39.7 25.1% 4.2% 1.52 12.5% 2.1% 1.38
    29 Minneapolis 39.4 18.2% 4.7% 1.04 9.3% 3.4% 1.29
    30 Richmond, VA 38.0 20.3% 6.2% 0.78 4.8% 3.1% 0.98
    31 Jacksonville, FL 37.9 23.1% 3.1% 0.80 7.3% 3.5% 0.76
    32 Chicago, IL 37.5 22.6% 6.8% 0.92 3.7% 2.5% 0.93
    33 Las Vegas 37.2 6.6% 5.6% 0.53 1.5% 5.6% 0.47
    34 Hartford 36.7 34.7% 4.3% 1.00 3.2% 2.1% 1.14
    35 Columbus, OH 36.5 9.9% 2.9% 1.05 11.9% 3.1% 1.18
    36 Rochester, NY 35.1 27.1% 5.1% 0.76 1.1% 2.5% 1.10
    37 Los Angeles 34.0 16.4% 6.6% 0.84 0.2% 2.7% 0.93
    38 Washington, DC 32.4 4.8% 3.8% 2.54 6.7% 2.7% 1.99
    39 San Diego 31.2 19.1% -2.2% 1.62 10.0% 2.6% 1.38
    40 Cleveland 29.0 14.1% 3.3% 0.73 1.4% 1.8% 0.97
    41 Milwaukee 28.7 2.9% 4.6% 0.77 1.0% 2.5% 1.02
    42 Oklahoma City, OK 28.6 7.1% 3.9% 0.52 8.4% 0.0% 0.96
    43 Houston 28.4 18.5% -2.3% 1.09 20.0% -1.8% 1.22
    44 St. Louis, MO 27.2 2.8% 4.5% 0.86 0.0% 2.0% 0.96
    45 Buffalo 27.1 22.9% 1.0% 0.77 2.4% 0.7% 0.79
    46 Memphis, TN 26.3 30.8% -5.8% 0.39 3.6% 2.6% 0.59
    47 Providence 25.0 8.0% 2.5% 0.72 0.4% 1.2% 0.88
    48 Philadelphia, PA 22.2 2.5% 1.7% 1.09 -1.8% 1.5% 1.06
    49 Virginia Beach 18.8 -3.0% -1.7% 1.03 2.2% 1.0% 1.09
    50 Birmingham 18.4 1.4% 2.0% 0.62 -4.2% 0.4% 0.81
    51 Riverside 16.5 -15.4% 0.8% 0.30 -4.6% 2.2% 0.48
    52 New Orleans 16.0 21.6% -1.9% 0.62 -0.8% -2.3% 0.67
    53 Tucson, AZ 15.9 6.0% -1.9% 86.8% -2.5% 0.0 1.1


    To determine the metro areas that are generating the most tech jobs, Mark Schill of Praxis Strategy Group analyzed employment data from the nation’s 53 largest metropolitan statistical areas from 2006 to 2016, with extra weighting for growth from 2014-16 to give credit for current momentum. Half our ranking is based on employment growth at companies in high-technology industries, such as software and engineering services. (This includes all workers at these companies, some of whom, like janitors or receptionists, do not perform tech functions). Half is based on changes in the number of workers classified as having science, technology, engineering and mathematics-related jobs (aka STEM). This captures the many tech workers in industries not primarily associated with technology, such as finance and business services. Data is sourced from EMSI.

    This piece originally appeared at Forbes.

    Joel Kotkin is executive editor of NewGeography.com. He is the Roger Hobbs Distinguished Fellow in Urban Studies at Chapman University and executive director of the Houston-based Center for Opportunity Urbanism. His newest book, The Human City: Urbanism for the rest of us, was published in April by Agate. He is also author of The New Class ConflictThe City: A Global History, and The Next Hundred Million: America in 2050. He lives in Orange County, CA.

    Mark Schill is a community and corporate strategy consultant with Praxis Strategy Group and Managing Editor of New Geography.

    Charlotte photo by Daritto7117 (Own work) [Public domain], via Wikimedia Commons

  • Small Colleges and Small Towns Working Together for Their Futures

    My latest column in the March 2017 issue of Governing magazine is about how small liberal arts schools are partnering to try to help the small towns where they are located succeed. In this they are imitating big cities, where major institutions have often played a key role in driving revitalization efforts, often in part out of self-interest. Here’s an excerpt:

    Many of the efforts these colleges are undertaking are still in their early days. But there’s a good chance that they will have staying power. Colleges’ increasing interest in the communities they anchor is not just a matter of civic altruism. In many cases, the schools face increasing pressures of their own. Between 2009 and 2014, according to The Wall Street Journal, 43 percent of the 300 small-town colleges it analyzed suffered declining enrollments. The squeeze has been particularly acute for schools with weak endowments. In 2015, Sweet Briar College in rural Virginia made headlines when it announced plans to close, though this was later rescinded after a public outcry and a number of new donations (and lawsuits).

    These small liberal arts schools tend to have very high tuition rates, though because of student financial aid the actual price paid is often well below the posted rate. But with student loan debt levels through the roof and the media filled with anecdotal reports of graduates with large debts and no jobs, prospective students are looking harder than ever at the price-value ratio. Still, for prospective students who value the intimacy of small colleges and communities, small towns have a lot to offer.

    Click through to read the whole thing.

    Aaron M. Renn is a senior fellow at the Manhattan Institute, a contributing editor of City Journal, and an economic development columnist for Governing magazine. He focuses on ways to help America’s cities thrive in an ever more complex, competitive, globalized, and diverse twenty-first century. During Renn’s 15-year career in management and technology consulting, he was a partner at Accenture and held several technology strategy roles and directed multimillion-dollar global technology implementations. He has contributed to The Guardian, Forbes.com, and numerous other publications. Renn holds a B.S. from Indiana University, where he coauthored an early social-networking platform in 1991.

    Photo: TravisNygard [CC BY-SA 3.0], via Wikimedia Commons

  • Taxpayers Need Protection from Dallas-Houston High Speed Rail Bailout? New Report

    The proposed privately financed high-speed rail line from Houston to Dallas is projected to have a revenue shortfall of $21.5 billion in its first 40 years of operation. This is the conclusion of a Reason Foundation report by Baruch Feigenbaum, the Foundation’s assistant director of transportation policy (Texas High Speed Rail: Caution Ahead). This and other concerns lead the Reason Foundation to indicate: “… we cannot support Texas Central’s proposed Dallas to Houston project.” This is an important development, since the Reason Foundation has been a strong supporter of privately financed transport infrastructure for decades.

    “Optimism Bias and Demand Exaggeration”

    Feigenbaum explains: “Our analysis indicates that Texas Central is exhibiting the same ‘optimism bias; and ‘demand exaggeration’ that have plagued many public infrastructure projects —and especially high-speed rail projects—for decades. Simply put, Texas Central has exaggerated its ridership projections while underestimating costs.” Feigenbaum adds: “…private sector involvement is not a panacea. A wildly unsuccessful project is not going to become feasible with private financing.”

    To any who follow infrastructure finance, these are familiar terms. The sorry record of major infrastructure forecasts has been documented by Oxford University professor Bent Flyvbjerg, along with Nils Bruzelius (a Swedish transport consultant) and Werner Rottenberg (University of Karlsruhe and former president of the prestigious World Conference on Transport Research). They reviewed 80 years of infrastructure projects and found initial cost estimates to routinely be low and demand (ridership) to have been routinely over-estimated (Megaprojects and Risk: An Anatomy of Ambition). They found passenger rail project cost overruns to be among the worst, averaging 45 percent. They also found ridership projections to be two-thirds too high in two-thirds of cases.

    Reason Foundation and State DOT Estimates

    The Reason Foundation report suggests that the Texas project might perform even more poorly. Feigenbaum estimates that the Dallas to Houston line would carry 1.4 million passengers by 2035. He also cites a Texas Department of Transportation analysis estimating annual riders at between 0.7 and 2.7 million trips, by 2035. The Texas Central estimates a considerably higher five million riders by 2025, 10 years earlier.

    But the difficulties do not stop there. The costs of construction projected by the Texas Central Railway, at a maximum of $12 billion, may be significantly underestimated. Feigenbaum conservatively estimates costs that are nearly 50 percent higher ($17.8 billion) and suggest that the cost could exceed $20 billion. This is similar to a State Department of Transportation estimate of $18.7 billion, according to the report.

    Either of these eventualities, both of which are fairly routine for such projects, would mean that the Texas Central Railway might not have enough money to operate the service, or even to finish construction, unless bailed out. Of course, it is hard to find investors for failed projects, and there would be strong political pressure for government grants and subsidies.

    The California Boondoggle

    California’s high speed rail project, well into the planning stage and about to lay some track, has already exceeded the Oxford research cost overruns with a vengeance. By 2012, construction costs had risen more than 60 percent compared to those publicized to obtain voter approval of bonds for the project in 2008. Worse, that’s after officials scaled back the system from high speed rail to a blend between conventional (commuter rail) and high speed rail.

    As if that were not enough, the first short segment, already under construction, according to a federal report   could have a cost overrun of up to $3.5 billion. The segment is approximately two-thirds the Dallas to Houston route length and is similarly flat, in the largely agricultural San Joaquin Valley. The Wall Street Journal referred specifically to the California high speed rail project in a recent editorial characterizing Sacramento as “America’s western swamp.”

    The International Experience

    Out of all of the high speed rail lines built in the world, only  two have avoided commercial losses (“broken even”) until recently (Tokyo to Osaka and Paris to Lyon). Both had very low construction costs, which made it possible to repay , unlike the highly escalated costs that have developed in subsequent projects. These have depended on taxpayer subsidies for their survival.

    More recently, the Shanghai to Beijing high speed line became profitable, though its superlatives are well beyond replication by any other project (at least of any planet discovered so far). The line is slightly shorter than the distance between New York and Atlanta, but directly serves a market larger than the population of the European Union (more than 520 million residents) and 60 percent more than the United States. The stations on the exclusively high speed rail line itself serve municipalities with more than 160 million people, more people than live in Japan and 2.5 times as many as residents as in France. Another 360 million residents are served by trains that directly access the Shanghai to Beijing line from outside the corridor for part of their journey.

    Whence the Bailout?

    Feigenbaum suggests the likely source of a bailout for the Dallas to Houston high speed rail line: “While Texas Central may not be intending to take any public funding, we believe that if construction starts, the project will inevitably have to be bailed out by the taxpayers of Texas, which is unacceptable” (our emphasis).

    He also notes that the Texas Central Railway plans to seek Railroad Rehabilitation and Improvement Financing (RRIF) program loan from the US Department of Transportation (USDOT). These below market rate loans are guaranteed by federal taxpayers. Of course, taxpayers already know how this works. Just a few years ago, Solyndra defaulted on a $0.5 billion federal loan, leaving taxpayers to “holding the bag.”

    A genuine privately funded project would raise sufficient funds from private investors and from non-subsidized commercial financing sources. It would also attract ridership large enough to produce sufficient to pay the loans and repay the investors. The Reason Foundation and the Texas Department of Transportation findings suggest otherwise

    All of this is disappointing to Feigenbaum, and also to me. After years of warning of taxpayer risks from such projects (Note ), I had hoped this one would be a genuinely commercial project, as this article from more than four years ago indicates (see: “Texas High Speed Rail: On the Right Track). It looks like it’s too good to be true.

    Making it Work?

    However, there may be a way to deliver the Texas Central project, while removing all potential taxpayer risk. According to the Dallas Business Journal Texas Central officials indicated that the Central Japan Railway would be the “primary investor”. There is also a report that Japan’s Government Pension Investment Fund may invest in US infrastructure, including the Texas high speed rail project. These organizations are more than financially capable of ensuring that there is no taxpayer risk.

    The Japanese know high speed rail. They are likely to invest only if they are confident they can recover their money, with a commercial profit. Moreover, any such investment needs to include financial guarantees that ensure there is no potential for either US or Texas taxpayers to be called upon for subsidies to cover cost overruns, operations or anything else. Any other approach could be foolhardy.

    Note: These publications include authoring or co-authoring a number of taxpayer risk reports on proposed high-speed rail lines, such as on Florida high-speed rail proposals between the 1990s and 2010s, the Xpress West Victorville to Las Vegas high-speed rail line, the first and second diligence reports on the California high-speed rail line, and a greenhouse gas emissions analysis of the California high-speed rail line. Sponsors included the Reason Foundation, the Howard Jarvis Taxpayers Association, Citizens Against Government Waste and the James Madison Institute.

    Wendell Cox is principal of Demographia, an international public policy and demographics firm. He is a Senior Fellow of the Center for Opportunity Urbanism (US), Senior Fellow for Housing Affordability and Municipal Policy for the Frontier Centre for Public Policy (Canada), and a member of the Board of Advisors of the Center for Demographics and Policy at Chapman University (California). He is co-author of the "Demographia International Housing Affordability Survey" and author of "Demographia World Urban Areas" and "War on the Dream: How Anti-Sprawl Policy Threatens the Quality of Life." He was appointed to three terms on the Los Angeles County Transportation Commission, where he served with the leading city and county leadership as the only non-elected member. He served as a visiting professor at the Conservatoire National des Arts et Metiers, a national university in Paris.

    Photograph: Texas flag

  • Fractions within the Working Class

    This has been a rough year.  After the election, I reposted a few articles on my Facebook wall, as did so many of my friends, about the “working-class vote.”  Did the white working-class just elect Trump?  I didn’t think so, but I also understood that the world can look very different to a working-class person than it does to a middle-class one.  I knew this because I grew up poor, and it is a constant struggle speaking to both sides of my life, my past and my present, my mother and my colleagues.  My mother, let me point out, did not vote for Trump.  She thinks he’s a jackass.  Two of her sisters did, however.  I don’t know anyone else in my extended family who voted for him.  There were lots of Bernie supporters, not many Clinton supporters, and a whole bunch of abstainers.

    A friend of mine from college, someone raised on the less wealthy spectrum of the educated middle class, took issue with even the idea of the “working class.” What was this really?  He knew a lot of blue-collar workers, plumbers, builders, who made a lot more money than he or his mother ever did.  I gave him the quick sociological explanations — it’s about power, not money, but his question remained with me.  Based on power at work, two-thirds of Americans can be classified as “working class” (see Michael Zweig’s excellent The Working-Class Majority).  That is a hell of a lot of people.  They don’t all think alike.  It struck me that sociologists, myself included, have spent untold ink arguing over the distinctions within the middle class (lower-middle, upper-middle, professional-managerial, those with economic capital vs. those with cultural capital, etc.) and where the line is between wherever this middle is and the top, and yet we have spent hardly any time  looking within the largest class of them all.

    So, I pulled out the General Social Survey (GSS), which has been asking thousands of Americans every year or so all about their lives, political identifications, and voting patterns. I decided to see if there were differences within the working class based on type of working-class job, and not on education, race or  income level.  Working-class jobs are those with little autonomy and often involving the use of one’s body – to wield a hammer, carry a baby, deliver a package from Amazon, stand all day greeting customers.  These jobs are held by a very diverse group of people; there are more people of color in the working class than in the middle or upper class.  When I refer to “the working class,” I mean this whole diverse group, not only white male workers.

    Let me give you a snapshot of five fractions of the working class: the Builders, the Makers, the Movers, the Clerks, and those who Serve (I call this category “CookCleanCare” to remind myself of the range of work within this fraction).  Builders most fit the stereotype of “the working class” (three-quarters are men, most are white, and many of them do wear hard hats at work), but it is only one fraction.  A more diverse lot are Makers, including assembly-line workers, tool-and-die makers, sewers, and cabinetmakers.  This is the fraction that has seen the largest influx of women in the past few decades, although still mostly male.  Movers include a wide array of transport jobs, from UPS drivers to ambulance drivers to long-haul truckers, also mostly men.  Most of those in the other two fractions are female. The CookCleanCare group includes those who prepare our food, clean our messes, and care for our children.  The Clerks are our growing retail worker category.  Back in the day being a clerk was seen as a move up, but today’s clerks are generally poorly paid and even less likely to hold a college degree than CookCleanCare workers (the most educated fraction).

    Here are some other interesting differences between the fractions.  Builders are the most likely to be living in the same place where they grew up, Makers the least likely.  Movers are the most likely to identify themselves as “working class.”  Twice as many Builders as Makers think of themselves as “middle class.”  Makers, in contrast, are more likely than the others to think of themselves as “lower class.”  In terms of income, Builders make the most money, Movers the least.   If we looked only at white men in each of the fractions, we would find the most instances of sexism, nativism, and racism among the Makers, perhaps reflecting the fact that this group has seen the biggest changes over the past few decades.  But it is important to note that a greater proportion of rich white men and white male managers express racist views than any working-class fraction does.

    During the past decade or two, ever since Reagan really, we have been hearing a lot about how “the working class” has turned its back on the Democratic Party.   But this is only true if we limit “the working class” to white men without college degrees.  If we include the whole of the working class, this claim is simply wrong.  According to my analysis of GSS data, there has never been a presidential election in which the majority of the working class voted for the Republican candidate.

    If we look at the working class based on broad occupational categories rather than race or education, we get a very different picture from “the working class” that political pundits have been talking about.  We don’t yet have GSS data for the 2016 election, but figures from 2012 suggest the value of analyzing working-class voters based on their jobs rather than income or education.

    This graph of voting patterns in the 2012 Presidential Election, arrayed by largest supporters of Obama from left to right, shows that while all occupational groups gave Obama a majority, two working-class fractions were at the polar ends of the spectrum. The Professional-Managerial Class fell near the middle. 

    Organizing the data by job categories also helps us understand that white working-class men don’t vote as a unified bloc. If we look only at white men, Obama’s lead lessens, with Romney winning slight majorities with Makers, Movers, and Clerks (not to mention lots of PMC support).  Why were white male Movers, Makers, and Clerks swayed by Romney while white male Builders and CookCleanCare were not?  For one thing, the Democratic Party may have forgotten Movers and Makers.  Women and people of color in these fractions may find other aspects of the Democratic party compelling, but white males less so.  All five fractions took an economic hit during the Recession and, unlike the PMC, none of them have recovered, as you can see from the chart below.  Makers even saw their wages decline before the recession hit.

    This points to the second problem with the “working class voting against their class interests” narrative.  Neoliberalism has clearly not been working for many working-class people.  The outrageous vote for Trump may be less an appreciation of his qualities or a heeled response to his dog-whistles and more a giant “Fuck You!” to the establishment.  If we don’t figure out a way to provide security and prosperity for all, we might just get neither for any of us.

    Class is a complicated construct.  Each fraction includes millions of workers, living in different parts of America, with different pasts, different futures, different understandings of how the world works. One way to gain deeper insight into the working class is to consider how major fractions within the working class respond to political appeals.  A call for massive infrastructure building, for example, is more likely to resonate with Builders, while a threat to cut the Department of Education may worry CookCleanCare members most.  It is also true that the nature of work changes, sometimes rapidly, as has been the case for many Makers and Clerks.  We owe the working class the respect of paying attention to which fractions are being mowed down on the front lines of neoliberalism.  It doesn’t seem like either major party has been doing a good job of this lately.

    This piece first appeared at Working Class Perspectives.

    Allison L. Hurst is an Associate Professor of Sociology at Oregon State University and the author of two books on the experiences and identity reformations of working-class college students, The Burden of Academic Success: Loyalists, Renegades, and Double Agents (2010) and College and the Working Class (2012).  She was one of the founders of the Association of Working-Class Academics, an organization composed of college faculty and staff who were the first in their families to graduate from college, for which she also served as president from 2008 to 2014. She is Chairperson of the Working-Class Academics Section of the Working-Class Studies Association.

  • Common Sense on Immigration

    No issue divides the United States more than immigration. Many Americans are resentful of the estimated 11 million undocumented immigrants, worry about their own job security, and fear the arrival of more refugees from Islamic countries could pose the greatest terrorist threat. At the other end of the spectrum are those who believe the welcoming words on the Statue of Liberty represent a national value that supersedes traditional norms of citizenship and national culture.

    What has been largely missing has been a sharp focus on the purpose of immigration. In the past, immigration was critical in meeting the demographic and economic needs of a rapidly growing nation. Simply put, the country required lots of bodies to develop its vast expanses of land and natural resources and to work in its factories.    

    The need for foreign workers remains important, but the conditions have changed. No longer a largely rural, empty country, more than 80 percent of Americans cluster in urban and suburban areas. Many routine jobs have been automated; factories, farms and offices function more efficiently with smaller workforces. Since at least 2000, notes demographer Nicholas Eberstadt, the “Great American Escalator” has stopped working.

    These changes suggest the need to rethink national immigration policies. In a country where wages for the poorest workers have been dropping for decades and incomes have stagnated for the middle class, allowing large numbers of even poorer people into the country seems more burden than balm. They often work hard, but largely in low-income service jobs and in the low end of the health care field. In California, home to an estimated 2.7 million largely Latino undocumented immigrants, approximately three in four Latino non-citizens struggle to make ends meet, as do about half of naturalized Latino citizens, according to a recent United Way study.

    Overall, our current immigrants, legal and illegal, have not advanced as quickly as in previous generations. This, along with the crisis in much of Middle America, should be our primary national concern. This doesn’t necessarily translate to mass deportations or even severe cutbacks in legal immigration, as some, including Attorney General Jeff Sessions and several congressional Republicans, have said. But it certainly does suggest taking a fresh look at how we view immigration.    

    Learning From Abroad

    So, what kind of immigration is best for America?

    Models to consider are those that put premiums on marketable skills and language proficiency rather than family reunification. The Canadian and Australian systems, as President Trump correctly noted, are more attuned to their own national needs, compared with the U.S approach, which emphasizes family re-unification. Canadian authorities allow some 60 to 70 percent of their immigrants to come for economic purposes, notes Carter Labor Secretary Ray Marshall, supporting their system mainly by “filling vacancies that are measured and demonstrated in the Canadian economy.”    

    Such a needs-based program would be a better, and fairer, way of addressing skills shortages than the odious H-IB program, which allows temporary indentured tech workers to replace American citizens. Instead, talented newcomers would be welcomed as future citizens and given the right to negotiate their own labor rates and conditions.

    This emphasis on admitting immigrants with needed skills leaves Canadians and Australians with generally more positive views about immigration than Americans. Australia is one of only three countries in the world where children of migrants do better at school than children of non-migrants. Canadian support for immigration is particularly high in Toronto, which has been transformed from a sleepy Anglo enclave to a vibrant, diverse global capital.

    But such hospitality is not limitless. A former Canadian immigration judge told me recently, in a tone of alarm, that his country’s invitation to 25,000 Syrian refugees could incubate the same sort of disorder that we see across Europe. There, in many heavily immigrant communities, poverty and isolation has persisted, sometimes for generations.    

    I doubt many Americans would want to see the kind of social unrest we see across once peaceful places like Sweden, where women now complain of being perpetually harassed, even as supposedly feminist politicians look the other way. In France, Muslims make up about 7.5 percent of the French population compared to 1 percent in the U.S., but France has been ravaged by Islamic terrorism, Muslim-fueled anti-Semitism, and a widening cultural gap between the immigrants and the indigenous French population. In France and many other European countries, we see the rise of nativist politicians that make Donald Trump seem like Mother Theresa.

    Citizenship and National Culture

    The United States could be headed to a similar devolution. America’s ideals may be universal, but our political community has always been based on U.S. citizenship. You should not have to be an Anglo to admire the Founders, or to embrace the importance of the Constitution. Yet it’s now fashionable among some progressive activists to reject established American political traditions, which constitute a fundamental reason people have come here for the last two centuries.

    Yet the “open borders” lobby on the progressive left increasingly demeans the very idea of citizenship. In some cases, they see immigration as way to achieve their desired end of “white America.” Some advocates for the undocumented, such as Jorge Bonilla of Univision, assert that America is “our county, not theirs” referring to Trump supporters. Others, like New York Mayor Bill di Blasio, refuse to differentiate between legal and illegal immigrants.

    As usual, California leads the lunacy. Gov. Jerry Brown, who famously laid out a “welcome” sign to Mexican illegal and legal immigrants, has also given them drivers’ licenses and provides financial aid for college, even while cutting aid for middle-class residents. Some Sacramento lawmakers are pressing to give undocumented immigrants’ access to state health insurance. Senate President Pro Tem Kevin de Leon recently boasted, “Half of my family would be eligible for deportation under the executive order, because they got a false Social Security card, they got a false identification.”

    The “open borders” ideology has reached its apotheosis in “sanctuary” cities which extend legal protection from deportation to criminal aliens, including those who have committed felonies. Donald Trump opportunistically emphasized this absurd and inappropriate situation—sometimes invoking the names of murdered Americans—during his 2016 campaign. The only mystery is why it would surprise the chattering class that many voters responded to his message.

    Most Americans are more practical about immigration than politicians in either party. The vast majority of us, including Republicans, oppose massive deportations of undocumented individuals with no serious criminal record. Limiting Muslim immigration appeals to barely half of Americans. Only a minority favor Trump’s famous “big beautiful wall” on the Mexico-U.S. border.

    Yet even in California, three-quarters of the population, according to a recent U.C.-Berkeley survey, oppose “sanctuary cities.” Overall, more Americans favor less immigration than more. According to a recent Pew study, most also generally approve tougher border controls and increased deportations. They also want newcomers to come legally and learn English, notes Gallup. This is not just an Anglo issue. In Texas, by some accounts roughly one-third of all Latino voters supported Trump.

    Sadly, immigration as an issue has been totally politicized. Obama deported far more undocumented aliens than his Republican predecessor, or any previous president, for that matter, without inciting mass hysteria. To be sure, Republicans face severe challenges with new generations that are more heavily Latino and Asian and generally more positive about immigration. The undocumented account for roughly one in five Mexicans and upwards of half of those from Central American countries, meaning that overly brutal approaches to their residency would be eventual political suicide for Republicans in many key states, including Arizona, Florida, Nevada, Colorado and even Georgia.

    Any new immigration policy has to be widely acceptable — both where immigrants are common as well as those generally less diverse areas where opposition to immigration is strongest. Unlike many issues, immigration cannot be devolved to local areas to accommodate differing cultural climates; it is, and will remain, a federal issue. A policy that melds a skills-based orientation, compassion, strong border enforcement, expulsion of criminals, and forcing the undocumented to the back of the citizenship line seems eminently fair.

    Economic Growth: The Secret Sauce of Immigration Policy

    Strong, broad-based economic growth remains the key to making immigration work. A weak economy, unemployment, population density, or sudden uncontrolled surges in migration, notes a recent Economic Policy Institute, drives most anti-immigration sentiment. The labor-backed think tank suggests it would be far better to bring in migrants with skills that are in short supply and avoid temporary workers, such as H-1B visa holders, who are paid lower wages, undercutting the employment prospects for Americans.

    Given the demands of competition and changes in technology, it seems foolish to allow many additional lower-skilled people enter our country. This is not elitism: Industry needs machinists, carpenters and nurses as well as computer programmers and biomedical engineers. What we don’t need to do is flood the bottom of the labor market. Again, this reality is race-neutral. Economist George Borjas suggests that the influx of low-skilled, poorly educated immigrants has reduced wages for our indigenous poor, particularly African-Americans, but also for the recent waves of immigrants, including Mexican Americans, over the past three decades.

    Like most high-income countries, America’s fertility rate is below that needed to replace the current generation. This constitutes one rationale for continued legal immigration. But our demographic shortcomings are also entwined with lack of economic opportunity, crippling student debt, and the high cost of family-friendly housing stock. In other words, one reason Millennials are putting off having children is because they can’t afford them.

    Overall immigration is a net benefit, if the economic conditions are right. An overly broad cutback in immigration would deprive the country of the labor of millions of hard-working people, many of whom are highly entrepreneurial. The foreign-born, notes the Kaufmann Foundation, are also twice as likely to start a business as native-born Americans. It’s always been thus—and these aren’t just small, ethnic, family-owned restaurants we’re talking about. More than 40 percent of Fortune 500 companies were founded by immigrants or their offspring.    

    American immigration has succeeded in the past largely due to economic expansion. The historical lesson is clear: a growing economy, more wealth and opportunity, as well as a sensible policy, are the true prerequisites for the successful integration of newcomers into our society.

    Joel Kotkin is executive editor of NewGeography.com. He is the Roger Hobbs Distinguished Fellow in Urban Studies at Chapman University and executive director of the Houston-based Center for Opportunity Urbanism. His newest book, The Human City: Urbanism for the rest of us, was published in April by Agate. He is also author of The New Class ConflictThe City: A Global History, and The Next Hundred Million: America in 2050. He lives in Orange County, CA.

    Photo: Jonathan McIntosh