Blog

  • Debating Higher Ed: STEMs, Skills, Humanities, and Hiring

    Forget about all the perceived problems with the American higher education system, and ponder these two numbers: 12.8 million and 3.4 million.
    The first is the estimate of Americans actively looking for work and unemployed. The second is the number of job openings in the U.S. as of the end of December, according to the Labor Department.

    There are jobs to be had, and plenty of people to fill them – if only they had the right skills. But this is not yet another article on the nation’s well-documented skills mismatch (at least not directly). Rather, it’s on the educational component of this debate, which was recently brought to the surface in a new Georgetown study on the unemployment rates analyzed by students’ major field of study in college, and by columnist Virginia Postrel’s response to it for Bloomberg.

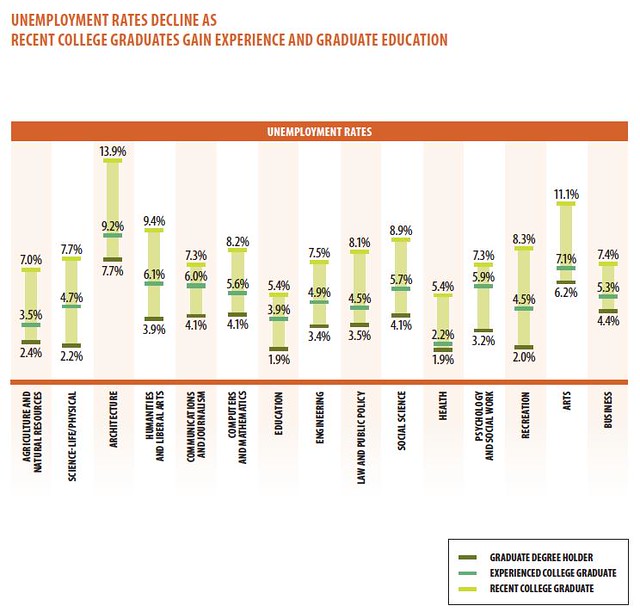
    Georgetown’s Center on Education and the Workforce, analyzing 2009-10 data on graduates from the Census Bureau’s American Community Survey, showed that the worst job prospects are for students coming out of architecture programs (13.9% unemployment), followed by arts (11.1%), humanities and liberal arts (9.4%), social science (8.9%), and law and public policy (8.1).

    Postrel acknowledges some of Georgetown’s findings but goes right at those who think the US needs students to be more career-minded. Looking at national education stats, she argues most Americans are already choosing a college major based on the prospects of landing a job upon graduation. And if the supply of "practical" workers increases, Postrel warns, the quality of the workforce will deteriorate and wages will be lower.

    “Contrary to what critics imagine,” she writes, “most Americans in fact go to college for what they believe to be ‘skill-based education.’ A quarter of them study business, by far the most popular field, and 16 percent major in one of the so-called Stem (science, technology, engineering and math) fields. Throw in economics, and you have nearly half of all graduates studying the only subjects such contemptuous pundits recognize as respectable.” Further, Postrel says those who argue for initiatives to push students in STEM fields – or away from liberal arts – disregard “the diversity and dynamism of the economy, in good times as well as bad.”

    So what’s better? Would the U.S. be better off if more students took a broad-based liberal arts approach to their education, or should more be concerned with learning a specific trade or set of skills?

    Postrel cited the National Center for Education Statistics’ report entitled "2008-09 Baccalaureate and Beyond Longitudinal Study" (PDF here), which looked at graduates from the 2007-08 academic year. Two points should be made on this study: 1) the economy and employment prospects related to certain programs have changed drastically since 2007-08, and 2) the report includes only bachelor’s degree recipients.

    With this in mind, EMSI tapped into the NCES database to get a more recent and thorough picture of the most popular programs areas for recent US grads. We looked at the total number of degrees given out in 2010 (the most recent year available from NCES) at the associate’s, bachelor’s, master’s, and doctorate level among major program categories.

    Our analysis includes degrees at the four main postsecondary levels mentioned above, not certificates or postsecondary awards. We did this to better reflect graduates who have made a more-than-one-year investment in education and have therefore given their decision serious thought.
    A few noteworthy items (see the full data here):

    • Humanities majors account for 12% of graduates in the study Postrel used; according NCES’ latest data, which uses slightly different program classifications, 9.6% of all degrees came in liberal arts and sciences, general studies and humanities. One reason for the lower percentage could be that we included associate’s degrees (as well as bachelor’s, master, and doctorate degrees) in our analysis and the NCES study looked only at bachelor’s degree holders.
    • Business, management, marketing and related programs make up the largest percentage of 2003 and 2010 degree recipients, just under 20% in both years. Postrel said a quarter of all degrees came in business (per the NCES study, it’s 23%).
    • Health professions and related programs made the biggest jump among major program categories — from 9.2% of all degree recipients in 2003 to 12.7% in 2010–and now stands No. 2 overall. The biggest reason for this has been the dramatic increase in registered nursing/LPN and medical assistant degrees (see more on the supply of RNs).
    • As a proportion of all degrees, computer and information sciences took the biggest hit — from 4.6% (127,088) in 2003 to 2.7% (94,730) in 2010.

    These stats point to a few telling short-term shifts. Yes, a significant number of all degree recipients have moved toward skill-based education. But more striking is the decline in students choosing STEM majors as a share of all graduates. In 2003, 21% of degrees awarded in the U.S. were from STEM-related programs. In 2010, that percentage dipped to 19%.

    Postrel would prefer students not be pigeonholed into going the skill-based route, even when it’s STEM-related. Yet it’s hard to ignore the illuminating data from Georgetown’s report: Recent grads in humanities and liberal arts have a 9.4% unemployment rate – lower than architecture, which has taken a beating with the construction downturn, but considerably higher than engineering (7.5%), business (7.4%), and especially health (5.4%).

    So, to go back to the question posed earlier, our economy would seem to be better off – or, to put it another way, unemployment would most improve — if more students earned a skills-based education over a liberal arts degree. At least in the short term, that appears to be the best solution to get people back to work. But outside training for a few fields, there’s no automatic path to a job. Even some new registered nursing grads – with nursing once seen as a lock to find a job – are having a hard time finding employment. And EMSI and others have written about the souring job prospects for lawyers.

    The Great Recession affected every industry in one way or another. Nonetheless, it’s worth repeating: There are 3.4 million jobs openings out there – 39% more than in June 2009. But in a sure sign that something is out of whack, hiring is only up 12% over that same time. 

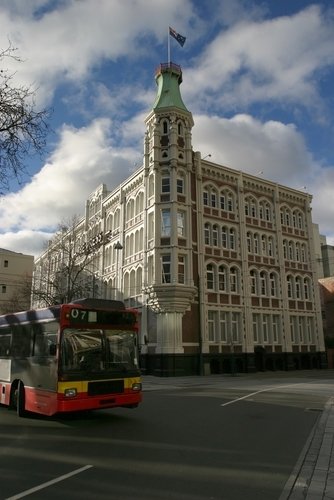
    Flickr Photo by Jason Morrison: Ann Morrison gets her Masters of Science in Nursing, Pepper Pike, Ohio.

    Joshua Wright is an editor at EMSI, an Idaho-based economics firm that provides data and analysis to workforce boards, economic development agencies, higher education institutions, and the private sector. He manages the EMSI blog and is a freelance journalist. Contact him here.

  • How Lower Income Citizens Commute

    One of the most frequently recurring justifications for densification policies (smart growth, growth management, livability, etc.) lies with the assumption that the automobile-based mobility system (Note 1) disadvantages lower income citizens. Much of the solution, according to advocates of densification is to discourage driving and orient both urbanization and the urban transportation system toward transit as well as walking and cycling.

    Of course, there is no question but that lower income citizens are disadvantaged with respect to just about everything economic. However, there are few ways in which lower income citizens are more disadvantaged than in their practical access to work and to amenities by means of transit, walking and cycling. Indeed, the impression that lower income citizens rely on transit to a significantly greater degree than everyone else is just that – an impression.

    The Data: This is illustrated by a compilation of work trip data from the five-year American Community Survey for 2006 to 2010. In the nation’s 51 major metropolitan areas (more than 1,000,000 population), 76.3% of lower income employees use cars to get to work, three times that of all other modes combined (Figure 1).

    Admittedly, this is less than the 83.3% of all employees who use cars for the work trip, but a lot more than would be expected, especially among those who believe that transit is the principal means of mobility for low income citizens. Overall, 8 times as many lower income citizens commuted by car as by transit. In this analysis, lower income citizens are defined as employees who earn less than $15,000 per year, which is approximately one-half of the median earnings per employee of $29,701. .

    Perhaps most surprising is the fact that only 9.6% of lower income citizens used transit to get to work. This is not very much higher than the 7.9% of all workers in the metropolitan areas who use transit. (Table 1).  

    Table 1
    Work Trip Market Share: 2006-2010
    Lower Income Employees and All Employees
    Metropolitan Areas Over 1,000,000 Population
      Lower Income Employees
    All Employees Market Share Employees Earning Under $15,000 Annually Market Share
    Car, Truck & Van: Alone 56.72 73.4% 9.56 63.1%
    Car, Truck & Van: Carpool 7.67 9.9% 2.00 13.2%
    Car, Truck & Van: Total 64.38 83.3% 11.56 76.3%
    Transit 6.14 7.9% 1.46 9.6%
    Walk 2.19 2.8% 0.89 5.9%
    Other (Taxi, Motorcyle, Bicycle & Other) 1.34 1.7% 0.39 2.6%
    Work At Home 3.24 4.2% 0.85 5.6%
    Total 77.29 100.0% 15.16 100.0%
    In Millions
    Note: Median Earnings: $29,701
    Source: American Community Survey: 2006-2010


    Transit’s small market share has to do with its inherent impracticality as a means of getting to most employment. According to ground-breaking research by the Brookings Institution, low-income citizens could reach only 35 percent of jobs in the major metropolitan areas by transit in 90 minutes. In other words, you cannot get from here to there, at least for most trips. It is no more reasonable for lower income citizens to spend three hours per day commuting than it is for anyone else. A theoretical 90 minute one-way standard is no indicator of usable mobility. It is likely that only about 8 percent of jobs are accessible by lower income citizens in 45 minutes (Note 2) and 4 percent in 30 minutes.

    Automobility: Among the major metropolitan areas, lower income citizens use automobiles to get to work most in Birmingham (90.6%). Fourteen other metropolitan areas have lower income automobile market shares of 85% or more, including Charlotte, Detroit, Dallas-Fort Worth, Indianapolis, Jacksonville, Kansas City, Louisville, Memphis, Nashville, Oklahoma City, Raleigh, San Antonio, St. Louis and Tampa-St. Petersburg. As in all things having to do with urban transportation, there are two Americas: New York and outside New York. By far the lowest automobile market share for low income citizens is in New York, at 49.3%. The second lowest lower income automobile market share is in San Francisco-Oakland, at 63.1%. Washington and Boston are also below 70% (Table 2).

    Table 2
    Work Trip Market Share: Car, Truck or Van: 2006-2010
    Lower Income Employees and All Employees
    Metropolitan Areas Over 1,000,000 Population
      Lower Income Employees
    Metropolitan Area All Employees Employees Earning Under $10,000 Employees Earning $10,000-$14,999 All Under $15,000 (Combined)
    Atlanta, GA 88.3% 82.1% 83.8% 82.8%
    Austin, TX 87.2% 77.8% 82.3% 79.5%
    Baltimore, MD 85.9% 73.8% 77.7% 75.1%
    Birmingham, AL 94.6% 89.3% 92.6% 90.6%
    Boston, MA-NH 77.2% 66.4% 73.4% 68.5%
    Buffalo, NY 89.7% 79.8% 84.3% 81.3%
    Charlotte, NC-SC 90.9% 85.3% 88.5% 86.4%
    Chicago, IL-IN-WI 80.0% 73.0% 77.0% 74.4%
    Cincinnati, OH-KY-IN 91.2% 82.7% 87.9% 84.4%
    Cleveland, OH 87.3% 78.1% 84.3% 80.3%
    Columbus, OH 90.8% 80.3% 87.1% 82.6%
    Denver, CO 85.3% 76.9% 82.1% 78.9%
    Detroit. MI 93.1% 85.8% 89.9% 87.2%
    Dallas-Fort Worth, TX 91.5% 85.4% 88.7% 86.7%
    Hartford, CT 89.7% 76.8% 83.1% 78.8%
    Houston. TX 90.7% 83.6% 86.4% 84.7%
    Indianapolis, IN 92.6% 85.1% 90.2% 86.9%
    Jacksonville, FL 91.6% 85.4% 88.3% 86.5%
    Kansas City,  MO-KS 90.6% 85.2% 87.6% 86.2%
    Los Angeles, CA 84.7% 70.8% 74.1% 72.2%
    Las Vegas, NV 89.7% 80.0% 82.4% 81.0%
    Louisville, KY-IN 92.4% 85.6% 87.6% 86.3%
    Memphis, TN-MS-AR 93.3% 85.0% 89.6% 86.7%
    Miami, FL 88.3% 79.0% 80.9% 79.9%
    Milwaukee, WI 89.3% 78.0% 83.5% 79.8%
    Minneapolis-St. Paul, MN-WI 86.8% 76.9% 81.1% 78.2%
    Nashville, TN 92.0% 86.8% 89.5% 87.8%
    New Orleans, LA 90.0% 80.9% 83.8% 82.0%
    New York, NY-NJ-PA 57.6% 50.0% 48.1% 49.3%
    Oklahoma City, OK 93.1% 86.8% 90.8% 88.2%
    Orlando, FL 89.6% 79.7% 86.1% 81.8%
    Pittsburgh, PA 86.2% 77.9% 81.8% 79.2%
    Philadelphia, PA-NJ-DE-MD 82.1% 70.6% 76.2% 72.4%
    Phoenix, AZ 88.6% 80.5% 83.9% 81.8%
    Portland, OR-WA 81.6% 69.3% 75.1% 71.3%
    Providence, RI-MA 89.9% 79.9% 87.1% 82.3%
    Raleigh, NC 90.8% 84.0% 88.0% 85.4%
    Rochester, NY 89.9% 76.7% 87.0% 80.0%
    Riverside-San Bernardino, CA 90.6% 83.4% 87.1% 84.8%
    Richmond, VA 91.3% 83.2% 86.2% 84.2%
    Sacramento, CA 90.7% 80.8% 86.3% 82.9%
    San Antonio, TX 92.1% 85.7% 88.2% 86.6%
    San Diego, CA 85.9% 73.6% 79.9% 76.0%
    Seattle, WA 81.3% 72.4% 76.1% 73.7%
    San Francisco-Oakland, CA 72.4% 63.3% 63.4% 63.3%
    San Jose, CA 87.1% 74.3% 80.2% 76.4%
    Salt Lake City, UT 88.1% 79.6% 83.4% 81.0%
    St. Louis, MO-IL 91.1% 83.8% 88.6% 85.4%
    Tampa-St. Petersburg, FL 90.1% 84.1% 87.6% 85.5%
    Virginia Beach-Norfolk, VA-NC 89.8% 81.9% 81.8% 81.9%
    Washington, DC-VA-MD-WV 77.1% 67.8% 71.4% 69.0%
    Total: 51 Metropolitan Areas 83.3% 75.1% 78.3% 76.3%
           New York 57.6% 50.0% 48.1% 49.3%
          Outside New York 86.5% 77.8% 81.8% 79.3%
    Average of Metropolitan Areas 87.7% 78.9% 83.0% 80.4%
    Median 89.7% 80.0% 84.3% 81.8%
    Maximum 94.6% 89.3% 92.6% 90.6%
    Minimum 57.6% 50.0% 48.1% 49.3%
    Note: Median Earnings: $29,701
    Source: American Community Survey: 2006-2010


    Transit: It’s not surprising that New York has by far the highest transit market share among lower income commuters. However, New York’s lower income transit market share is only marginally higher than its market share among all commuters, at 31.5%, compared to 30.0% for the entire workforce. San Francisco-Oakland had the second highest lower income transit market share at 16.8%. Boston, Chicago, Philadelphia and Washington were also above 10%. The lowest transit market share among lower income citizens was 1.1% in Oklahoma City. Six other metropolitan areas had lower income transit market shares under 2.5%, including Birmingham, Indianapolis, Jacksonville, Nashville, Raleigh and San Antonio (Table 3).

    Table 3
    Work Trip Market Share: Transit: 2006-2010
    Lower Income Employees and All Employees
    Metropolitan Areas Over 1,000,000 Population
      Lower Income Employees
    Metropolitan Area All Employees Employees Earning Under $10,000 Employees Earning $10,000-$14,999 All Under $15,000 (Combined)
    Atlanta, GA 3.4% 5.6% 6.2% 5.8%
    Austin, TX 2.6% 5.9% 5.3% 5.6%
    Baltimore, MD 6.3% 9.8% 9.3% 9.6%
    Birmingham, AL 0.7% 1.8% 1.8% 1.8%
    Boston, MA-NH 11.9% 12.3% 13.3% 12.6%
    Buffalo, NY 3.7% 6.9% 5.8% 6.6%
    Charlotte, NC-SC 2.0% 3.5% 3.1% 3.3%
    Chicago, IL-IN-WI 11.4% 11.9% 12.5% 12.1%
    Cincinnati, OH-KY-IN 2.4% 4.3% 3.8% 4.1%
    Cleveland, OH 2.7% 5.3% 3.1% 4.5%
    Columbus, OH 1.7% 3.5% 3.8% 3.6%
    Denver, CO 4.6% 7.2% 7.2% 7.2%
    Detroit. MI 1.5% 3.5% 3.1% 3.3%
    Dallas-Fort Worth, TX 1.6% 2.6% 2.9% 2.7%
    Hartford, CT 2.8% 5.4% 5.0% 5.3%
    Houston. TX 2.6% 4.1% 4.3% 4.1%
    Indianapolis, IN 1.0% 2.6% 1.6% 2.2%
    Jacksonville, FL 1.1% 2.5% 2.4% 2.5%
    Kansas City,  MO-KS 1.7% 3.8% 3.4% 3.6%
    Los Angeles, CA 6.1% 11.7% 13.9% 12.6%
    Las Vegas, NV 3.6% 7.4% 7.6% 7.5%
    Louisville, KY-IN 2.2% 4.7% 3.7% 4.3%
    Memphis, TN-MS-AR 1.3% 3.3% 3.1% 3.3%
    Miami, FL 3.7% 7.9% 8.3% 8.1%
    Milwaukee, WI 3.7% 7.7% 7.4% 7.6%
    Minneapolis-St. Paul, MN-WI 4.6% 6.4% 6.4% 6.4%
    Nashville, TN 1.0% 1.8% 2.0% 1.9%
    New Orleans, LA 2.5% 5.0% 5.3% 5.1%
    New York, NY-NJ-PA 30.5% 30.0% 34.0% 31.5%
    Oklahoma City, OK 0.5% 1.3% 0.8% 1.1%
    Orlando, FL 3.9% 7.4% 5.9% 6.9%
    Pittsburgh, PA 5.8% 6.2% 6.4% 6.3%
    Philadelphia, PA-NJ-DE-MD 9.3% 12.2% 11.8% 12.1%
    Phoenix, AZ 2.2% 4.2% 4.9% 4.5%
    Portland, OR-WA 6.2% 9.3% 8.3% 8.9%
    Providence, RI-MA 2.6% 3.3% 3.2% 3.3%
    Raleigh, NC 0.9% 1.9% 2.1% 2.0%
    Rochester, NY 2.0% 4.8% 3.0% 4.2%
    Riverside-San Bernardino, CA 1.6% 2.7% 2.3% 2.6%
    Richmond, VA 1.9% 3.8% 4.4% 4.0%
    Sacramento, CA 2.2% 5.1% 4.6% 4.9%
    San Antonio, TX 1.3% 2.3% 2.8% 2.5%
    San Diego, CA 3.3% 6.9% 6.1% 6.6%
    Seattle, WA 8.2% 9.9% 10.5% 10.1%
    San Francisco-Oakland, CA 14.6% 15.8% 18.4% 16.8%
    San Jose, CA 3.3% 6.1% 6.0% 6.1%
    Salt Lake City, UT 3.2% 5.2% 4.5% 5.0%
    St. Louis, MO-IL 2.6% 4.8% 3.4% 4.4%
    Tampa-St. Petersburg, FL 1.4% 2.9% 2.3% 2.7%
    Virginia Beach-Norfolk, VA-NC 1.7% 3.8% 4.7% 4.1%
    Washington, DC-VA-MD-WV 13.9% 14.3% 15.8% 14.8%
    Total: 51 Metropolitan Areas 7.9% 9.4% 10.1% 9.7%
           New York 30.5% 30.0% 34.0% 31.5%
          Outside New York 5.1% 7.1% 7.4% 7.2%
    Average of Metropolitan Areas 4.3% 6.3% 6.3% 6.3%
    Median 2.6% 5.1% 4.7% 4.9%
    Maximum 30.5% 30.0% 34.0% 31.5%
    Minimum 0.5% 1.3% 0.8% 1.1%
    Note: Median Earnings: $29,701
    Source: American Community Survey: 2006-2010


    Automobile and Transit Metrics: The difference in automobile commuting between all employees and lower income employees turns out to be surprisingly small. The least variation is in Birmingham, where the automobile market share among lower income commuters is 4.3% below that of all commuters. Charlotte, Kansas City and Nashville also have lower income market share variations of less than 5%. The greatest variation is in Los Angeles, where the automobile market share among lower income commuters is 14.7% less than for all commuters. The lower income automobile market share is also at least 12.5% below that of all commuters in Baltimore, New York and Portland.

    Oklahoma City has the most lower income automobile commuters in relation to transit commuters, with 81.3 times as many lower income commuters using automobiles as opposed to transit. In Birmingham, Nashville and Raleigh, there are more than 40 lower income automobile commuters per transit commuter.  In contrast, the number of low-income automobile commuters in New York is 1.6 times that of lower income transit commuters. Again, New York is in a class by itself (Figure 2). Outside New York, there are 11.0 times as many lower income automobile commuters as transit commuters. San Francisco-Oakland (3.8) and Washington (4.7) are the only other metropolitan areas with fewer than five lower income automobile commuters per transit commuter (Table 4).

    Table 4
    Work Trip Market Share: 2006-2010
    Lower Income Employees and All Employees
    Metrics: Car, Truck or Van & Transit
    Metropolitan Areas Over 1,000,000 Population
    Lower Income Car, Truck or Van Market Share Compared to All Car Truck or Van Market Share Times Transit
    Metropolitan Area Employees Earning Under $10,000 Employees Earning $10,000-$14,999 All Under $15,000 (Combined)
    Atlanta, GA -7.0% -5.0% -6.3% 14.2
    Austin, TX -10.8% -5.5% -8.8% 14.1
    Baltimore, MD -14.1% -9.6% -12.6% 7.8
    Birmingham, AL -5.6% -2.1% -4.3% 50.7
    Boston, MA-NH -14.1% -5.0% -11.2% 5.4
    Buffalo, NY -11.1% -6.0% -9.4% 12.4
    Charlotte, NC-SC -6.1% -2.6% -4.9% 25.9
    Chicago, IL-IN-WI -8.8% -3.8% -7.0% 6.1
    Cincinnati, OH-KY-IN -9.3% -3.6% -7.4% 20.4
    Cleveland, OH -10.5% -3.3% -8.0% 17.7
    Columbus, OH -11.5% -4.0% -9.0% 23.1
    Denver, CO -9.8% -3.8% -7.5% 10.9
    Detroit. MI -7.8% -3.5% -6.4% 26.2
    Dallas-Fort Worth, TX -6.7% -3.0% -5.2% 31.7
    Hartford, CT -14.4% -7.4% -12.2% 15.0
    Houston. TX -7.9% -4.8% -6.6% 20.5
    Indianapolis, IN -8.1% -2.5% -6.2% 39.1
    Jacksonville, FL -6.8% -3.6% -5.6% 35.1
    Kansas City,  MO-KS -5.9% -3.4% -4.9% 23.7
    Los Angeles, CA -16.4% -12.4% -14.7% 5.7
    Las Vegas, NV -10.8% -8.1% -9.8% 10.8
    Louisville, KY-IN -7.4% -5.3% -6.6% 19.9
    Memphis, TN-MS-AR -9.0% -4.0% -7.1% 26.7
    Miami, FL -10.5% -8.4% -9.6% 9.9
    Milwaukee, WI -12.6% -6.5% -10.6% 10.5
    Minneapolis-St. Paul, MN-WI -11.4% -6.5% -9.8% 12.2
    Nashville, TN -5.7% -2.7% -4.6% 46.1
    New Orleans, LA -10.2% -6.9% -8.9% 15.9
    New York, NY-NJ-PA -13.1% -16.5% -14.4% 1.6
    Oklahoma City, OK -6.8% -2.5% -5.3% 81.3
    Orlando, FL -11.1% -3.9% -8.7% 11.8
    Pittsburgh, PA -9.7% -5.2% -8.2% 12.7
    Philadelphia, PA-NJ-DE-MD -14.0% -7.2% -11.8% 6.0
    Phoenix, AZ -9.1% -5.3% -7.6% 18.1
    Portland, OR-WA -15.1% -7.9% -12.5% 8.0
    Providence, RI-MA -11.1% -3.1% -8.4% 25.3
    Raleigh, NC -7.4% -3.1% -5.9% 42.8
    Rochester, NY -14.7% -3.3% -11.0% 19.1
    Riverside-San Bernardino, CA -8.0% -3.9% -6.5% 32.7
    Richmond, VA -8.9% -5.6% -7.7% 20.9
    Sacramento, CA -10.9% -4.8% -8.6% 17.0
    San Antonio, TX -7.0% -4.2% -6.1% 35.1
    San Diego, CA -14.3% -7.0% -11.5% 11.5
    Seattle, WA -10.9% -6.4% -9.3% 7.3
    San Francisco-Oakland, CA -12.5% -12.4% -12.5% 3.8
    San Jose, CA -14.7% -8.0% -12.3% 12.6
    Salt Lake City, UT -9.6% -5.3% -8.1% 16.3
    St. Louis, MO-IL -8.0% -2.8% -6.3% 19.6
    Tampa-St. Petersburg, FL -6.6% -2.7% -5.1% 31.8
    Virginia Beach-Norfolk, VA-NC -8.7% -8.9% -8.8% 19.8
    Washington, DC-VA-MD-WV -12.0% -7.3% -10.4% 4.7
    Total: 51 Metropolitan Areas -9.8% -6.0% -8.4% 7.9
           New York -13.1% -16.5% -14.4%                   1.6
          Outside New York -10.1% -5.5% -8.4% 11.0
    Average of Metropolitan Areas -10.1% -5.5% -8.5% 12.7
    Median -9.8% -5.0% -8.2%                17.0
    Maximum -5.6% -2.1% -4.3%                81.3
    Minimum -16.4% -16.5% -14.7%                   1.6
    Note: Median Earnings: $29,701
    Source: American Community Survey: 2006-2010


    A Line Driven in a Car: Why is this the case?  The "bottom line" has been perhaps best characterized by Marge Waller and Mark Allen Hughes in a research paper for the Progressive Policy Institute of the Democratic Leadership Council.

    In most cases, the shortest distance between a poor person and a job is along a line driven in a car. Prosperity in America has always been strongly related to mobility and poor people work hard for access to opportunities. For both the rural and inner-city poor, access means being able to reach the prosperous suburbs of our booming metropolitan economies, and mobility means having the private automobile necessary for the trip. The most important response to the policy challenge of job access for those leaving welfare is the continued and expanded use of cars by low-income workers

    Concerns about the automobile based urban transportation system excluding lower income citizens are misplaced. Despite all the hand-wringing, America’s lower income population has considerable access to cars and far greater mobility as a result. It is no more than a figment of planner’s imaginations that lower income citizens would be best served by constraining car use and trying to force them into transit service that more often than not gives circuitous, slower and often impossible for access to work opportunities.

    Wendell Cox is a Visiting Professor, Conservatoire National des Arts et Metiers, Paris and the author of “War on the Dream: How Anti-Sprawl Policy Threatens the Quality of Life

    —–

    Note 1: As used in this article, automobile includes cars, trucks and vans.

    Note 2: This estimate estimates lower income 45 minute access using the ration between 90 minute and 45 minute for all employees (as reported in the Brookings Institution report)

    Photograph: Classic early 1950s Buick, Sinsheim Auto & Technik Museum, Sinsheim, Baden-Württemberg, Germany (by author).

  • New Urbanism vs. Dispersionism

    The Florida real estate developer, unburdened of state regulatory agencies, may now focus his efforts on pleasing the investment community and the local market.  I recently played the role of real estate developer interviewing two consultant teams vying to help me create a new fictional community.  Fortified with readings in both the New Urbanist camp and the Dispersionist camp, each team of students pitched their method of community building to me. 

    The actual debate was very lively, with many rebuttals and some serious emotional engagement.  The premise:  I have a multi-acre greenfield property.   I have shortlisted my planning candidates down to two:  a New Urbanist team, and a Dispersionist team.  Each team must pitch their philosophy, and I will select one team to design it.

    Question 1:  Since I am only able to afford Phase 1, future phases will be left to future developers.  In your approach, can future generations be trusted to keep focus on high-quality development?  How would you guarantee that the property rises in value?  I asked the New Urbanists to go first.

    The New Urbanist team was ready:  As Master Planners, they will create the entire form-based vision for the property and design it around a smart code so that the future developers will obey a plan to keep property values rising.  No future developer will get to ‘cheap out’.  For this team, the Master Plan will guarantee a quality of life for all residents.

    The Dispersionists will plan Phase 1, not as a rigid image of a town, but rather as a response to the natural landscape.  This team said the community would grow organically, from its functional needs, guaranteeing  the freedom of future generations to plan their own destiny. They  scoffed at a Master Plan that determined the urban form.  What good is a guarantee of a quality of life, they asked, if future generations want something different than the Master Planner intended?

    This round, in my mind, went to the Dispersionists.  Their argument that future generations should have the freedom to plan based on their functional needs outweighed the seductive beauty of a Master Plan.  Too many Master Plans are implemented poorly, or abandoned due to their disutility based on changing needs and markets.

    Question 2:  How does your viewpoint deal with the car?  How will residents and visitors get around your community?  I asked the Dispersionists to go first this time.

    “Well,” replied the Dispersionists, “Americans love their cars, and we love the car too.  We’ll plan for sidewalks and bikes, but we know that the car is a necessity.  We know that a 5-minute walk isn’t so realistic in Florida’s hot, humid climate.”  The Dispersionists have a hearty regard for cars, and they spoke of long, sweeping curves and scenic drives.  They pointed out that most residents will need to drive to other parts of the city as well.

    The New Urbanists shuddered.  “We will plan for car-free living,” they stated.  With very clever planning, they intended to keep driving to a minimum, and will design walking trails.  One New Urbanist ventured 4-story parking garages, crowing that their proposal would not be littered with gas stations.  The New Urbanists pointed out the ugly commercial strips dominating our current city, and how little they want that to intrude into the new development.

    I liked this, and challenged the Dispersionists.  Isn’t it better health, and less use of oil, to reduce vehicle dependency?  The Dispersionists asked me why, in this ten-acre community, I thought I could attract residents with 4-story parking garages?  Good point, I thought.

    Both sides had good answers, and the question did not fully go to one side or the other.  Cars do tend to  generate a lot of aesthetic horror.  On the other hand, they are not going away anytime soon, so learning how to deal with them seems like an important task for a developer looking to the future.

    Question 3:  How would you distribute density in your development?  One center, multiple centers, and centered around what?  This time the New Urbanists went first.

    The core, they stated, will be in the center of town, and could go to 8-10 stories, leaving the perimeter a green zone.  In the center will be the government and institutional buildings, carefully matched with proper style.  The point, they said, is predictability. They pledged to learn from the failures of the past, and their Master Plan will account for the full scope of development.

    The Dispersionists suggested multiple centers.  “Phase 1 will be our first density cluster,” they said, “and we’ll see how it goes.”  Unlike the New Urbanists, they didn’t want to introduce all their product at once, in case the market changes.  “We believe in New England-style green space,” they said, and wanted to evolve the community around these.  They saw the vitality of the community coming from diversity.

    I asked the New Urbanists what they would do if the market changes .  When pressed, they insisted their Master Plan had plenty of contingency plans in case the original plan wasn’t workable, but it sounded like they were winging it.

    This is what  the Dispersionists saw as their own strong suit.  “We don’t have all the answers,” they said.  Their first phase would gently nudge the community in a certain direction, but it would leave future developers the choice whether to reinforce the first phase, or strike out and build another phase better suited to a unique need.

    I felt that this round went to the Dispersionists. 

    Question 4:  Do you think your development scheme can promote or discourage social values?  Why or why not?  This time the Dispersionists went first.

    The Dispersionists believed that one cannot engineer social values through urban design.  However, they can be influenced.  Conservation, for example, is a value that they would promote in their plan to conserve open space and not overtake the land with development.  A sense of community, they said, was another, giving people a loyalty to their community out of good design.  These, they felt, led to a sustainable plan.

    The New Urbanists guaranteed that conservation land would always be there, and pointed out the Dispersionists’ flexibility as a negative . The New Urbanists insisted that their sense of place would be stronger, because it would be designed.  People want predictability.  New Urbanists would engage people by walking and having front porches.

    The Dispersionists speculated that neighbors will get to know one another in a cul-de-sac just as well as they would if they all had front porches.  They also felt that the shared experiences of a community would transcend the particular style or form that community took.

    Although I gave this one to the New Urbanists, I was skeptical about  the New Urbanists’ implication that well-behaved buildings produce well-behaved people.  The Dispersionists’ view that a cul-de-sac breeds any neighborly closeness also seemed a bit disingenuous.  It was near the end of class.

    Question 5:  Give me your arguments why your strategy is sustainable.  I let the New Urbanists go first.

    For one thing, they said, they will have more efficient transportation. Vertical buildings save land, they argued, and people who choose this community will value open space more highly and be willing to live densely.  They believed that they will have less gridlock by de-emphasizing the car and will be more stable and socially cohesive.  All this will come from a well-designed Master Plan.

    The Dispersionists said  their community would start small and then grow.  Failures won’t cause dead zones, they claimed, because they are not sentimental about form and want a community that works.  So if a building in their development begets a failed business, the building will need to be reinvented to make it successful.

    “Yes, but,” countered the New Urbanists, “for every successful community like yours, there are 10 that have failed and ultimately decline in value.  What guarantee do you give that you will be the one out of ten?”  They went on to cite their successes – Seaside, Celebration, and so on.

    The Dispersionists noted that Seaside was a resort town and Celebration was heavily subsidized by a local employer, so those weren’t exactly good models.  In any case, they said, their community will appeal to a much broader segment of the population than the New Urbanists, and therefore more likely to sustain growth in the future.

    With that, the debate was concluded.  What lingers, however, are some truths that show both sides need to do some more work.

    The New Urbanists, fresh on the scene, seem overly evangelical in their approach, and demand a great deal of faith in the Master (Planner).  The slow, organically grown towns of which they are so fond were largely planned before the car.  While many of these towns, like Charleston, South Carolina, are sentimental favorites, their practical replication in today’s transportation-intensive, constantly changing real estate market is questionable.

    The Dispersionists, on the other hand, have been around for quite a long time, and are the modus operandi for much of the earth’s population.  They seem uninvolved in the aesthetics of the built environment, preferring to leave this up to individual taste, and the result is a rather shabby, cluttered contemporary American scene.  Some cleaning up is certainly in order.

    While the New Urbanists have a hopeful approach in this regard, they are overreacting to the vast consumer-oriented real estate development world that operated up until 2007, and are missing the fundamentals of how a real community works.  None are built around employers or economic producers in any significant way. None admit the lowest socioeconomic groups.  Content, perhaps, to dabble with shopping districts and farmer’s markets, New Urbanists have yet to offer what contemporary employers need – space, flexibility, and room to grow.  They therefore seem doomed to create peripheral urban designs rather than communities integrated with 21st century employers.

    Dispersionists would do well to pay a bit more attention to the natural environment, for the general public is quite aware of the toll that this strategy has taken.  Developers, having overbuilt in so many markets recently, will face tough opposition to bulldozing another woodland, given the empty real estate that exists in our cities today.

    It seems inevitable that dispersionist strategies will continue; they largely dominate our real estate development world and will continue to do so.  They make the most economic sense, they leave the future choices to the future generations, and they respond to people’s natural density tendencies.  One hopes that the New Urbanists will nudge the market a bit more towards aesthetic continuity and environmental stewardship as the next wave of growth inevitably begins again, and that the debate remains healthy, productive, and positive as citizens get re-engaged about the future of their cities.

    Richard Reep is an Architect and artist living in Winter Park, Florida. His practice has centered around hospitality-driven mixed use, and has contributed in various capacities to urban mixed-use projects, both nationally and internationally, for the last 25 years.

    Photo courtesy of BigStockPhoto.com.

  • Trials, Tribulations and Middle Class Protest in Christchurch, New Zealand

    It has been a tough year and a half in Christchurch. Christchurch is the largest urban area South Island and second in size in New Zealand only to Auckland. On September 4, 2010, Christchurch was hit by a 7.1 magnitude earthquake, stronger than the 7.0 magnitude earthquake that with its aftershocks killed 300,000 people in Haiti in 2010. To the great fortune of Christchurch, there were no fatalities from the September quake.

    In Christchurch, the earthquakes just kept coming and the luck ran out. A major aftershock nearly a year ago (February 22, 2011) registered 6.3, but did much more damage to buildings and infrastructure weakened by the September 2010 quake. A total of 184 people lost their lives, with more than one-half of the victims in the Canterbury Television (CTV) building (photo), which collapsed. Many of the victims in the building were foreign students. The area’s tallest building, the 23-story Grand Chancellor Hotel (photo) was condemned and demolition is underway. Another major hotel, the Crowne Plaza, was too damaged to be repaired and will be demolished. A number of heritage buildings were also condemned and have either been demolished or will be, such as the Manchester Courts (photo), built more than 105 years ago and the Christchurch Press building (photos: before and after), which housed the city’s daily newspaper.

    The city’s fabled Christ Church Cathedral (Anglican/Episcopal) was badly damaged (photos: before and after). The damage was ecumenical, with the Catholic Cathedral of the Blessed Sacrament also suffering serious damage (photos: before and after). Strong aftershocks in June and December of 2011 did additional damage. Much of the central business district was declared a "red zone," off limits except for special permission (red zone map). Finally, the disasters have been a serious enough blow to the nation to cause postponement the 2011 census to 2013.

    For many of the survivors, the earthquakes were just the beginning. In the eastern part of the urban area, toward the Pacific Ocean, streets, houses and commercial buildings were undermined by liquefaction. New Zealand Prime Minister John Key said that 10,000 homes would need to be condemned. Some neighborhoods will not be rebuilt because of potential future liquefaction.

    In the meantime, there has been growing dissatisfaction with the area’s largest municipality (local government authority), the city of Christchurch. Replacement housing consents have been slow in coming and far slower than in neighboring suburban municipalities. This has caused considerable concern for households needing to move and rebuild.

    Then, the city council narrowly approved a 15 percent, $68,000 salary increase ($56,000 US) for the city council chief executive (city manager) Tony Marryatt. The pay raise ignited the unusual phenomenon of an everyday citizen’s protest movement. Marryatt initially defended the pay raise to $540,000 ($450,000 US) claiming he would be paid the market rate. As the debate intensified, Marryatt subsequently decided to decline the pay raise. That was not enough for the protesters, who include homeowners, business owners, members of the clergy and an array of citizens. Protesters demanded that Marryatt resign, that Mayor Bob Parker resign and that the national government schedule new elections.

    For his part, Mayor Parker’s television interview doublespeak characterizing the $68,000 as "not a pay rise" and then mumbling on about "paying the market rate," won him no friends. In the same interview, protest leader, the Reverend Mike Coleman questioned the council executive’s travel for golfing outings to North Island and travel to Australia’s resort Gold Coast. Coleman was particularly critical of Marryatt’s not having interrupted his Gold Coast vacation to return to Christchurch after the December aftershocks.

    On Wednesday, February 1, an estimated 4,000 people (according to the police) gathered in Christchurch at a rally to press their demands. A television report called the "most poignant moment" a speech by firefighter Kelvin Hampton, who told of having to perform a double amputation with "a hacksaw and a knife" above the knee of a victim. Hampton noted the irony that his annual salary was less than the salary increase for the council executive.

    A protest committee released an open letter to Dr. Nick Smith, the Minister for Local Government calling for the national government to:

    • Call for mid-term (unscheduled) elections for city council and mayor
    • "to impress on our council to develop a process that will address the issues around the council holding up the rebuild of Christchurch. This will include how and when to fast-track land-zoning changes, sub-divisions and other consents in an open and transparent way, while ensuring that the suitability of the land and the safety of the buildings is assured."

    The protest committee also called upon Mayor Parker and sitting councilors to "commit to transparency and accountability to the people they were elected to serve in the lead up to new elections."

    TVNZ highlighted the uniqueness of the protest, running a feature on Andrea Cummings, who had never participated in such a protest before. She and her husband run a small business in a hard hit neighborhood
    of east Christchurch. Like Ms. Cummings, most of the attendees had not protested before, though one lady indicated that she had participated in Viet Nam war protests in college.

    Where it goes from here cannot be said. Mayor Parker remains confidently in charge, with the council executive by his side. And, the protesters are determined to keep up the fight. Christchurch may never have seen such a thing before.

  • The Three Laws of Future Employment

    As a college educator I am tasked with preparing today’s students for their future careers.

    Implicit is that I should know more about the future than most people. I do not – at least not in the sense of specific predictions. But I can suggest some boundaries on the path forward.

    Let’s start with the three Laws of Future Employment. Law #1: People will get jobs doing things that computers can’t do. Law #2: A global market place will result in lower pay and fewer opportunities for many careers. (But also in cheaper and better products and a higher standard of living for American consumers.) Law #3: Professional people will more likely be freelancers and less likely to have a steady job.

    Usually taken for granted is that future jobs depend on STEM disciplines (science, technology, engineering, and math). This view is eloquently expounded by Thomas Friedman, who argues that the US is falling behind China and India in educating for STEM careers.

    Alex Tabarrok makes a case for STEM in his excellent little e-book, Launching the Innovation Renaissance. He points out that “the US graduated just 5,036 chemical engineers in 2009, no more than we did 25 years ago. In electrical engineering there were only 11,619 graduates in 2009, about half the number of 25 years ago.” Similarly, the numbers of US computer science grads is flat over the past quarter century. Thus Tabarrok believes the US is falling behind in innovation and related technologies.

    But Tabarrok and much of the conventional wisdom are  wrong. The job that electrical engineers did 25 years ago has almost nothing to do with the job they do today. Computers now do much of the work that people used to do – computers design circuits, do all the drafting, plan the manufacturing, etc. It used to be that an electrical engineer designed the electronics in your car. To some extent they still do, but today even the smallest components come with operating systems – in other words, your car is programmed rather than designed. Electrical engineering is a career that follows Law #1: much of it has been (and will continue to be) computerized out of existence.

    Computer science careers illustrate Law #2. Computer science services are among the most tradable in the world. It is literally a global job market. Thus the number of computer scientists graduating from American colleges is an irrelevant number. Further, computer science jobs are themselves being computerized. The job description for today’s computer scientist is only tenuously related to what they did 25 years ago.

    Laws #1 & 2 predict that there will likely be fewer STEM jobs in the future – they are both easily computerized and tradable. People will always be employed in STEM disciplines, many of them highly paid, but they’ll be paid for smarts rather than education. The disciplines will be much more competitive, with older and less talented workers left on the sidelines. Tom Friedman and Alex Tabarrok, reflecting conventional wisdom,  are mistaken in maintaining that increasing STEM education is a key to future economic competitiveness.

    So if computerized, tradable skills won’t create much new employment, if any, what will? Clearly, it will be non-tradable skills that can’t be computerized. At their most valuable these jobs depend on human-human interaction – empathy. Counseling (of any sort: psychiatric, financial, weight loss, etc.), sales, customer service, management, and personal services all rely on empathy, as does waitressing. While much teaching can be computerized, what remains will depend more on empathy than anything else. “They don’t care what you know, but they will know if you care,” is a maxim future teachers should take to heart.

    According to Ronald Coase it is generally cheaper to engage freelance labor than to hire employees, unless the market transaction costs are too high. The internet lowers transaction costs and makes smaller firms (fewer employees) more economical. Thus we arrive at the Third Law of Future Employment: professional people will more likely be freelancers and less likely to have jobs. This already happens in computer science: projects are put out to bid on websites for global competition. Much journalism today is freelance, as is graphic design, engineering, or any number of other skills. The third law predicts this trend will grow.

    The bottom line is that today’s young people need to develop an individually unique set of marketable skills for tomorrow’s job market. A marketable skill is more than an education (which is not a skill), and also more than just job training (a skill, but no larger expertise). The useful benchmark is it takes 10,000 hours to become expert in something.

    I recently had a student – an English major – in my chemistry class. He had no good reason for being there; he could have fulfilled requirements with much less effort. So I asked him why?

    “It fit into my schedule and I felt like doing it. I like it.”

    “What are you going to do with an English degree?” I asked.

    “I’m writing a novel. It’s about cowboys.”

    Now conventional wisdom says this guy is all wet. Alex Tabarrok would have him drop the English degree in favor of chemistry (or chemical engineering). His English professors will say that his chances of publishing a novel (much less earning a living off one) are next to zero. SUNY Chancellor Nancy Zimpher has Six Big Ideas for SUNY – and my student doesn’t fit into any of them.

    But think about the skill set needed to write a novel, of which writing may be the least of it. He has to have something to write about, which means nurturing a general curiosity about the world – not just cowboys, but apparently also chemistry. He learns to be a keen observer of people: their appearance, what they wear, their character, mannerisms, and language. He develops the self-discipline and self-confidence to finish a project because it is intrinsically important, not because people say “Wow, that’s wonderful. You’re writing a novel!” Because of his novel my student becomes expert in many skills that can translate into a wonderful career.

    How is that different from mere education? The typical English major writes papers comparing Proust with Balzac. Not that there’s anything wrong with that, but it isn’t building the 10,000 hours.  It simply amounts to following directions carefully, and eventually collecting a credential. True expertise, by contrast, is something self-generated, following your own passion and talents. This isn’t to say education is always a waste of time, but it will no longer be sufficient to build a career.

    So here is my career advice to today’s students:

    • If you passionately like something and are good at it, then do that. STEM, for example, will always have a place for smart, hardworking people. Likewise, good writing can’t be computerized, but you need both talent and passion to be successful.
    • Start work on the 10,000 hours. Your education may help, but very little you do in school contributes to the total. Be it car detailing, truck driving, computer programming, drawing, writing – acquire an expert skill in something. Write a novel.
    • Empathize if you can. Computers can’t do that. Jobs that involve empathy (along with other skills) will always be in demand.
    • If you got it, flaunt it. That’s something else computers can’t do. Beauty has value, especially for women but also for men. This is wonderfully described in Catherine Hakim’s book, Erotic Capital. Even if you don’t got it, take advantage of youth. Acquire a fashion sense, take care of yourself, look as good as you can.

    Work hard. Have fun. Get rich.

    Daniel Jelski is a professor of chemistry at New Paltz, and previously served as dean of New Paltz’s School of Science & Engineering.

  • Why Pleas to Increase Infrastructure Funding Fall on Deaf Ears

    Letting the nation’s roads and bridges deteriorate may worsen traffic congestion and add to our commuting woes, but when water and sewer systems begin to fail our very civilization is at risk. That is the message of a recent story in The Washington Post drawing attention to the alarming state of the nation’s water and sewer infrastructure. The story looks at the Washington D.C. system as a poster child for neglected and dilapidated municipal utilities. The average age of the District water pipes is 77 years and a great many were laid in the 19th century, notes the Post article. Emergency crews rush from site to site to tackle an average of 450 breaks a year. ("Billions needed to upgrade America’s leaky water infrastructure," by Alfred Halsey III, January 2, 2012).

    Antiquated municipal water and sewer systems are indeed a ticking bomb— all the more so since their deterioration, unlike that of highways and bridges— remains invisible until a break occurs. But maintaining water and sewer infrastructure in a state of good repair is a fairly straightforward challenge. Water supply and sewers are a public utility and as such they can cover their maintenance and replacement costs through user fees. So can many other public services such as electricity, natural gas, broadband and telecommunications. The ability to charge for service (and to raise rates as necessary) assures public utilities a steady and reliable stream of revenue with which to maintain, preserve and grow their assets.

    Finding the resources to keep transportation infrastructure in good order is a more difficult challenge. Unlike traditional utilities, roads and bridges have no rate payers to fall back on. Politicians and the public seem to attach a low priority to fixing aging transportation infrastructure and this translates into a lack of support for raising fuel taxes or imposing tolls.

    Investment in infrastructure did not even make the top ten list of public priorities in the latest Pew Research Center survey of domestic concerns. Calls by two congressionally mandated commissions to vastly increase transportation infrastructure spending have gone ignored. So have repeated pleas by advocacy groups such as Building America’s Future, the U.S. Chamber of Commerce and the University of Virginia’s Miller Center.

    Nor has the need to increase federal spending on infrastructure come up in the numerous policy debates held by the Republican presidential candidates. Even President Obama seems to have lost his former fervor for this issue. In his last State-of-the-Union message he made only a perfunctory reference to "rebuilding roads and bridges." High-speed rail and an infrastructure bank, two of the President’s past favorites, were not even mentioned.

    Why pleas to increase infrastructure funding fall on deaf ears

    There are various theories why appeals to increase infrastructure spending do not resonate with the public. One widely held view is that people simply do not trust the federal government to spend their tax dollars wisely. As proof, evidence is cited that a great majority of state and local transportation ballot measures do get passed, because voters know precisely where their tax money is going. No doubt there is much truth to that. Indeed, thanks to local funding initiatives and the use of tolling, state transportation agencies are becoming increasingly more self-reliant and less dependent on federal funding

    Another explanation, and one that I find highly plausible, has been offered by Charles Lane, editorial writer for the Washington Post. Wrote Lane in an October 31, 2011 Washington Post column, "How come my family and I traveled thousands of miles on both the east and west coast last summer without actually seeing any crumbling roads or airports? On the whole, the highways and byways were clean, safe and did not remind me of the Third World countries. … Should I believe the pundits or my own eyes?" asked Lane ("The U.S. infrastructure argument that crumbles upon examination").

    Along with Lane, I think the American public is skeptical about alarmist claims of "crumbling infrastructure" because they see no evidence of it around them. State DOTs and transit authorities take great pride in maintaining their systems in good condition and, by and large, they succeed in doing a good job of it. Potholes are rare, transit buses and trains seldom break down, and collapsing bridges, happily, are few and far between.

    The oft-cited "D" that the American Society of Civil Engineers has given America’s infrastructure (along with an estimate of $2.2 trillion needed to fix it) is taken with a grain of salt, says Lane, since the engineers’ lobby has a vested interest in increasing infrastructure spending, which means more work for engineers.  Suffering from the same credibility problem are the legions of road and transit builders, rail and road equipment manufacturers, construction firms, planners and consultants that try to make a case for more money.

    This does not mean that the country does not need to invest more resources in preserving and expanding its highways and transit systems. The "infrastructure deficit" is real. It’s just that in making a case for higher spending, the transportation community must do a much better job of explaining why, how and where they propose to spend those funds. Usupported claims that the nation’s infrastructure is "falling apart" will not be taken seriously.

    People want to know where their tax dollars are going and what exactly they’re getting for their money. Infrastructure advocates must learn from state and local ballot measures to justify and document the needs for federal dollars with more precision so that the public regains confidence that their money will be spent wisely and well.

  • Indianapolis: From Naptown to Super City

    I have long touted the sports strategy that Indianapolis used to revitalize its downtown as a model for cities to follow in terms of strategy led economic and community development. I really think it sets the benchmark in terms of how to do it, and it has been very successful.

    Indy is hosting the Super Bowl on Sunday, something that is locally seen as a sort of crowning achievement of the 40 year sports journey. As part of that, the Indianapolis Star and public TV station WFYI produced an hour long documentary on the journey called “Naptown to Super City.” I think it’s a must watch for anyone who is trying to figure out to revitalize their own downtown. An hour isn’t short, but given the billions of dollars cities pour into this, I think it’s worth doing some homework. It tells the story of how Indy went from a deserted downtown where local Jaycees were licensed to take their shotguns and kill pigeons to one where the Super Bowl is being hosted today.

    I’ll talk more about the Indy strategy in a bit, but first the show. If you are in Google Reader this won’t display for you, so click here to watch.


    One thing this brought home for me is the true magnitude of the change. Perhaps I’m being a bit uncharitable, but Indianapolis almost literally started with nothing. It was never a major, important American city. It had no brand in the market. And it had a downtown that was all but dead. Everything they have today was built almost from scratch.

    Why do I think the Indy sports strategy was such a good one? Two reason: it was a good strategic area to go after, and it was backed up with very intelligent execution.

    First, five reasons this was a good strategic goal to pursue:

    1. It just fits the character of the city. Hoosiers love sports. The Indianapolis 500 and high school basketball were long established. It’s something they could behind in a way that they would never have gotten behind being the “vegetarian capital of the world” or something like there. It was authentic to the city. If you watch the video, you’ll note how locals embraced the events that were held that. That goes a long way towards explaining the success of the strategy. You have to be authentic to a place in your development efforts.
    2. It was a whitespace opportunity where Indy could get first mover advantage. Today every city thinks they can make money off sports, but Indy really pioneered the notion that you could use sports as an economic development tool. There were a lot of firsts along the path, and that’s one reason Indy was able to take out a leadership position. Just as one example, Indy was first to do the “build it and they will come” model of building a stadium before having a team. As a result, they were able to grab the Colts, and do it in an era when you didn’t have to mortgage your whole city to make a team relocation happen.
    3. Being America’s top city for sports events was a realistically achievable goal. I know this because the city achieved it. This is in great contrast to the umpteen cities who all claim they’ll be the “best cycling city in America” or some such.
    4. There were huge collateral benefits to sports beyond the direct economic impact of the events and the jobs they support. They bring people to the city to show it off to people who might not otherwise come. They enliven downtown and create events that locals might actually want to attend. They also have been an amazing brand opportunity. Just think of the Colts. How many times a week during football season does the word “Indianapolis” get said on TV? Probably hundreds if not thousands. Imagine if the city had to pay advertising dollars for that exposure? Yes, sports is expensive, but I think it could be justified just as cost-efficient marketing alone. Think about how much companies pay just to put their name on the stadium. How much more is it worth to put your city’s name on the team or the event? Think about how much advertisers will be paying for a 30 second commercial in the Super Bowl? What’s it worth for all those mentions of your city during the Super Bowl again?
    5. It was an initiative that had the possibility of being truly transformative for the city. Again, I know this is true because it was.

    I’m not going to claim these were actually the thoughts going through people’s minds as the sports strategy developed or that it was this calculated. But all of these things were implicitly true all along, and I think clearly the people pushing sports must have gotten it on that at some level. So sports meets the first test of a great strategy in that it set out after a good strategic goal.

    It was also something where there was a level of execution detail that far exceeded what most cities do. In business, it’s one thing to have an idea. It’s another thing to execute on it and achieve market leadership. It’s still another to generate sustainable competitive advantage that keeps you there over the long haul. Indianapolis has managed to do all of these with sports. I’ll highlight eight examples of how it did this:

    1. It invested in world class facilities. A lot of these have remained top rated even long after they opened, like Conseco Fieldhouse, which is still ranked every year as the best arena in the United States.
    2. Two, it laid out an entire district downtown around events hosting, with everything you need in close proximity – venues, the convention center, hotels, shopping, and entertainment. This is something that’s already been widely commented on by Super Bowl visitors who are amazed you don’t have to get shuttled around all over the place and that you can actually walk directly from the media hotel to the hotels where the teams are staying.
    3. Three, because of this Indy is able to effectively “saturation rebrand” downtown for an event and otherwise cater to events in a way that few other cities can or will. In effect, the city has converted its downtown into a giant sound stage. Take a look at the pictures of the city. The whole downtown as been rebranded after the Super Bowl, including, for example, plastering a huge Lombardi Trophy images on the side of the city’s premier hotel. You can debate the value of this to the city, but there’s no denying its value to the NFL. How many cities are willing to do this to the extent Indianapolis is?
    4. Indy created the Indiana Sports Corp. as the first ever non-profit management company for events. Today, everybody has adopted that model.
    5. The city cultivated a large, experienced volunteer base for putting on events that is much more powerful than what others cities have.
    6. Indy has been willing to take calculated risks in support of the strategy. Building the Hoosier Dome with no team to play in it – big risk.
    7. It not only went after the events, it went after the sanctioning bodies that determined where the events would be held. The most important is of course the NCAA, but there are others too. This has resulted in Indy having a “cluster” of these organizations and direct access to the people making decisions that pays incalculable dividends. This is one area where the “face to face” discussions that occur in Indy gives the city a big leg up. It’s not just better for selling, it gives Indy critical advanced intelligence about how these organizations are conceiving of their future events needs.
    8. Last but certainly not least, this has been a sustained, 35 year commitment. It wasn’t a party politics thing. It was a single project thing. It wasn’t a flash in the pan idea. It was something that has been relentlessly pursued over the long haul.

    Add all this up and it is easy to see why still today, three or four decades after it first started and after pretty much every city decided to go after these types of events, Indianapolis is still the best place in America to host a sports event.

    I hope this gives you a flavor why the Indy sports strategy was so good and so successful. It’s certainly something that’s not without its failures and downsides. The fact that sports has consumed disproportionate civic resources is one of them, and one highlighted by the documentary. But on the whole, most people seem very happy with the results.

    Something the video highlights at the end is one essential attribute for success that you can’t plan for or make happen – luck. They ask questions like, what if the “Save the Pacers” telethon had failed back in the 70’s? What if the seats in the Hoosier Dome had been the originally planned variegated colors instead of the Colts blue and white colors when Bob Irsay walked in to check it out? There were many critical turning points where without a lucky break, who knows if the future of downtown Indy might have been radically different in some way. It should give us some humility about the limits of our ability to simply will things into being. On the other hand, it reminds us that if you aren’t in the game, if you aren’t swinging the bat, you don’t have any chance at all of hitting that home run. You have to play if you want to win.

    This piece originally appeared at The Urbanophile.

    Aaron M. Renn is an independent writer on urban affairs based in the Midwest. His writings appear at The Urbanophile, and operates Telestrian, an online tool for economic and demographic data.

    Photo of Lucas Oil Stadium courtesy of BigStockPhoto.com.

  • The Moonbeam Express

    Seldom has public opinion and expert judgment been more unified than in its opposition to  the California high-speed rail project.    The project has been criticized by its own Peer Review Group, the Legislative Analyst’s Office (LAO), the California State Auditor,  the State Treasurer and a group of independent  experts  (Enthoven, Grindley, Warren et al.).  In addition, the bullet train has come under severe criticism by influential state legislators and  by members of the state’s congressional delegation. Equally damaging to the project’s future prospects have been two public opinion surveys showing  that California voters have turned solidly against the project, and the opposition of  virtually all of California’s newspapers, including The Orange County Register, whose latest editorial we reprint below.  

    Editorial: Bullet train becoming "Moonbeam Express" (OC Register, Feb 1, 2012)
    Gov. Jerry Brown wants to use anti-global-warming carbon taxes to fund California’s much-maligned high-speed rail project. 

    In a brazen denial of the obvious, Gov. Jerry Brown now insists the proposed California high-speed rail can be built for much less than its own business plan stipulates, and wants to use anti-global-warming carbon taxes to underwrite the proposal, whose price tag has nearly tripled in the three years since voters approved it.

    The governor seems intent on demonstrating how California’s state government has burdened taxpayers with mounting debt, while overspending to create consecutive years of budget deficits. The rail project has been dubbed "the train to nowhere" because the only portion close to being built would link relatively sparsely populated Central Valley towns and no metropolitan areas. Perhaps with Mr. Brown’s new foolish insistence, it should be christened the Moonbeam Express. 

    Since the rail proposal appeared on the 2008 ballot, it has been widely and legitimately criticized in detailed analyses by the rail project’s own Peer Review Group, the state auditor, treasurer, Legislative Analyst’s Office, local governments including Tulare, Madera and Kings counties and the city of Palo Alto, numerous state and federal lawmakers from both parties and studies by UC Berkeley Institute of Transportation and the Reason Foundation. These highly unfavorable critiques reflect many of the criticisms the Register Editorial Board has raised since the project was proposed.

    In only three years, the train’s estimated cost has increased from $33 billion to $98.5 billion in the latest version of its own ever-changing business plan.

    Voters approved only $9.9 billion in bonds based on the rest coming from Washington and local governments along the route, and private investors. Washington has provided about $3 billion and not another dime has materialized or been pledged. Meanwhile, the estimated completion of the original phase of the project, from San Francisco to Anaheim, has been extended 14 years beyond the original estimate of 2020.

    Ridership estimates are unrealistic, meaning trains can’t operate solely on ticket revenue as required by the initiative. Costs, even at their current highest level, are certain to increase, and the needed additional funding sources are not forthcoming. Given hostility in Congress to the project, more money from Washington, which is grappling with its own massive deficits and debts, won’t be seen in the foreseeable future.

    State Sen. Doug LaMalfa, R-Richvale, introduced a bill Monday to put the high-speed rail proposal back on the November ballot so voters can de-authorize selling the $9.9 billion in bonds.

    The Register has urged this ill-conceived and increasingly untenable project be resubmitted to voters. Thankfully, for the most part, bonds remain unsold. There is no reason taxpayers should assume billions more debt — with annual interest payments of up to $1 billion — when the likelihood is remote the train ever will be built, despite the governor’s strained assurance.

    Moreover, state Sen. Diane Harkey, R-Dana Point, notes that the governor’s proposed new revenue stream — carbon taxes created by the 2006 Global Warming Solutions Act— is another hoped-for, rather than assured, solution. "The state’s cap-and-trade program is not yet in operation, and revenue estimates of $1 billion per year are unreliable and unsubstantiated," Ms. Harkey said. "Relying on projected revenues that fall short is the key reason why our state deficit continues to explode year after year. To rush this project forward, just using up the $3.5 billion of federal funds, with the hope of an additional funding mechanism based on guesswork, is irresponsible."

  • Who Stands The Most To Win – And Lose – From A Second Obama Term

    As the probability of President Barack Obama’s reelection grows, state and local officials across the country are tallying up the potential ramifications of a second term. For the most part, the biggest concerns lie with energy-producing states, which fear stricter environmental regulations, and those places most dependent on military or space spending, which are both likely to decrease under a second Obama administration.

    On the other hand, several states, and particularly the District of Columbia, have reasons to look forward to another four years. Under Obama the federal workforce has expanded — even as state and localities have cut their government jobs. The growing concentration of power has also swelled the ranks of Washington‘s parasitical enablers, from high-end lobbyists to expense-account restaurants. While much of urban America is struggling, currently Washington is experiencing something of a golden age.

    So what states have the most to lose from a second Obama term? The most obvious is Texas, the fastest-growing of the nation’s big states. Used to owning the inside track in Washington during the long years of Bush family rule, the Lone Star state now has less clout in Congress and the White House than in recent memory. Texans are particularly worried about restrictions on fossil fuel energy development, which is largely responsible for robust growth throughout the state.

    “Obama now wants to take credit for the increased production that has happened, but [increased production] has been opposed in every corner by the administration,” says John Hofmeister, founder of the Houston-based Citizens for Affordable Energy and former CEO of Shell USA. Hofmeister fears that in a second term, with no concern for reelection, Obama could exert even greater controls on fossil fuel development. This would have dramatic, negative implications not only for Texas but for the entire national energy grid, which includes North Dakota, Wyoming, Montana, West Virginia, Oklahoma, Alaska and Louisiana. These states fear that the nation’s recent energy boom, which has generated some of the nation’s strongest job and income growth, could implode in Obama’s second term.

    Take Louisiana, which is still recovering from Hurricane Katrina in 2005 and the BP oil spill in 2010. The administration’s moratorium on offshore drilling, sparked by the spill, has had a deleterious effect on the state’s energy economy, according to a recent study, with half offshore oil and service companies  shifting their operations to other regions and laying off employees.

    Once the moratorium was lifted in 2010, companies have faced long delays for new wells, growing from 60-day delays in 2008 to more than 109 last year  .  “The energy states feel they are being persecuted for their good deeds,” says Eric Smith, director of the Tulane Energy Institute in New Orleans. “There is a sense there are people in the administration who would like this whole industry to go away.”

    Many of these same states also worry about the administration’s proposed downsizing of the military. Obama’s move to cut roughly towards $500 billion in defense spending may make sense, but it  threatens places with large military presences such as Texas, Florida, Oklahoma, Virginia, Georgia, South Carolina and New Mexico.

    The D.C. metro area might also be hit by defense cuts, but overall the it has many reasons to genuflect toward the Obama Administration. Federal wages, salaries and procurement account for 40% of the district’s economic activity, roughly four times the percentage of any state. Expanding regulation on energy, health care and financial services has sparked a steady job boom in lobbying, think tanks and other facets of the persuasion industry — including among Republicans –at a time when employment growth has been sluggish elsewhere.

    D.C. partisans hail their city as the leader of a national urban boom. The district clearly benefits from diminished job opportunities in more market-based economies, particularly for educated 20-somethings.

    No place has flourished as much as the capital, but a second term would be favorable to states such as Maryland, which depend heavily on research spending directed from Washington and where federal spending accounts for fifteen percent of the local economy, over seven times the national average. Maryland agencies such as the National Institutes for Health will likely expand under an increasingly federalized health care system — particularly if Democrats gain more seats in Congress with an Obama win.

    Other big states that may benefit from a second term include New York, California and Illinois. New York benefits largely from the administration’s Wall Street leanings, despite the president’s recent attacks on financial elite. Even for the non-conspiracy theorists, the administration’s ties to Goldman Sachs appear unusually intimate. Powerful allies like Democratic Sen. Charles Schumer, D.C.’s greatest Wall Street booster, suggest big money has little to fear from a second term.

    Overall the administration’s basic policy approach has favored the financial giants. Support for bailouts, seemingly permanent low interest rates, few prosecutions for miscreant investment bankers, the institutionalization of “too big to fail” and easy loans for renewable fuel firms all have benefited the big Wall Street players.

    Of course, a Republican victory would not be a disaster for these worthies. Companies like Goldman Sachs are hedging their bets by sending loads of cash to the likely Republican choice, former Massachusetts Gov. Mitt Romney.

    But other New York interests, such as mass transit funding, would benefit from the current administration’s  generally pro-urban, green sensibilities. Tight regulations on carbon emissions — increasing the price of fossil fuels — may help the competitive position of New York City, which has little industry left and relatively low carbon emissions per capita, in part due to a greater reliance on hydroelectric and nuclear power.

    California also has reasons to root for an Obama victory. Although among the richest states in fossil fuels, particularly oil, the Golden State has become a bastion of both climate change alarmism and renewable energy subsidization. It adamantly won’t develop traditional its energy resources — which would help boost the state’s still weak economy — and Silicon Valley venture firms have eagerly grabbed subsidies and loans for start-ups from Energy Secretary Steven Chu’s seemingly bottomless cornucopia.

    Furthermore,  more powerful EPA would make California’s current “go it alone” energy and environmental problems less disadvantageous compared to more fossil-fuel-friendly states, leveling what is now a tortuous economic playing field.

    Similarly, attempts to push the state’s troubled high-speed rail line — recently described in Mother Jones as “jaw-droppingly shameless” –  will succeed only with strong backing by the federal government. Under a Republican administration and Congress, Brown’s beloved high-speed line would depend entirely on state and private funding, likely terminating the project.

    But no state needs an Obama victory more than his adopted home state of Illinois. To be sure, having a native son in the White House has not prevented the Land of Lincoln from suffering one of the weakest economies in the nation. The state has one of the highest rates of out-migration in the country, according to recent United Van Lines data and Census results.

    Even worse, the Land of Lincoln faces a fiscal crisis so great that it makes California look well-managed.  Without a good friend in the White House, and allies in Congress, Illinois could end up replacing long-struggling, now-improving Michigan as the Great Lakes’ new leading basket case. Count Illinois 20 electoral votes in the Obama column.

    This piece originally appeared in Forbes.com.

    Joel Kotkin is executive editor of NewGeography.com and is a distinguished presidential fellow in urban futures at Chapman University, and contributing editor to the City Journal in New York. He is author of The City: A Global History. His newest book is The Next Hundred Million: America in 2050, released in February, 2010.

    Photo from BigStockPhoto.com.