Blog

  • Is Suburbia Doomed? Not So Fast.

    This past weekend the New York Times devoted two big op-eds to the decline of the suburb. In one, new urban theorist Chris Leinberger said that Americans were increasingly abandoning “fringe suburbs” for dense, transit-oriented urban areas. In the other, UC Berkeley professor Louise Mozingo called for the demise of the “suburban office building” and the adoption of policies that will drive jobs away from the fringe and back to the urban core.

    Perhaps no theology more grips the nation’s mainstream media — and the planning community — more than the notion of inevitable suburban decline. The Obama administration’s housing secretary, Shaun Donavan, recently claimed, “We’ve reached the limits of suburban development: People are beginning to vote with their feet and come back to the central cities.”

    Yet repeating a mantra incessantly does not make it true. Indeed, any analysis of the 2010 U.S. Census would make perfectly clear that rather than heading for density, Americans are voting with their feet in the opposite direction: toward the outer sections of the metropolis and to smaller, less dense cities. During the 2000s, the Census shows, just 8.6% of the population growth in metropolitan areas with more than 1 million people took place in the core cities; the rest took place in the suburbs. That 8.6% represents a decline from the 1990s, when the figure was 15.4%.

    Nor are Americans abandoning their basic attraction for single-family dwellings or automobile commuting. Over the past decade, single-family houses grew far more than either multifamily or attached homes, accounting for nearly 80% of all the new households in the 51 largest cities. And — contrary to the image of suburban desolation — detached housing retains a significantly lower vacancy rate than the multi-unit sector, which has also suffered a higher growth in vacancies even the crash.

    Similarly, notes demographer Wendell Cox, despite a 45% boost in gas prices, the country gained almost 8 million lone auto commuters in the past 10 years. Transit ridership, while up slightly, is still stuck at the 1990 figure of 5%, while the number of home commuters grew roughly six times as quickly.

    In the past decade, suburbia extended its reach, even around the greatest, densest and most celebrated cities. New York grew faster than most older cities, with 29% of its growth taking place in five boroughs, but that’s still a lot lower than the 46% of growth they accounted for in the 1990s. In Chicago, the suburban trend was even greater. The outer suburbs and exurbs gained over a half million people while the inner suburbs stagnated and the urban core, the Windy City, lost some 200, 000 people.

    Rather than flee to density, the Census showed a population shift from more dense to less dense places. The top ten population gainers among metropolitan areas — growing by 20%, twice the national average, or more — are the low-density Las Vegas, Raleigh, Austin, Charlotte, Riverside–San Bernardino, Orlando, Phoenix, Houston, San Antonio and Atlanta. By contrast, many of the densest metropolitan areas — including San Francisco, Los Angeles, Philadelphia, Boston and New York — grew at rates half the national average or less.

    It turns out that while urban land owners, planners and pundits love density, people for the most part continue to prefer space, if they can afford it. No amount of spinmeistering can change that basic fact, at least according to trends of past decade.

    But what about the future? Some more reasoned new urbanists, like Leinberger, hope that the market will change the dynamic and spur the long-awaited shift into dense, more urban cores.

    Density fans point to the very real high foreclosure rates in some peripheral communities such as those that surround Los Angeles or Las Vegas. Yet these areas also have been hard-hit by recession — in large part they consist of aspiring, working class people who bought late in the cycle. Yet, after every recession in the past, often after being written off for dead, areas like Riverside-San Bernardino, Calif., have tended to recover with the economy.

    Less friendly to the meme of density’s manifest destiny has been a simultaneous meltdown in the urban condo market. Massive reductions in condo prices of as much as 50% or more have particularly hurt the areas around Miami, Portland, Chicago and Atlanta. There are open holes, empty storefronts, and abandoned projects in downtowns across the country that, if laid flat, would appear as desperate as the foreclosure ravaged fringe areas.

    In many other cases, the prices never dropped because the owners gave up selling condos and started renting them, often to a far lower demographic (such as students) than the much anticipated “down-shifting” boomers. Contrary to one of the most oft-cited urban legends by Leinberger and his cohorts, demographics do not necessarily favor density. Most empty-nesters and retirees, notes former Del Webb Vice President of Development Peter Verdoon, prefer not just outer suburbs but increasingly “small towns and rural areas” Dense cities, he notes, are a relatively rare choice for those seeking a new locale for their golden years.

    Verdoon’s assertion is borne out by our own analysis of the 2010 Census. Generally speaking, aging boomers tended to move out of dense urban cores, and to a lesser extent, even the suburbs. If they moved anywhere, they were headed further out in metropolis towards the more rural area. Among cities the biggest beneficiaries have been low-density cities in the Southwest and southern locales such as Charlotte, Raleigh and Austin.

    What about the other big demographic, the millennials? Like previous generations of urbanists, the current crop mistake a totally understandable interest in cities among post-adolescents. Yet when the research firm Frank Magid asked millennials what made up their “ideal” locale, a strong plurality opted for suburbs — far more than was the case in earlier generations.

    Generational analysts Morley Winograd and Mike Hais note that older millennials — those now entering their 30s — are as interested in homeownership as previous generations. This works strongly in favor of suburbs since they tend to be more affordable and, for the most part, offer safer streets, better parks and schools.

    In the short run, suburbia’s future, like that of much of real estate market, depends on the economy. But even here trends may be different than the density lobby suggests. As housing prices fall, the much ballyhooed trend toward a “rentership” society may weaken. Already in many markets such as Atlanta, Las Vegas and Minneapolis and Phoenix it is cheaper to own than rent, something that favors lower-density suburban neighborhoods.

    Longer term, of course, suburbs, even on the fringe, will change as growth restarts. Cities here and around the world tend to expand outward, and over time the definition of the fringe changes. To be sure, some fringe communities, particularly in highly regulated and economically regressive areas, could indeed disappear; but many others, particularly in the faster growing parts of the country, will reboot themselves.

    They will become, as the inner suburbs already have, more diverse with many working at home or taking shorter trips to their place of work They will become less bedrooms of the core city but more self-contained and “village like,” with shopping streets and cultural amenities near what will still be a landscape dominated primarily by single-family houses.

    In fact the media reports about the “death” of fringe suburbs seem to be more a matter of wishful thinking than fact. If the new urbanists want to do something useful, they might apply themselves by helping these peripheral places of aspiration evolve successfully. That’s far more constructive than endlessly insisting on — or trying to legislate — their inevitable demise.

    This piece first appeared at Forbes.com.

    Joel Kotkin is executive editor of NewGeography.com and is a distinguished presidential fellow in urban futures at Chapman University, and an adjunct fellow of the Legatum Institute in London. He is author of The City: A Global History. His newest book is The Next Hundred Million: America in 2050, released in February, 2010.

    Photo courtesy of BigStockPhoto.com.

  • Will You Still House Me When I’m 64?

    In the song by the Beatles, the worry was about being fed and needed at 64. Things have changed. If the Beatles wrote those lyrics today, the worry instead might be about housing.

    Australia’s aging population is an inevitability. As our replacement rate falls (we’re having fewer children per family) and life expectancy extends, the proportion of over 65s will double in 40 years. In raw numbers, there were 2.5 million over 65s in 2002, and this will rise by 6.2 million in 2042. That’s an extra 4 million in this demographic. Have we given enough thought to where they’re going to live, and what styles of housing they might prefer?

    There have been a number of developers who have understood the looming significance of Australia’s aging population, and who have sought to supply the ‘retirement living’ market with product that suits. At one end have been the glitzy apartment style residences in inner city locations, while at the other have been the aged care ‘homes’ provided for those in need of access to nursing care or medical assistance, or at least the reassurance of it being present.

    Running parallel with the provision of retirement living or seniors living projects has been an assumption that, once ready to abandon the family home of many years, seniors will be happy to move across town and relocate to the facilities that are available. Perhaps this is hangover from the days when retirement or aged care living was provided on Stalinist lines: our oldies were forcibly shuffled off to some retirement centre well away from the rest of the community they grew up in. A sort of gulag for grumpies?

    But what if seniors simply want a change of housing style within their community? What if they don’t want to move across town to the only available accommodation because they would prefer to continue to live in the neighbourhood and community they have spent a large part of their lives living in? They may want to continue to shop with ‘their’ local butcher, visit their local supermarket, newsagent, bank branch (if it still exists) and generally remain connected to the people and places that they’re familiar with – including (quite possibly) members of their family, children and grandchildren.

    Meeting that need in the future is going to be close to impossible unless planning schemes (old fashioned zoning laws) adopt a more flexible approach. Flexibility will be needed because most of the existing suburbs of our major population centres are largely built out and will require retrofits and redevelopment of existing stock to accommodate senior’s housing preferences. Generally, the only tracts of undeveloped land capable of meeting seniors housing needs tend to be on the outskirts and while there’s nothing wrong with fringe development, it seems unfair to expect seniors to relocate across town to regions they’re unfamiliar with and to alienate themselves from their community simply because supply side mechanisms (controlled by planning schemes) don’t permit choice.

    Further, the built out status of our ‘established’ suburbs – as they now stand – is something that much planning law seems to want to preserve for time immemorial. It’s a little bit like imagining that someone has declared the existing housing mix and styles a fixture of permanency: let’s put a giant glass dome over it all and call the city a museum – because we don’t (it seems) want anything to change.

    But if we are to allow Australia’s seniors to ‘age in place’ and to ensure our markets provide choice, it’s going to mean some things will need to change, given the likely levels of future demand. The fastest growth of aging populations will be around our ‘middle ring’ suburbs and given the overwhelming preference to ‘age in place’, it is these suburbs that are going to have to change if those needs are to be met.

    What will that change look like? The psychology of seniors in years to come – even today – is going to be different to those of previous generations. They’ll likely be more active rather than sedentary. The family home that’s served them to this point may now be simply too big for their needs, or contain too many stairs (the artificial hip or knee doesn’t like too many stairs). Their future housing needs will vary widely – some will be happy with apartments in high to medium density developments (elevators to their level of living means no stairs) while others (generally the majority) will prefer smaller, detached or semi-detached, single level dwellings. Many may want a small yard or garden (or at least a large balcony or terrace if in a unit), and perhaps want to keep a small pet dog or cat. They may want a spare bedroom for visitors or for babysitting grandchildren. They will probably prefer to be close to shops and near to public transport. And the majority will want to find something of that nature generally within the same community they’ve been living in. It is unlikely they’ll be searching for the ‘retirement home’ style of assisted care living until they’re well into their later years when their choices will be more limited.

    Their problem will be that developers will struggle under current planning schemes to get approval for semi-detached housing designed with seniors in mind, if it means amalgamating some detached residential dwellings near local shops, because that land use is highly protected. They will struggle to gain approval to convert a large single site into medium or high rise in areas near local shops or transport, because the community will likely object – particularly if it’s in a neighbourhood where low density prevails (typical of most of suburban Brisbane). Advocates of Transit Oriented Development (TOD) style development might now be shouting at this article that ‘TODs are the answer.’ That might be so, if only one single TOD had been delivered during the past 15 years we’ve been talking about them.

    Plus, the majority of proposed ‘TOD’ style development areas largely surround inner city transport nodes. Not much use if you’re in Aspley and want to stay there. And of course there’s the reality that multi level apartments are much more costly to develop and construct than the cottage building industry’s approach to single level, small detached housing.

    The changes needed need not be dramatic, and subtle changes to land use surrounding existing retail or service centres in middle ring suburbs ought to be able to be achieved with minimal planning fuss. It is still possible to imagine something being done with minimal planning fuss, but very difficult to point to any actual examples. Still, hope springs eternal.

    The changes could allow (for example) for some amalgamations of larger lot, detached post war homes into higher density cottage-style dwellings on a group title, still single level and with low construction costs. A 2000 square metre amalgamation could in theory provide 10 such cottages, with private garden space and minimal likelihood of community objection. The key would be to keep regulatory costs down, so punitive development levies would be out of order. After all, the infrastructure already exists and seniors tend to be much less demanding on utilities or services than young households. (Have a think about how little garbage they generate, or how little water they use as an illustration. It would surely be unfair to tax seniors in this type of housing for infrastructure upgrades under the circumstances?).

    The traditional ‘retirement home’ or ‘aged care’ model of seniors housing is still going to be needed, especially as people require more frequent or acute care in their later years, and become less and less independent. But there will be a good 10 to 15 year period for people for whom the family home no longer suits, and who aren’t yet ready for ‘God’s waiting room.’ How we accommodate this coming bubble of seniors who want to age in place and continue to live independently, and how planning schemes will allow markets to provide choice and diversity, is something that perhaps should be a policy focus now.

    Ross Elliott has more than 20 years experience in property and public policy. His past roles have included stints in urban economics, national and state roles with the Property Council, and in destination marketing. He has written extensively on a range of public policy issues centering around urban issues, and continues to maintain his recreational interest in public policy through ongoing contributions such as this or via his monthly blog The Pulse.

    Photo by BigStockPhoto.com

  • The Evolving Urban Form: Delhi

    It has been a time of ups and downs for Delhi, which has emerged as the largest urban area (area of continuous urban development) in India. By a quirk in the Census of India definitions, an urban area (urban agglomeration) may not cross a state or territorial boundary. As a result, Delhi continues to be the second largest urban area in India according to the Census of India.

    However, as a Population Reference Bureau reported, the population of the urban expanse of Delhi had exceeded that of Mumbai by 2007 to become the largest urban area. In 2007, the Population Reference Bureau noted that the continuous urbanization of Delhi extended into the adjacent states of Haryana and Uttar Pradesh (which has largest population of any sub-national jurisdiction in the world).

    In 2010, the United Nations placed the Delhi urban area population above that of all other urban areas in the world with the exception of Tokyo. This second ranking position was only temporary, since new census data showed stronger growth in Jakarta (Jabotabek) and Seoul. These developments, along with a smaller than anticipated population in the interstate Delhi urban area dropped Delhi to fourth position after the 2011 census. Even so, with its stronger growth, and given the plummeting birth rates in Korea, it can be expected that Delhi will exceed the population of Seoul within one or two years.

    Delhi has experienced some of the quickest and most substantial urban growth in the history of the world. Since the 1951 census, Delhi has grown from under 1.5 million people to a population of 22.6 million in 2011 (Figure 1). Delhi has been one of the fastest growing urban areas in history and (along with Jakarta, Seoul and Manila) has added approximately 20 million people over the past 60 years. Only Tokyo has added more new residents than these four urban areas, (25 million population).

    The national capital of India is the city of New Delhi (Note 1), which is a district of the National Capital Territory of Delhi. New Delhi is a fully planned national capital that is among the most impressive in the world, with broad expanses of green space not unlike that of Washington, DC. New Delhi became the capital in 1911, replacing Kolkata and much of the planned capital area was completed by the 1930s.

    An Interstate Urban Area

    This interstate urban area includes all of the urbanization of the National Capital Territory, which includes the urban core, as well as the adjacent Gahziabad and the Noida urban areas in the state of Uttar Pradesh and the Faridibad and Gurgaon urban areas in the state of Haryana.

    Between 2001 and 2011 (Figure 2):

    • The population of the inner area, which includes New Delhi and the Central, North, Northeast and East districts of the National Capital Territory grew 15 percent. This area accounted for 10 percent of the urban area growth.  Consistent with the experience of other inner areas (such as Mumbai, Shanghai, Chicago and Kolkata), inner core of this area (New Delhi and the Central District) lost population between 2001 and 2001 (14 percent).
    • The balance of the urban area inside the National Capital Territory grew by 2.8 million people, an increase of 33%. This area captured 47% of the interstate urban area population growth.
    • The urban areas outside the National Capital Territory grew slightly less, at 2.7 million and accounted for 44% of the interstate urban area population growth. These outer areas grew by far the fastest, from 2.6 million to 5.3 million, an increase of .


    Map of Dehli districts courtesy of wikipedia user Deeptrivia

    Between 2000 and 2011, the strongest growth was in the urbanization in Uttar Pradesh and to the southwest in Haryana.

    Gurgaon (photograph below), in Haryana, abuts Indira Gandhi International Airport on the south side, has emerged as an important corporate and information technology center. Gurgaon grew from 250,000 people in 2001 to 900,000 in 2011.

    Ghaziabad (photograph below), in Uttar Pradesh, is located adjacent to Delhi’s Northeast district and is the largest of the urban expanses beyond the National Capital Territory, having grown from approximately 975,000 people 2001 to more than 2,350,000 people in 2011.

    Noida (photograph below), in Uttar Pradesh, is another business center, is a special econonomic zone and includes a software technology park). Noida is located in Delhi and grew from approximately 300,000 in 2001 to nearly 650,000 in 2011.

    Faridabad (photograph below), in Haryana, is located directly to the south of the National Capital Territory and had the slowest percentage growth among the urban expanses beyond the National Capital Territory, growing from 1,050,000 people in 2001 two 1,400,000 people in 2011.

    The preponderance of growth in the suburban areas mirrors the trend in the previous census. Between 1991 and 200l, 26% of the growth was in the inner area and 74% of the growth in the outer areas of the National Capital Territory.

    Common Threads

    Even with its somewhat less than expected growth over the past decade, the Delhi continues to be among the fastest growing metropolitan regions in the world. Including adjacent rural areas, the Delhi metropolitan region (Note 2) added approximately 6.0 million people between 2001 and 2010 (growing from 20.4 million to 26.4 million). This compares to the 10 year gain of 7.4 million in Jakarta, 6.6 million in Manila and Shanghai and 6.1 million in Beijing.

    The Delhi urban area illustrates the same pervasive urban growth trend evident around the world. As urban areas become larger, they tend to grow most rapidly on their periphery as opposed in the core. As a result, contrary to popular misconception, they are overall becoming become less dense. In Delhi, as well as in all of the other urban areas or metropolitan regions examined in the Evolving Urban Form series, growth is concentrated in the suburbs and further out on the periphery.

    —-

    Note 1: The city of New Delhi is officially the capital of India. It is, however, only a small part of the National Capital Territory of Delhi. The city of New Delhi had a population of 134,000 in 2011, down one-quarter from 169,000 in 2001. While the term "New Delhi" has often been used to denote the urban agglomeration, both the government of India and the United Nations refer to the urban agglomeration as Delhi.

    Note 2: This metropolitan region definition includes the National Capital Territory and the Ghaziabad and Gatam Buddha Nagar (Noida) districts of Uttar Pradesh and the Gurgaon and Faridabad districts of Haryana (districts are analagous to counties in the United States).

    Top Photograph: India Gate in New Delhi. All photos by author

    Wendell Cox is a Visiting Professor, Conservatoire National des Arts et Metiers, Paris and the author of “War on the Dream: How Anti-Sprawl Policy Threatens the Quality of Life

  • Good Morning, Vietnam

    While many experts are pronouncing the demise of the American era and the rise of China, other East Asian nations complicate the picture. As America continues to participate and extend its influence in the dynamic Asian market, there may be no more suitable ally than its old antagonist, Vietnam.

    In some senses, Vietnam has emerged as the un-China, a large, fast-growing country that provides an alternative for American companies seeking to tap the dynamism of East Asia but without enhancing the power of a potentially devastating global competitor. With 86 million people, Vietnam may not offer as large a market, but it has strong historical, cultural, and strategic reasons to lean towards America.

    Why an un-China?

    Vietnam has deep historical reasons for wanting to link closely with the United States and its other allies, such as Singapore, Thailand, South Korea, and Japan. Some of this has to do with the country’s unique history. While France, Japan, and the United States were at times deeply and bloodily entangled with the country, by far the biggest threat to Vietnam has always been its looming neighbor to the north.

    France, Japan, and the United States intervened in Vietnam for comparatively short periods of time. In contrast, China has had an unrelenting interest in Vietnam and its 2,140-mile coastline ever since its nearly thousand-year rule over the country from 111 BC to 938 AD. The two countries have been embroiled in numerous territorial disputes over the years, with the most recent one involving the South China Sea, which has important shipping routes and is believed to contain rich oil and gas deposits.

    Many Vietnamese see some of their former colonialist or “imperialist” powers as necessary allies in protecting themselves from escalating territorial threats from China. Opening Cam Ranh Bay naval base to foreign warships, notably to those from the United States, is an illustrative example of Vietnam’s defensive strategy during the unfolding geopolitical competition.

    Amid the maritime tension between China and Vietnam regarding the oil-rich Spratly and Paracel islands in the South China Sea, the United States in 2010 successfully negotiated with Vietnam to reopen Cam Ranh Bay to foreign warships besides Russia. The bay will take approximately three years to rebuild and the primary foreign visitor is expected to be the United States.  “The regular presence of U.S. warships at Cam Ranh Bay might make China think twice about using coercive military diplomacy against Vietnam,” noted Ian Storey, a fellow at the Institute of Southeast Asian Studies in Singapore.

    The rise of the diaspora

    Perhaps the greatest thing tying America to Vietnam is people. When the Communist government overran the former South Vietnam in 1975, several million Vietnamese fled the country. The Vietnamese eventually settled in 101 different countries and territories throughout the world, with the majority of them heading to the United States, France, Canada, and Australia. There are currently about 4 million Vietnamese living outside of Vietnam. Some settled in the former colonial ruler, France, and others in Australia, Canada, and Singapore. But the bulk—roughly 40 percent—moved to the United States, which is now by far the largest settlement of overseas Vietnamese. About 2 million Vietnamese are estimated to live in the United States (see map of “Overseas Vietnamese”).

    Overseas Vietnamese Population

    Hostile to the Communist regime, the overseas Vietnamese population turned away from their homeland , focusing instead on building new lives in their host countries. They flourished particularly in the United States, clustering in places such as Orange County and San Jose, California, as well as Houston and New Orleans. In 2009, they were enjoying levels of prosperity comparable to the national average, with a median family income of $59,129 and 64.6 percent owning homes. Vietnamese are also three times more likely to be in such fields as information technology, science, and engineering than other immigrants, and have one of the highest rates of naturalization—72.8 percent.

    Contact between this dynamic diaspora and the homeland was constrained by the two governments for decades. After the Vietnam War, the United States had placed a strict embargo against Vietnam and prohibited any political or economic relations between the two countries. The Vietnamese refugees who sought to reconnect with their relatives in Vietnam had to rely on neutral third-party countries to act as an intermediary in sending various goods and money back to needy family members.

    For their part, the Communist regime conducted stringent inspections of packages and letters sent to Vietnam. The Vietnamese government also imposed heavy taxation on financial remittances, which discouraged money transfers through official channels.

    Desperate to help close relatives left behind in their impoverished homeland, many Vietnamese Americans were forced to invent creative alternatives to formal remittances. According to Yen Do, the creator of Nguoi Viet, the most prominent Vietnamese newspaper in the United States, overseas Vietnamese would hide American dollars inside pill bottles sent through either French or Canadian shipping companies.

    With tens of millions of Vietnamese starving in Vietnam despite the clandestine remittances, the Vietnamese government eventually realized that they had to either change their economic strategy or suffer the debilitating consequences of a continually declining economy.

    Remittances have played a critical role in reviving the economy. Last year alone the diaspora sent an estimated $7.2 billion into the country, according to the World Bank. This comprised about 7 percent of Vietnam’s overall GDP in 2010. A 2010 study conducted by Wade Donald Pfau and Giang Thanh Long revealed that 57.7 percent of all international remittances being sent to Vietnam in 1997-1998 came from the United States.

    The growing symbiosis of Vietnam with its diaspora, particularly in the United States, will shape the rapid development of the country. Nowhere will this impact be felt more than in major cities such as Hanoi, Danang, and especially Ho Chi Minh City (the former Saigon). “We are seeing more of the expatriates here, and they are bringing management skill and capital through their family networks,” notes economist Le Dang. “They are a key part of the changes here.”

    The rise of a new dragon

    Aware of the enormous progress being made in China with its liberalization, in 1986 the Vietnamese government made the crucial decision to begin the Renovation Process—also known as Doi Moi—and reform the closed communist economy. It was the first official step that Vietnam had made towards opening its economic doors to the rest of the world.

    With the collapse of the Berlin Wall in 1989 and the subsequent fall of other communist powers in the world, the United States eventually responded to the improved political relations with Vietnam by lifting the 20-year-old embargo against its former foe in 1995. This put Vietnam on the fast track toward economic liberalization and ultimately helped it transition from a developing country to a middle-income country with a GDP per capita of more than $1,000. The International Monetary Fund estimated Vietnam’s GDP per capita as $1,155 for the 2010 fiscal year.

    Yet, in sharp contrast to China—where the largest sources of capital came from Chinese diaspora havens such Hong Kong, Taiwan, and Singapore—most of the money that revived the economy came from outside Southeast Asia. In particular, the biggest investor turned out to be the old arch-enemy, the United States, followed by another former “imperialist” power, Japan. China, now the world’s fourth-largest foreign investor, lagged behind much smaller regional economies, including South Korea, Thailand, and Malaysia, as well as the Netherlands (see map of “FDI by Registered Capital”).

    FDI in Vietnam by Country

    This is all the more remarkable given China’s huge expansion of investment with other developing countries. Over the past decade, China has expanded its capital flows both into other parts of Southeast Asia, including Laos and other Mekong Delta nations, as well as resource rich regions of the Middle East, Latin America, and Australia. Yet Vietnam, with its rich agriculture, fisheries, and developing energy industry, has stayed largely outside the emerging Sinosphere.

    Trade winds

    The tilt in investment is also borne out by trade patterns. Vietnam has seen, like most countries, a flood of Chinese goods, but it has also developed a strong appetite for exports from other countries, notably Japan, South Korea, and the United States (see map of “Exports to Vietnam”).

    Exports to Vietnam by Country

    But perhaps the best measure of Vietnam’s emergence as an un-China can be seen in its own burgeoning exports, which increased from about $5 billion to over $70 billion over the past three decades. The United States has emerged as by far Vietnam’s largest market, with more than $10 billion in annual trade. Japan ranked a strong second, with China lagging behind.

    This is all the more remarkable given that Vietnam possesses many things China needs and the two countries share both a border and obedience, at least nominally, to the same ideology. Vietnam seems to be making a choice to diversify itself away from China and avoid the semi-colonial status that many of China’s neighbors—notably Cambodia, Laos, and Myanmar—seem to have tacitly accepted (see map of “Vietnamese Exports”).

    Imports from Vietnam by Country

    This rising engagement with the global economy has brought great benefits. According to the CIA World Factbook, the country’s poverty rate has dropped from 75 percent in the 1980s to 10.6 percent in 2010. In terms of economic output, a brief on Vietnam by the World Bank reported that between 1995 and 2005 real GDP increased by 7.3 percent annually and per capita income by 6.2 percent annually.

    Why Vietnam matters to America

    Hanoi today—and even more so Ho Chi Minh City, the former Saigon—recalls China in the 1980s. But there are crucial differences. State-owned companies in Vietnam lack the depth and critical mass of their Chinese counterparts and are thus less likely to pose an immediate competitive threat to the United States and other foreign countries.

    Still, this is clearly a country on the way up. Many rural residents—still roughly 70 percent of the population—continue to pour into Hanoi and other cities, but without the same desperation that characterizes, for example, people moving from Bihar to New Delhi or Mumbai. There is nothing of the kind of criminal elements that fester in the favelas of Brazil or Mexico City’s colonias.

    More important still are the “animal spirits” of the place. Adam Smith—or Jane Jacobs for that matter—would enjoy the  very un-socialistic frenzy as motorcyclists barrel down the streets like possessed demons, with little regard to walking lanes or lights. Everyone not on the government payroll seems to be hustling something, or looking to. It reminds one of the Vietnamese outposts in Orange County, California, or in Los Angeles’ Chinatown, which is now largely dominated by Chinese from Vietnam.

    Le Dang Doanh, one of the architects of Doi Moi, estimates that the private sector now accounts for 40 percent of the country’s GDP, up from virtually zero. But Le Dang also estimated that as much as 20 percent more occurs in the “underground” economy where cash—particularly U.S. dollars—is king.

    “You see firms with as many as 300 workers that are not registered,” the sprightly, bespectacled 69-year-old economist explains. “The motive force is underground. You walk along the street. I followed an electrical cable once and it led me to a factory with 27 workers making Honda parts and it was totally off the system.”

    This energy is in part a product of demographics. Most of the people you see in these unofficial workshops are in their 20s and 30s. And unlike what you see in China, these workers also have children. Vietnam may be modernizing and getting richer, but it also enjoys a growing population.

    These trends have enormous long-term consequences. According to the CIA World Factbook, 69 percent of the approximately 86 million people in Vietnam are currently between the working ages of 15 and 64. In the next four decades the Vietnamese workforce is expected to expand rapidly; at the same time, it will contract dramatically in Japan, Taiwan, Singapore, South Korea, and China. As these countries amble into what demographer Nick Eberstadt has called a “fertility implosion” that will lead to a rapid aging of the workforce, Vietnam will remain relatively young.

    Already this enormous source of cheap labor has compelled investors around the world to look toward Vietnam as a way to simultaneously cut costs and increase profits. But more important still is the rapid growth of education. The country enjoys nearly 95 percent literacy.

    This combination of a growing and skilled workforce represents the same combination of factors that previously led to rapid growth in other Asian countries, from Japan in the 1960s to South Korea and Taiwan in the 1980s, and China more recently. One local investment house, Indochina Capital, estimates that by 2050 Vietnam’s economy will be the world’s 14th-largest—ahead of Canada, Italy, South Korea, and Spain.

    Combined with the strong human ties and its aversion to domineering neighbors, these factors suggest that Vietnam may well prove itself as valuable an ally and trade partner to the United States as it was once an irrepressible enemy.

    This piece originally appeared at The American.

    Joel Kotkin is executive editor of NewGeography.com and is a distinguished presidential fellow in urban futures at Chapman University, and an adjunct fellow of the Legatum Institute in London. He is author of The City: A Global History. His newest book is The Next Hundred Million: America in 2050, released in February, 2010.

    Jane Le Skaife is a doctoral candidate at the University of California, Davis. She is currently conducting her dissertation research involving a cross-national comparison of Vietnamese refugees in France and the United States.

    Accompanying maps were prepared for Legatum Institute by Ali Modarres, chairman of the Geography Department, California State University at Los Angeles.

    Photo courtesy of BigStockPhoto.com

    .

  • Mass Transit: Could Raising Fares Increase Ridership?

    Conventional wisdom dictates that keeping transit fares as low as possible will promote high ridership levels. That isn’t entirely incorrect. Holding all else constant, raising fares would have a negative impact on ridership. But allowing the market to set transit fares, when coupled with a number of key reforms could actually increase transit ridership, even if prices increase. In order to implement these reforms, we would need to purge from our minds the idea that public transit is a welfare service that ought to be virtually free in order to accommodate the poor. Concern about poverty should drive welfare policy, not transit policy. Persistent efforts to keep public transit fares as low as possible are a big part of the reason that public transit ridership in North America has hit record lows. To increase ridership, transit agencies have to convince people who can afford to drive that transit is a better option. Convenience, and not lower prices, is the key.

    There are three basic reasons that private automobiles have virtually crowded out transit. First, private automobiles are inherently more convenient for a large segment of the population. Transit routes are naturally limited to well-traveled corridors, which are often slower because of wait and stop times. On the other hand, you can get into your car and immediately take the most efficient route to your destination.

    The second factor is free roads. While people do pay for roads, they don’t pay for using specific roads at specific times. Gas taxes go into general revenues, and road construction and repair isn’t directly connected to usage. As a result, a large percentage of roads are subsidized by travelers who use a small percentage of highly traveled routes. Similarly, drivers don’t pay more during peak times than non-peak times. They instead pay with their time, by waiting in traffic.

    The third factor is that the market dictates private automobile sales. This is important because automobile companies and dealerships have an incentive to keep prices competitive while selling a high quality product. It also ensures that there are a multitude of different types of automobiles, and differing finance schemes and secondary markets tailored to a range of needs. The private sector is great at marketing things to people; government isn’t.

    While public transit can never be as flexible as private automobiles, some of the automobile’s advantages can be reduced. Road tolls and congestion pricing ought to be implemented where practical. Ironically, offsetting these new fees by reducing the gas tax would actually also be beneficial for transit services. After all, the only reason many impractical roads are built is that they are financed out of general revenue. If roads were primarily financed by those who used them, more funding would go to highly traveled urban roads, and less would go toward subsidizing sprawl.

    Here’s the controversial aspect of the solution: Transit should operate on a for profit basis and its prices should closely reflect market forces — even if it means that transit fares increase.

    Mass transit has one major advantage: where there is sufficient demand, transit is inherently cheaper than private automobile usage because the costs are spread over many people, making the per person cost lower. That’s why most people fly with commercial airlines instead of chartering private jets, for example. But keeping the price too low reduces the ability of transit service to provide more routes. And this is important. While there is a segment of the population who are stuck with public transit no matter how inconvenient it is, most people won’t ditch their cars unless they can get to their destinations relatively quickly. And it may not be economical for a transit system to get them to many of those places for $2.25.

    A flat price structure subsidizes inefficient routes with efficient ones. But what if transit services charged the full cost for less efficient routes? While charging more for less popular routes may seem like it would reduce ridership, it wouldn’t. If people knew that there were many additional routes going to out-of-the-way locations that they don’t ordinarily frequent, they would still positively factor it into their calculation of whether or not they need a car. After all, paying $5 to get to an out of the way destination occasionally is still cheaper than getting a cab, and can often be cheaper than the cost of driving. Transit systems have higher ridership in major centres than in small centres, even when the fares are high. Transit is not only cheaper than driving in dense cities, it’s also equally or more convenient.

    But just allowing prices to fluctuate isn’t enough. For a price system to function properly there needs to be an incentive to keep prices as low as possible. Public monopolies don’t have this incentive. Furthermore, there needs to be competition to ensure high levels of service. The reason that air travel service is so high quality and cheap is because it is private, not public.

    The thought of privately delivered public transit will no doubt turn some people off, especially public sector employees. And simply removing government from the transit business isn’t necessarily the best solution. Instead, municipal transit services should be turned into transit commissions that coordinate and contract for transit from competing companies. Transit companies would bid on routes, and pay the city a fixed cost for the right to service each route based on a competitive auction.

    For less cost efficient routes, a city could even offer a small subsidy per rider, should no transit company enter a bid. Whichever company would be willing to service that route at the lowest subsidy level would win. This would maintain downward pressure on costs. But it would be important that the transit commission use this as a last resort. Otherwise it could undermine the competitive market process by creating the incentive for companies not to bid on many marginal routes until a subsidy was offered.

    Collecting variable rates for trains is simple, but it would be more difficult for buses. One method would be to have buses classified as local, express, or commuter, for instance. Each would charge a different rate. An automated payment system could be installed where riders swiped their cards on the way in and out, as they do on the Washington DC Metro, to calculate the rate.

    Changing the operating and pricing structure wouldn’t alter the way that people use transit services. Transit vehicles would still work on a coordinated schedule, and collect fees from riders as they always have. What would change is that the competing companies would have an incentive to keep operating costs lower, and to provide more routes. They also would have to meet performance guidelines monitored by the city, or face fines. What would change is the philosophy of transit companies. They would be out to make a profit.

    This may seem like a radical departure, but consider that London, England, contracts out its bus service. If one of the world’s busiest cities can co-ordinate a public-private partnership of this magnitude, there is no reason smaller cities couldn’t do the same. The key is to create the right incentives and institutions. The current model of treating transit as a welfare service has failed. It is time to make transit the first choice for commuters, not the last.

    Steve Lafleur is a Policy Analyst with the Frontier Centre for Public Policy.

    Image from BigStockPhoto.com: A metro bus in Madison, Wisconsin.

  • The Precarious State of the Highway Trust Fund

    On November 18, President Obama signed into law a bundle of appropriation bills for FY 2012  including appropriations  for the U.S. Department of Transportation. The measure had been passed earlier in the House by a vote of 298-121 and in  the Senate by a vote of 70-30. 

    The bill provides $39.14 billion in obligation limitation for the highway program, a reduction of almost $2 billion from FY 2011; however, an additional $1.66 billion is appropriated for highway-related "emergency relief." The transit program is funded at $10.31 billion (incl. $1.95 for New Starts), a $400 million increase from FY 2011, and Amtrak at $1.42 (incl. $466 million for operating expenses). The discretionary TIGER program is retained at $500 million, a slight decrease from FY 2011.

    Conspicuously absent in the new budget is any funding for high-speed rail and the Intercity Passenger Rail Service program — a fact cheered  by fiscal conservatives but mourned by boosters of high-speed rail and supporters of the California bullet train. The California High-Speed Rail Authority relies heavily on further federal funds to complete the project. According to its business plan, it expects $33-36 billion to come from the federal government. Failure by Congress to appropriate money for high-speed rail for a second year in a row makes the prospect of future federal support for the California rail project increasingly doubtful. 

    Also refused any funding in the FY 2012 congressional transportation appropriation are two other Administration priorities:  the Livable Communities Initiative ($10 million requested in the President’s budget); and the National Infrastructure Bank ($5 billion requested).  The conference committee action would seem to put an effective end to any further attempts to create the Bank, at least during the remainder of this session of Congress.      

    Solvency of the Highway Trust Fund in Jeopardy
    The congressional conferees have warned that the bill will deplete almost all resources from the Highway Trust Fund (HTF) by the end of fiscal year 2012.   "Without enactment of a new surface transportation authorization bill with large amounts of additional revenues this year," the report said, "the Highway Trust Fund will be unable to support a highway program in fiscal year 2013. The conferees strongly urge the committees of jurisdiction to enact surface transportation legislation that provides substantial long-term funding to continue the federal-aid highways program."

    As Taxpayers for Common Sense (TCS) pointed out in a commentary, the appropriations committee is willing to acknowledge the problem, but quickly passes the buck to the authorizers to come up with more cash for future years.  But the authorizers aren’t doing any better. The Senate Environment and Public Works (EPW) Committee passed a $109 billion reauthorization bill that would fund two years of transportation spending by essentially drawing the HTF balance down to zero (and still unable to identify the remaining  $12 billion in offsets). To House Transportation and Infrastructure Committee Chairman John Mica (R-FL) the implications of the Senate action are clear.  In a November 14 letter to Senate EPW Committee Chairman Barbara Boxer (D-CA)  he warns that the Senate bill will "essentially bankrupt the Highway Trust Fund and make it impossible to provide any funding for fiscal year 2014."

    To its credit, the Senate Environment and Public Works Committee recognized the precarious state of the Trust Fund and took steps to impose spending controls to prevent the Fund from falling into insolvency.  The Senate bill provides (in section 4001) for mandatory reductions in the obligation limitation should the Trust Fund  balances in the Highway Account, as estimated by the CBO, fall below a certain pre-determined level (for example, in the event gas tax revenues fail to match expectations). The designated triggers are $2 billion at the end of FY 2012 and $1 billion at the end of FY 2013. In other words, the Senate EPW committee has wisely provided for a mechanism to reduce highway expenditures below the authorized  $109 billion level in order to prevent the Trust Fund from going bankrupt.

    The House, for its part, is exploring a different way to fund a longer-term, five-year reauthorization. On November 17, Speaker Boehner announced he will unveil in December a combined transportation and energy bill, dubbed the "American Energy & Infrastructure Jobs Act,"  (HR 7). The bill  would authorize expanded offshore gas and oil exploration and dedicate royalties from such exploration to "infrastructure repair and improvement" focused on roads and bridges. 

    However, many questions have been raised about this approach. Several lawmakers —  notably, Rep. Nick Rahall (D-WV), Ranking Member of the House Transportation and Infrastructure Committee, Sen Barbara Boxer (D-CA) chairman of  of the Senate Environment and Public Works Committee  and Sen. James Inhofe (R-OK) the committee’s ranking member—have criticized the aproach as problematical and potentially miring the bill in controversy. They allege that  the royalties the House is counting upon would fall billions of dollars short of filling the gap in needed revenue  (the gap is estimated at approximately $75-80 billion over five years). They further allege that the revenue stream from the royalties would not be available in time to fund the measure. 

    Other critics have pointed out that states in whose jurisdiction drilling may occur, will assert a claim to a lion portion of the royalties. Also, using oil royalties to pay for transportation would essentially destroy the principle of a trust fund supported by highway user fees.  For all the above reasons, the House proposal is likely to meet with a skeptical reception in the Senate.

    As the TCS memorandum aptly concluded,  in the end it’s a big game of "kick the can." The appropriators kick the can to the authorizers. The authorizers kick the can down the road a couple of years or rely on speculative and uncertain revenue that may or may not materialize. In the meantime, the fate of the Trust Fund continues to hang in a precarious balance, victim of Congressional indecision and new fiscal imperatives.    
     
    ~~~~~~~~~~~~~~~~~~~~
    Note: the NewsBriefs can also be accessed at www.infrastructureUSA.org

    A listing of all recent NewsBriefs can be found at www.innobriefs.com

  • Social Market Housing for the USA: Dream or Nightmare?

    Imagine a future America where the home ownership rate climbs from the current 65%1 to 87%2.  Libertarians as well as many social democrats would be cheering.  Imagine that this rate was achieved by the state itself acting as the builder of 88%3 of the housing.  Imagine also that the state imposes rules on home purchases to favor first time buyers and young families. “Progressives”, increasingly tilted towards the unmarried and childless, would bristile.  Imagine racial diversity rules that restrict who you can sell your home to. Time for libertarians to shudder.   

    Most Americans would probably say such a concept is “Utopian” but serious policy makers should reflect that the word “Utopia” literally means “nowhere”. But Social Market Housing is alive and well in Singapore. 

    For Americans living in the hottest real estate markets, the USA is very far from the ideal of a Property Owning Democracy.  At the time of the 2010 census three of New York City’s five boroughs had home ownership rates under 30% and in the Bronx it was under 20%4.   Though many US politicians support the concept of home ownership it has been declining since 1980 when it reached a peak of 68%5

    How have the Singaporeans achieved such high ownership rates despite having the richest economy in South East Asia?  Many factors come into play.  Singapore has an aggressive building program achieved through a public body – the Housing Development Board (HDB).   HDB apartments can only be sold to Singapore citizens and those with permanent resident status, so their prices cannot be inflated by foreign speculators. 

    The HDB also has eminent domain powers to claim land if it needs to.  Singapore’s version of social security is not inter-generational (unlike the USA where the current generation of workers pays for the last generation of retirees) but rather an elaborate system of forced saving by both workers and their employers.  Part of the compulsory savings can be used for a deposit on an HDB flat. Finally there is an elaborate system of price discounts on new HDB flats which is not only designed to favor first time buyers, but also young families and newlyweds. 

    There is even a category of ‘Executive Homes’ to retain managers in Singapore.  These may be larger apartments or semi-detached homes with gardens. 
    There is no problem with runaway maintenance fees.  HDB owners do not pay associations dues.  Their elevators are maintained through local real estate taxes so monthly costs are very predictable.  In the year 2010 the average Singaporean household paid $145 USD a month in property tax6
    .  This is less than the $216 average USD American Condo owners paid in condo fees at the time of the 2000 census.

    Some Americans might argue that this can only work because Asians are conformist and are culturally more receptive to rule-based systems.  I do find that South East Asians are reluctant to draw attention to themselves in public.  When I talk in a Starbucks with my normal New York speaking voice I sometimes look up and find myself orating to a group of open-mouthed onlookers (“I’m so sorry it’s the Tourette’s Syndrome – my shrink keeps forgetting to up my dosage.”)

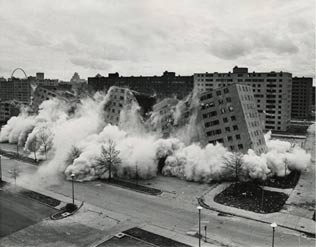
    Many US politicians recoil against the state as a real estate developer largely because tenanted housing projects have been such a magnet for social problems.  The St. Louis public housing scheme, Pruitt-Igoe, was eventually dynamited (see photo right7).  The author of “The Death and Life of Great American Cities”, Jane Jacobs, famously complained that the public housing projects took some mixed income neighborhoods which could have been viable and sealed their doom by concentrating too many low income and unemployed people in the same buildings. 

    Singapore’s HDB does act as a direct landlord for a very small number of people who meet a strict income ceiling (about $1160 USD a month8), however the low income tenants are spread thinly among owner occupiers. Income ghettoization is limited. My realtor tells me that one of the blocks in my own HDB estate is for tenants rather than owners but from the outside I cannot tell which building it is.  Another form of deliberate social mixing takes the form of racial quotas intended to prevent the formation of ethnic enclaves.  If the percentage of people in a given racial group has already met the national quota you can be blocked from selling or renting to a person in that category. Access to the more attractive and less attractive neighborhoods is thus shared out more equally.  This looks like a policy American cities should consider given that the 14th amendment, busing and affirmative action have yet to produce full integration. 

    One aspect of America’s public housing projects that particularly angered Jane Jacobs was the wholesale removal of small retailers.   In theory “The Projects” could have included small commercial spaces at the ground floor but generally public rental buildings in most of the US are considered to be danger zones where retailers fear to tread. 

    Typically the ground floor of HDB buildings is a void space where retailers can create businesses. Often they are left empty but sometimes the policy works well.  Near Singapore’s Clementi MRT train station many dozens of “mom and pop” stores are now sheltering under the HDB apartments; late night street life is vibrant.  When I ask Singaporeans to name a neighborhood that would be dangerous to go at night, nobody can think of one.  The country’s homicide rate would pose an absolute disaster for TV script writers.  You could not have a CSI series or Law and Order because Singapore would not be able to supply the requirement of one murder per week.  The homicide rate is currently about one tenth of the USA’s9.

    If she were alive today Jacobs might also criticize the HDB apartment blocks for excessive architectural uniformity.  She loved communities to have buildings with different age profiles.  But most of Singapore’s buildings are so new the option of preserving the old simply does not exist. Greater architectural variety is an attractive goal.  One Singaporean architect commented that they will really have the styles right with you can build an HDB block next to a private condominium and you cannot tell which is which (a sort of urban planning version of the Turing Test).  Local architects are point to a new HDB building, the Pinnacle at Duxton, as an example of a new look more comparable with private designs (pictured right).

    But would greater variety cause costs to escalate?  Observing new HDB construction it is possible to discern a very advanced form of modular building; entire concrete rooms are hoisted into the air at the end of a crane.  Certainly a wider range of designs could be achieved using the same building blocks.  Kids can make a huge variety of things with Lego.  The same cuboids could also make homes with gardens which are America’s preferred form of housing— a gift of an expansiveness impossible to achieve, except in dreams or by immigration, in Singapore.

    Is Social Market Housing a good model for the USA? Certainly there would be many objections but the ideal of home ownership is too often an American Dream that disappears into a distant future. Are we doing enough to create a Commonwealth with “Liberty and Justice for All?” When they say the Pledge of Allegiance we force or children to use the words “Indivisible” and “One Nation”.  Are we enough to make those words a reality?

    Philip Truscott is a Senior Lecturer at Singapore University of Technology and Design
    Notes:

    Lead photo of HDB flats courtesy of BigStockPhoto.com. Other photo image files from  http://commons.wikimedia.org

    ———————————

     1 US Census Bureau, (2011), “Housing Characteristics: 2010”, Washington DC: Bureau of the Census. Accessed on 19/11/2011 from http://www.census.gov/prod/cen2010/briefs/c2010br-07.pdf

    2 SINGSTAT, (2011), “Statistics Singapore: Key Annual Indicators”, Singapore: Department of Statistics. Accessed on 19/11/2011 from <http://www.singstat.gov.sg/stats/keyind.html#hhld>.

    3 SINGSTAT, (2008), “Key Indicators of Residential Households”, Singapore: Department of Statistics, Accessed on 19/11/2011 from <http://www.singstat.gov.sg/stats/themes/people/hhldindicators.pdf>.

    4 US Census Bureau, (2011), “Housing Characteristics: 2010”, Washington DC: Bureau of the Census. Accessed on 19/11/2011 from <http://www.census.gov/prod/cen2010/briefs/c2010br-07.pdf>

    5 This is based on a cross-tabulation of the variables “ownership” and “year” from the IPUMS online data analysis system at this URL http://sda.usa.ipums.org/cgi-bin/sdaweb/hsda?harcsda+1850-2009

    6 Singapore Gross Property Tax Revenue from SINGSTAT, “Public Finance” at http://www.singstat.gov.sg/pubn/reference/yos11/statsT-publicfinance.pdf  The number of resident households has been taken from the Census of Population 2010 at <http://www.singstat.gov.sg/pubn/popn/c2010sr2/t20-25.pdf>

    7 Photo public domain: http://commons.wikimedia.org/wiki/File:Pruitt-Igoe-collapses.jpg

    8 HDB, (2011), “Homes for All”, Singapore: Housing Development Board.  Accessed on 19/11/2011 from < http://www.hdb.gov.sg/fi10/fi10221p.nsf/Attachment/AR0405/$file/home5_frameset.html>.

    9 UNODC, (2011), “Homicide level for 2010, or latest available year”, Vienna: UN Office on Drugs and Crime, accessed on 17/11/2011 from < www.unodc.org/documents/data-and-analysis/statistics/Homicide/Homicide_level.xlsx >.

  • Is Industrial Strife a Sign of Housing Stress?

    Industrial disputes – including a spate of on and off again strikes at national carrier Qantas – are becoming once again a frequent feature of the Australian media. Unions are pushing for wage rises in the face of the falling buying power of the fixed wage (as costs of living rise). Those wage push pressures are being resisted by businesses trying to stay afloat in a very ordinary domestic economy and amidst rising global competition.  

    But instead of a conflict between labor and business, perhaps we may consider   lower living costs as a solution which benefits both? Fundamentally, this boils down to addressing our biggest cost burden: housing. 

    The rapid escalation of housing costs have occurred under the aegis of Labor dominated state governments. Whether in Queensland, New South Wales or Victoria – Australia’s three largest states – their imposition of artificial growth boundaries that limited land supply, the introduction of upfront taxes on new development, and ever more complex planning and development regulation have driven housing prices to unsustainable levels.

    This is ironic since the worst impacts of those policies have been most felt by the very working class constituency which Labor traditionally sought to represent. Having presided over and championed policy mechanisms which have driven up housing costs for workers, these same governments then resist attempts to recover that standard of living through wage growth.

    Now before you think I’ve gone all Marxian militant on you all (trust me, I haven’t), here’s an example of what I’m driving at.

    Much has been said about housing affordability and what it will mean to lock an entire generation out of the housing market.   Recently this story documents yet another report attesting to falling home ownership and the rise of a renting class.   Particularly hard hit are the people who are trying to buy a first home in which to raise a family. They could typically be around their mid to late 20s, biologically in their prime for having and raising children. At this stage of life, you are probably below the average income for your career or profession so the reality of the affordability problem is most acute.

    In Queensland, this might be a teacher in their mid 20s, with two or three years of training, married to a constable who together earn after tax income around $87,500 per annum. (This combined income would be much less of course if, for example, one of our young couple was a child care or retail worker).

    Now, take a modest new family home in an outer suburb like North Lakes or Springfield. Let’s assume they’ve saved a small deposit, and with a loan of $400,000, they buy something for around $450,000. That’s hardly McMansion territory. But that loan, over 30 years at 7.8%, will cost them close to $35,000 per annum in repayments, or 40% of their combined after tax incomes.

    This, of course, is before they even think about children, and the prospect (despite generous maternity and paternity pay and leave provisions) of enduring a significant household income reduction while one of them isn’t working. Even on returning to work, there would then be child care fees, which quickly erode their pre-child household budget.

    Buying a home and starting a family have become a huge financial consideration, instead of a fairly normal and unremarkable pattern of generational and social growth. And it is now absolutely dependent on a dual income family, with both of them preferably good incomes.

    This is a profound change over the last decade. As a result, fewer people are buying homes, people are postponing children (until they can afford them) and when they do, they’re having fewer children. A countless stream of statistical and demographic reports are now underlining this change on an all too frequent basis. Although some greens may celebrate it, this is very bad news long-term for the economy, for society and the community as a whole. 

    So is it any wonder we’re seeing wage push pressures?

    Consider the cost of the $450,000 modest home they’ve bought. Within that price is roughly a $50,000 up-front ‘developer levy’ (better called a new home buyer tax). There’s probably a similar cost of in inflated land costs, brought on by artificial land supply constraints in a country of abundant land. There would also be a raft of minor additional building costs introduced under the guise of ‘green’ or ‘sustainable’ building guidelines, in order   ‘to prevent the sea from rising’. Plus there’s a hard-to-quantify compliance cost because getting the approval to develop the land for new homes now takes 10 years instead of a few months, engaging teams of town planners, lawyers, and other hangers on.

    The total cost of all of these additions to the price paid by our young couple could easily be well over $100,000. If you don’t believe me, check out this old report which I commissioned some years ago.

    A quick bit of math’s now follows. That extra $100,000 (conservatively) has been funded via our young couple’s mortgage. That’s an extra hundred large they’ve borrowed, to cover the costs of additional taxes, fees and compliance introduced under the watch of a State Labor Government. That $100,000 is worth an extra $8,640 per annum out of their pockets. If their repayments fell by that amount, their mortgage costs would be around $26,000 per annum in total, or just under 30% of their combined household income – not 40% of it.

    There you have it. At 30% of household income, not only the home becomes more affordable, but so do children. But at 40%, it’s proving to be touch and go.

    There are two ways, simply put, to improve the cost of living equation faced by younger workers on largely fixed incomes. You can increase their wages (which the unions want and which businesses and governments resist), or you can reduce their costs of living.

    This has somehow eluded people working in state treasuries and planning departments. I haven’t even commented on the insanity of the carbon tax, which is only going to exacerbate basic costs for energy further and likely weaken Australian exports.

    The simple economics of what we’re talking about was summed up beautifully over 160 years ago, in Charles Dickens’ novel David Copperfield, when Mr Micawber lectured the young Copperfield on the perils of exceeding budgets:

    "Annual income twenty pounds, annual expenditure nineteen nineteen six, result happiness. Annual income twenty pounds, annual expenditure twenty pounds ought and six, result misery."

    Mr Micawber, you’ll note, wasn’t implying the need for more income, he was highlighting the important role played by expenses.

    In the Australia (and Queensland) of 2011, the same still applies. Rather than push for more income, unions could do better to lobby their Labor Parties to reduce their living costs. Reducing the housing infrastructure levies, relaxing the rigidity and ideology of urban growth boundaries, reducing compliance costs, cutting green taxes would drive down the costs of housing.   

    In this era of globalization, fighting pitched industrial battles with employers for a few extra dollars a week in income seems futile compared to pressuring   governments over the induced inflation associated with the providing a family home you can afford and raise a new generation of Australians.

    Ross Elliott has more than 20 years experience in property and public policy. His past roles have included stints in urban economics, national and state roles with the Property Council, and in destination marketing. He has written extensively on a range of public policy issues centering around urban issues, and continues to maintain his recreational interest in public policy through ongoing contributions such as this or via his monthly blog The Pulse.

    Photo courtesy of BigStockPhoto.com.