Blog

  • Do Standardized Tests Raise Dropout Rates?

    The No Child Left Behind Act became law in 2002. Among other things, it required standardized testing of students, beginning in 2003. The scores are used to evaluate the quality of the schools.

    It sounds reasonable. Congress certainly thought so. It was co-authored in the Senate by Edward Kennedy (D-MA) and Judd Gregg (R-NH), while John Boehner (R-OH) and George Miller (D-CA) introduced it into the House. It passed both houses by huge bi-partisan majorities, 91-8 in the Senate and 384-45 in the House.

    The Act’s passage also marked the low point in California’s High School dropout rate.

    In 2002, California’s High School dropout rate had been declining for several years. After the act’s passage, the dropout rate trend experienced an unprecedented reversal. What had been a declining trend became an increasing trend, one that continues today. After bottoming out at less than 11 percent in 2002, California’s High School dropout rate is now approaching 22 percent.

    The costs of dropouts are enormous, both for the students who leave school and for society. A person without a High School education is economically crippled. For all but the very exceptional few, dropping out of High School is a sentence to a lifetime of poverty and drudgery. For many dropouts, a lifetime of poverty and drudgery is the best possible outcome. Far too many will be involved in drug abuse, dysfunctional or violent relationships, teenage pregnancies, and crime.

    The costs to society are large. They include losses to crime, and the direct costs of subsidies, social programs, healthcare, prisons, and law enforcement. Those costs may be exceeded by the dropout’s output deficiency, that is, the difference between what the dropout would have produced with a decent education and what he or she actually produces.

    One way to improve standardized test scores is to increase the retention of tested topics by the students. An easier way is to prohibit students who would perform poorly from taking the test. Since all students have to take the test, this means converting poorly-performing students into non-students, letting them drop out.

    It looks to me like California’s educational establishment has opted for the easy way.

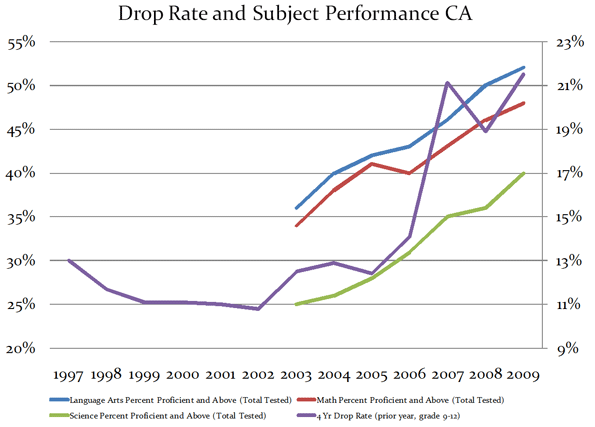
    On the chart below, the purple line shows California’s dropout rate from 1997 through 2009; you can see the percentages on the right-hand side of the chart. The other lines show the percentage — on the left side of the chart — of California’s students who passed the standardized tests for Math, Language, and Science. California’s passing percentage in each field has increased lockstep as dropouts increased.

    It is worse than that, though. The percentage of students passing the standardized tests has increased by about 15 percent, on average, while the percentage of students dropping out has just about doubled. That’s an extraordinarily expensive improvement.

    Did the schools follow this strategy deliberately? You can’t rule it out. People react to incentives, and the Act provides an incentive to abandon those who will likely perform poorly on the tests. Teachers will probably object to that, but we have no reason to believe that they should somehow be different that most people and ignore the incentives. Besides, we’ve already seen examples of teachers and administrators cheating on these tests.

    Teachers assert that the solution to all of No Child Left Behind problems is to abandon it. The other solution, of course, is to fix the incentives. The way to do that would be to assign the schools a huge financial penalty for dropouts. Teachers and administrators would scream. They would tell us that dropouts result from problems at home and socioeconomic conditions.

    No doubt, many students have terrible home conditions that put these children at a huge disadvantage, but those are exactly the children that we should be giving the most attention. A lousy home environment doesn’t explain the sudden increase in dropouts. These issues have been with us for a very long time. I took my first college economics class, The Economics of Poverty, in the 1969-1970 school year. There is nothing about poverty today that we didn’t discuss in that class, except that the returns to education have increased dramatically since then.

    Failure to educate disadvantaged children guarantees that the perverse cycle of poverty and despair is perpetuated. Providing them with quality education, even with the active resistance of family, friends, culture, and the students themselves, is the only way to provide them with even the minimum hope for the upward mobility that government-provided education implicitly promises.

    Abandoning our least advantaged children is unconscionable. If we are to have an egalitarian and merit-based society, we must reduce the dropout rate. The way to ensure that no one is abandoned is to penalize the school for dropouts. It sounds harsh, but we owe it to the students, and we owe it to ourselves.

    Bill Watkins is a professor at California Lutheran University and runs the Center for Economic Research and Forecasting, which can be found at clucerf.org

    Flickr Photo by kerryj.com: “On national standardised testing, from a brilliant educator in Western Australia – a student’s view of national summative assessments”.

  • The Secret of Where Good Energy Comes From

    In the wake of Solyndra’s failure, pundits have latched on to a simple, compelling narrative: government can’t do energy right.

    From synfuels to solar panels to "clean coal" (written, inevitably, with knowing quotation marks), demonstration projects funded by the Department of Energy are described as one failed white elephant after another. Today the DOE is the agency everyone loves to hate (and, at least in Texas Gov. Rick Perry’s case, the agency to forget).

    What gets left out (and forgotten) is that virtually every one of today’s major energy technologies exists thanks to sustained US government investments in research, development, and demonstration. Consider:

    To be sure, not every DOE investment has succeeded. But even the projects frequently named as failures were often secret successes.

    Take synfuels. After the oil shocks of the 1970s, the US government created the synthetic fuels program. The program worked to produce fuel competitive with oil at $60 a barrel — the program’s objective. But when the price of oil dropped to $10 a barrel in the early 1980s, Congress sensibly abandoned the program. The total amount spent by Congress on SynFuels ended up being just $2 billion — cheap insurance against future oil embargoes and price shocks, which had sent the United States into a costly recession.

    Most people are surprised to learn that the SynFuels program was a success in another way: it led to the development of the technologies today used for coal gasification and carbon capture and storage, which captures coal plant emissions.

    Clean coal is ridiculed by greens and libertarians alike as pie-in-the-sky. In fact, carbon capture and storage has been demonstrated around the world. One descendent of SynFuels, Dakota Gasification, is to this day still producing gas and sequestering several million tons of CO2 each year at Weyburn in Canada.

    Or consider the case of an abandoned next generation nuclear plant on the Clinch River. The Washington Post singled it out to make a sweeping case against all public investments in advanced energy. What the Post didn’t mention is that, since 1949, the U.S. government has successfully demonstrated and tested more than 50 experimental reactor designs at the National Reactor Testing Station (now Idaho National Labs). One of them — the EBR-II — ran for 30 years at the testing station and was the technological predecessor to the integral fast reactor (IFR), which is increasingly viewed by experts as promising since it is so efficient, burning conventional nuclear reactor waste as fuel.

    Sometimes pundits point to natural gas drawn from shale as an example of how the private sector does the job better. They claim fracking and horizontal drilling were developed by a solitary entrepreneur named George Mitchell in the 1980s. In fact, the key breakthroughs in the development of shale gas technologies occurred thanks to intensive DOE demonstration efforts pursued by President Jimmy Carter, the frequent butt of energy-related jokes, in response to the 1970s oil embargoes.

    Look at what industry and independent experts say. "The Department of Energy was there with research funding when no one else was interested," said the head of Julander Energy, a member of the National Petroleum Council, "and today we are all reaping the benefits." A Senior Director at Halliburton said, "In the early 1980s, the industry as a whole did not have a clear vision for producing gas from shales, and benefited from DOE involvement and funding of [electro-magnetic telemetry] EMT technology… there is a clear line of sight between the initial research project and the commercial EMT service available today." Dr. Terry Engelder of Penn State calls the DOE’s Eastern Gas Shales Research Program "one of the great examples of value-added work led by the DOE."

    In the case of the "shale gas revolution," as in so many examples of breakthrough American innovations, it is this key interplay between public sector research, demonstration, and testing and private sector ingenuity and entrepreneurship that drives major advances in technology.

    To be sure, US investments in energy must be reformed. We should stop bluntly subsidizing the deployment of more of the same energy technologies — whether current-generation wind, solar, biofuels, or nuclear — and retool energy incentives to demand steady and continual innovation and cost improvements. Firms that out-innovate their competitors with next-generation clean energy improvements should be rewarded, and clean tech industries should put themselves on a clear path to subsidy independence over time. The big story about energy innovation remains unwritten. For most insta-experts on energy, it’s easier to just recycle the old one.

    Shellenberger and Nordhaus are co-founders of the Breakthrough Institute, a leading environmental think tank in the United States. They are authors of Break Through: From the Death of Environmentalism to the Politics of Possibility.

    Image from BigStockPhoto.com

  • California’s Bullet Train in the Court of Public Opinion

    A business plan released on November 1 by the the California High-Speed Rail Authority (CHSRA), has placed the price tag for the LA-SF bullet train project at $98 billion— trippling the $33 billion estimate provided in 2008 in the voter-approved Proposition 1A. At the same time, the date of project completion has been pushed back by 13 years — from 2020 to 2033.

    California state legislators who must soon decide whether to proceed with the high-speed rail project are facing an increasingly skeptical climate of opinion.  A growing body of their colleagues who formerly supported the rail authority, including state Senators Alan Lowenthal, Joe Simitian and Mark DeSaulnier, have been shocked by the new estimate and have begun to question the wisdom of proceeding with the project. Other legislators intend to go further. State Sen. Doug LaMalfa said he will sponsor a bill to put the voter-approved rail project back on the ballot. House Majority Whip Kevin McCarthy announced that he will introduce legislation that would freeze federal funding for the project for one year so that congressional auditors can review its viability.

    At the federal level, chances of further funding for the California project are judged to be negligible, with Congress having virtually zeroed out high-speed rail funds in the FY 2012 federal budget.

    At the same time, the bullet train is rapidly losing public support. Nearly two-thirds of California’s likely voters would, if given a chance, stop the project according to a recent opinion survey. Organized opposition within the state is widespread. Public interest groups and watchdog coalitions such as  Californians Advocating Responsible Rail Design (CARRD), the Community Coalition on High-Speed Rail, the California Rail Foundation, and the Planning and Conservation League have repeatedly challenged the Authority’s cost estimates, ridership projections and rail alignments. They have testified against the project in public hearings and taken the Authority to court. Recently, they scored a legal victory when a state judge ruled that the Authority has to reopen and revise its environmental analysis of a controversial alignment.

    A team of respected independent experts, comprising Stanford economist Alain Enthoven, former World Bank analyst William Grindley and financial consultant William Warren, have reinforced the growing feeling of doubt about the project’s viability by challenging the rail authority’s assumptions and pointing out the flaws in its business  plan. 

    Finally, at both the national and state levels, the bullet train project is receiving an increasingly skeptical press scrutiny. Nearly every newspaper in the state (with the exception of the LA Times and SF Chronicle) has turned critical.  News services, notably California Watch (founded by the Center for Investigative Reporting) and investigative reporters, such as SF Examiner’s Kathy Hamilton, Mercury News’ Mike Rosenberg and OC Register’s Steve Greenhut are providing incisive critical analysis to counter the steady flow of publicity generated by the Authority and its supporters. 

    Critical commentaries in mainstream press vastly outnumber favorable stories. Here are three examples:

    The Train to Neverland
    The Wall Street Journal , November 12, 2011

    California’s high-speed rail system is going nowhere fast
    The Washington Post, November 13, 2011

    High-Speed rail depends on $55B in federal funds
    California Watch, November 12, 2011 (by Ron Campbell and Lance Williams)


    Ken Orski has worked professionally in the field of transportation for over 30 years.

    ~~~~~~~~~~~~~~~~~~~~
    Note: the NewsBriefs can also be accessed at www.infrastructureUSA.org
    A listing of all recent NewsBriefs can be found at www.innobriefs.com

  • California’s Jobs Engine Broke Down Well Before the Financial Crisis

    Everybody knows that California’s economy has struggled mightily since the 2008 financial crisis and subsequent recession. The state’s current unemployment rate, 12.1 percent, is a full 3 percentage points above the national rate. Liberal pundits and politicians tend to blame this dismal performance entirely on the Great Recession; as Jerry Brown put it while campaigning (successfully) for governor last year, “I’ve seen recessions. They come, they go. California always comes back.”

    But a study commissioned by City Journal using the National Establishment Time Series database, which has tracked job creation and migration from 1992 through 2008 (so far) in a way that government statistics can’t, reveals the disturbing truth. California’s economy during the second half of that period—2000 through 2008—was far less vibrant and diverse than it had been during the first. Well before the crisis struck, then, the Golden State was setting itself up for a big fall.

    One of the starkest signs of California’s malaise during the first decade of the twenty-first century was its changing job dynamics. Even before the downturn, California had stopped attracting new business investment, whether from within the state or from without.

    Economists usually see business start-ups as the most important long-term source of job growth, and California has long had a reputation for nurturing new companies—most famously, in Silicon Valley. As Chart 1 shows, however, this dynamism utterly vanished in the 2000s. From 1992 to 2000, California saw a net gain of 776,500 jobs from start-ups and closures; that is, the state added that many more jobs from start-ups than it lost to closures. But during the first eight years of the new millennium, California had a net loss of 262,200 jobs from start-ups and closures. The difference between the two periods is an astounding 1 million net jobs.

    Between 2000 and 2008, California also suffered net job losses of 79,600 to the migration of businesses among states—worse than the net 73,800 jobs that it lost from 1992 through 2000. The leading destination was Texas, with Oregon and North Carolina running second and third (see Chart 2). California managed to add jobs only through the expansion of existing businesses, and even that was at a considerably lower rate than before.

    Graph by Alberto Mena

    Graph by Alberto Mena

    Another dark sign, largely unnoticed at the time: California’s major cities became invalids in the 2000s. Los Angeles and the San Francisco Bay Area had been the engines of California’s economic growth for at least a century. Since World War II, the L.A. metropolitan area, which includes Orange County, has added more people than all but two states (apart from California): Florida and Texas. The Bay Area, which includes the San Francisco and the San Jose metro areas, has been the core of American job growth in information technology and financial services, with San Jose’s Silicon Valley serving as the world’s incubator of information-age technology. During the 1992–2000 period, the L.A. and San Francisco Bay areas added more than 1.1 million new jobs—about half the entire state total. But between 2000 and 2008, as Chart 3 indicates, California’s two big metro areas produced fewer than 70,000 new jobs—a nearly 95 percent drop and a mere 6 percent of job creation in the state. This was a collapse of historic proportions.

    Graph by Alberto Mena

    Not only did California in the 2000s suffer anemic job growth; the new jobs paid substantially less than before. Chart 4 reveals the sad reversal. From 2000 to 2008, California had a net job loss of more than 270,000 in industries with an average wage higher than the private-sector state average. That marked a turnaround of nearly 1.2 million net jobs from the 1992–2000 period, when 908,900 net jobs were created in above-average-wage industries. Further, during the earlier period, more than 707,000 net jobs were created in the very highest-wage industries—those paying over 150 percent of the private-sector average.

    Chart 5, which indicates job growth or decline in selected industries, again suggests that a lopsided amount of California’s economic growth in the 2000s was in below-average-wage fields. It included nearly 590,000 net jobs in “administration and support”—clerical and janitorial jobs, for example, as well as positions in temporary-help services, travel agencies, telemarketing and telephone call centers, and so on. The largest losses in the state during the 2000s were in manufacturing, which traditionally provided above-average wages. After adding a net 64,900 manufacturing jobs from 1992 to 2000, California hemorrhaged a net 403,800 from 2000 to 2008. But information jobs also went into negative territory, while professional, scientific, and technical-services employment experienced far lower growth than in the previous decade.

    The chart also shows that California’s growth in the 2000s, such as it was, took place disproportionately in sectors that rode the housing bubble. In fact, 35 percent of the net new jobs in the state were created in construction and real estate. All those jobs have vaporized since 2008, according to Bureau of Labor Statistics data. They are unlikely to come back any time soon.

    These are troubling numbers. Fewer jobs and lower wages do not a robust economy make. A continuation of this trend, even if California’s recession-battered condition improves, would result in a far more unequal economy, shrunken tax revenues, and a likely increase in state public assistance—all at a time when officials are struggling with massive deficits.

    Graph by Alberto Mena

    Graph by Alberto Mena

    A final indicator of California’s growing economic weakness during the 2000–2008 period is that the average size of firms headquartered in the state shrank dramatically. As Chart 6 shows, California had a huge increase over the 1992–2000 period in the number of jobs added by companies employing just a single person or between two and nine people, even as larger firms cut hundreds of thousands of jobs. Many of the single-employee companies may simply be struggling consultancies: if they were doing better, they’d likely have to start hiring at least a few people. While start-ups are indeed crucial to economic growth, small companies are especially vulnerable to economic downturns and often feel the brunt of taxes and regulations more acutely than larger firms do. The awful job numbers for the bigger companies—including a net loss of nearly 450,000 positions for firms with 500 or more employees—suggest the toxicity of California’s business climate. After all, bigger firms have the resources to settle and expand in other locales; in the 2000s, they clearly wanted nothing to do with the Golden State.

    Graph by Alberto Mena

    What is behind California’s shocking decline—its snuffed-out start-ups, unproductive big cities, poorer jobs, and tinier, weaker, or fleeing companies—during the 2000–2008 period? Steven Malanga’s “Cali to Business: Get Out!” identifies the major villains: suffocating regulations, inflated business taxes and fees, a lawsuit-friendly legal environment, and a political class uninterested in business concerns, if not downright hostile to them. One could add to this list the state’s extraordinarily high cost of living, with housing prices particularly onerous, having skyrocketed in the major metropolitan areas before the downturn—thanks, the research suggests, to overzealous land-use regulation.

    One thing is for sure: California will never regain its previous prosperity if it leaves these problems unaddressed. Its profound economic woes aren’t just the result of the Great Recession.

    This piece originally appeared in City Journal. City Journal thanks the Hertog/Simon Fund for Policy Analysis for its generous support of this issue’s California jobs package.

    Wendell Cox is a Visiting Professor, Conservatoire National des Arts et Metiers, Paris and the author of “War on the Dream: How Anti-Sprawl Policy Threatens the Quality of Life

    Photo by Altus via Flickr

  • The Caribbean Tech Tide Rises

    The Caribbean has been a long-standing destination for holiday travelers, with its stunning beaches, clear waters, and the 20th century’s plummeting costs of long haul travel. The shift away from its historical sugarcane exporting heritage and towards tourism made the region heavily reliant on the world economy. A realization of this dependency has resulted in another shift: a reach to further develop digital and technological industries.

    For how to make the transition–and how not to–the region might look to Africa, where improvements in financial security, investments by Chinese MNC’s, and soaring commodity prices have transformed the prospects of many African nations. The creation of digital business in Africa has been growing, not just due to opportunism by entrepreneurs, but because of necessity– for the greater good of the countries.

    Mobile phones have led the charge in the continent’s technological revolution. Kenya, for example, had only about 200,000 mobile phone users at the turn of the century. For a country with a population of 40 million this was well below the mark. But it hit 50% saturation of mobile phone ownership in 2011 with the figure now close to 22 million. The boom in phone and computer ownership in Africa has also led to a much more accessible business start up programme. And the “ease of doing business” index by the World Bank goes some way to explaining the progress being made by African nations.

    Think about applying this model to a region with a safe banking infrastructure, a strong education system, and internet availability that rivals some of the world’s most financially developed countries, and you have all the ingredients to develop a thriving technological industry. In the Caribbean, most of the hard work has already been put in place for a vibrant economic system.

    The Afro-Caribbean Connection

    Historically, there has been a heavy reliance on the cooperation between Africa, the Caribbean, and the European Community (known collectively as the ACP). “The Lomé Convention” was part of an initiative to give preferential treatment and an economic commitment over a set number of years to developing economies.

    This convention broke down in 2007. After 30 years of varying success, the geopolitical landscape had changed dramatically, with China offering a new and better source of development to African nations. This opportunity for development through soft-loan diplomacy was not extended, however, to the Caribbean.

    For these island nations, the withdrawal of the agreement meant that, rather than having to focus on meeting quotas for mineral and food exports, they could focus on developing service, and especially technological industries, that were sidelined in the past.

    This new interest in Caribbean technological development has been given mass exposure by entrepreneurs that have started a yearly technology conference. Caribbean Beta serves as an industry hub, and highlights tech job opportunities. Though it is yet to pick up as much steam as any of the hundreds of conferences found in America or the UK, it is a step in the right direction to push the industry closer to international standards.

    Caribbean countries have shown a collective desire to be at the forefront in technology, with the Antigua minister, for example, displaying an understanding of the benefits of a strong internet infrastructure by demanding the country’s telecommunications companies introduce a 4G network. The nation wants to incorporate the same internet structure that you will find elsewhere. It plans, by 2012, not only to serve the tourism industry with wifi, but to provide police stations, fire stations and secondary schools teachers with high speed laptops, and to have the police force take part in ongoing digital training.

    The Digital Divide And Development

    The digital divide is described as the gap between those that have a computer and internet access and those that don’t. This divide is being slowly closed, despite the nay sayings of scholars in the mid 2000’s (found in this article by Lester Henry, for example) that challenged the regional leaders’ aspirations. Many Caribbean countries have kept to their policies on IT and telecommunications, and many have even exceeded penetration targets. So serious is this desire to be connected that countries in the Caribbean are not far off from matching, or, in St Lucia’s case, surpassing, the internet penetration of many super powers.

    Right now, tourism and industry typically make up around three-quarters of GDP for Caribbean nations like Barbados. For this to change, and for the region to become a place where a tech industry and start ups can thrive, there needs to be regional cooperation: a pooling together of resources from different countries. One day in the not too distant future, one of the region’s capitals may become a technological hub for the Caribbean and Central America. It’s both hard to imagine, but very possible, that with the right leadership the Caribbean might end up with a digital industry not dissimilar from the likes of Korea, of Thailand, or even of Scandinavia.

    Photo of crab on a keyboard: “Damn! I forgot my password again!” by Mean and Pinchy (Lisa Brown)

    Andy studied international Economics. He has seen the effect the downfall of the economy has had on the tourism industry first hand, and the will of a region to develop an economy not as fully dependent on outside sources.

  • Does a Big Country Need to do Big Things? Yes. Do We Need a Big Government to do them? No.

    TV network MSNBC’s left-leaning commentator Rachel Maddow has opened herself up to ridicule by the conservative blogsophere over her advert featuring the Hoover Dam. The thrust of the spot is that “we don’t do big things anymore” but that we should. But critics say the dam couldn’t be built today due to environmental opposition to exactly these kinds of projects. Indeed many in the Administration and their green allies are more likely to crusade for the destruction of current dams than for the building of new ones.

    Both sides have their points.

    Building the Hoover Dam was not uncontroversial, to say the least. But it has proven to be beneficial to millions of Americans (flood control, hydroelectric power, recreation, and water for homes, farms and factories). Truly, it has allowed the desert to bloom.

    Public goods like dams are not excludable (their use is not limited to paying customers), so only government can provide them, right? Well, as economist Jodi Beggs points out, there is certainly a case to be made for private ownership of seemingly public goods. The questions to be asked are:

    • Do the benefits to society of these projects outweigh the costs?
    • Could private enterprise provide this good or service if the government did not undertake the project itself?
    • Is there a compelling reason to ensure that everyone have access to this good or service?
    • If so, is there a way to ensure access without wholly providing the good or service?

    In support of the case for private ownership Beggs cites Dingmans Bridge, which provides a crossing of the Delaware River between Pennsylvania and New Jersey, one of the last private toll bridges in America. Ironic she should mention it, because for the past 40 years Dingmans Bridge was supposed to be deep under the water behind the Tocks Island Dam.

    The Big Dam that Never Got Built

    Although Tocks Island Dam was never built, 72,000 acres of land were acquired by the U.S. government, often by condemnation, including farms, homes, and businesses. Whole towns disappeared when people had to move away, including many historic roads and structures that featured prominently in the Revolutionary War. This land now constitutes the Delaware Water Gap Recreation Area, which I visited last August on my summer vacation. It was eerie, haunting, beautiful and amazingly empty on a warm summer’s day within a 90-minute drive from Manhattan (okay, maybe two hours).

    Many of the condemned homes, farms and buildings still exist, abandoned. As I drove through the area I could not help but think something has gone terribly wrong here, but what? Is it a story of government incompetence or good intentions gone bad? Or perhaps a story of NIMBYism run amok to throttle progress, development and future opportunity for future generations?

    The Tocks Island Dam Project had been under consideration even before the 1955 flood, which caused several deaths and immeasurable damage to the Delaware River basin. In 1965 a proposal was made to Congress for the construction of the dam. The Tocks Island National Recreation Area was to be established around the lake, which would offer recreation activities such as hunting, hiking, fishing, and boating. In addition to flood control and recreation, the dam would be used to generate hydroelectric power and to supply water to the cities of New York and Philadelphia.

    There was much local opposition to the project. My sister and brother-in-law have been locals for over 40 years and I can tell you, it’s still a touchy subject. The dam was disapproved by a majority vote of the Delaware River Basin Commission in 1975. With the United States still funding the Vietnam War, financial considerations came to the fore. Also, the geology was questionable for what would have been the largest dam project east of the Mississippi River.

    In 1992, the project was reviewed again and rejected with the provision that it would be revisited ten years later. In 2002, after extensive research, the Tocks Island Dam Project was officially de-authorized. But the heartache of dislocation remains.

    What are the lessons of the Tocks Island Dam?

    Well, if we apply Beggs’ qualifications, we find that the project’s benefits did not outweigh its social, political and economic costs. It would have been nice to know this before all that land was acquired, causing those homes, farms and businesses to be condemned and abandoned by force. Would the dam have prevented the recent damaging floods in New Jersey and Pennsylvania? No, the recent floods were off the Passaic River, not the Delaware. Have New York and Philadelphia experienced major water and/or electricity shortages in the past 40 years that the dam would have ameliorated? Not apparently.

    So we are left with this: even with highest purposes, best intentions and smartest people, government tends to get things wrong. It is not just the law of unintended consequences, but the law of government efforts having the opposite effect of those intended.

    What ever happened to Reinventing Government?

    In 1992 the concerns over government debt, deficits and unfunded liabilities were national issues (sad, ironic and maddening, isn’t it?). So strong were these concerns that they drove a Presidential candidate, Ross Perot, to the largest vote ever received (nominally and percentage-wise) by a national third-party candidate since the Bull Moose Party of Teddy Roosevelt. After Bill Clinton won that election – largely because of the votes Perot took away from George Bush – the newly-elected President would famously say, “The era of big government is over.” Oh, would that it were so.

    That same year saw the publication of a book by David Osborne and Ted Gabler, Reinventing Government: How the Entrepreneurial Spirit is Transforming the Public Sector. Oh, would that it were so. The most compelling concepts in that book (to me) were the privatization and contracting-out of government services – the transformation of government from the entity that provides services to the entity that makes sure needed services are provided.

    What happened? The concept of reinventing government is still alive, at least on the local and state levels; David Osborne is still fighting the good fight with the Public Strategies Group, but as he writes, “Reinventing public institutions is Herculean work.” And at the federal level we have had orgies of spending, debt and deficits.

    Of course, we still need to do big things: Keystone pipeline, anyone? How ironic the opposition to building big things comes from the political left, the greens. In contrast, big Labor generally supports infrastructure projects, but not universally and often with prohibitively expensive terms. One big advantage that FDR enjoyed – something rarely cited by progressives – was the lack of public employee unions.

    Meanwhile, a whole generation of underemployed blue collar youth is coming up, with few prospects and little of the can-do ethic that once propelled us to do big things. The President recently bemoaned this too – citing the Hoover Dam and Golden Gate Bridge. What he does not realize is that, more times than not, big government is now more of a hindrance to, than an agent of, needed and desired change.

    Dr. Roger Selbert is a trend analyst, researcher, writer and speaker. Growth Strategies is his newsletter on economic, social and demographic trends. Roger is economic analyst, North American representative and Principal for the US Consumer Demand Index, a monthly survey of American households’ buying intentions.

    Dingmans Bridge photo by Charlie Anzman via Flickr.

  • Women Ascendent: Where Females Are Rising The Fastest

    You can find the future of the world’s women not in Scandinavia or the U.S., but among the entrepreneurs who line the streets of Mumbai, Manila and Sao Paulo. Selling everything from mangoes to home-made blouses, these women, usually considered the very bottom of their home country’s employment barrel, represent the cutting-edge of progress for women in the 21st century.

    This marks a departure from past decades, when the advancement of women was visible almost solely in the wealthiest of countries. Surveys of female achievements have consistently singled out just a sliver of the globe, but increasingly, women are making the greatest strides elsewhere — in the rapidly growing developing world.

    Women in these countries are newly empowered by remarkable gains in political representation, legal rights and, especially, education. But more important, they are rising in the 21st century’s key economic strata: as business owners.

    For our analysis of the countries where women are rising the fastest, we looked at three factors: education, politics and entrepreneurship. We studied the United Nations’ demographics on post-secondary education (current and historical) and on political participation. To assess the business environment, we examined statistics from Global Entrepreneurship Monitor on nascent entrepreneurship and the World Bank and World Economic Forum on gaps between male and female business ownership. We searched the global press, pored through research publications by financial institutions and NGOs, and visited some locations. Finally, we crunched the numbers, information and observations and came up with our own impressions.

    Our top picks for places where women were rising the fastest — as opposed to merely surfing an already advantageous position — were found largely in the developing world — particularly in Brazil, India, Vietnam and the Philippines.

    A vital benchmark of this progress is the large role that women play in business ownership in these places. In many developing countries the rate of female entrepreneurship surpasses that in the G-7 nations. Many become entrepreneurs by necessity: Often locked out of the of the best opportunities in the job market by cultural and sometimes legal barriers, women are starting businesses at rapid rates in Latin America, India, East Asia and even Africa and Central Europe.

    In contrast, female entrepreneurship rates aren’t rising in many of the most advanced countries. Despite talk of the feminization of advanced societies, the percentages of women-owned businesses are inching downward in the U.S., and they are stagnant in the E.U. To some extent, this slowdown reflects greatly expanded opportunities for a new generation of women, considerably more educated than their mothers, in both the mid-level job market and the highest corporate tiers. These changes have been accelerated by shifts in the nature of employment that favor “brains” and collaboration over traditional male advantages in “brawn” and single-minded ambition.

    The Rise of the Female Entrepreneur

    Latin America is a premiere example of the rise of female business ownership. Both Brazil and Costa Rica rank in the World Bank’s top 10 countries for female ownership participation. The region also stands out for its small gender gap in new businesses: Women are now starting businesses as often men, and sometimes succeeding. Among the top countries with the greatest equality between women and men in establishing new ventures, Global Entrepreneurship Monitor notes that many Latin American countries, especially Brazil and Peru, now have a gap that is smaller than in the U.S. or anywhere in Europe.

    The same trend is emerging in Asia. In the more tropical countries, where women are impeded by unpaid family work combined with a notoriously grim labor picture, many own marginal businesses. South Asia’s bright spot for female entrepreneurs is India, with its highly developed support structure of national-level and local organizations for women’s SMEs and early participation in micro-finance. And female entrepreneurs are thriving in Vietnam, the Philippines and Thailand as well. For example, 24% of Vietnam’s 100,000-plus incorporated enterprises are owned by women; 27% of its 3 million household businesses are also female-owned. The rate of female private business owners in China, at 11 out of 100, is also higher than the world average of 7%. Surprisingly, famously chauvinist Japan is the only country in the world where the percentage of women who own their own businesses, 13%, edges out the percentage of males who do.

    Eurasia and Central Eastern Europe have also experienced a surge in female entrepreneurial activity. As in Latin America, self-employment has often come about as a result of national tragedy and political dislocation — in this case, the economic disruption and male migration abroad that followed the fall of the Soviet Union.

    Data on women in African economies are sparse, with the positive news focused on Lesotho, ranked No. 1 and No. 2 by the World Economic forum for economic opportunity in the last two years, and, unsurprisingly, South Africa, the continent’s most developed nation, considered Africa’s best economic climate for women’s by The Economist Intelligence Unit. Ghana has also drawn attention, with a World Food Program-initiated salt start-up. Micro-financiers, development NGOs and the United Nations have assisted small-scale women entrepreneurs in African nations like Kenya in establishing micro industries such as processing soap, fruit and maize.

    Educated Women on the Front Lines

    Across the globe female gains in education have skyrocketed. In tertiary education — which includes post-high school vocational schools as well as colleges and universities — females now outnumber males in one-third of developing countries, including Brazil, Bangladesh, Honduras, Lesotho, Malaysia, Mongolia and South Africa. Worldwide, between 1970 and 2008, the number of female tertiary students expanded by 70 million, compared with 60 million for males.

    The Legal Right to Wages and Assets

    Along with economic and education gains, women in developing countries are making substantial political gains. Part of a broader movement throughout the developing world toward political empowerment, women are gaining increased access to capital and property ownership, and greater national attentiveness to issues specific to women, such as domestic violence and female health.

    One indication: The percentage of parliamentary seats held by women globally has risen considerably during the first decade of this century, and is now about 18%. As in entrepreneurship and education, the most dramatic gains now are not in the high-income countries but in the developing world, where sizable inroads to the very top tiers of government have also been made.

    Latin America has become the most visible emblem of rising female political power sweeping across a region. When Brazil elected Dilma Rousseff as president in 2010, it joined its neighbors Argentina, Costa Rica and, until recently, Chile in having a female head of state. Latin America, too, is a world leader for female political representation, with 30%-plus parliamentary representation in Costa Rica, Argentina, Ecuador and Bolivia.

    Yet some of the most astonishing changes in representation have taken place in Africa, where Rwanda now has the world’s highest percentage of women in parliament and cabinet seats. Each of Rwanda’s parliamentary houses comprises 50% or more women. South Africa, Angola, Mozambique, Uganda and Tanzania also boast above-average rates.

    The destiny of the global economy has shifted toward countries that once trailed behind but are now rapidly rising. In the same way, the trajectory of women’s progress — and the future of the ascendancy of women — has shifted from the developed to the developing world.

    This piece originally appeared at Forbes.com.

    Joel Kotkin is executive editor of NewGeography.com and is a distinguished presidential fellow in urban futures at Chapman University, and an adjunct fellow of the Legatum Institute in London. He is author of The City: A Global History. His newest book is The Next Hundred Million: America in 2050, released in February, 2010.

    Zina Klapper is a Los Angeles-based journalist, and Deputy Editor of newgeography.com.

    Photo by flickr user Dawn Danby

  • Domestic Migration: Returning to Normalcy?

    Even as the troubled economy has continued to hobble along, there may be hints that the domestic migration patterns from before the Great Financial Crisis could be returning at least in some states. This is evident in the recent national interstate migration data from the American Community Survey. This analysis reviews annual interstate migration data from the beginning of the Great Financial Crisis to 2010, with broad comparisons to earlier (2001-2006) data from the Census Bureau population estimates program (Note 1). The big stories are that Florida and Arizona show signs of recovery, the trend has reverted to more negative in California and the steady states are North Carolina (a big gainer of domestic migrants) and Illinois (a big loser of domestic migrants).

    Moreover, none of the states that have been perennial domestic migration losers moved into the top ten between 2007 and 2010, even as fast growing states such as Florida and Arizona were hard hit by the real estate bubble and saw migration rates decline. Notably, however, Pennsylvania, which had sustained modest domestic migration losses, rose to the number 8 position in 2010 (Table 1).

    Table
    Top Domestic Migration States: 2001-2010
      Year and Source
      2001-6 2007-9 2010
    Rank Census Estimates ACS ACS
    1 Florida Texas Texas
    2 Arizona North Carolina North Carolina
    3 Texas Arizona Florida
    4 North Carolina South Carolina Arizona
    5 Georgia Georgia Colorado
    6 Nevada Oklahoma South Carolina
    7 South Carolina Washington Virginia
    8 Tennessee Colorado Pennsylvania
    9 Virginia Virginia Washington
    10 Washington Utah Kentucky


    The Largest Gaining States:Some of the states with the largest gains seem to be returning toward their previous domestic migration volumes.

    Florida: For the last few years, the big news in interstate domestic migration has been in Florida. This state, which has grown by more than 5.5 times since 1950, had been the domestic migration leader for some years. However, as one of the four "ground zero" states (along with California, Arizona and Nevada) for its huge house price losses, Florida bottomed out at a loss of 38,000 domestic migrants, falling to 44th in 2007. The state lost another 16,000 interstate migrants in 2008. These were the first domestic migration loss since the 1940s for Florida.

    However, in 2009, Florida returned to growth, adding 21,000 domestic migrants. An even stronger recovery occurred in 2010, with a net 55,000 domestic migrants. This remains well below the peak of 265,000 recorded in Census estimate figures in 2004 and 2005. Nonetheless, Florida ranked third in domestic migration in 2010, trailing North Carolina by only 1000 as well as number one Texas. Part of Florida’s success is likely related to its housing affordability, which has been restored in all of the state’s major metropolitan areas with the exception of Miami. The recent repeal of Florida’s land rationing "smart growth" law should position the state for even more affordable housing and net domestic migration gains.

    Arizona: Arizona is another state that was hit hard by the housing bubble. Much has been written on Arizona’s recent hard times. Yet, unlike Florida, Arizona did not experience domestic migration losses in any year of the past decade. The state has routinely been among the top five in domestic migration, even during the darkest years of the Great Financial Crisis. Like the nation in general, Arizona reached its lowest net domestic migration figure in 2009 at 29,000, but recovered to 46,000 in 2010. Interstate domestic migration remains somewhat below the early 2000s figures, but is trending upwards.

    Texas: Texas took the interstate domestic migration crown away from Florida in 2006 at has been the nation’s leader since that time. According to Census estimates, Texas peaked in 2006 at 233,000 net domestic migrants. This was an artificially high peak, location by the outflow of people from Louisiana who were driven out by Hurricanes Katrina and Rita and the failure of responsible governments to properly maintain flood control infrastructure. From 2007 to 2009, Texas was also aided by its liberal land use policies that helped it avoid the real estate bubble, retaining lower house prices that made it more attractive to domestic migrants. Texas added more than 125,000 domestic migrants annually. However in 2010, net domestic migration dropped to 75,000. Nonetheless, even Texas indicates a return toward normalcy. In the first five years of the decade, Census data placed net domestic migration in Texas at only 40,000, well short of the 2010 figure.

    North Carolina: Through good times and bad, North Carolina was has been a consistent performer among the larger gainers. North Carolina ranked fourth in net domestic migration from 2001 through 2006, according to Census data. Then the state moved up to number two in every year from 2007 to 2010.   In 2010 domestic migration was 56,000, slightly below the 2001 to 2006 Census reported average of approximately 63,000. Like Texas, North Carolina largely escaped the real estate bubble, with house prices rising far less severely than on the West Coast, the Northeast, Florida, Nevada and Arizona, which could be a principal reason for its consistent domestic migration gains.

    The Largest Losing States:There were also indications that people continue to be among the most significant exports of California and New York, which wrestled for the bottom position for the entire decade. While The New York Times characterized the 2008 to 2010 domestic outmigration from California and New York as having slowed to a "relative trickle," the ACS data indicates that the spigot is still on.

    New York:New York experienced a net loss of 94,000 domestic migrants in 2010, a figure nearly equal to the population of its state capital, Albany. Despite this large loss, New York is doing better than earlier in the decade, when domestic outmigration averaged more than 200,000 from 2001 to 2006.

    California: California, however, may have taken a turn to the south. After having experienced the largest losses in the nation in 2007 (175,000), net domestic outmigration fell to 87,000 in 2009 and California relinquished the bottom position to New York. However, in 2010, California’s net domestic outmigration rose to 129,000 and the state recovered its former bottom ranking.

    Illinois: Illinois has been the most consistent performer among the largest losing states. According to Census data, domestic migration losses averaged 77,000 from 2001 to 2006. ACS data indicates similar losses, averaging 73,000 from 2007 to 2010.

    Normalcy Again? It is premature to suggest any long-term judgments on these early data. However, it would not be surprising to see the states with the highest costs of living (driven by high housing costs) and the least friendly business climates to lose domestic migrants to states with lower costs of living and more friendly business environments. For example, the fact that median house prices today in Phoenix are more affordable compared to the large metropolitan areas of coastal California than they were at the peak of the housing bubble may be part of what drove Arizona’s improved net domestic migration in 2010.

    —-

    Note 1: The Census Bureau provides annual estimates of domestic migration, however does not do so in census years, such as 2010, which is why this analysis uses American Community Survey data. For the purposes of data compatibility, 2007, 2008, 2009 and 2010 data from the American Community Survey (also conducted by the Census Bureau) is the principal source for recent trends. This analysis is different from the one by Kenneth M. Johnson of the University of New Hampshire Carey Institute, which detailed domestic migration results from the three year American Community Survey (2008-2010), and which was covered by The New York Times.

    Note 2: Leith van Onselen has recently described developments in the Phoenix housing market (in How Phoenix Boomed and Busted) during the last decade.

    Wendell Cox is a Visiting Professor, Conservatoire National des Arts et Metiers, Paris and the author of “War on the Dream: How Anti-Sprawl Policy Threatens the Quality of Life

    Photograph: Cape Coral, Florida (by author)